

1 Introduction
Regulation is one of the hardest concepts to grasp in the policy world, primarily because of its vast breadth and depth. Regulatory experts have not settled on a single way to quantify the body of regulations on the books at any given point in time. Nonetheless, as of 3 January 2020, the Code of Federal Regulations (CFRs) contains over 103 million words of rules promulgated by more than 100 agencies, which would take a full-time worker reading at 250 words per minute more than 3 years to read.Footnote 1
Federal regulation is often misunderstood by both the public and even the policymakers who oversee it. The misunderstandings can be summarized as three mutually reinforcing misconceptions.
-
1) The first misconception is that the majority of new regulations address environmental concerns. Annual reports by the Office of Management and Budget (OMB) find that the majority of the benefits, and majority of the costs, of major Federal rules since 2006 came from a single agency: the Environmental Protection Agency (EPA).Footnote 2 Massachusetts Senator Warren explains how “regulations bring higher costs, but regulation is also about making sure that someone does not get to beat out the competition because they are dumping filth in the river or spewing poisons in the air” (Foran and National Journal, Reference Foran2015). Economics Nobel Laureate Paul Krugman puts it more bluntly, “if you eat meat – or, for that matter, drink water or breathe air – there’s a real sense in which Donald Trump is trying to kill you” with his deregulatory agenda (Krugman, Reference Krugman2019). However, we find that only a small fraction of new regulations is environmental. Economic and social regulations are far more common. Our data suggest that the costs of health regulation have exceeded the costs of environmental regulation over the past couple of decades, and this observation does not count the costs of regulations in 2020 intended to combat the coronavirus pandemic.
-
2) The second misconception is that regulators offer reasonable justifications and quantitative evidence for the majority of regulations. Professor and former Administrator of the Office of Information and Regulatory Affairs (OIRA) Cass Sunstein declared a “triumph of the technocrats” in a “cost-benefit revolution [that] requires regulators to demonstrate a genuine need for government action … weaken[ing] the hold of interest groups, popular opinion, anecdotes, and intuitions.”Footnote 3 Similarly, the 2012 Economic Report of the President describes a regulatory process that includes “careful analysis of costs and benefits, both before and after regulatory action, including an informed public discussion” (White House, 2012). Despite executive orders and OMB guidance requiring cost-benefit analysis (CBA) of new regulations, we find that most regulations lack reasonable justifications and quantitative assessments.
-
3) The third misconception is that the bulk of the costs imposed by regulations on households and businesses are clerical. Hopkins (Reference Hopkins1998) and Crain (Reference Crain2005) find that the majority of the cost of nonenvironmental regulations is paperwork.Footnote 4 President Clinton emphasized the need to “conquer a mountain of paperwork that is crushing our people and wasting a lot of time” (Office of Management and Budget, 1999). Although many regulations create nontrivial paperwork and clerical costs, we find that the majority of regulatory costs are economic distortions.
Throughout this paper, we use various sources to demonstrate both the existence of our three misconceptions and prove them as such. Given the scope of the regulatory state, we cannot review all regulations. However, we use novel datasets, specific regulatory examples, government studies, and scholarly research that spans multiple decades. While it may be relatively simple to find a quality regulatory impact analysis (RIA) that refutes some of our points, we believe that it is far from trivial to provide equal evidence disproving the general pattern of our findings.Footnote 5
2 Regulatory background
There is some debate among experts regarding the definition of federal regulatory agencies as well as the definition of regulation. For the purposes of this study, we first adopt a working definition of a regulation, which we define as a government intervention that requires or prohibits some action or activity. Although this study generally focuses on regulations issued by federal agencies through the informal rulemaking process or as guidance documents, we discuss in this section how federal regulations as defined here can originate in all three branches of government.Footnote 6
2.1 Congress, federal agencies, and the judiciary
Congress can write and pass bills that apply to all Americans if signed into law by the president or passed over a veto. Congress can delegate authority to regulatory agencies, which include executive agencies and independent agencies such as the Federal Communications Commission. Congress can delegate their authority either explicitly, as with the House Medicare for All bills directing that “the Secretary [of Health and Human Services] shall pay, from amounts made available for capital expenditures … such sums determined appropriate by the Secretary to providers” (Medicare for All Act of 2019, 2019), or implicitly by writing bills with vague terms that executive branch agencies or federal courts must interpret to make operational.
Take the 1963 Clean Air Act, which, as subsequently amended by Congress, requires the EPA to establish standards “applicable to the emission of any air pollutant” from motor vehicles (Clean Air Act of 1963, 2013). The act itself does not say whether the greenhouse gases (such as carbon dioxide) causing climate change are an “air pollutant.” The EPA ultimately decided that they are. The Supreme Court affirmed the EPA’s decision when it concluded that “greenhouse gases fit well within the Clean Air Act’s capacious definition of ‘air pollutant’ (Massachusetts v. EPA, 2007).”
Most regulations are created when regulatory agencies publish final rules that explain changes to the text of existing regulations. As such, final rules can be conceived of as regulatory “flows.” Federal agencies publish new rules in the Federal Register and indicate the parts of the CFRs to be changed. Rules can add text to the CFR, revise it, or remove it.Footnote 7 The CFR is therefore a stock of regulation.Footnote 8 As published in the Federal Register, new rules also include agency motivation, budgetary and economic impact analysis, and a discussion of public comments that are not part of the CFR.
Finally, federal regulation sometimes originates in federal courts on a case-by-case basis, as with some regulation of competition. Case-specific regulations can become a permanent part of the regulatory landscape, especially if federal courts affirm them.Footnote 9 As previously mentioned, this paper will primarily focus on regulations issued by federal regulatory agencies.
2.2 Data on the stocks and flows of regulations
To the extent that the federal government provides summary measures of the flow of regulation, these measures are incomplete. The Government Accountability Office (GAO) tracks major rules issued by all federal agencies but not all rules.Footnote 10 OIRA’s annual reports to Congress on the costs and benefits of regulations focus on major rules promulgated by executive agencies – although they also discuss major rules issued by independent agencies in less detail.Footnote 11 While these reports aggregate the number of regulations published, they exclude agency guidance documents, statutes, or court decisions that are not reflected in agency rulemaking. Moreover, the quantitative information produced by federal agencies from regulatory actions is narrow. For example, as discussed below, most new rules are not accompanied by quantitative estimates of benefits and costs.
The contribution of this paper is to provide both “top-down” and “bottom-up” estimates of the characteristics of Federal regulation. The former comes from RegData’s large sample of Federal regulations. RegData’s top-down approach has several advantages as it provides repeated pictures of the stock of regulation that is comprehensive enough to include every Federal agency, both executive and independent. The latter is based on a sample of the flow of regulation and deregulation – including final rules, public laws, and agency guidance – that is small enough to conduct a rigorous benefit-cost analysis of each regulation. The sample is deliberately skewed toward the most economically important regulations so that the sample total and other statistics would be informative about the corresponding importance-weighted statistics of the universe of new regulations. We also include studies regarding the quality of regulatory analysis by Jerry Ellig and Clyde Wayne Crews that use larger, multiyear samples.
For the purposes of this paper, regulations outside of our sample – likely those not deemed major or significant – should not bias our conclusions. For Misconception 1, where nonsignificant rules might matter, they are captured by RegData. For Misconception 2, nonsignificant rules can be ignored because there is no reason to believe that regulations not deemed significant are receiving a more robust benefit-cost analysis than the significant regulations we examine. With regard to Misconception 3, excluding nonsignificant regulations only reduces the relative regulatory burden compared to paperwork costs, thereby strengthening our case. Because our two approaches are so different and the sources of the data so broad, the information provided by implementing them together exceeds what we learn from them separately and makes a compelling case that provides evidence for our three misconceptions.
2.3 RegData
Recent years have witnessed the advent of independent academic research projects that attempt to fill the data gap about regulation. The most prominent of these is the RegData Project. Launched in 2012 with a working paper by Omar Al-Ubaydli and Patrick A. McLaughlin, RegData is both a methodology and a database. The RegData methodology uses text analysis and machine-learning algorithms to parse and quantify the CFR. Several dimensions, or features, of federal and state regulations, have been quantified over the course of the ongoing RegData Project, including the number of regulatory restrictions contained in regulations and the relevance of those restrictions to the various sectors and industries that make up the U.S. economy. The resulting data have been made freely available to the public at QuantGov.org (McLaughlin & Sherouse, Reference McLaughlin and Sherouse2018).
The two primary metrics in the RegData database are restrictions and industry relevance. Restrictions is a cardinal proxy of the number of regulatory restrictions contained in regulatory text, devised by counting select words and phrases that are typically used in legal language to create binding obligations or prohibitions.Footnote 12 The database also includes a secondary measure of volume – the total word counts – as an alternative measure of the volume of regulation over time.
The second key variable in RegData is industry relevance, representing estimates of the relevance of the text of a regulation to the different sectors and industries in the economy. RegData utilizes the industry definitions in the North American Industry Classification System (NAICS), which categorizes all economic activity into different industries. RegData uses machine-learning algorithms to assess the probability that a unit of regulatory text targets a specific NAICS industry. This assessment requires two steps. First, the program “learns” what words, phrases, and other features can best identify when a unit of text is relevant to a specific industry by analyzing our compilation of training documents. Training documents are documents that are used to “train” a machine-learning algorithm. In the case of training an algorithm to classify regulatory text into different industries, training documents are documents that are known to be relevant to one or more explicitly named industries. Over the course of the RegData project, we have gathered tens of thousands of such training documents from publications in the Federal Register that name the NAICS codes affected by rulemakings.
Second, some simple calculations permit the combination of restrictions and industry relevance into a single variable, industry restrictions, which is an estimate of the number of restrictions that are relevant to a particular industry or set of industries in one or more regulations.Footnote 13 The advent of an industry-specific metric of regulation that is comprehensive (i.e., inclusive of all federal regulations that are in effect in each year), replicable, and transparent has created paths to performing economic research on regulation in ways that were previously infeasible. All of these metrics – restrictions, industry relevance, and industry restrictions – can be cross-tabulated with a regulatory agency because RegData encodes the CFR’s attribution (in its various tables of contents) of each part of the CFR with an agency.Footnote 14
2.4 A sample selected based on public attention
Not all rules are equally important. Nor is each occurrence of “shall” or “must” in the CFR equally important. Ideally, we could use quantitative estimates of importance provided by the regulating agencies, but, as discussed in connection with the second misconception, quantitative estimates are often absent or incomplete regarding economically important regulations. Instead, we use the sample of 21 post-2016 deregulations selected by the CEA based on attention from the public.Footnote 15 CEA conducted its own CBA on the 21 actions.
To identify regulations that garnered attention from Congress, CEA selected from federal laws passed in 2017 and 2018, including 16 public laws that overturned rules or guidance (from both executive agencies and independent agencies) pursuant to the CRA. To capture other regulations of interest to the public, CEA selected the top-commented rules in the fiscal year (FY) 2018 and 2019 regulatory budgets (executive agencies), and rules by independent agencies as reported in the Federal Register. Because the 16 CRA-overturned rules also received public comments when finalized by their agencies, CEA also selected among them based on comments reported in the Federal Register.Footnote 16 Additionally, CEA reviewed agency guidance documents that potentially had an important effect on the regulated industry. Although regulations were finalized during the years 2017–2019, only deregulations remain after applying the public-attention filter because the regulatory actions in the regulatory budget and promulgated by independent agencies received few public comments.Footnote 17 We return to CEA’s selection procedure as we discuss our results.
The 21 regulatory actions in the CEA sample removed 21 regulations that were put in place between 2000 and 2016. Our interest in the CEA sample is not to obtain a “representative sample” of the thousands of federal regulations, the vast majority of which receive no public comments and likely have costs and benefits that are dwarfed by the truly significant rules. Rather, we are interested in the sum total of regulatory costs to which the largest regulations disproportionally contribute. Moreover, having a sample of “only” 21 facilitates a discussion of specific regulations while at the same time capturing an important part of the totality of regulation.
CEA reports cost savings from removing the 21 regulations, whereas for our purposes, we want the costs of imposing the regulations in the first place. In principle, those estimates could be taken from the issuing agencies, but that would involve assuming away the second misconception rather than testing it. Instead, we take CEA’s deregulatory cost savings as an estimate of the costs created by their precursor regulations. In principle, these two could be significantly different because the economy changed, the deregulatory action differs in detail, or scope from the original regulatory action, sunk costs, or non-compliance may have lowered actual regulatory costs below prospective estimates. However, as explained further in what follows, CEA’s estimates for these 21 primarily differ by considering opportunity costs, by applying the method of revealed preference, or by having any cost estimate.
We bolster CEA’s sample by using other studies that include a larger flow of regulations to get a comprehensive view of the regulatory state. These additional studies include Jerry Ellig’s “regulatory report cards” and analysis by the Competitive Enterprise Institute’s Clyde Wayne Crews (Crews, Reference Crews2015; Ellig, Reference Ellig2016). We also use the Federal regulatory budget itself, which is a fiscal-year sample of rules (dating back to 2017) from executive agencies that include rule-specific cost estimates.Footnote 18 Finally, we examine OIRA’s Report to Congress on the Benefits and Costs of Federal Regulations to increase our sample size. We recognize that there are other regulations than those we review. However, we believe that our sample, which includes regulations from all subsets – major, significant, economically significant, and not significant – and analysis from multiple decades, is large enough to identify underlying patterns.
3 Misconception 1: most new regulations are environmental
The first misconception about regulation is that most new regulations address environmental concerns. This misunderstanding is important because it implicitly equates deregulation with pollution and further skews the public’s perception of regulation. For example, in 2019, the New York Times tagged 17 editorials as “deregulation” and commented on a specific regulation or deregulation or on the nature of deregulation generally. Of the 17 tagged deregulation, more than half (9) of them mentioned the environment.Footnote 19 A similar impression that environmental regulations generate the bulk of new regulations comes from the studies of regulations in place in the 1980s, which came at a unique time after simultaneous waves of economic deregulation and environmental regulation. At the time, the Department of Health and Human Services (HHS) was in its infancy: before the era of Medicaid expansions, the creation of Medicare Parts C and D, and “Obamacare” plans. Noting some of this historical context, Hahn and Hird (Reference Hahn and Hird1990) find that the 1988 costs of federal environmental regulation were about $65 billion compared with about $70 billion for economic and “safety” regulations.Footnote 20
The actual regulatory activity in 2019, and for many years before, is quite different. The Regulators’ Budget – a series of publications that offers an annual analysis of the U.S. fiscal budget allocated to regulatory agencies – divides agencies up into eight categories: consumer safety and health; homeland security; transportation; workplace; environment and energy; finance and banking; industry-specific; and general business.Footnote 21 In the FY 2016, regulatory agencies in the environment and energy category were allocated about 13.2 % of budget outlays. While this is informative, budgetary outlays reflect agency needs beyond mere rulemaking – e.g., the bulk of the Transportation Security Administration’s budget is for personnel who perform airport screening. However, we can mimic the approach used in the Regulators’ Budget by categorizing some regulatory agencies into an environment and energy category and examine several metrics of regulation that largely evade conflation with the other activities of regulatory agencies.
We create a panel of environmental regulatory agencies that includes those listed in the Regulators’ Budget in the environment and energy category, plus two additional agencies not included in the Regulators’ Budget’s list. Our set of environmental agencies is thus more comprehensive and arguably includes much more regulation than strictly environmental regulation (e.g., some energy regulations intend to improve financial outcomes for consumers, rather than environmental outcomes). Our set of environmental regulators includes: Council on Environmental Quality; Department of Agriculture’s Forestry Service; Army Corps of Engineers; six different offices of the Department of the Interior; Department of Energy; Nuclear Regulatory Commission; EPA; and the Department of Commerce’s National Oceanic and Atmospheric Administration.
To empirically assess whether the majority of the recent flow of regulations is environmental, we begin by examining the volume of significant rulemaking. Only 14 % of all economically significant federal rules issued between 2000 and 2016 came from the two major environmental agencies: the EPA and the Department of Interior (DOI).Footnote 22 These results are shown in the top panel of Table 1.
Three methods of quantifying new regulation, 2000–2016.

Note: Ninety-eight percent of the “count or amount” of environmental regulations in the CEA sample is from a single rule.
Abbreviation: HHS, Health and Human Services.
RegData statistics also confirm the small share of environmental regulation. Importantly, RegData captures all rules as opposed to only those designated as economically significant. Table 1 shows how nearly two-thirds of the 2000–2016 increase in restrictive words (139,000 out of 221,000) were made by agencies with primarily nonenvironmental missions.Footnote 23 Although not shown in the table, the stock of restrictive words as of 2017 is also illustrative: it was about 1.1 million overall and about 269,000 for the environmental agencies. In other words, 75 % of the stock of regulation is nonenvironmental.
HHS is the single largest promulgator of economically significant regulations between 2000 and 2016, outpacing EPA by more than three to one. While contributing many words, HHS contributes less to the increase in restrictive words. A potential reason for its large contribution to economically significant rules may be the large size of HHS (its annual budget is more than $1 trillion), given that one of the thresholds for economic significance is an absolute dollar amount. From this perspective, the number of rules may be a better indicator for comparing regulatory costs across agencies than the number of restrictive words. A second potential reason is that many important HHS rules (particularly those from the Centers for Medicare and Medicaid Services [CMS]) have a duration of only 1 year, and therefore it issues multiple rules on the same topic, with new rules replacing old (hence, comparatively little increase in the CFR stock of restrictive words).Footnote 24 For interagency comparisons, perhaps this nuance results in exaggerating the importance of HHS. On the other hand, the fact that HHS does rulemaking so frequently may indicate a high level of detail and large scope with which it regulates.
Future interagency regulatory comparisons will include the period of the COVID-19 pandemic, during which time HHS regulators were considering everything from rules for employers to approvals of new drugs and therapies. We expect that the updated comparisons will show that the economic impact of new federal health regulations far exceeds that of new environmental regulations.
CEA’s sample also supports the claim that environmental regulations may receive outsized public attention despite their relative importance. CEA’s sample is partly drawn from more than 200 rules issued by executive agencies and included in the FY 2018 regulatory budget, which is already selected based on economic importance. Among the 10 rules with at least 100 comments, only one was environmental.Footnote 25 The number of comments received on that one rule, known as the “Waste Prevention Rule” or “Venting and Flaring Rule” (regulatory identification number [RIN] 1004-AE53), was wildly disproportionate to its costs and benefits. Because the regulation applies only to oil and gas operations on federal and tribal lands, whereas at least 80 % of oil and gas operations are on private lands, the annualized cost savings from the deregulation were only about $0.3 billion as compared with the CEA’s estimate of an average of $4 billion for the nine nonenvironmental rules. In other words, less than 1 % of the cost savings from deregulation in that year’s budget came from environmental deregulation.
More broadly, when CEA examined the 21 selected regulations implemented in the 2000–2016 period, the aggregate annual regulatory costs were estimated to be $276 billion (see Table 1). Seventy-nine percent of these costs are nonenvironmental. In contrast, HHS regulations alone account for a third of the regulatory costs. This interagency distribution of regulatory costs is remarkably similar to the distribution obtained merely by counting economically significant rules (top panel of Table 1). In other words, nonenvironmental rules far exceed environmental rules both in number, which the top panel measures, and total cost, which the CEA sample is designed to estimate.
To be more concrete, it helps to reflect on some of the deregulations from the CEA sample. A 2018 rule letting consumers keep their short-term health insurance plans (pejoratively known as “junk” plans by those who disapprove of the plan designs) is an economic deregulation and does not pollute air or water. The environment is not dirtier because the arbitration agreements are permitted in financial products or price controls are removed from business-to-business transactions in the telecommunications industry. Removing regulatory barriers from the franchise way of doing business, as the Department of Labor and the National Labor Relations Board did in 2019, does not pollute air or water. Each of these examples involves regulatory costs in the billions of dollars per year.Footnote 26 Finally, academic interest in regulations might also be perpetuating the idea that most new regulations are environmental as academic interest is often allocated differently than in public comments or pages in the CFR. Hahn and Dudley’s (Reference Hahn and Dudley2007) assessment of the quality of government benefit-cost analysis selects only regulations from the EPA. They wanted to “focus on a single agency to minimize variations in quality across agencies,” adding that “many agencies have not written enough RIAs to form a significant sample for each administration.” Harrington et al. (Reference Harrington, Morgenstern and Nelson2000) selected regulations requiring “the existence of an ex ante cost estimate developed by a regulatory agency with substantial expertise in cost analysis, and a relatively detailed ex post estimate, typically (but not always) prepared by an academic or independent analyst” and ended up with a 21-regulation federal sample of which 13 were from EPA. The variation in analysis quality and academic interest across agencies, especially as cuts across environmental versus nonenvironmental domains, is an example of the interaction between Misconceptions 1 and 2. Attempts to compare regulatory costs and benefits across agencies will likely suffer from the omission of regulations where costs and benefits were not provided by the regulator or in academic studies.
4 Misconception 2: regulators offer reasonable justifications and quantitative evidence for most regulations
The second misconception is that federal regulators offer reasonable justifications and quantitative evidence for most regulations. As regulatory expert Jerry Ellig puts it, “To know whether a regulation solves a significant problem at a reasonable cost, the regulatory agency needs to know whether a significant problem exists, the root cause of the problem, alternative solutions that address the root cause, the effectiveness of each alternative in solving the problem, the benefits to society of each alternative, and the costs to society of each alternative. This is the information that a complete RIA provides” (Ellig, Reference Ellig2016, p. 1).Footnote 27
Unfortunately, except for environmental regulations, we find that most regulations do not provide reasonable justifications or quantitative evidence. While there is no formal rule stating that rules deemed nonsignificant should not receive RIA, in practice, federal agencies have generally taken this to be the case. For that reason, agencies have an incentive to get their rules classified (whether strategically or accidentally) as not “economically significant,” thereby exempting them from the more rigorous analytical requirements that accompany them. For a similar reason, agencies’ use of “guidance” allows federal agencies to circumvent many of the analytical procedures required under the rulemaking process.Footnote 28 Additionally, another subset of rules – roughly 20 a year – that escapes CBA requirements even when deemed economically significant is transfers.
Between these exemptions and practices, the vast majority of federal regulations avoid benefit-cost analysis. Clyde Wayne Crews’ study of the 53,838 federal rules finalized between 2001 and 2014 finds that only 246 of them (less than 1 %) quantified regulatory costs. Only 160 quantified benefits. A more recent analysis found that between 2007 and 2016, only 137 of the 36,255 final rules (0.4 %) had dollar estimates for both benefits and costs (Broughel, Reference Broughel2018).
OIRA’s annual reports to Congress on the benefits and costs of major regulations show a similar pattern – namely, that even a large percentage of major rules escape complete benefit-cost analysis. Table 2 summarizes the total number of major rules promulgated by executive agencies alongside the number of rules that included benefits estimates, cost estimates, both, or neither. Roughly 7 % of major regulations issued by executive agencies have neither quantified nor monetized benefits or costs, at least for the years 2008–2019. At the other end of the spectrum, approximately 24 % of major rules issued by executive agencies received quantification and monetization of both costs and benefits. The remainder included only a benefits estimate (3 %), only a costs estimate (18 %), or were classified as transfer rules, which have traditionally been treated with a different, and lower, standard by OIRA.
Major rules promulgated by executive agencies, by quantification and monetization.

Source: Office of Information and Regulatory Affairs; Author’s calculations.
4.1 Market failures and regulatory alternatives are not cited
When rules do have quantitative evidence, the quality of analysis rarely lives up to the standards set by the government (see Government Accountability Office, 1997, 1998; Hahn et al., Reference Hahn, Lutter and Viscusi2000; Hahn et al., Reference Hahn, Burnett, Chan, Mader and Moyle2001; Hahn & Litan, Reference Hahn and Litan2005; Hahn & Dudley, Reference Hahn and Dudley2007; Belcore & Ellig, Reference Belcore and Ellig2008; Fraas & Lutter, Reference Fraas and Lutter2011). While estimates of costs and benefits are certainly important elements of an RIA, several other parts of an RIA are arguably even more important. For example, before even considering benefits and costs, an RIA should assess whether a significant problem exists in the first place and evaluate alternative approaches to solving the problem – i.e., offer a reasonable justification for regulating. These aspects of RIAs are often ignored, as shown in the Mercatus Center at George Mason University’s Regulatory Report Card project.
This Regulatory Report Card project assessed the quality of RIAs accompanying 130 economically significant prescriptive regulations proposed between 2008 and 2013.Footnote 29 Jerry Ellig, the lead scholar on this project, reports that 48 % of these regulations were accompanied by “no significant evidence demonstrating the existence, size, or cause of the problem to be solved.” Just 22 % of the regulations were accompanied by “reasonably thorough evidence showing that a given regulation would likely achieve the desired outcome(s)” (Ellig, Reference Ellig2016).
Regulatory analysis often fails to provide evidence that a regulation will solve an actual problem or lacks specificity as to the principal cause of a problem (see McLaughlin et al., Reference McLaughlin, Ellig and Wilt2017). In 2011, e.g., the Securities and Exchange Commission (SEC) adopted a regulation that excludes the value of an investor’s primary residence when determining whether the individual meets the $1 million net worth requirement to be considered an “accredited investor” who can purchase securities that are not registered with the SEC. The agency also could have considered whether a net worth test is sufficient to protect investors from making bad investment decisions, or whether a financial sophistication test could achieve that objective more effectively (Ellig & Peirce, Reference Ellig and Peirce2014). The SEC conducted no such analyses, so it is unclear whether the regulation solves an actual problem or does so in the most effective way.
Without identifying the root cause and demonstrating a market failure, regulations can fail to target the principal cause of the problem. In 2015, the FDA finalized a regulation requiring firms that produce, process, pack, or handle animal food to have processes and procedures in place to ensure that animal food is as safe as human food (Food and Drug Administration, 2015b). The preliminary RIA, conducted while the FDA was developing the regulation, did not even attempt to estimate the benefits or identify their sources (Ellig & Williams, Reference Ellig and Williams2014). The final RIA estimated that the regulation would generate $10.1–$138.8 million in benefits annually by protecting humans and pets from contaminated food. The FDA presented no empirical evidence of benefits for livestock, relying instead on a survey of experts who offered their opinions on how effective the rule would be in preventing contamination of livestock feed (Food and Drug Administration, 2015a). The FDA failed to consider alternative approaches, especially considering the scant evidence.
4.2 Justifications often fail to meet circular A-4 standards
OMB Circular A-4 directs, “the mere possibility of poor information processing is not enough to justify regulation. If [regulators] think there is a problem of information processing that needs to be addressed, it should be carefully documented. … a particularly demanding burden of proof is required … if the potential problem can be adequately dealt with through … disclosing information of the hazard to buyers or users.” However, the primary justifications of automobile standards, e.g., were based on benefits that were largely paternalistic aimed at saving consumers from themselves rather than an advisory way of giving them the information they lacked to make better decisions on their own.
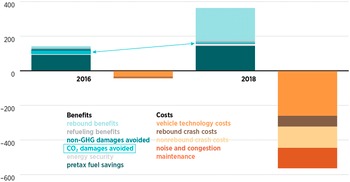
In fact, estimates of the environmental costs of vehicle emissions from the Trump and the Obama administrations are in comparatively close agreement. The overwhelming difference between them is their assessments of the nonenvironmental economic costs. Figure 1 shows the components of benefits and costs as estimated by both administrations. They include private fuel savings, vehicle maintenance, and technology costs, to name a few. By both estimates, the environmental benefits are just a tiny sliver, even though those are the kinds of benefits plausibly linked to market failure. The substantive disagreement is whether consumers can assess the effect of vehicle choice on their families’ fuel budgets. The Obama administration assumed that enough consumers lacked this ability such that federal regulations were needed to protect them from their suboptimal vehicle choices, whereas the Trump administration disagreed (although still included an element of consumer myopia).
Environmental benefits are dwarfed in the cost-benefit analysis (CBA) of emissions rules. Note: CBAs from 2016 and 2018 are from the Obama and Trump administrations, respectively. A comparison of these datasets was originally made by Antonio M. Bento et al. 2018. “Flawed Analyses of U.S. Auto Fuel Economy Standards,” Science, 362(6419): 1119–1121. Abbreviation: GHG = greenhouse gas. Sources: EPA, National Highway Transit Safety Administration, and California Air Resources Board, Draft Technical Assessment Report: Midterm Evaluation of Light-Duty Vehicle Greenhous Gas Emission Standards and Corporate Average Fuel Economy Standards for Model Years 2022–2025, July 2016, Table 12.82; The Safer Affordable Fuel-Efficient (SAFE) Vehicles Rule for Model Years 2021–2026 Passenger Cars and Light Trucks, 83 Fed. Reg. 42986, Table VII-51 (proposed 24 August 2018; to be codified at 49 C.F.R. pts. 523, 531, 533, 536, and 537, and at 40 C.F.R. pts. 85 and 86).

Regulators use the same logic to justify regulations that apply to businesses as well. In 2009, the Department of Transportation’s Federal Railroad Administration (FRA) justified a major public safety rule by asserting that the new regulation would create private business benefits and by including those private benefits in its RIA (Department of Transportation, Federal Railroad Administration, 2011). The FRA had been considering requiring railroads to implement automatic train control systems that would prevent collisions since at least 1986, when the National Transportation Safety Board recommended that the FRA implement regulatory standards for a system that would create “positive train separation” (Ellig & Horney, Reference Ellig and Horney2016). The FRA considered doing just that on multiple occasions between 1994 and 2004, but each time it concluded that the costs would far outweigh the benefits.
Even though its estimate of net benefits was negative, the FRA’s 2004 analysis changed dramatically from previous versions (Ellig & Horney, Reference Ellig and Horney2016) Beginning with the 2004 analysis, the FRA included “business benefits” in its estimate of total benefits that the regulation would create. By contrast, the FRA had issued reports in 1994 and 1999, which mentioned the possibility that positive train control systems could create cost reductions or other benefits for railroads and shippers, but it did not estimate the magnitude of these business benefits or include them in net benefits calculations. The FRA’s 2004 analysis claimed that many of these business benefits would accrue to railroads, which the railroads themselves disputed.
The FRA’s analysis gives a few examples of these hypothetical benefits, including “(i) real-time transmission of locomotive diagnostic information, (ii) fuel savings from pacing of trains to avoid cycles of rapid movement followed by long waits, (iii) more efficient car use due to frequently updated and optimized dispatching, and (iv) avoided investments in track capacity because of more efficient use of existing capacity” (Ellig and Horney, Reference Ellig and Horney2016, p. 8) Similar to the vehicle emissions rule, the direct benefits from improving railroad safety only accounted for a very small percentage – about 3 % – of the total benefits included in the FRA’s analysis. The rest of the benefits came from private benefits to railroads (about 28 %), private benefits to shippers (35–54 %, depending on assumptions), and social benefits (15–34 %).
The FRA examined positive train control gain following the passage of the Rail Safety Improvement Act of 2008, in which Congress ordered the FRA to promulgate a “positive train control” regulation. In the RIA that accompanied the FRA’s final positive train control rule in 2010, private business benefits are not included in the primary analysis, but they are included in a sensitivity analysis. Without including private benefits, the FRA estimated that the costs of implementing a positive train control regulation ($9.5–$13.1 billion over a 20-year period) would far exceed its safety benefits ($440–$674 million). The FRA’s sensitivity analysis, however, concludes that the combination of business benefits and social benefits could lead positive train control to cover its costs in 20–25 years (Ellig & Horney, Reference Ellig and Horney2016).
4.3 Regulatory costs are underestimated by orders of magnitude
We find that regulatory costs are underestimated primarily for two reasons – OMB carveouts and agencies’ narrow approach to CBA. For example, more than 20 major rules per year are “transfer rules” (recall Table 2). These rules underestimate their costs by orders of magnitude because they do not account for their marginal excess burden, even though an estimate could be provided using “a simple multiplication operation” (Office of Management and Budget, 2019). The primary effect of a transfer rule is the transfer of a significant amount of income or resources from one part of the economy to another rather than creating a significant aggregate cost to the economy. However, transfers often “induce moral hazard or other inefficient behavior” (Office of Management and Budget, 2017), especially when the transfer is to or from federal taxpayers, which is typical of federal transfer rules. OMB Circular A-94 has long guided agencies on how to quantify the marginal excess burden of transfers to and from federal taxpayers, but agencies have not adhered to the guidance. Recently, OMB sought public comment on more sternly requiring agencies to estimate the economic distortions created by transfers (Office of Management and Budget, 2019).
In some instances, OMB exempts an agency from estimating the costs and benefits of its rules. Regulations issued by the Drug Enforcement Administration in support of the war on drugs are in this category (see, e.g., Schedules of Controlled Substances, 2019). Similarly, OMB and Treasury have had a Memorandum of Agreement (MOA) that subjected tax regulations to less scrutiny than other regulations. In 2018, OMB and Treasury updated their MOA with the intent to increase scrutiny of tax regulations. However, Treasury still has a special carveout for its tax rules. For example, tax rules are not considered economically significant unless they have “an annual nonrevenue effect on the economy of $100 million or more, measured against a no-action baseline.”Footnote 30 Given that many tax regulations will likely change the marginal excess tax burden by more than $100 million, we should expect to see CBA for most Treasury rules moving forward if Treasury calculates these economic costs. While other exemptions may exist, we are not aware of estimates of the prevalence of these types of exemptions.
In the remainder of this section, we provide four specific examples of regulations where costs were significantly underestimated. Our first example is the 2016 prohibition of “junk” insurance plans. No cost was assessed for this rule (RIN 1210-AB75) because the rule was designated as not economically significant, but this designation is not supposed to be used unless there is no material adverse effect on any sector of the economy. It seems improbable that no material adverse effect would result from a regulation prohibiting a product that 2 million people would be purchasing (as estimated by the nonpartisan Congressional Budget Office).Footnote 31 The CEA later estimated that the annual cost of this regulation was $13 billion, which is 130 times the monetary threshold for economic significance.Footnote 32
As a second example, we note how the FDA has at times minimized or ignored the actual effects of its policies to avoid acknowledging them as regulatory costs. The FDA asserts that it intends its prescription-opioid policies (among others) to “actually result in a decrease in misuse and abuse, and their consequences, addiction, overdose, and death, in the community” (Food and Drug Administration, 2009). The actual result, however, involves illicit markets, yet the FDA refuses to recognize that any illicit activity results from its policies, even retrospectively. One doctor stated at an FDA conference to evaluate the impact of the agency’s opioid “reformulation” policy, “As FDA we do not have much control over Mexican cartels and the availability of low-cost heroin” (Food and Drug Administration, 2017; see also Mulligan, Reference Mulligan2022). Another, speaking on the same topic, said, “Do not try to measure things you cannot control” (Food and Drug Administration, 2017) Even if the policy led to a small fraction of the hundreds of thousands of deaths from illicit opioids since it was implemented, that would be a significant cost.
Meanwhile, studies suggest that thousands of people overdose on heroin and fentanyl (these are illicitly manufactured opioids) as a result of the FDA’s prescription policies that cause consumers to switch away from prescriptions and toward the illicitly manufactured opioids (Alpert et al., Reference Alpert, Powell and Pacula2018; Evans et al., Reference Evans, Ethan and Power2019; Mulligan, Reference Mulligan2020a). We are not saying that the FDA should lightly regulate prescriptions merely to entice consumers away from heroin, but rather that a CBA should acknowledge all important costs – medical and nonmedical – that result from a regulatory action. As the National Academies of Sciences, Engineering, and Medicine puts it, the FDA should “consider the potential effects of these interventions on illicit markets … and take appropriate steps to mitigate those effects” (Bonnie et al., Reference Bonnie, Ford and Phillips2017).
A third example is the “rebate” rule proposed by the Trump administration (Department of Health and Human Services, Fraud and Abuse, 2019). “Rebates” are checks written by drug companies to health insurance plans as part of the competition for plan business and would have been prohibited in the Medicare segment of the prescription drug industry. No market failure was cited, even though OMB Circular A-4 specifies that “each agency shall identify … the failures of private markets or public institutions that warrant new agency action.”Footnote 33 It adds that “a particularly demanding burden of proof is required to demonstrate the need for … price controls” (Office of Management and Budget, 2003, p. 6) Although HHS intended the rule to “blow up the way the industry does business” (Mulligan, Reference Mulligan2020b) and advertised it as “the most significant change in how Americans’ drugs are priced at the pharmacy counter, ever” (Department of Health and Human Services, 2019), it only quantified clerical costs. HHS merely estimated the time it would take for businesspeople to read the rebate rule, read their contracts to check for compliance, and perhaps fill out a form. The rule’s cost was calculated as time spent reading and performing other clerical activities multiplied by the hourly wage rate, which proved to be a mere 0.03 % of the revenue of the industry segment being regulated. A cost estimate that ignores how prohibiting a mechanism of competition (the rebates) might affect competition in the market or might create any other cost beyond paperwork cannot be considered to offer reasonable justifications and quantitative evidence.
CEA’s sample of 21 regulations provides further evidence of the quality of agency cost estimates, at least among those getting public attention in the form of comment submissions or motivating Congressional action. In addition to the “junk plan” and FDA regulations noted above, another HHS regulation and two DOL regulations were designated as not economically significant, whereas CEA estimated their annual regulatory costs to be two orders of magnitude above OMB’s threshold for economic significance. Among 16 observations with estimates from both sources, the correlation between the natural logarithms of CEA’s cost estimate and the agencies’ is −0.18.Footnote 34 Without the CAFE standards rule, for which CEA and EPA cost estimates are both large and similar, the correlation is −0.57, or + 0.51 if the sample is limited to nine observations that an agency designated as economically significant or provided a cost estimate meeting the threshold of economic significance.Footnote 35
Overall, we find that environmental regulations are more likely prepared in accordance with the sound economic principles of Circular A-4 perhaps owing to their more frequent challenge in court and the significant public attention they receive. Thus, we suspect that the first misconception, that most new regulations are environmental, thereby contributes to the second – i.e., regulators offer reasonable justifications and quantitative evidence for most regulations. In contrast, nonenvironmental regulations quantify hardly any of their costs. And when they do, they may receive less attention from the administration because they are less likely to be the subject of significant public scrutiny.
5 Misconception 3: the primary burden of regulation is paperwork
The third regulatory misconception, reinforced by the other two, is that the main burden of regulation is paperwork. Encouraged by the Paperwork Reduction Act of 1980, federal agencies are comparatively diligent at estimating the clerical work created or saved by their regulations. The clerical costs seem large in an absolute sense: in 2016, OIRA estimated that the public spends about 10 billion hours per year filling out federal forms (Office of Management and Budget, 2016). However, OIRA’s estimate refers to all federal rules, not just the new ones. Having looked at many federal rules introduced since 2009, we clearly see that paperwork burdens are just the tip of the iceberg in terms of overall costs, but the nonenvironmental regulations rarely include any estimate of the rest of the iceberg. (The 162-page 2016 “overtime rule” from the Department of Labor is an unusual but interesting case, with billions of dollars of paperwork costs, mainly because of a requirement to track work hours for millions of employees who would have otherwise been salaried (Department of Labor, Wage and Hour Division, 2016).).
We can illustrate the size of paperwork costs compared to economic costs with an example that most people will easily understand – state-issued stay-at-home mandates during the COVID-19 crisis. The paperwork burden associated with these mandates is relatively small for an individual: on average, it would require about 12 minutes for an adult to read her governor’s executive order containing the stay-at-home decree. At a wage rate of $25 per hour, the wages forgone from reading the order are about $5 per person. Assuming two people per household need to read the order, the paperwork burden per household is $10. In contrast, the economic burden (i.e., the opportunity cost) of complying with the stay-at-home orders is likely to be well into the $1,000 s per household. Even if it were only $1,000 per household, the paperwork burden would be only 1/100th of the economic burden.Footnote 36
Using the CEA’s sample of 18 nonenvironmental regulations (White House, 2020), we estimate that the economic costs of regulation are more than 60 times the clerical costs. These economic costs are, to use the terms of art specified in Circular A-4, “resource costs” and “opportunity costs” of valuable economic activity that cannot occur because of regulation. A prohibition of short-term insurance plans might not require much paperwork but could prevent valuable transactions from occurring.
In the CEA sample, the cross-regulation correlation between economic costs and paperwork costs is negative. CEA’s sample is intentionally selected to identify economically important regulations. Because the contribution of the costly regulations dominates the sum of economic costs across all regulations, the CEA’s sample is enough to take seriously the conclusion that the overall total of economic costs far exceeds the overall total of paperwork costs. Admittedly, CEA’s sample is selected based on public attention, which may put more weight on economic importance than clerical costs, although that itself seems at odds with the misconception that paperwork is the primary regulatory burden.
Assembling a sample for the purposes of measuring aggregate regulatory costs, CEA estimated that, in the average year from 2000 to 2016, new regulations added costs of 0.2 % of national income, including emissions standards.Footnote 37 For 11 years, that is a cumulative increase of about $3,000 per household. By comparison, pursuant to the Paperwork Reduction Act OMB reported that federal paperwork per household in 2015 was about 8.4 hours more than it had been 11 years earlier.Footnote 38 If those 8.4 hours were worth $50 each, that would be $421 added to the average household’s paperwork costs by 2015.Footnote 39 By this metric, only 12 % of the increase in the per-household burden of regulatory costs can be attributed to paperwork, even though the level of paperwork costs is impressive (10 billion hours per year).
Focusing on paperwork costs at the detriment of economic costs can have significant adverse effects. For example, a 2012 final rule by the CMS mandated that Medicare cover benzodiazepines, or “benzos,” which are prescription tranquilizers such as Valium and Xanax (Centers for Medicare and Medicaid Services, Medicare Program, 2012). Public commenters had warned the agency that benzos are vulnerable to “misuse and abuse.” Because the tranquilizers “enhance” the feeling of opioid consumption, including consumption of heroin and fentanyl, they have been identified in tens of thousands of drug overdoses since the rule went into effect. Indeed, by 2020, the rule change had been linked to “an increased rate of overdose” (Maust et al., Reference Maust, Allison Lin and Goldstick2020). The costs of that abuse were not even mentioned in the RIA, let alone quantified.Footnote 40 Instead, the only cost counted was the clerical cost because “sponsors will be required to submit information in their formulary files indicating that they will cover these drugs” (77 Fed. Reg. at 22156). While agencies should be concerned with paperwork, this example suggests that agencies could improve their regulatory analysis if they spent as much time examining economic impacts as they do paperwork costs.
6 Conclusions
This paper reaches conclusions about the character and quality of federal regulation using two methods. One method is text analysis of all regulations shown in the CFRs at various points in time. The other method is sampling the flow of regulation based on indicators of economic importance. Both methods contradict three misconceptions about federal regulation. The general patterns are also supported in this paper with dozens of specific examples.
First, we find that a minority of new regulations are environmental. By some measures, the flow of new health regulation alone since 2000 has far exceeded the flow of environmental regulation. Second, justifications and quantitative evidence for most regulations are seriously lacking. Environmental regulations can be the exception to this pattern, which suggests that these regulations help sustain the belief that regulators offer reasonable justifications and quantitative evidence for regulations. Third, although many regulations create nontrivial paperwork and clerical costs, which are the types of costs most likely to be quantified in RIAs, the vast majority of regulation costs are economic distortions. In many cases, agencies could make progress toward adhering to the sound economic principles articulated in OMB guidance by including simple estimates of the marginal excess tax burden.
The three misconceptions may be affecting the politics of regulation. In a country rich enough for citizens to place significant value on clean air and water, environmental regulations that help correct pollution externalities may have benefits that justify their costs. Influenced by the idea that most regulation is environmental, it is easy for the public to conclude that regulations generally have benefits that conceivably justify their costs, especially when reassured that regulators carefully measure costs and benefits. However, the costs of regulations do not stay hidden indefinitely. For example, the share of small businesses citing regulation as their “single most important problem” increased through the end of 2016, when it reached 45 % (Council of Economic Advisers, 2019b, p. 11). While Sunstein concludes that any additional constraints on regulators, such as a regulatory budget, “are hard to defend,” we find that technocrats typically do not comply with existing constraints.
Acknowledgments
We appreciate insights from, and discussions with, Bob Hahn, participants at the 2021 GMU Research Round Table on Capitalism and the Rule of Law, and reports by the White House Council of Economic Advisers. Andrew M. Baxter, Rodrigo Estrada, Blake Hoarty, and Hayden Warlick provided valuable research assistance. We also thank Christina Behe and Nita Ghei for providing useful feedback on an early draft.