I. Introduction
In his recent keynote speech as the chairperson of the European Central Bank’s supervisory board, Andrea Enria concluded that the recent pandemic and geopolitical events have turned into macro-level shocks that could alarmingly put the stability of financial system at risk (Enria (Reference Enria2022)). It is therefore crucial that financial supervisors and regulators have access to reliable measures describing and anticipating risk with systemic effects (i.e., the systemic risk measures). To examine the reliability and accuracy of these measures calls for proper validation tools. In today’s fast-paced world, the financial system and its participants are responding and acting according to the latest news and events. Thus, methods for testing the reliability of systemic risk measures must adapt accordingly, by placing more attention to recent observations.
Existing literature on backtesting systemic risk is scarce, with the pioneering work contributed by Girardi and Ergün (Reference Girardi and Ergün2013), who propose to backtest the conditional value-at-risk (CoVaR) measure of Adrian and Brunnermeier (Reference Adrian and Brunnermeier2011, Reference Adrian and Brunnermeier2016) using likelihood ratio method in the vein of Kupiec (Reference Kupiec1995) and Christoffersen (Reference Christoffersen1998). A major contribution to backtesting systemic risk measures is given by Banulescu-Radu, Hurlin, Leymarie, and Scaillet (Reference Banulescu-Radu, Hurlin, Leymarie and Scaillet2021), hereafter also referred to as BHLS, who provide methods to backtest multiple systemic risk measures considered as important and prominent by the literature (i.e., the delta CoVaR (
$ \Delta $
 CoVaR) of Adrian and Brunnermeier (Reference Adrian and Brunnermeier2016), the conditional capital shortfall measure of systemic risk (SRISK) of Acharya, Engle, and Richardson (Reference Acharya, Engle and Richardson2012) and Brownlees and Engle (Reference Brownlees and Engle2017), the marginal expected shortfall (MES) and the systemic expected shortfall (SES) of Acharya, Pedersen, Philippon, and Richardson (Reference Acharya, Pedersen, Philippon and Richardson2017)). To this objective, BHLS propose nonlikelihood-based statistic such as the t-statistic (to backtest, e.g., CoVaR) and the Box–Pierce statistic (to backtest, e.g., MES), while taking into consideration the impact of estimation risk.
In this article, we provide two classes of backtests for checking the adequacy of prominent systemic risk measures. We begin with backtesting the CoVaR and MES measures. We exploit as with existing literature the martingale difference sequence (mds) property of risk indicators derived under the definitions of CoVaR and MES, with a complementary observation. In particular, we show, without imposing additional conditions to existing works, how we can obtain a general procedure (i.e., one that can be used to detect inadequate systemic risk estimated using either CoVaR or MES). This puts our backtesting philosophy in line with the “better-safe-than-sorry” philosophy recently advocated by major regulatory body such as the European Central Bank (see, e.g., Enria (Reference Enria2022), Rehn (Reference Rehn2020)). This follows because, in practice, the CoVaR and MES of a financial institution are usually forecasted by the same risk model, and by backtesting CoVaR and MES jointly, we require the risk model to adequately produce both estimates. Our philosophy imposes a more stringent requirement on institutional risk modeling which in turn promotes a safer empirical practice.
By construction, the article’s statistical hypotheses take into account simultaneously both the unconditional and independence conditions commonly examined by the literature. We formulate the first backtest by analogy with the kernel generalization of Box and Pierce (Reference Box and Pierce1970) test in Hong (Reference Hong1996), and the additional technicality here lies with treating the impact of estimation risk which stems from forecasting out-sample systemic risk using in-sample parameter estimates. Because our first backtest tackles estimation risk using its standardizing factors, we refer to it as the “standardized” backtest. As the effect of estimation risk can also be asymptotically treated by whitening the test statistic, we obtain the second class of our backtest – the “whitened” backtest. Under regularity conditions, we show both the proposed backtests converge in distribution to N
$ \left(0,1\right) $
 under the null hypothesis.
We also explicitly study and establish the consistency of the new backtests. While the Box–Pierce-type statistic developed in BHLS focuses on divergence from the null hypothesis up to the first
$ m $
 lag order, we show that our backtests are fully consistent to capture a wide range of empirical alternatives. By extension, our backtests also generalize the methodology in Girardi and Ergün (Reference Girardi and Ergün2013) as it focuses on the first-order effect. Intuitively, such generalization is achieved by making
$ m $
 the testing scope of our test statistics and then letting
$ m\to \infty $
 . This also appealingly makes the asymptotic distribution of our backtests robust to any finite sample adjustments in
$ m $
 such as those discussed in Breusch and Pagan (Reference Breusch and Pagan1980).
Additionally, we show how the new backtests can also be applied to examine the adequacy of other prominent systemic risk measures. In particular, we show how the new backtests also simultaneously examine the adequacy of the SES and SRISK measures. While existing backtest for SES and SRISK are based on simulated test statistics, the new backtests need no modification. This highlights the generality of the new backtests as they can be conveniently used to detect inadequate systemic risk estimated using either CoVaR, MES, SES, or SRISK. We also discuss how our backtests can be slightly tweaked from focusing on the distress system condition to examining other system level of interest such as the median, which allows backtesting
$ \Delta $
 CoVaR since it also evaluates CoVaR at the median system condition.
The Box–Pierce-type statistic, upon allowing its testing scope to grow, can be viewed as a special case of our backtests under the truncated uniform kernel. Both procedures assign equal weight to each lag order. We offer downward weighting kernels to better match the new kernel-based backtests with financial market stylized fact, since market participants are usually more influenced by recent news than by remote past events. Simulation evidence highlights the optimality of our backtests. First, the new backtests demonstrate detection power against alternatives that are of dynamic (i.e., time-dependent) nature and of time-invariant (i.e., unconditional) nature. A growing
$ m $
 improves power against time-invariant alternatives, but the opposite is observed against time-dependent alternatives. In this aspect, our downward weighting backtests stand out over existing equally weighted backtest as they give better tradeoff between the two types of alternatives. Simulation evidence also highlights the complementary finite-sample capacities of the new backtests. Our standardized backtest, which preserves data dynamics more effectively, tends to yield better power against alternatives driven by dynamic misspecification. Under the time-invariant alternatives whitened backtest gives slightly better power than its standardized counterpart.
In addition to using simulated data, we also study the performance of the new backtests using real-world data. We focus on the largest financial institutions as their failures (due to, e.g., inadequate risk evaluation) are often detrimental to the greater financial system. More precisely, as in Brownlees and Engle (Reference Brownlees and Engle2017) and Banulescu-Radu et al. (Reference Banulescu-Radu, Hurlin, Leymarie and Scaillet2021), we study U.S. institutions with market capitalization greater than five billion dollars as of the end of June 2007. We collect data from early 2000 until late 2022 to study also the more recent pandemic-induced financial market crashes. Our findings confirm the empirical improvement brought by the new backtests. For instance, compared to existing backtest the new backtests demonstrate better empirical power as they reveal thousands more cases of inadequate systemic risk modeling over the sample period. Such improvement is also of considerable economic significance as it implies that the new backtests would have detected a larger scale of inadequate systemic risk modeling among the major financial institutions. These additional cases could play an important role in calling for a system-wide revision of existing risk modeling, which in turn would improve the stability of the greater financial system. Our empirical evidence also confirms the complementary features between the new backtests. Thus, we propose, in accordance with the “better-safe-than-sorry” philosophy, that the new backtests are applied together to detect as many indications about large-scale systemic risk inadequacies as possible.
In the spirit of Gourieroux and Zakoïan (Reference Gourieroux and Zakoïan2013) and Lazar and Zhang (Reference Lazar and Zhang2019), BHLS propose a system indicator by adjusting the forecasting errors in a forecasted systemic risk series under an objective function. In particular, the objective function in BHLS aims to adjust each forecast with the same magnitude. This may not be optimal because the forecasting errors across a forecasted series are generally nonuniform as, for instance, the next-period forecast is expected to be more accurate with a smaller margin of error than the forecast multiple periods ahead. By reasonings similar to the construction of the new backtests, we improve upon existing objective function such that it aims to adjust with smaller magnitude the immediate forecasts and appropriately with greater magnitude the forecasts multiple steps ahead. This is expected to give an indicator that reflects more accurately the state of the financial system. Indeed, compared with existing indicator, the new indicator shows warning signals that are more noticeable and alarming prior to both the 2008 subprime-induced and the 2020 pandemic-induced stock market crashes.
The remainder of this article is organized as follows: Section II spells out the framework and statistical theory of the new backtests. Section III provides Monte Carlo evidence highlighting the improvement brought by the new backtests over existing backtest. Section IV confirms the improvement using empirical data. Section V presents an early warning indicator for the financial system. Section VI concludes.
II. Method and Statistical Theory
A. Preliminaries and Definitions
We begin with some preliminaries, and we consider the following notations: Given two entities
$ \boldsymbol{Y}={\left({Y}_1,{Y}_2\right)}^{\prime } $
 , we let
$ {\boldsymbol{Y}}_t\equiv {\left({Y}_{1,t},{Y}_{2,t}\right)}^{\prime } $
 collect their returns at time
$ t $
 . In the context of backtesting systemic risk,
$ {Y}_{1,t} $
 is the stock return of a financial institution, whereas
$ {Y}_{2,t} $
 is the system return which is usually proxied by the return of a market index. We let
$ {\Omega}_{t-1} $
 collect the information available at time
$ t-1 $
 , and we denote by
$ {F}_Y\left(\cdot |{\Omega}_{t-1}\right) $
 the joint distribution function of
$ {\boldsymbol{Y}}_t $
 given
$ {\Omega}_{t-1} $
 , such that we have for any
$ \boldsymbol{y}=\left({y}_1,{y}_2\right)\in {\mathrm{\mathbb{R}}}^2 $
 ,
$ {F}_Y\left(\boldsymbol{y}|{\Omega}_{t-1}\right)=\mathrm{\mathbb{P}}\left({Y}_{1,t}\le {y}_1,{Y}_{2,t}\le {y}_2|{\Omega}_{t-1}\right) $
 . Similarly, we let
$ {F}_{Y2}\left(\cdot |{\Omega}_{t-1}\right) $
 denote the marginal distribution of
$ {Y}_{2,t} $
 given
$ {\Omega}_{t-1} $
 , such that we have for any
$ {y}_2\in \mathrm{\mathbb{R}} $
 ,
$ {F}_{Y2}\left({y}_2|{\Omega}_{t-1}\right)=\mathrm{\mathbb{P}}\left({Y}_{2,t}\le {y}_2|{\Omega}_{t-1}\right) $
 . For notational simplicity, we drop “almost surely” in all equalities involving random variables.
We now introduce the definitions of systemic risk measures MES and CoVaR. Formally, for a given
$ \alpha \in \left[0,1\right] $
 , the MES of an institution at time
$ t $
 is defined as

where
$ {VaR}_{Y2,t}\left(\alpha \right) $
 verifies
$ {VaR}_{Y2,t}\left(\alpha \right)={F}_{Y2}^{-1}\left(\alpha |{\Omega}_{t-1}\right) $
 . Because
$ \alpha $
 is typically specified at a small value such as 5%, the event
$ {Y}_{2,t}\le {VaR}_{Y2,t}\left(\alpha \right) $
 captures the left tail distressed system condition. Thus,
$ {MES}_{Y1,t}\left(\alpha \right) $
 quantifies the expected performance of a financial institution given that the system is in distress. The CoVaR definition shares the similarity that it also emphasizes the distress system condition. For a given
$ \beta \in \left[0,1\right] $
 , the CoVaR of an institution at time
$ t $
 is the quantity
$ {CoVaR}_{Y1,t}\left(\beta, \alpha \right) $
 verifying the following equation:

The CoVaR definition (2) differs slightly from that in Adrian and Brunnermeier (Reference Adrian and Brunnermeier2016), where the main difference is the use of an inequality (instead of an equality) for the conditioning event (i.e.,
$ {Y}_{2,t}\le {VaR}_{Y2,t}\left(\alpha \right) $
 ). Our definition allows for losses beyond
$ {VaR}_{Y2,t}\left(\alpha \right) $
 and is in line with the backtesting literature (see, e.g., Girardi and Ergün (Reference Girardi and Ergün2013), Banulescu-Radu et al. (Reference Banulescu-Radu, Hurlin, Leymarie and Scaillet2021)). Besides, we note
$ {CoVaR}_{Y1,t}\left(\beta, \alpha \right) $
 verifies
$ {CoVaR}_{Y1,t}\left(\beta, \alpha \right)={F}_{Y_1\mid {Y}_2\le {VaR}_{Y2}\left(\alpha \right)}^{-1}\left(\beta |{\Omega}_{t-1}\right) $
 , where
$ {F}_{Y_1\mid {Y}_2\le {VaR}_{Y2}\left(\alpha \right)}\left(\cdot |{\Omega}_{t-1}\right) $
 is the conditional distribution of
$ {Y}_{1,t} $
 given
$ {Y}_{2,t}\le {VaR}_{Y2,t}\left(\alpha \right) $
 and
$ {\Omega}_{t-1} $
 . In other words,
$ {CoVaR}_{Y1,t}\left(\beta, \alpha \right) $
 measures an institution’s
$ \beta $
 -quantile return given that the system is in distress.
In practice, systemic risk measures are typically estimated and forecasted from a parametric model specified by academics, risk managers, or regulators. For instance, Brownlees and Engle (Reference Brownlees and Engle2017) and Banulescu-Radu et al. (Reference Banulescu-Radu, Hurlin, Leymarie and Scaillet2021) consider the dynamic conditional correlation (DCC) specification to model and forecast systemic risk. Therefore we suppose, along with other risk measures of interest,
$ {VaR}_{Y2,t}\left(\alpha \right)\equiv {VaR}_{Y2,t}\left(\alpha, {\boldsymbol{\theta}}_0\right)={F}_{Y2}^{-1}\left(\alpha |{\Omega}_{t-1},{\boldsymbol{\theta}}_0\right) $
 and
$ {CoVaR}_{Y1,t}\left(\beta, \alpha \right)\equiv {CoVaR}_{Y1,t}\left(\beta, \alpha, {\boldsymbol{\theta}}_0\right)={F}_{Y_1\mid {Y}_2\le {VaR}_{Y2}\left(\alpha \right)}^{-1}\left(\beta |{\Omega}_{t-1},{\boldsymbol{\theta}}_0\right) $
 , are computed from a parametric model with true but unknown
$ p $
 -dimensional parameter vector
$ {\boldsymbol{\theta}}_0\in {\varTheta}_0\subseteq \varTheta \subset {\mathrm{\mathbb{R}}}^p $
 .
To backtest systemic risk measures, BHLS define a violation risk indicator based on the ex post risk sequence
$ \left\{{CoVaR}_{Y1,t}\left(\beta, \alpha, {\boldsymbol{\theta}}_0\right),{VaR}_{Y2,t}\left(\alpha, {\boldsymbol{\theta}}_0\right)\right\} $
 evaluated at a specified (
$ \alpha $
 ,
$ \beta $
 ) level, namely

Next, by identifying the MES-CoVaR relation (i.e.,
$ {MES}_{Y1,t}\left(\alpha \right)={MES}_{Y1,t}\left(\alpha, {\boldsymbol{\theta}}_0\right)={\int}_0^1{CoVaR}_{Y1,t}\left(\beta, \alpha, {\boldsymbol{\theta}}_0\right)\mathrm{d}\beta $
 ), we obtain as with BHLS the risk indicator for MES

where the second equality follows by probability integral transform. The idea of backtesting risk measures using their “respective” risk indicators is standard in the literature. For instance,
$ {h}_t\left(\alpha, \beta, {\boldsymbol{\theta}}_0\right) $
 and
$ {H}_t\left(\alpha, {\boldsymbol{\theta}}_0\right) $
 are analogous to risk indicators used in backtesting, respectively, the value-at-risk measure (see, e.g., Berkowitz, Christoffersen, and Pelletier (Reference Berkowitz, Christoffersen and Pelletier2011)) and the expected shortfall measure (see, e.g., Du and Escanciano (Reference Du and Escanciano2017)). By the same reasoning, BHLS propose to use
$ {h}_t\left(\alpha, \beta, {\boldsymbol{\theta}}_0\right) $
 to backtest CoVaR at a specified
$ \left(\alpha, \beta \right) $
 level, and to use
$ {H}_t\left(\alpha, {\boldsymbol{\theta}}_0\right) $
 to backtest MES at a specified
$ \alpha $
 level.
To backtest risk measures, the literature generally relies on exploiting the martingale difference sequence (mds) property of risk indicators. The mds property of
$ {h}_t\left(\alpha, \beta, {\boldsymbol{\theta}}_0\right) $
 and
$ {H}_t\left(\alpha, {\boldsymbol{\theta}}_0\right) $
 can be noted as follows: First, by Bayes theorem, we have
$ \mathrm{\mathbb{P}}\left({h}_t\left(\alpha, \beta, {\boldsymbol{\theta}}_0\right)=1|{\Omega}_{t-1}\right)=\alpha \beta $
 . It follows from definition (2) that
$ {h}_t\left(\alpha, \beta, {\boldsymbol{\theta}}_0\right) $
 follows the Bernoulli
$ \left(\alpha \beta \right) $
 distribution, and that the ex post centered indicator
$ \left\{{h}_t\left(\alpha, \beta, {\boldsymbol{\theta}}_0\right)-\alpha \beta \right\} $
 is a mds at the specified
$ \left(\alpha, \beta \right) $
 level. Second, by Fubini’s theorem, we note that the mds property of
$ \left\{{h}_t\left(\alpha, \beta, {\boldsymbol{\theta}}_0\right)-\alpha \beta \right\} $
 is preserved by integration, and that the mean of
$ {H}_t\left(\alpha, {\boldsymbol{\theta}}_0\right) $
 is given by
$ \alpha /2 $
 . Therefore,
$ \left\{{H}_t\left(\alpha, {\boldsymbol{\theta}}_0\right)-\alpha /2\right\} $
 is also a mds at the specified
$ \alpha $
 level, i.e.,

Notice that by definition of
$ {H}_t\left(\alpha, {\boldsymbol{\theta}}_0\right) $
 and Fubini’s theorem, we have
$ \unicode{x1D53C}\left({H}_t\left(\alpha, {\boldsymbol{\theta}}_0\right)|{\Omega}_{t-1}\right)={\int}_0^1\unicode{x1D53C}\left({h}_t\left(\alpha, \beta, {\boldsymbol{\theta}}_0\right)|{\Omega}_{t-1}\right)\mathrm{d}\beta $
 . It follows that for equation (3) to hold, the CoVaR indicator
$ {h}_t\left(\alpha, \beta, {\boldsymbol{\theta}}_0\right) $
 must be properly modeled not just at a specified
$ \beta $
 but instead for all
$ \beta \in \left[0,1\right] $
 . This is a complementary observation to existing literature. It implies that by examining the MES measure using
$ {H}_t\left(\alpha, {\boldsymbol{\theta}}_0\right) $
 at a specified
$ \alpha $
 level, we are simultaneously examining the CoVaR measure using
$ {h}_t\left(\alpha, \beta, {\boldsymbol{\theta}}_0\right) $
 , at the same
$ \alpha $
 level, but for all
$ \beta \in \left[0,1\right] $
 . Thus, we propose to examine MES and CoVaR jointly based on the mds property of
$ {H}_t\left(\alpha, {\boldsymbol{\theta}}_0\right) $
 , which gives a general procedure (i.e., one that can be conveniently used to detect inadequate systemic risk estimated using either CoVaR or MES). Our procedure is in line with the “better-safe-than-sorry” philosophy advocated by major regulatory body such as the European Central Bank.Footnote
1 This is because, in practice, the CoVaR and MES of a financial institution are usually estimated and forecasted by the same risk model (see, e.g., Banulescu-Radu et al. (Reference Banulescu-Radu, Hurlin, Leymarie and Scaillet2021)). By backtesting MES and CoVaR jointly, we require the risk model to adequately produce both estimates. This imposes a more stringent requirement on institutional risk modeling which in turn promotes a safer empirical practice.
B. The Main Hypotheses
Therefore, to backtest MES and CoVaR, we focus on the mds
$ \left\{{H}_t\left(\alpha, {\boldsymbol{\theta}}_0\right)-\alpha /2\right\} $
 to obtain as with the broader backtesting literature the zero mean condition (i.e.,
$ \unicode{x1D53C}\left({H}_t\left(\alpha, {\boldsymbol{\theta}}_0\right)\right)-\alpha /2=0 $
 ) and the zero autocovariance condition (i.e.,
$ \unicode{x1D53C}\left[\left({H}_t\left(\alpha, {\boldsymbol{\theta}}_0\right)-\unicode{x1D53C}\left({H}_t\left(\alpha, {\boldsymbol{\theta}}_0\right)\right)\right)\times \left({H}_{t-j}\left(\alpha, {\boldsymbol{\theta}}_0\right)-\unicode{x1D53C}\left({H}_{t-j}\left(\alpha, {\boldsymbol{\theta}}_0\right)\right)\right)\right]=0 $
 for all
$ j\ge 1 $
 ), which are sometimes referred to as the unconditional hypothesis and the independence hypothesis, respectively (see, e.g., Christoffersen (Reference Christoffersen1998), Du and Escanciano (Reference Du and Escanciano2017), and Banulescu-Radu et al. (Reference Banulescu-Radu, Hurlin, Leymarie and Scaillet2021)).
To ensure asymptotic full detection power against both hypotheses, we construct a statistical framework that considers both the unconditional and the independence conditions. This is achieved by first applying
$ \unicode{x1D53C}\left({H}_t\left(\alpha, {\boldsymbol{\theta}}_0\right)\right)=\alpha /2 $
 , for all
$ t $
 , in the autocovariance
$ \gamma (j) $
 and autocorrelation
$ \rho (j) $
 functions

Then, based on
$ \rho (j) $
 , we specify the main hypotheses of the article

By construction, our hypotheses take into account jointly both the zero mean condition and the zero autocovariance condition. A statistical test consistent against divergence from
$ {\mathrm{\mathbb{H}}}_0 $
 (i.e., with asymptotic unit power under
$ {\mathrm{\mathbb{H}}}_1 $
 ) would be consistent against both conditions. This is confirmed using the new backtests in our simulation study.
In practice, we do not observe
$ {H}_t\left(\alpha, {\boldsymbol{\theta}}_0\right) $
 and
$ \rho (j) $
 , but we can estimate them using the observed sample
$ {\left\{{Y}_{1,t},{Y}_{2,t}\right\}}_{t=1}^{T+n} $
 . In this aspect, we note that the fundamental notion of backtesting is about examining the quality of a sequence of forecasts (using, e.g.,
$ {\mathrm{\mathbb{H}}}_0 $
 ). This calls for a forecasting scheme. For meaningful comparison, we use as with BHLS the “fixed forecasting estimation scheme.” That is, we first use an in-sample return data from
$ t=1 $
 to
$ t=T $
 (i.e.,
$ {\left\{{Y}_{1,t},{Y}_{2,t}\right\}}_{t=1}^T $
 ) to estimate
$ {\boldsymbol{\theta}}_0 $
 , by, e.g.,
$ {\hat{\boldsymbol{\theta}}}_T $
 , where
$ {\hat{\boldsymbol{\theta}}}_T $
 is a consistent estimator for
$ {\boldsymbol{\theta}}_0 $
 , with the asymptotic variance of
$ \sqrt{T}\left({\hat{\boldsymbol{\theta}}}_T-{\boldsymbol{\theta}}_0\right) $
 given by
$ \varSigma $
 . Then, using
$ {\hat{\boldsymbol{\theta}}}_T $
 and the out-sample return data observed from
$ t=T+1 $
 to
$ t=T+n $
 (i.e.,
$ {\left\{{Y}_{1,t},{Y}_{2,t}\right\}}_{t=T+1}^{T+n} $
 ), we forecast and compute
$ {\{{H}_t(\alpha, {{\hat{\boldsymbol{\theta}}}_T})\}}_{t=T+1}^{T+n} $
 . Therefore, the sample counterpart of
$ \rho (j) $
 is given by

where
$ {\hat{\gamma}}_n(j) $
 is the sample autocovariance

A backtest can be readily constructed based on the Box–Pierce (Box and Pierce (Reference Box and Pierce1970)) test statistic, namely

However, in the presence of estimation risk (i.e.,
$ n/T\to \omega $
 , and
$ 0<\omega <\infty $
 ), it has been shown that
$ S $
 does not follow a standard distribution. Besides, as
$ S $
 checks
$ {\mathrm{\mathbb{H}}}_0 $
 up to a finite order
$ m $
 , it may not be consistent against some higher-order alternatives.
C. Test Statistics and Asymptotic Theory
In this article, we propose for the context of backtesting systemic risk two classes of consistent N
$ \left(0,1\right) $
 backtests. The construction of our first backtest is analogous to the kernel generalization of Box–Pierce test in Hong (Reference Hong1996), which takes into account all available
$ {\hat{\rho}}_n(j) $


where
$ k\left(\cdot \right) $
 is a kernel function with kernel parameter
$ m $
 which is a positive integer. Some commonly used
$ k\left(\cdot \right) $
 are the Bartlett (BAR) kernel, the Daniell (DAN) kernel, the Parzen (PAR) kernel, the Quadratic-Spectral (QS) kernel, and the truncated uniform (TRU) kernel

The BAR, PAR, and TRU kernels have compact support, and
$ m $
 can be viewed as the truncation parameter for these kernels (i.e.,
$ k(z)=0 $
 for
$ \mid z\mid >1 $
 ).Footnote
2 All the given kernels satisfy the assumptions on
$ k\left(\cdot \right) $
 in the Supplementary Material. Except for the TRU kernel, all kernels discount the weights of higher-order lags. Using downward weighting kernel gives better match to the well-known stylized fact that financial market is more influenced by recent news than by remote past events, and is thus expected to give better empirical rejection power. As with
$ S $
 , expression (8) may not follow a standard asymptotic distribution in the presence of estimation risk. We quantify and account for the impact of estimation risk in our test statistics accordingly, and our first backtest is the standardized version of expression (8), namely

where

and
$ \boldsymbol{R}(j) $
 is given by

The quantities
$ {M}_{1n}(k) $
 and
$ {V}_{1n}(k) $
 are approximately the mean and variance of expression (8). The additional technicality here with respect to the Hong (Reference Hong1996) test lies with treating the impact of estimation risk, which stems from estimating out-sample risk measures based on in-sample parameter estimates. Intuitively, we quantify estimation risk by first measuring the sensitivity of the out-sample risk indicator with respect to the in-sample parameter in the form of
$ \boldsymbol{R}(j) $
 . The sensitivity is then scaled according to the asymptotic variance of the parameter estimate
$ \varSigma $
 . Based on the calculated estimation risk, we then quantify its impact on the asymptotic distribution of our test statistic, and the impact is subsequently adjusted by
$ {M}_{1n}(k) $
 and
$ {V}_{1n}(k) $
 . This makes the asymptotic distribution of
$ {Q}^0 $
 robust to estimation risk. In the absence of estimation risk (i.e.,
$ \omega =0 $
 ),
$ {M}_{1n}(k) $
 and
$ {V}_{1n}(k) $
 reduce to
$ {M}_{1n}(k)={\sum}_{j=1}^{n-1}{k}^2\left(j/m\right) $
 and
$ {V}_{1n}(k)=2{\sum}_{j=1}^{n-1}{k}^4\left(j/m\right) $
 , respectively.
In practice, a feasible test statistic
$ Q $
 requires consistent estimators for
$ \boldsymbol{R}(j) $
 and
$ \varSigma $
 , which we denote by
$ \hat{\boldsymbol{R}}(j) $
 and
$ \hat{\varSigma} $
 , respectively. Therefore, the feasible test statistic is given by

where
$ \left({\hat{M}}_{1n}(k),{\hat{V}}_{1n}(k)\right) $
 are defined as
$ \left({M}_{1n}(k),{V}_{1n}(k)\right) $
 with
$ \left(\boldsymbol{R}(j),\Sigma \right) $
 replaced by
$ \left(\hat{\boldsymbol{R}}(j),\hat{\Sigma}\right) $
 .
We refer to
$ Q $
 as the “standardized” backtest as it tackles estimation risk using its standardizing factors. Because the effect of estimation risk can also be asymptotically addressed by whitening (i.e., decorrelating) the
$ \left\{{\hat{\rho}}_n(j)\right\} $
 sequence, we obtain the second class of our backtest.Footnote
3 Put
$ {\left\{{\hat{\rho}}_n(j)\right\}}_{j=1}^{n-1} $
 in the vector
$ {\hat{\boldsymbol{\rho}}}_n $
 , and let
$ {\hat{\rho}}_{nr}(j) $
 denote the asymptotically whitened version of
$ {\hat{\rho}}_n(j) $
 . In particular,
$ {\hat{\rho}}_{nr}(j) $
 can be, but not limited to, the
$ j $
 th element of the vector
$ {\hat{\varDelta}}^{-1/2}{\hat{\boldsymbol{\rho}}}_n $
 , where
$ \hat{\varDelta} $
 is a consistent estimator of matrix
$ \varDelta $
 whose
$ \left(i,j\right) $
 th element is given by
$ \varDelta \left(i,j\right)=\delta \left(i,j\right)+\omega \boldsymbol{R}{(i)}^{\prime}\varSigma \boldsymbol{R}(j) $
 , with
$ \delta \left(i,j\right) $
 the Kronecker delta which takes the value of 1 if
$ i=j $
 and 0 if otherwise. Similarly, by putting
$ {\left\{\rho (j)\right\}}_{j=1}^{n-1} $
 in
$ \boldsymbol{\rho} $
 , we have the
$ j $
 th element of the vector
$ {\varDelta}^{-1/2}\boldsymbol{\rho} $
 , which we denote by
$ {\rho}_r(j) $
 , being the true counterpart of
$ {\hat{\rho}}_{nr}(j) $
 . The robust Box–Pierce-type backtest proposed in BHLS is based on the whitened sequence

and it has been shown that
$ {S}_r\overset{d}{\to }{\chi}^2(m) $
 under regularity conditions.
Our second class of N
$ \left(0,1\right) $
 backtest is also based on
$ \left\{{\hat{\rho}}_{nr}(j)\right\} $
 , namely

The standardizing factors in
$ {Q}_r $
 are those in
$ Q $
 when there is no estimation risk (
$ \omega =0 $
 ). Intuitively, estimation risk has been adjusted by whitening
$ \left\{{\hat{\rho}}_n(j)\right\} $
 , and thus the standardizing factors of
$ {Q}_r $
 need no further adjustment. Therefore, we refer to
$ {Q}_r $
 as the “whitened” backtest. When the TRU kernel is used, we obtain

which can be viewed as the generalized BHLS statistic that allows
$ m $
 to grow. As with
$ Q $
 , we propose downward weighting kernel for
$ {Q}_r $
 to give a closer match to financial market stylized facts. This is expected to improve the detection power of our backtests. Indeed,
$ {Q}_{r\mathrm{TRU}} $
 and
$ {S}_r $
 show similar power in our simulation study, but are generally less optimal than the new backtests with downward weighting kernels.
To ensure consistency against a wide range of empirical alternatives, we let the kernel parameter
$ m $
 – which can be viewed as the testing scope parameter of
$ Q $
 and
$ {Q}_r $
 – grow with the size of the sample under examination at a proper rate (i.e.,
$ m\to \infty $
 as
$ n\to \infty $
 with
$ m/n\to 0 $
 ). From a theoretical perspective, passing
$ m\to \infty $
 also makes the asymptotic distribution of a backtest robust to any finite sample adjustment in
$ m $
 . Indeed, if
$ {H}_t\left(\alpha, {\boldsymbol{\theta}}_0\right) $
 exhibits autoregressive behavior, the degree of freedom in the asymptotic
$ {\chi}^2 $
 distribution of Box–Pierce-type test may require adjustment from
$ m $
 to
$ m-c $
 , where
$ c<\infty $
 is the order of the autoregression (see, e.g., Breusch and Pagan (Reference Breusch and Pagan1980)). This becomes asymptotically irrelevant when a backtest allows
$ m\to \infty $
 , as with
$ Q $
 and
$ {Q}_r $
 .
We now give the asymptotic properties of
$ Q $
 and
$ {Q}_r $
 .
Theorem 1. Suppose Assumptions 1–4 in the Supplementary Material hold, and let
$ T\to \infty $
 ,
$ n\to \infty $
 ,
$ n/T\to \omega <\infty $
 ,
$ m\to \infty $
 ,
$ m/n\to 0 $
 . Then
$ Q\overset{d}{\to}\mathrm{N}\left(0,1\right) $
 under
$ {\mathrm{\mathbb{H}}}_0 $
 .
Proposition 1. Suppose the conditions of Theorem 1 hold. Then
$ {Q}_r\overset{d}{\to}\mathrm{N}\left(0,1\right) $
 under
$ {\mathrm{\mathbb{H}}}_0 $
 .
Theorem 2. Suppose Assumptions 1–6 in the Supplementary Material hold, and let
$ T\to \infty $
 ,
$ n\to \infty $
 ,
$ n/T\to \omega <\infty $
 ,
$ m\to \infty $
 ,
$ m/n\to 0 $
 . Then

Proposition 2. Suppose the conditions of Theorem 2 hold. Then

The detailed mathematical proof for the above results is provided in Appendices B–E of the Supplementary Material. In Theorem 1 and Proposition 1, we show under regularity conditions that both our backtests
$ Q $
 and
$ {Q}_r $
 follow the asymptotic N
$ \left(0,1\right) $
 distribution under
$ {\mathrm{\mathbb{H}}}_0 $
 , even in the presence of estimation risk. In Theorem 2 and Proposition 2, we show that whenever
$ \rho (j)\ne 0 $
 for any
$ j\ge 1 $
 , which implies
$ {\rho}_r(j)\ne 0 $
 for some
$ j\ge 1 $
 , we have
$ {m}^{1/2}/ nQ $
 and
$ {m}^{1/2}/{nQ}_r $
 converge to a finite positive quantity. This shows that
$ Q $
 and
$ {Q}_r $
 diverge to positive infinity at rate
$ n/{m}^{1/2} $
 to yield asymptotic full power. That is, for some constants
$ {K}_n=o\left(n/{m}^{1/2}\right) $
 , we have
$ \mathrm{\mathbb{P}}\left(Q>{K}_n\right)\to 1 $
 and
$ \mathrm{\mathbb{P}}\left({Q}_r>{K}_n\right)\to 1 $
 under
$ {\mathrm{\mathbb{H}}}_1 $
 . Thus, the new backtests are consistent, providing a valuable addition to existing literature. Because
$ Q $
 and
$ {Q}_r $
 go to positive infinity under
$ {\mathrm{\mathbb{H}}}_1 $
 , they are upper-tailed backtests; and the upper-tailed critical value of N
$ \left(0,1\right) $
 at the 5% significance level is approximately 1.645. Finally, although the new backtests are asymptotically consistent, in small sample they may not give similar power since
$ Q $
 is a standardized statistic while
$ {Q}_r $
 is a whitened statistic. This is studied using simulation experiments.
D. Generalized Backtests for Other Measures
In this subsection, we discuss how
$ \left(Q,{Q}_r\right) $
 , which backtest CoVaR and MES, can also be applied to backtest other prominent systemic risk measures (i.e., the conditional capital shortfall measure of systemic risk (SRISK) of Acharya et al. (Reference Acharya, Engle and Richardson2012) and Brownlees and Engle (Reference Brownlees and Engle2017), the systemic expected shortfall (SES) of Acharya et al. (Reference Acharya, Pedersen, Philippon and Richardson2017), and the
$ \Delta $
 CoVaR measure of Adrian and Brunnermeier (Reference Adrian and Brunnermeier2016)). First, we show how backtesting SES or SRISK is equivalent to backtesting (CoVaR, MES) using the new backtests. Second, we discuss how our backtests can be easily modified to examine systemic risk at other level of system condition such as the median level, which concerns the
$ \Delta $
 CoVaR measure.
1. Backtesting SRISK and SES
We begin as usual with the definitions. Following Acharya et al. (Reference Acharya, Engle and Richardson2012), the SRISK of institution
$ {Y}_1 $
 at time
$ t $
 is given by

where
$ g\in \left[0,1\right] $
 is the prudential capital fraction;
$ {L}_{1,t} $
 is the debt of institution
$ {Y}_1 $
 ; and
$ {W}_{1,t}>0 $
 is the market value of institution
$ {Y}_1 $
 . Besides, in Acharya et al. (Reference Acharya, Pedersen, Philippon and Richardson2017), the association between SES and MES is given by

where
$ {LV}_{1,t}\equiv \left({L}_{1,t}+{W}_{1,t}\right)/{W}_{1,t} $
 is the leverage ratio of institution
$ {Y}_1 $
 ;
$ \Lambda $
 and
$ \Pi >0 $
 are constant terms. By taking the first derivatives, we note that
$ {SRISK}_{Y1,t}\left(\alpha \right) $
 and
$ {SES}_{Y1,t}\left(\alpha \right) $
 are decreasing in
$ {MES}_{Y1,t}\left(\alpha \right) $
 monotonically. More generally, we denote by
$ {M}_t\left({MES}_{Y1,t}\left(\alpha \right)\right) $
 any monotonic functions of
$ {MES}_{Y1,t}\left(\alpha \right) $
 , such as
$ {SRISK}_{Y1,t}\left(\alpha \right) $
 and
$ {SES}_{Y1,t}\left(\alpha \right) $
 . Recall that to backtest CoVaR and MES, we use the
$ {H}_t\left(\alpha \right) $
 indicator, which we can rewrite as

with
$ \unicode{x1D7D9}\left\{\left[{Y}_{1,t}\le {CoVaR}_{Y1,t}\left(\beta, \alpha \right)\right]\right\} $
 being the integrand over
$ \beta \in \left[0,1\right] $
 . The risk indicator associated with
$ {M}_t\left({MES}_{Y1,t}\left(\alpha \right)\right) $
 is naturally given by

with
$ \unicode{x1D7D9}\left\{\left[{M}_t\left({Y}_{1,t}\right)\ge {M}_t\left({CoVaR}_{Y1,t}\left(\beta, \alpha \right)\right)\right]\right\} $
 being now the integrand over
$ \beta \in \left[0,1\right] $
 . We could therefore propose to backtest SES or SRISK using
$ {\tilde{H}}_t\left(\alpha \right) $
 , but notice that
$ {H}_t\left(\alpha \right) $
 and
$ {\tilde{H}}_t\left(\alpha \right) $
 are actually identical as their integrands take the value of 1 at the same point in time. Computing any of our backtests using
$ {H}_t\left(\alpha \right) $
 or
$ {\tilde{H}}_t\left(\alpha \right) $
 gives the same value and the same conclusion. On this basis, we could conveniently apply the proposed test statistics
$ \left(Q,{Q}_r\right) $
 to backtest SES or SRISK. This gives the new backtests general capacities as they can be used to detect inadequate systemic risk estimated using either CoVaR, MES, SES, or SRISK.
2. Backtesting at Other System Conditions
We have thus far focused on backtesting at the distress system condition, which is the emphasis of most systemic risk measures such as CoVaR, MES, SES, and SRISK. This is achieved by evaluating
$ {H}_t\left(\alpha \right) $
 at the left tail, e.g., by setting
$ \alpha =5\% $
 . To backtest
$ \Delta $
 CoVaR, we first note that it is given by the difference between CoVaR evaluated at the distressed system condition and CoVaR evaluated at the median system condition. It thus remains to show how our backtesting procedure can be modified to examine systemic risk measures (such as CoVaR and SES) at various other system conditions such as the median. This is achieved by generalizing the
$ {H}_t\left(\alpha \right) $
 indicator such that it can consider any level of system condition specified by the range
$ \left({\alpha}_l,{\alpha}_u\right) $
 , i.e.,

where, as with the definition of
$ {CoVaR}_{Y1,t}\left(\beta, \alpha \right) $
 in equation (2), we have
$ {CoVaR}_{Y1,t}\left(\beta, {\alpha}_l,{\alpha}_u\right) $
 verifying
$ \mathrm{\mathbb{P}}\left({Y}_{1,t}\le {CoVaR}_{Y1,t}\left(\beta, {\alpha}_l,{\alpha}_u\right)|{VaR}_{Y2,t}\left({\alpha}_l\right)\le {Y}_{2,t}\le {VaR}_{Y2,t}\left({\alpha}_u\right);{\Omega}_{t-1}\right)=\beta $
 . The mean of
$ {H}_t\left({\alpha}_l,{\alpha}_u\right) $
 is
$ \left({\alpha}_u-{\alpha}_l\right)/2 $
 , and we verify
$ \left\{{H}_t\left({\alpha}_l,{\alpha}_u\right)-\left({\alpha}_u-{\alpha}_l\right)/2\right\} $
 retains the mds property. Moreover, using
$ \left\{{H}_t\left({\alpha}_l,{\alpha}_u\right)-\left({\alpha}_u-{\alpha}_l\right)/2\right\} $
 does not affect the asymptotic results of
$ \left(Q,{Q}_r\right) $
 . When
$ {\alpha}_l=0 $
 and
$ {\alpha}_u=\alpha $
 ,
$ {H}_t\left({\alpha}_l,{\alpha}_u\right) $
 is equivalent to
$ {H}_t\left(\alpha \right) $
 . The
$ {H}_t\left({\alpha}_l,{\alpha}_u\right) $
 indicator is useful when we concern examining systemic risk measures at other levels of system condition. To backtest at the median condition, we can set, e.g.,
$ \left({\alpha}_l,{\alpha}_u\right)=\left(45\%,55\%\right) $
 .
III. Monte Carlo Evidence
In this section, we study the finite sample performance of the proposed backtests using simulation experiments. Because a distressed financial system tends to drive broader economic problems, it is repeatedly emphasized and quantified by the systemic risk literature. This is reflected by the formulas of prominent systemic risk measures such as
$ \Delta $
 CoVaR, MES, SES, and SRISK. Therefore, we use throughout
$ {H}_t\left({\alpha}_l,{\alpha}_u\right) $
 with
$ \left({\alpha}_l,{\alpha}_u\right)=\left(0,5\%\right) $
 , which is equivalent to using
$ {H}_t\left(\alpha \right) $
 with
$ \alpha =5\% $
 . We work with the DCC-GARCH data-generating process (DGP) of Engle (Reference Engle2002) and Aielli (Reference Aielli2013). More precisely,
$ {\boldsymbol{Y}}_t $
 is generated according to the following set of equations:

The selected DGP aims to simulate data that reflect empirical stylized facts. We use first-order dynamic as it reflects the tendency of market participants to respond and react to the latest news and events. The data are generated with volatilities
$ {\sigma}_{i,t} $
 following the GARCH process in Glosten, Jagannathan, and Runkle (Reference Glosten, Jagannathan and Runkle1993), to allow for the well-known asymmetric market reactions. We generate separately for each time period
$ t $
 the innovation term
$ {\boldsymbol{z}}_t $
 from the standardized Student t distribution with degree of freedom
$ \nu $
 , i.e.,
$ {\boldsymbol{z}}_t\sim {\mathrm{t}}_{\nu}\left(\mathbf{0},{\boldsymbol{I}}_2\right) $
 , where
$ {\boldsymbol{I}}_2 $
 is the identity matrix of order 2. This allows for the heavy tail feature of financial data. Moreover, we calibrate the parameters of DGP (11) using observed data spanning from Jan. 3, 2000 to Dec. 31, 2021. We use the daily security log-returns (in percentage) of Bank of America as
$ {Y}_{1,t} $
 ; we proxy
$ {Y}_{2,t} $
 using the log-returns of the CRSP value-weighted market index. Based on the estimated parameters, we set

The calibrated parameters reflect financial market stylized facts. For instance, the positive signs in the asymmetry parameters
$ \left({\beta}_{12},{\beta}_{22}\right) $
 reflect the stronger market reactions to negative news than the positive counterparts. The relatively large GARCH parameters (
$ {\beta}_{13} $
 ,
$ {\beta}_{23} $
 ) with respect to the ARCH parameters (
$ {\beta}_{11} $
 ,
$ {\beta}_{21} $
 ) highlight the persistent feature in the volatility of financial series. The positive
$ s $
 parameter captures the expected positive comovement between the Bank of America and the financial market. A relatively small
$ \nu $
 parameter reflects the heavy tails feature of financial returns. Also, the set of parameters (12) satisfies stationary requirements.
We study the impact of different kernel functions by considering all the kernels discussed previously. To study the capacity of our backtests, we use a range of values for the kernel parameter
$ m=\left\{\mathrm{5,10,20,30}\right\} $
 . We consider several combinations of in-sample size and out-sample size
$ \left(T,n\right)=\left\{\left(\mathrm{250,250}\right),\left(\mathrm{250,500}\right),\left(\mathrm{500,500}\right),\left(\mathrm{500,250}\right)\right\} $
 . For each combination, we simulate
$ T+n+500 $
 observations, and then we discard the first 500 observations to work with the latest
$ T+n $
 data points. The objective here is to stabilize the generated data by reducing the effects of the initial values in the DGP, which we set as
$ \left({Y}_{1,0},{Y}_{2,0},{\sigma}_{1,0},{\sigma}_{2,0}\right)=\left[{\alpha}_{10},{\alpha}_{20},{\beta}_{10}/\left(1-{\beta}_{11}-0.5{\beta}_{12}-{\beta}_{13}\right),{\beta}_{20}/\left(1-{\beta}_{21}-0.5{\beta}_{22}-{\beta}_{23}\right)\right] $
 .
Let
$ \boldsymbol{\phi} $
 collect the parameters in DGP (11) with true values
$ {\boldsymbol{\phi}}_0 $
 . To estimate
$ \boldsymbol{\phi} $
 , we use the maximum likelihood method, and therefore we note that the Student t likelihood function (in logarithm) of DGP (11) for observation at time
$ t $
 is given by

where
$ \Gamma \left(\cdot \right) $
 is the gamma function and
$ \eta ={\nu}^{-1} $
 is the inverse of the degree of freedom parameter, which is constrained at
$ \eta <0.5 $
 to ensure the existence of second moment. Parameter estimation is executed by maximizing the sum of likelihood
$ {\sum}_t{l}_t\left(\boldsymbol{\phi} \right) $
 , and we denote the estimated parameter vector by
$ {\hat{\boldsymbol{\phi}}}_T $
 . With
$ {\hat{\boldsymbol{\phi}}}_T $
 , we compute
$ {H}_t\left(\alpha, {\hat{\boldsymbol{\phi}}}_T\right) $
 , and we note that the consistency and asymptotic normality of
$ {\hat{\boldsymbol{\phi}}}_T $
 have been established for a general class of multivariate GARCH models (see, e.g., Fiorentini, Sentana, and Calzolari (Reference Fiorentini, Sentana and Calzolari2003), p. 535). That is, we have

where
$ \varSigma /T $
 is the asymptotic covariance matrix of
$ {\hat{\boldsymbol{\phi}}}_T $
 , which we estimate consistently using the Hessian matrix obtained from the estimation procedure. To compute the test statistics, it remains to evaluate
$ \hat{\boldsymbol{R}}(j) $
 which we give in Appendix F of the Supplementary Material. In this aspect, we face as with BHLS the challenge of differentiability, which we address using the procedures suggested therein to obtain a consistent estimate.
Finally, we compute
$ Q $
 and
$ {Q}_r $
 to examine
$ {\mathrm{\mathbb{H}}}_0 $
 . For comparison we also compute the Box–Pierce-type backtests (i.e.,
$ S $
 and
$ {S}_r $
 ), where backtestings are performed based on the
$ {\chi}^2(m) $
 limiting distribution (BHLS, Corollary 2). Although this is generally not accurate for
$ S $
 , we include it to highlight the effect of estimation risk. Throughout, testing significance level is 5%.
We begin with the size study (i.e., backtesting systemic risk forecasts issued by the correctly specified risk model (11)). We refer to this study as experiment NULL, and we report the rejection rates in Table 1. As expected, the size of the nonwhitened
$ S $
 backtest is severely distorted, whereas the whitened
$ {S}_r $
 backtest shows reasonable rejection rates. This is due to
$ S $
 having nonstandard distribution in the presence of estimation risk, which is accounted for by whitening the test statistic as in
$ {S}_r $
 . By the same reasoning, our whitened backtest
$ {Q}_r $
 also displays reasonable sizes across the combinations of
$ \left(T,n\right) $
 . In contrast to
$ S $
 , our nonwhitened backtest
$ Q $
 is reasonably sized as it has considered estimation risk in its standardizing factors explicitly. While
$ Q $
 over rejects slightly when the sample size is small, it shows stability as soon as
$ \left(T,n\right) $
 increases to 500. We also note the usual bootstrap procedure can be readily applied if a better size is desired for small sample. Overall, both the proposed
$ {Q}_r $
 and
$ Q $
 backtests show robustness to estimation risk. Besides, the size of both backtests is stable under different kernel functions along with a range of values for the kernel parameter
$ m $
 . In other words, the asymptotic N
$ \left(0,1\right) $
 distribution of
$ {Q}_r $
 and
$ Q $
 established in Theorem 1 and Proposition 1 is well approximated in small sample, even when the generated data exhibit heavier tails than the normal distribution.

Table 1 Long description
The table is divided into four horizontal blocks based on sample sizes. Each block contains two sets of columns for different test statistics, with sub-columns for values 5, 10, 20, and 30.
Block 1: T = 250, n = 250
* Q sub B A R: Left (5.8, 7.1, 7.0, 7.1), Right (4.5, 5.4, 5.5, 5.4)
* Q sub P A R: Left (5.2, 6.7, 6.9, 7.0), Right (4.3, 5.2, 5.7, 5.8)
* Q sub Q S: Left (6.3, 7.1, 7.2, 7.4), Right (5.0, 5.7, 5.7, 5.8)
* Q sub D A N: Left (5.8, 7.0, 7.6, 8.0), Right (4.6, 6.1, 6.0, 6.0)
* Q sub T R U: Left (7.1, 8.1, 8.2, 7.9), Right (6.4, 6.8, 6.6, 6.7)
* S and S sub r: Left (9.0, 11.5, 13.8, 14.6), Right (5.1, 5.8, 6.2, 6.1)
Block 2: T = 250, n = 500
* Q sub B A R: Left (3.9, 5.7, 6.7, 7.3), Right (3.9, 5.0, 6.2, 6.3)
* Q sub P A R: Left (3.3, 4.3, 6.5, 7.3), Right (3.7, 4.1, 5.6, 5.9)
* Q sub Q S: Left (4.0, 6.0, 7.3, 7.9), Right (3.7, 5.3, 5.6, 6.6)
* Q sub D A N: Left (4.1, 5.8, 7.5, 8.2), Right (3.7, 5.5, 6.1, 7.0)
* Q sub T R U: Left (6.2, 7.8, 8.8, 8.0), Right (5.5, 6.0, 7.3, 7.4)
* S and S sub r: Left (8.5, 11.8, 15.9, 15.6), Right (4.6, 5.7, 6.6, 7.1)
Block 3: T = 500, n = 250
* Q sub B A R: Left (6.2, 7.3, 7.0, 6.9), Right (4.8, 6.0, 6.7, 6.0)
* Q sub P A R: Left (4.7, 6.7, 6.9, 6.9), Right (4.0, 5.2, 6.4, 7.0)
* Q sub Q S: Left (6.5, 7.6, 7.3, 7.3), Right (4.9, 6.5, 6.6, 6.7)
* Q sub D A N: Left (6.1, 7.9, 8.3, 8.4), Right (5.0, 6.3, 7.3, 7.0)
* Q sub T R U: Left (7.9, 8.3, 7.8, 8.5), Right (6.3, 6.3, 6.5, 7.0)
* S and S sub r: Left (8.9, 9.1, 11.0, 12.4), Right (5.8, 5.6, 5.9, 6.7)
Block 4: T = 500, n = 500
* Q sub B A R: Left (5.0, 5.3, 5.7, 6.4), Right (5.4, 5.3, 5.1, 4.8)
* Q sub P A R: Left (4.9, 5.1, 6.2, 5.6), Right (4.6, 5.4, 5.3, 4.9)
* Q sub Q S: Left (5.3, 5.9, 6.1, 6.3), Right (5.1, 5.3, 4.7, 5.0)
* Q sub D A N: Left (5.4, 5.8, 5.9, 7.3), Right (5.6, 5.4, 5.2, 5.2)
* Q sub T R U: Left (6.4, 6.6, 7.2, 6.7), Right (4.7, 4.5, 5.4, 5.4)
* S and S sub r: Left (7.7, 9.3, 11.8, 12.5), Right (4.2, 4.0, 4.9, 4.9)
We now study the ability of our backtests to detect alternative cases in which we have inadequacy of the systemic risk measures. Although under regularity conditions both
$ Q $
 and
$ {Q}_r $
 enjoy asymptotic unit detection power against divergence from the null hypothesis of measure adequacy, their finite sample powers are not known and thus will be studied and compared in the following. We continue the comparison with existing method, but we focus on the
$ {S}_r $
 backtest since comparison with
$ S $
 would be inaccurate as it is not a robust test. We design a series of experiments.
In the first alternative experiment, we simulate the scenario in which a risk manager specifies an adequate model to estimate and forecast systemic risk, but based on a misspecified risk level. In other words, the risk indicator is forecasted at risk level
$ {\alpha}_1 $
 , but the intended risk level is
$ {\alpha}_2 $
 , with
$ {\alpha}_2\ne {\alpha}_1 $
 . The desired statistical effect is simulated by inducing risk-level mismatch between the risk indicator and its mean in the autocovariance computation, i.e.,

We refer to this experiment as ALTER1, and we note that it also allows us to examine the power of our backtests against the unconditional hypothesis, i.e., the condition
$ \unicode{x1D53C}\left({H}_t\left(\alpha, {\boldsymbol{\phi}}_0\right)\right)=\alpha /2 $
 . We set
$ \left({\alpha}_1,{\alpha}_2\right)=\left(5\%,10\%\right) $
 ; simulation results are reported in Table 2.

Table 2 Long description
The table is organized into four main sections based on T and n values, with columns for m values of 5, 10, 20, and 30 for two different statistical groupings.
Section 1: T = 250, n = 250.
- Group 1 (Q sub B A R, Q sub P A R, Q sub Q S, Q sub D A N, Q sub T R U): Rejection rates range from 20.1 to 34.2. Rates generally increase as m increases from 5 to 30.
- Group 2 (Q sub B A R, Q sub P A R, Q sub Q S, Q sub D A N, Q sub T R U, S sub r): Rejection rates range from 23.9 to 37.0.
Section 2: T = 250, n = 500.
- Group 1: Rejection rates range from 30.2 to 41.1.
- Group 2: Rejection rates range from 32.7 to 46.2.
Section 3: T = 500, n = 250.
- Group 1: Rejection rates range from 19.3 to 33.9.
- Group 2: Rejection rates range from 21.2 to 34.2.
Section 4: T = 500, n = 500.
- Group 1: Rejection rates range from 23.3 to 44.5.
- Group 2: Rejection rates range from 25.7 to 47.0.
Across all sections, the highest rejection rates are consistently found in the Q sub T R U and S sub r rows at m = 30.
We observe the nontrivial rejection power by our backtests, and the power generally increases with the sample size. This is in line with Theorem 2 and Proposition 2. We also observe an increase in rejection rates as
$ m $
 increases. This is due to the time-invariant nature of the misspecification in this experiment as the level of the risk indicator is incorrectly specified across each time period. Because the time scope of all backtests increases in
$ m $
 , with that they naturally capture more evidence against alternatives that persist in time. This results in a higher finite sample rejection rates. We observe that when the TRU kernel is used,
$ {Q}_r $
 yields similar rejection power as
$ {S}_r $
 . This is expected because the
$ {S}_r $
 backtest can be viewed as a special case of our
$ {Q}_r $
 backtest when the TRU kernel is used, as both backtests assign equal weight to each lag order. We also observe the comparable performance across kernels as
$ m>20 $
 . Overall, this experiment highlights that the new backtests possess detection power against divergence from the condition
$ \unicode{x1D53C}\left({H}_t\left(\alpha, {\boldsymbol{\theta}}_0\right)\right)=\alpha /2 $
 , with
$ {Q}_r $
 having slightly better power than
$ Q $
 . The results also highlight that by letting
$ m $
 grow, the detection power of a backtest could increase as it may capture more evidence against divergence from the null.
In the second alternative experiment, we simulate the scenario in which the distribution of the systemic risk model is incorrectly specified. More precisely, systemic risk measures are estimated and forecasted based on risk model (11), but the actual innovation of the data is contaminated as follows:

We refer to this experiment as ALTER2, and we report the rejection rates in Table 3. As is expected, both
$ Q $
 and
$ {Q}_r $
 display rejection power against experiment ALTER2. Because the data are contaminated across each time period, we also observe that the rejection rates increase in
$ m $
 . The equally weighted backtest
$ {S}_r $
 continues to yield comparable power to
$ {Q}_r $
 when the TRU kernel is applied. The performance across kernel functions remains similar for this experiment. Overall, the experiment shows that our backtests possess detection power against inadequate systemic risk forecasts due to distributional misspecification, with
$ {Q}_r $
 having slightly better power than
$ Q $
 .

Table 3 Long description
The table is divided into four horizontal sections based on T and n values. Each section contains two sets of metrics, each evaluated at four levels (5, 10, 20, 30).
Section 1: T = 250, n = 250
* Left metrics (Q sub 1 B A R, Q sub 1 P A R, Q sub Q S, Q sub 1 D A N, Q sub 1 T R U): Rejection rates range from 41.6 to 58.1.
* Right metrics (Q sub 3 B A R, Q sub 3 P A R, Q sub 3 Q S, Q sub 3 D A N, Q sub 3 T R U, S sub r): Rejection rates range from 42.6 to 58.3.
Section 2: T = 250, n = 500
* Left metrics: Rejection rates range from 53.8 to 66.3.
* Right metrics: Rejection rates range from 51.0 to 71.6.
Section 3: T = 500, n = 250
* Left metrics: Rejection rates range from 43.6 to 62.1.
* Right metrics: Rejection rates range from 44.4 to 60.9.
Section 4: T = 500, n = 500
* Left metrics: Rejection rates range from 52.1 to 74.2.
* Right metrics: Rejection rates range from 50.4 to 76.3.
Across all sections, rejection rates generally increase as the column value moves from 5 to 30. The highest rejection rates are observed in the T = 500, n = 500 configuration.
In the third alternative experiment, we simulate the scenario in which we have data dynamics being incorrectly specified. More precisely, systemic risk measures are estimated and forecasted based on risk model (11), but the actual dynamics of
$ {Y}_{i,t} $
 follow the threshold autoregressive process:

We refer to this experiment as ALTER3, and we report the rejection rates in Table 4. We observe our backtests continue to display rejection power that generally increases with the sample size. In contrast to experiments ALTER1 and ALTER2, we observe the rejection rates of all backtests decrease in
$ m $
 . This is because, unlike experiments ALTER1 and ALTER2 in which we have time-invariant misspecification, under experiment ALTER3 we have time-dependent alternative with a particular focus on the first lag in the data dynamics. As a result, increasing the testing scope (i.e., by setting a large
$ m $
 ) may not capture more evidence against such alternative, and instead will reduce the overall evidence captured by the backtests due to the averaging effect across the testing scope. We continue to observe
$ {S}_r $
 yielding comparable power to
$ {Q}_r $
 when the TRU kernel is applied, but their powers are lower than
$ {Q}_r $
 with the downward weighting kernels. This is because a test that assigns more weights to observations at lower lag order is expected to be more efficient against ALTER3, in which we have first-order dynamic misspecification. Across the combinations of
$ \left(T,n\right) $
 , we observe that using the downward weighting kernels alleviates power reduction in
$ m $
 . Interestingly, the finite sample power of our
$ Q $
 backtest is notably higher than that of our
$ {Q}_r $
 backtest. This could be attributed to the fact that
$ Q $
 is not a whitened statistic, and due to that
$ Q $
 preserves data dynamics more effectively and thus it tends to give better power against alternatives driven by dynamic misspecification. To further examine such effect, we carry out another dynamic driven alternative experiment.

Table 4 Long description
The table is organized into four main sections based on sample sizes: T = 250, n = 250; T = 250, n = 500; T = 500, n = 250; and T = 500, n = 500. Each section contains two sets of columns for different statistical tests, each with sub-columns for values 5, 10, 20, and 30.
* Section 1 (T = 250, n = 250):
- Q sub B A R: Left values (20.0, 14.8, 12.1, 10.2), Right values (16.0, 10.6, 8.7, 7.2).
- Q sub P A R: Left values (23.8, 17.0, 11.8, 10.7), Right values (20.7, 12.8, 8.8, 7.8).
- Q sub Q S: Left values (18.4, 12.0, 10.3, 8.3), Right values (14.2, 9.3, 7.5, 5.7).
- Q sub D A N: Left values (19.2, 13.4, 9.6, 9.1), Right values (15.3, 9.7, 7.2, 5.8).
- Q sub T R U: Left values (11.0, 8.1, 5.8, 5.8), Right values (7.3, 6.9, 4.2, 3.9).
- S sub r: Right values (7.3, 6.9, 4.2, 3.9).
* Section 2 (T = 250, n = 500):
- Q sub B A R: Left (31.1, 21.1, 15.0, 12.2), Right (23.5, 14.2, 10.0, 9.0).
- Q sub P A R: Left (37.7, 29.4, 17.6, 14.1), Right (27.0, 18.8, 11.0, 9.2).
- Q sub Q S: Left (30.2, 18.2, 12.0, 8.5), Right (20.4, 11.7, 8.0, 7.4).
- Q sub D A N: Left (30.7, 18.3, 12.0, 8.1), Right (21.4, 11.9, 8.4, 7.6).
- Q sub T R U: Left (17.5, 11.0, 6.8, 5.9), Right (10.7, 6.8, 6.5, 5.9).
- S sub r: Right (10.7, 6.8, 6.5, 5.9).
* Section 3 (T = 500, n = 250):
- Q sub B A R: Left (24.5, 17.8, 13.7, 11.8), Right (17.7, 9.7, 6.5, 6.3).
- Q sub P A R: Left (31.4, 20.6, 14.6, 12.4), Right (24.5, 14.1, 6.6, 6.2).
- Q sub Q S: Left (21.4, 14.6, 11.1, 10.3), Right (15.7, 6.9, 6.1, 5.6).
- Q sub D A N: Left (23.0, 15.6, 8.9, 8.3), Right (15.6, 7.0, 6.0, 5.7).
- Q sub T R U: Left (12.8, 8.6, 9.1, 8.7), Right (6.0, 5.9, 5.4, 4.6).
- S sub r: Right (6.0, 5.9, 5.4, 4.6).
* Section 4 (T = 500, n = 500):
- Q sub B A R: Left (39.9, 32.3, 23.3, 20.4), Right (18.6, 12.0, 10.0, 8.7).
- Q sub P A R: Left (42.4, 36.5, 26.4, 22.2), Right (24.4, 16.8, 10.5, 9.4).
- Q sub Q S: Left (38.0, 27.3, 18.9, 17.4), Right (17.6, 10.7, 8.8, 6.7).
- Q sub D A N: Left (37.9, 28.8, 20.4, 13.9), Right (17.1, 10.4, 8.4, 7.1).
- Q sub T R U: Left (23.9, 16.4, 12.1, 11.6), Right (10.5, 8.0, 5.8, 5.7).
- S sub r: Right (10.5, 8.0, 5.8, 5.7).
In the final experiment, we simulate the scenario in which a risk manager correctly specifies an autoregressive process for the
$ {Y}_{i,t} $
 series, but misses some higher-order and delayed effect. More precisely, systemic risk measures are estimated and forecasted based on risk model (11), but the actual autoregressive dynamics of
$ {Y}_{i,t} $
 admit a delayed effect:

We refer to this experiment as ALTER4, and we report the rejection rates in Table 5. Overall, the power pattern under ALTER4 is similar to that under ALTER3, as we have dynamic driven alternatives in both experiments. We continue to observe the optimality of downward weighting backtests as they generally outperform equally weighted backtests and they alleviate power reduction in
$ m $
 . For instance, in the
$ \left(T,n\right)=\left(\mathrm{500,500}\right) $
 panel, the power given by
$ {Q}_r $
 with downward weighting kernels for
$ m=10 $
 and
$ m=20 $
 is very comparable, whereas the power given by
$ {S}_r $
 shows a clear decline as
$ m $
 increases from 10 to 20.

Table 5 Long description
The table is divided into four main sections based on T and n values. Each section lists rejection rates for test statistics including Q sub B A R, Q sub P A R, Q sub Q S, Q sub D A N, Q sub T R U, and S sub r across columns labeled 5, 10, 20, and 30.
* Section 1 (T = 250, n = 250): Rejection rates for Q sub B A R range from 36.3 to 26.5. Q sub T R U shows the lowest rates, decreasing from 30.4 to 18.5.
* Section 2 (T = 250, n = 500): Rejection rates are generally higher. Q sub B A R ranges from 57.8 to 37.3. Q sub D A N shows a high of 58.6 at column 5.
* Section 3 (T = 500, n = 250): Rejection rates for Q sub B A R are stable, ranging from 37.4 to 34.2. Q sub P A R peaks at 39.1 in column 10.
* Section 4 (T = 500, n = 500): This section shows the highest overall rejection rates. Q sub Q S reaches 60.5 at column 5, while Q sub B A R peaks at 60.5 at column 10.
In all sections, the right-hand side of the table provides corresponding values for a second set of test statistics (denoted with r subscripts), where S sub r values consistently match the Q sub T R U values in the same block.
Summing up the simulation study, the proposed
$ Q $
 and
$ {Q}_r $
 backtests show robustness against estimation risk to display reasonable finite sample sizes, and they demonstrate nontrivial detection power against alternatives of different natures. Setting a large
$ m $
 yields better power against alternatives that are of time-invariant nature but the opposite is observed against alternatives that are of time-dependent nature. In this aspect, downward weighting backtests such as
$ Q $
 and
$ {Q}_r $
 are optimal as they alleviate power reduction in
$ m $
 . Thus, the power improvement offered by the new backtests is more significant under the time-dependent alternatives. Against alternatives driven by dynamic misspecification, we find that the standardized backtest
$ Q $
 – which preserves data dynamics more effectively – tends to yield better power than the whitened backtest
$ {Q}_r $
 . We also find that under the time-invariant alternatives whitened backtest gives slightly better power than standardized backtest. Overall, the new backtests demonstrate complementary capacities.
IV. Empirical Evidence
A. Data
While the performance of the new backtests (
$ Q $
 and
$ {Q}_r $
 ) has been demonstrated using simulated data, it is equally important to verify their performance using real-world data. In this section, we apply the new backtests to examine the reliability of systemic risk forecasts issued by major financial institutions. For consistency with existing literature, we focus on large U.S. institutions, i.e., we follow Brownlees and Engle (Reference Brownlees and Engle2017) and Banulescu-Radu et al. (Reference Banulescu-Radu, Hurlin, Leymarie and Scaillet2021) to use institutions with market capitalization greater than five billion dollars as of the end of June 2007. The names and CRSP tickers of the selected institutions are tabulated in Appendix G of the Supplementary Material. We collect institutional observations dating from early 2000 to late 2022, so that we also study the more recent pandemic-induced financial market crashes. More precisely, we use daily observations from Jan. 3, 2000 to Dec. 1, 2022. Our data set is naturally unbalanced because not every institution has been trading continuously over the study period. For instance, in 2008, Bear Stearns and Lehman Brothers collapsed over the subprime financial crisis. We compute daily log-returns and market capitalization for the selected institutions using the CRSP database, and we consider as market return the daily log-return of the CRSP value-weighted market index.
At any given time period over the full sample, we examine for all available institutions the reliability of their systemic risk forecasts provided the required out-sample data are available. When moving our analysis across time periods, we use expanding window scheme to make full use of in-sample data availability. More precisely, we use two years of daily observations as the initial in-sample (i.e., from January 2000 to January 2002), and the sample length increases as we move forward with our analysis on a monthly basis. Thus, our in-sample size
$ T $
 contains at least two years of data which is approximately 500 observations.
We use testing parameters guided by our simulation study. The statistical significance level of all backtests is kept at 5%. We maintain
$ \alpha =5\% $
 . For any given institution, we model its in-sample return series using the same risk model and the same estimation procedure implemented in the simulation study. This yields parameter estimates of the risk model
$ {\hat{\boldsymbol{\phi}}}_T $
 , which then allows us to forecast the risk indicator series
$ {H}_t\left(\alpha, {\hat{\boldsymbol{\phi}}}_T\right) $
 , for
$ t=T+1,\dots, T+n $
 . For this purpose, we need to select the out-sample size
$ n $
 , and we note that a value too large for this parameter would reduce the period available for examination. For instance, to backtest one (three) year(s) of out-sample forecasts in 2021 would require observed data up to 2022 (2025). We use
$ n=250 $
 , which is about 1 year of out-sample data. We then compute our backtests to examine if the generated systemic risk forecasts are reliable. Both
$ Q $
 and
$ {Q}_r $
 backtests are used as we learn about their complementary capacities from the simulation study. As a benchmark for existing methodology, we include the Box–Pierce-type backtest by computing
$ {S}_r $
 . We use downward weighting kernel for our backtests, and for natural comparison with
$ {S}_r $
 we use the Bartlett kernel because it belongs to the class of truncated kernel. Regarding kernel parameter, we use both the lowest and the highest values covered in the simulation study (i.e.,
$ m=\left(5,30\right) $
 ). In a typical monthly analysis, we backtest the systemic risk forecasts issued by each institution so long as the required data are available. Accordingly, in each monthly analysis, we apply Bonferroni correction to the backtesting significance level based on the number of backtested institutions for that month.Footnote
4
B. Backtesting Results
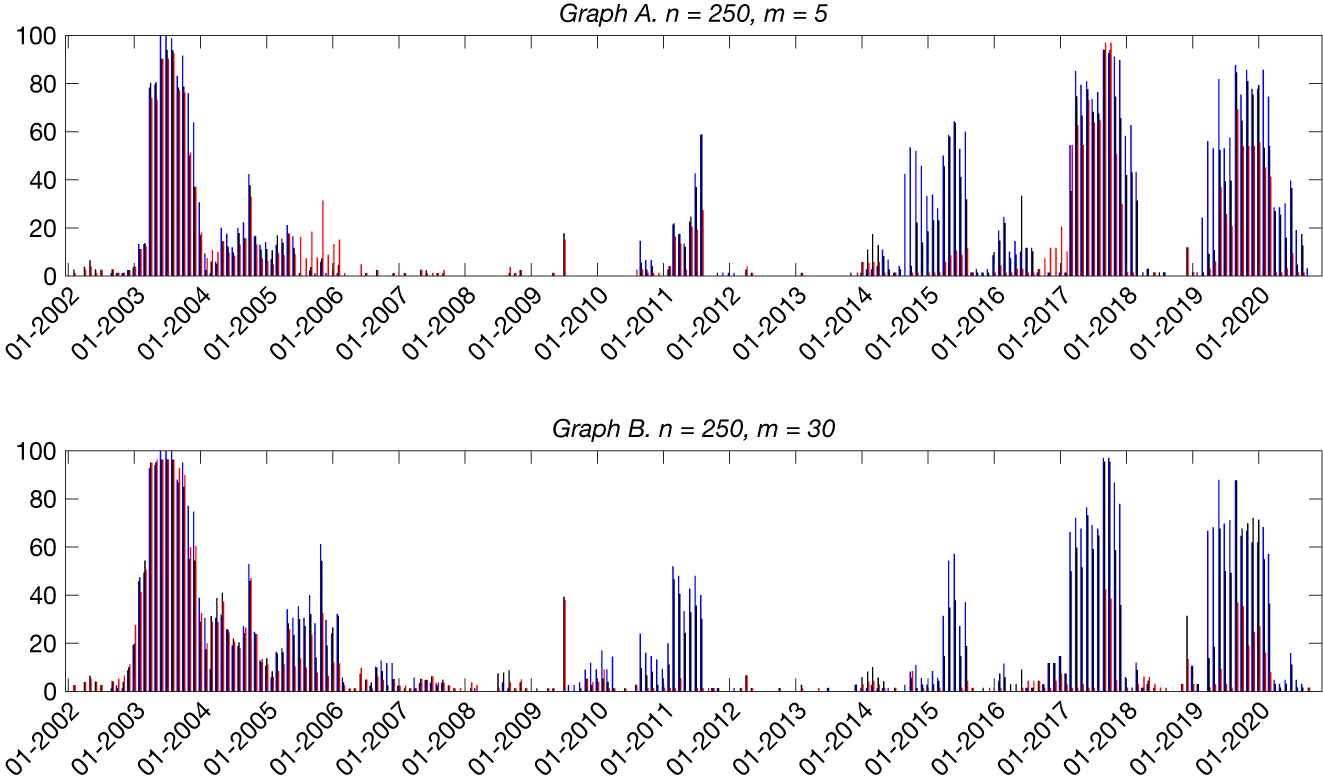
Figure 1 plots on a monthly basis the percentage of institutions with inadequate systemic risk forecasts detected by the
$ Q $
 backtest (depicted in blue), the
$ {Q}_r $
 backtest (depicted in black), and the
$ {S}_r $
 backtest (depicted in red). We observe that compared with
$ {S}_r $
 both the new backtests have higher detection frequencies over inadequate systemic risk forecasts as the blue and black bars dominate their red counterparts on many occasions. This finding holds for both
$ m $
 . We also observe several sizeable clusters in the plot, which we highlight and discuss in the following because these clusters imply that the systemic risk forecasts of many major institutions are inaccurate and unreliable.
Figure 1 plots on a monthly basis the percentage of institutions with inadequate systemic risk forecasts detected using the
$ Q $
 backtest (depicted in blue), the
$ {Q}_r $
 backtest (depicted in black), and the
$ {S}_r $
 backtest (depicted in red). The out-sample size is denoted by
$ n $
 . Backtesting significance level is 5% with Bonferroni correction applied for every monthly analysis. The Bartlett kernel is used for
$ Q $
 and
$ {Q}_r $
 with kernel parameter
$ m $
 .

Figure 1 Long description
The figure consists of two vertically stacked panels, Graph A and Graph B. Both panels share a horizontal X-axis representing time from January 2002 to January 2020 and a vertical Y-axis representing the percentage of institutions from 0 to 100. Each month contains three colored bars: blue, black, and red.
* Graph A (n = 250, m = 5): Shows high rejection rates peaking near 100 percent between 2003 and 2004. Rates remain low until a moderate spike in 2011, followed by significant volatility and high peaks between 2014 and 2016, and again from 2017 to 2018. A final large cluster of high rejection rates appears in 2019.
* Graph B (n = 250, m = 30): Displays a similar temporal pattern to Graph A but with slightly different magnitudes in the peaks. The 2003 to 2004 peak is broader and more sustained. The spikes in 2011, 2015, and 2017 to 2018 are prominent, with the blue bars often reaching higher than the red or black bars during these periods of systemic risk forecast inadequacy.
In both graphs, the periods of 2006 to 2010 and 2012 to 2014 show near-zero rejection rates across all three backtests.
In the cluster between January 2003 and January 2004, the performance of all backtests is rather similar. More precisely, the monthly average rejection frequencies by
$ Q $
 ,
$ {Q}_r $
 , and
$ {S}_r $
 are, respectively, 64%, 56%, and 54%, at
$ m=5 $
 . When
$ m=30 $
 , the average rejection rates are 75%, 70%, and 72% for
$ Q $
 ,
$ {Q}_r $
 , and
$ {S}_r $
 , respectively. In this cluster, we observe for all three backtests an increase in rejection frequencies as
$ m $
 increases. This is consistent with our expectation that by increasing the
$ m $
 parameter, the testing scope of a backtest increases, which in turn may lead to the backtest detecting a more diverse forms of systemic risk inadequacy. Economically, the tall 2003–2004 cluster suggests that the risk forecasts of many institutions for the period 2004–2005 were highly inadequate. This reflects the 2004–2005 credit deterioration of the U.S. market, which at its height saw the credit deterioration of several major U.S. entities such as General Motors to the junk status. Besides, the finding could also be attributed to the fact that the DCC-GARCH specification is simply not a suitable model for systemic risk as far as this period is concerned. In practice, risk managers should consider revising the model or using alternative specifications.
In the cluster between January 2004 and January 2006, the monthly average rejection frequencies by
$ Q $
 ,
$ {Q}_r $
 , and
$ {S}_r $
 are, respectively, 12%, 10%, and 13%, at
$ m=5 $
 . When
$ m=30 $
 , the rejection rates are 27%, 26%, and 20% for
$ Q $
 ,
$ {Q}_r $
 , and
$ {S}_r $
 , respectively. Similar to the previous cluster, we observe an increase in rejection frequencies across all backtests when
$ m $
 is large. When
$ m=5 $
 ,
$ {S}_r $
 has slightly better performance over
$ Q $
 and
$ {Q}_r $
 , which reverses when
$ m=30 $
 . The reason as to why the detection rate of
$ {S}_r $
 does not catch up with our backtests is likely due to it losing some power when checking a larger scope, a phenomenon too observed in our simulation study. By contrast, the rejection rates of the new backtests increase and outperform
$ {S}_r $
 . This highlights that the empirical alternatives captured with a large
$ m $
 could offset the potential loss in power when the backtest is properly weighted according to empirical stylized facts. We obtain similar conclusions for the cluster between January 2011 and July 2011.
We now discuss the remaining major clusters of model inadequacy, i.e., the cluster between July 2014 and July 2015, the 2017 cluster, and the cluster beyond January 2019. The precise monthly average rejection frequencies by (
$ Q $
 ,
$ {Q}_r $
 ,
$ {S}_r $
 ) in the July 2014–July 2015 cluster are (40%, 24%, 3%) at
$ m=5 $
 , and (16%, 9%, 1%) at
$ m=30 $
 . In the 2017 cluster, the rejection frequencies by (
$ Q $
 ,
$ {Q}_r $
 ,
$ {S}_r $
 ) are (68%, 59%, 52%) at
$ m=5 $
 , and (62%, 51%, 8%) at
$ m=30 $
 . The tall 2017 cluster suggests that the DCC-GARCH specification may not be a suitable model to forecast systemic risk for 2018, which could be due to the fact that this period witnessed several major international political events such as the U.S.–China trade war and the U.K.’s Brexit. In the cluster beyond January 2019, the rejection frequencies by (
$ Q $
 ,
$ {Q}_r $
 ,
$ {S}_r $
 ) are (44%, 32%, 20%) at
$ m=5 $
 , and (37%, 29%, 8%) at
$ m=30 $
 . Given that the cluster beyond January 2019 coincides with the run-up to the pandemic-induced market crashes, we highlight the nontrivial under detection of
$ {S}_r $
 compared with the new backtests. In particular,
$ {S}_r $
 under detects 24% (12%) compared with
$ Q $
 (
$ {Q}_r $
 ) at
$ m=5 $
 , and 29% (21%) compared with
$ Q $
 (
$ {Q}_r $
 ) at
$ m=30 $
 . The prominence of the new backtests over
$ {S}_r $
 holds in the other two clusters regardless of
$ m $
 . Although all three backtests suffer some power reduction in
$ m $
 , it is minimal for the new backtests. This further highlights the optimality of our backtests in the tradeoff between losing detection power and detecting a wider alternatives as the testing scope increases.
To see the economic implications brought by the new backtests on a greater scale, we note that in any given month over the full examination period, we backtest an average of 74 financial institutions. We further note the monthly average rejection rates by (
$ Q $
 ,
$ {Q}_r $
 ,
$ {S}_r $
 ) over the full examination period are (18%, 15%, 11%) at
$ m=5 $
 , and (18%, 16%, 9%) at
$ m=30 $
 . Compared with
$ Q $
 ,
$ {S}_r $
 under detects
$ 7\%\hskip0.3em \mathrm{per}\hskip0.3em \mathrm{month}\times 228\hskip0.3em \mathrm{month}\mathrm{s}\times 74\hskip0.3em \mathrm{institutions}=1181 $
 cases over the course of our empirical study when
$ m=5 $
 . When
$ m=30 $
 ,
$ {S}_r $
 under rejects 1518 (1181) cases compared with
$ Q $
 (
$ {Q}_r $
 ). We note from these numbers that the improvement of our backtests over
$ {S}_r $
 is of considerable economic significance, since, if the new backtests are used instead of
$ {S}_r $
 , a larger scale of inadequate systemic risk forecasts would have been detected among major financial institutions. These additional cases could play a critical role in prompting regulatory attention, which could call for a full-scale revision of existing systemic risk modeling in the wider economy, which in turn would improve financial stability.
Although the average findings may suggest
$ Q $
 regularly outperforms
$ {Q}_r $
 , we highlight that in some instances such as the January 2013–July 2013 period,
$ {Q}_r $
 has detected alternatives not captured by
$ Q $
 . This is in line with our simulation findings. The complementary performance of
$ {Q}_r $
 and
$ Q $
 can be attributed to them generally not capturing the same dynamics about systemic risk inaccuracy, since the former is a whitened test, whereas the latter is not. Thus, when examining the overall health of the financial system in practice, regulators could apply the formula
$ \max \left(Q,{Q}_r\right) $
 to detect as many indications about large-scale measure inadequacies of systemic risk as possible. This provides a “better-safe-than-sorry” approach which is recently advocated by the European Central Bank (see, e.g., Rehn (Reference Rehn2020), Enria (Reference Enria2022)).
One could argue that the empirical performance of the new backtests is only evident for a relatively small
$ n $
 , and that the performance of all backtests would be very comparable when
$ n $
 increases. To examine the sensitivity of our main findings, we repeat the backtesting analysis with a larger
$ n=500 $
 , and we plot the results in Figure 2. Due to the more demanding out-sample size, the time dimension of Figure 2 naturally reduces slightly compared with that of Figure 1. By the same reasoning, the average number of institutions qualified for examination reduces to 73. Compared with Figure 1, we observe an increase in rejection frequencies across all backtests. This is in line with Theorem 2 and Proposition 2 that the power of our backtests is expected to increase in
$ n $
 . We also observe that the overall rejection pattern for all backtests is similar to that in Figure 1, with the new backtests continue to outperform existing backtest. More precisely, the monthly average rejection rates over the full sample by (
$ Q $
 ,
$ {Q}_r $
 ,
$ {S}_r $
 ) are (29%, 24%, 17%) at
$ m=5 $
 , and (30%, 26%, 13%) at
$ m=30 $
 . The economic implications offered by the new backtests are now more evident, as for instance,
$ {S}_r $
 under rejects 2,681 (2,050) cases compared with
$ Q $
 (
$ {Q}_r $
 ) at
$ m=30 $
 . Unlike
$ {S}_r $
 , we note the rejection rates of
$ Q $
 and
$ {Q}_r $
 are similar across
$ m $
 , which highlights once again the optimality of our backtests as they give optimal tradeoff in
$ m $
 .
Figure 2 plots on a monthly basis the percentage of institutions with inadequate systemic risk forecasts detected using the
$ Q $
 backtest (depicted in blue), the
$ {Q}_r $
 backtest (depicted in black), and the
$ {S}_r $
 backtest (depicted in red). The out-sample size is denoted by
$ n $
 . Backtesting significance level is 5% with Bonferroni correction applied for every monthly analysis. The Bartlett kernel is used for
$ Q $
 and
$ {Q}_r $
 with kernel parameter
$ m $
 .

Figure 2 Long description
The image consists of two vertically stacked bar charts, labeled Graph A and Graph B. Both charts share the same axes. The y-axis represents the percentage of institutions with inadequate systemic risk forecasts, ranging from 0 to 100. The x-axis represents time in monthly increments from January 2002 to January 2019. Each month contains three colored bars: blue for the J C B R I C Q backtest, black for the J C B 7 U X 1 f c i backtest, and red for the J C B 7 U 3 1 f c i backtest.
* Graph A (n = 500, m = 5): Shows high rejection rates (near 100 percent) between 2003 and 2004 across all backtests. Rates remain low from 2005 to 2009, followed by a moderate increase in blue and black bars around 2011. From 2014 to 2019, there is a significant upward trend, with blue bars frequently reaching 80 percent and red bars showing a secondary peak around 2017.
* Graph B (n = 500, m = 30): Displays a similar overall profile to Graph A but with higher volatility in the blue bars during the 2005 to 2008 period. The peak in 2003 to 2004 remains at 100 percent. The late-period trend (2016 to 2019) shows blue bars dominating with values between 60 and 80 percent, while red bars remain significantly lower than in Graph A during the same period.
To ensure that the empirical performance of the new backtests is not driven by a specific choice of kernel function, we repeat every backtesting analysis using the QS kernel, which, unlike the BAR kernel, belongs to the class of kernel with unbounded support. Figure 3 plots the analysis results for every empirical setting considered thus far. The results suggest that our main findings are highly robust as the prominence of
$ Q $
 and
$ {Q}_r $
 over existing backtest remains highly evident. This highlights, as with our simulation evidence, that the choice of kernel does not have a strong impact over the performance of our backtests so long as the kernel function is downward weighting.
Figure 3 plots on a monthly basis the percentage of institutions with inadequate systemic risk forecasts detected using the
$ Q $
 backtest (depicted in blue), the
$ {Q}_r $
 backtest (depicted in black), and the
$ {S}_r $
 backtest (depicted in red). The out-sample size is denoted by
$ n $
 . Backtesting significance level is 5% with Bonferroni correction applied for every monthly analysis. The Quadratic-Spectral kernel is used for
$ Q $
 and
$ {Q}_r $
 with kernel parameter
$ m $
 .

Figure 3 Long description
A multi-panel figure consisting of four vertically stacked bar charts labeled Graph A through Graph D.
* Common Axes: The vertical y-axis represents the percentage of institutions with inadequate systemic risk forecasts, ranging from 0 to 100. The horizontal x-axis represents time in monthly increments from January 2002 to January 2020.
* Data Series: Each graph contains three overlapping bar series. Blue bars represent the J C B R I C Q backtest. Black bars represent the J C B 7 U X 1 f r i backtest. Red bars represent the J C B 7 U 3 1 f r i backtest.
* Panel A (n = 250, m = 5): Shows high rejection rates around 2003 to 2004, reaching near 100 percent. Smaller peaks occur around 2005, 2011, 2015, and a significant sustained peak from 2017 to 2018.
* Panel B (n = 250, m = 30): Displays a similar temporal pattern to Graph A but with slightly smoothed or lower peaks in the 2010 to 2015 period.
* Panel C (n = 500, m = 5): Shows a very high, dense rejection period between 2003 and 2004. Rejection rates are notably higher and more sustained in the blue series from 2014 through 2019 compared to the n = 250 panels.
* Panel D (n = 500, m = 30): Similar to Graph C, showing the highest density of rejections in the early 2000s and late 2010s, with the blue series consistently showing higher rejection rates than the black or red series in the latter half of the timeline.
Finally, we perform a robustness analysis by whitening
$ {\hat{\rho}}_n(j) $
 up to the same order as the kernel parameter, i.e., we have
$ {\hat{\rho}}_n(j) $
 being whitened up to order
$ m $
 , which we denote by
$ {\hat{\rho}}_{nrm}(j) $
 ,
$ j=1,\dots, m $
 . Such partial whitening does not affect the computation of truncated whitened backtests such as
$ {S}_r $
 and
$ {Q}_r $
 with a truncated kernel. In particular,
$ {\hat{\rho}}_{nrm}(j) $
 is the
$ j $
 th element of the vector
$ {\hat{\varDelta}}_m^{-1/2}{\hat{\boldsymbol{\rho}}}_n^{(m)} $
 , where
$ {\hat{\boldsymbol{\rho}}}_n^{(m)} $
 collects
$ {\left\{{\hat{\rho}}_n(j)\right\}}_{j=1}^m $
 , and
$ {\hat{\varDelta}}_m $
 is a
$ m\times m $
 matrix with the same
$ \left(i,j\right) $
 th element as that in
$ \hat{\varDelta} $
 . The Box–Pierce-type statistic based on
$ {\hat{\rho}}_{nrm}(j) $
 is given by
$ {S}_r=n{\sum}_{j=1}^m{\hat{\rho}}_{nrm}^2(j) $
 . For proper comparison, we also use
$ {\hat{\rho}}_{nrm} $
 in our whitened backtest
$ {Q}_r $
 with the Bartlett kernel. We plot the results in Figure 4, and we can see that the rejection patterns are very similar to those in Figures 1 and 2. The improvement brought by the new backtests remains highly evident and robust.
Figure 4 plots on a monthly basis the percentage of institutions with inadequate systemic risk forecasts detected using the
$ Q $
 backtest (depicted in blue), the
$ {Q}_r $
 backtest (depicted in black), and the
$ {S}_r $
 backtest (depicted in red). The out-sample size is denoted by
$ n $
 . Backtesting significance level is 5% with Bonferroni correction applied for every monthly analysis. The Bartlett kernel is used for
$ Q $
 and
$ {Q}_r $
 with kernel parameter
$ m $
 .
$ {Q}_r $
 and
$ {S}_r $
 are computed using
$ {\hat{\rho}}_{nrm}(j) $
 .

Figure 4 Long description
The multi-panel figure consists of four bar charts labeled Graph A through Graph D. Each chart shares a common y-axis representing the percentage of institutions from 0 to 100 and an x-axis representing time from January 2002 to January 2020. Each month contains three colored bars: blue for J C B R I C Q, black for J C B 7 U X 1 f c i k, and red for J C B 7 U 3 1 f c i k.
* Graph A (n = 250, m = 5): Shows high rejection rates (near 100 percent) around 2003 to 2004 and 2017 to 2018. Rejection rates are generally lower between 2006 and 2014.
* Graph B (n = 250, m = 30): Displays similar peaks to Graph A but with slightly more volatility in the black and blue bars during the 2015 to 2020 period.
* Graph C (n = 500, m = 5): Shows a sustained high rejection rate for the blue and black tests from 2016 onwards, while the red test remains significantly lower in that same period.
* Graph D (n = 500, m = 30): Exhibits the most dense rejection activity, with the blue and black bars frequently exceeding 60 percent from 2016 to 2020, while the red bars show minimal activity in the latter half of the timeline.
Across all graphs, a major spike in rejection rates for all three tests occurs between 2003 and 2004, corresponding to a period of high systemic risk detection.
C. Summary and Regulatory Implications
In summary, using real-world data generated by the major U.S. financial institutions, we find that, compared with existing approach, the new backtests
$ Q $
 and
$ {Q}_r $
 offer better empirical power as they reveal thousands more cases of systemic risk inadequacies. Such improvement is also of considerable economic significance. Our findings remain robust under a series of sensitivity analyses including using alternative kernel parameters, alternative sample sizes, and alternative kernel classes. Because of their complementary features,
$ Q $
 and
$ {Q}_r $
 can be applied together to detect as many indications about large-scale measure inadequacies of systemic risk as possible. This provides a useful “better-safe-than-sorry” approach for financial supervisors and regulators.
We acknowledge that despite being estimated from an inadequate risk model, systemic risk measures may still be useful in, e.g., ranking financial institutions by their systemic relevance. This can be attributed to ranking operations being impartial to effects that are uniform across all institutions such as inaccuracy from using the same (inadequate) risk model. Using the same risk model for a group of institutions is also fairly standard in the academic literature (see, e.g., Brownlees and Engle (Reference Brownlees and Engle2017), Banulescu-Radu et al. (Reference Banulescu-Radu, Hurlin, Leymarie and Scaillet2021)). In reality, however, each financial institution usually has its own proprietary risk model, which is regularly tested for accuracy and is subject to ongoing refinement. In this aspect,
$ Q $
 and
$ {Q}_r $
 serve as new statistical tools for checking, with better power, whether a risk model can be further improved to produce more accurate systemic risk estimates. With more accurate risk estimates across all financial institutions, financial stability will improve as a collective result.
V. System Warning Indicator
In the spirit of Gourieroux and Zakoïan (Reference Gourieroux and Zakoïan2013) and Lazar and Zhang (Reference Lazar and Zhang2019), BHLS propose a system indicator by solving the following quadratic program:

The idea is based on correcting the
$ n $
 forecasting errors in the forecasted risk series
$ {H}_{T+j}\left(\alpha, {\hat{\boldsymbol{\phi}}}_T\right) $
 , for
$ j=1,\dots, n $
 . Because the margin of error across a forecasted series is generally nonuniform – in particular, the next-period forecast is expected to be more accurate with a smaller margin of error than the forecast multiple periods ahead – assigning equal weight to correct each of the
$ n $
 forecasts in equation (14) regardless of the magnitude of their expected errors may not be optimal. Therefore, an improved objective function is one that assigns nonuniform weights for the error corrections. Using the kernel tools introduced so far, we can conveniently generalize equation (14) as follows:

When
$ k $
 is set as the TRU kernel, we retrieve the program objective in equation (14). We propose to use here downward weighting kernels such as the BAR function. When the systemic risk model is perfectly specified, the objective function (15) gives
$ {\alpha}_c=\alpha $
 regardless of the kernel functions used. When otherwise, the uniformly weighted function gives
$ {\alpha}_c $
 that aims to adjust with the same magnitude each of the
$ n $
 forecasts. Using the recommended kernel, the objective function yields
$ {\alpha}_c $
 that aims to adjust with smaller magnitude the immediate forecasts and appropriately with greater magnitude the forecasts
$ n $
 steps ahead. The
$ {\alpha}_c $
 obtained under our approach gives a closer match in correcting the expected forecasting errors, and thus an indicator based on our
$ {\alpha}_c $
 is expected to reflect more accurately the state of the financial system.
To build a warning indicator, we quantify as with BHLS the deviation between the forecasted measure
$ {MES}_{Y1,t+1}\left(\alpha, {\hat{\boldsymbol{\phi}}}_T\right) $
 and the adjusted measure
$ {MES}_{Y1,t+1}\left({\alpha}_c,{\hat{\boldsymbol{\phi}}}_T\right) $
 , i.e.,

To interpret
$ {EWI}_t\left(\alpha, {\alpha}_c\right) $
 , we note that MES is typically negative valued because an institution is expected to make a loss rather than a profit whenever the broader system is in distress. Hence, with the convention that risk is associated with losses rather than profits, a positive
$ {EWI}_t\left(\alpha, {\alpha}_c\right) $
 indicates an unexpected increase in systemic risk, whereas a negative
$ {EWI}_t\left(\alpha, {\alpha}_c\right) $
 indicates an unexpected decrease in systemic risk. As with BHLS, we use
$ n=250 $
 .
To illustrate on the system-wide scale the empirical unexpected deviation in systemic risk, we plot in Figure 5 the
$ {\overline{EWI}}_t\left(\alpha, {\alpha}_c\right) $
 indicator, which is calculated by summing the individual
$ {EWI}_t\left(\alpha, {\alpha}_c\right) $
 of each institution studied previously. The sum is then scaled by the number of institutions to ensure meaningful comparison across the time dimension. For comparison we plot in black the indicator based on the BAR kernel, and in red the indicator based on the TRU kernel. As discussed, the latter retrieves the program objective in BHLS.
Figure 5 plots the
$ {\overline{EWI}}_t\left(\alpha, {\alpha}_c\right) $
 indicator on a monthly basis. The black (red) line is based on
$ {\alpha}_c $
 obtained by solving the quadratic program (15) using the Bartlett (Truncated Uniform) kernel.

Figure 5 Long description
The vertical Y-axis ranges from 0 to 200 in increments of 20. The horizontal X-axis displays dates from 01-2002 to 01-2020 in yearly increments. Two lines, one black and one red, track closely together near the zero baseline for most of the timeline.
Significant spikes occur at three points.
* The first major peak is in early 2008 where the black line reaches approximately 170 and the red line reaches approximately 120.
* A smaller secondary peak occurs in late 2010 with the black line near 20 and the red line near 10.
* The highest peak occurs in late 2019 where the black line spikes to nearly 200 and the red line reaches approximately 140.
Between these peaks, both lines remain relatively flat and overlapping near the zero mark. The black line consistently shows higher volatility and higher peak values than the red line during periods of indicator activity.
We observe for the most part that both indicators are stable with very similar values. This is in line with our expectation that weighting functions do not play a major role in times where the net unexpected systemic risk among all institutions is close to zero. We observe the expected positive spikes before both the 2008 subprime-induced market crash and the 2020 pandemic-induced market crash. The warning indicators capture the large-scale unexpected increase in systemic risk among the major financial institutions. In other words, the number of institutions with unexpected increase in systemic risk far exceeds that with unexpected decrease in systemic risk. More notably, our indicator yields warning signals that are more profound by reacting more acutely and sharply prior to both crises. In particular, compared with existing indicator, the warning signals transmitted by our indicator prior to both 2008 and 2020 market crashes are about 40% more alarming! This finding shows that by matching more closely with the expected forecasting errors, our indicator yields warning signals that are more noticeable to the regulators. This finding is especially significant in hindsight because the U.S. financial system indeed witnessed two major and unprecedented crises following steep spikes in the proposed indicator. For instance, the subprime-induced system instability in 2008 saw the collapse of major institutions such as Bear Stearns and Lehman Brothers, whereas the pandemic-induced system instability in 2020 saw the U.S. stock market facing a series of crashes and large-scale trading halts.
It could be noted that the pattern of model inadequacies in Section IV is not fully aligned with the pattern of the
$ {\overline{EWI}}_t\left(\alpha, {\alpha}_c\right) $
 indicator in Figure 5. For instance, the
$ {\overline{EWI}}_t\left(\alpha, {\alpha}_c\right) $
 indicator is rather tranquil during the 2003–2004 credit crisis, whereas the 2007–2008 subprime crisis is not associated with inadequate modeling. First, we note that the adjustment in equation (15) is only based on a particular condition of systemic risk inadequacy that new backtests could detect. The measure inadequacies reflected in Section IV could be due to other statistical properties being violated such as serial correlation. Second, the
$ {\overline{EWI}}_t\left(\alpha, {\alpha}_c\right) $
 indicator is purely a mathematical operation that aggregates a series of deviations described by equation (16), where each individual deviation need not be statistically significant to be considered. In summary, while the new backtests focus on gauging the adequacy of individual risk modeling in the statistical sense, when monitoring the overall financial health, both statistical-based measures (e.g., the proposed backtests) and mathematical-based measures (e.g., the proposed warning indicator) should be consulted.
Finally, we perform several sensitivity analyses to ensure that our main findings are robust. We confirm that setting a larger out-sample size (e.g.,
$ n=500 $
 ) and that using an alternative class of kernel (e.g., the QS function) do not alter the main findings.
VI. Conclusion
This article offered two classes of novel backtests for checking the adequacy of well-known systemic risk measures. The asymptotic properties of the new backtests were established under regularity conditions. The article demonstrated the consistency of the new backtests, and showed that both backtests follow the standard normal null distribution even in the presence of estimation risk. The article conducted extensive simulation and empirical exercises to verify the improvement brought by the new backtests over existing method. Simulation evidence confirmed the optimality of the new backtests as they gave optimal tradeoff between losing detection power and detecting a wider alternatives as the testing scope increases. The empirical study highlighted the economic significance brought by the new backtests as the evidence suggested that the new backtests would have detected a larger scale of inadequate systemic risk modeling among the major financial institutions. Finally, the article offered an early warning indicator which, when compared with existing indicator, yielded more profound warning signals prior to both the 2008 subprime-induced and the 2020 pandemic-induced market crashes.
Supplementary Material
To view supplementary material for this article, please visit http://doi.org/10.1017/S0022109025102421.