


I. Introduction
Corporate insiders may buy or sell their firms’ stocks for various reasons, which could range from diversification motives or liquidity considerations to regulatory aspects or signaling effects to perceived or actual informational advantages. Given these possible motives and constraints, a large literature proposes a broad range of methods and ideas to extract the information-driven component. In this study, we composite a variety of these information-driven measures into an overall proxy at the firm-month level, document its performance in a global context, and analyze its economic drivers.
Existing work has mostly focused on individual signals to separate informative trades from noise. For example, if trades by multiple insiders go in the same direction (Alldredge and Blank (Reference Alldredge and Blank2019)), then the likelihood of information-based as opposed to personal motives might, all else equal, be higher. A similar argument can be made for insiders with a high trading frequency and, therefore, a short investment horizon (Akbas, Jiang, and Koch (Reference Akbas, Jiang and Koch2020)). The historical profitability of trades prior to earnings announcements may indicate a private information advantage (Ali and Hirshleifer (Reference Ali and Hirshleifer2017)). Firms with high R&D expenditures (Aboody and Lev (Reference Aboody and Lev2000)) or high idiosyncratic volatility (Jagolinzer, Larcker, and Taylor (Reference Jagolinzer, Larcker and Taylor2011), Ben-David, Kim, Moussawi, and Roulstone (Reference Ben-David, Kim, Moussawi and Roulstone2023)) are more difficult to value, thus potentially resulting in higher insider trading profits. Nevertheless, due to the focus on individual signals and, furthermore, on the U.S. market, the literature remains partially fragmented. Several questions on how markets incorporate information from corporate insiders have not yet been conclusively resolved. How can these numerous economically plausible and conceptually diverse trading signals be integrated into a unified framework? How successful are such composite, information-based approaches? What additional insights can be gained from a global analysis? What are the economic determinants of the performance of information-driven insider trading? As outlined subsequently, our analysis aims to contribute to a more nuanced understanding of these issues.
Specifically, our first contribution to the literature is to propose straightforward and intuitive composite measures and to study their benefits and limitations. We test and largely confirm the hypothesis that the signal-to-noise ratio for information-driven trades can be improved if we synthesize many individual measures (see Section III.A for an overview) at the firm-month level. Therefore, we attempt to combine different trading patterns as well as multiple insider and firm characteristics, which have been largely considered in isolation in the literature so far, into a more precise overall firm-level measure of informed trading to predict abnormal returns. In total, we consider 16 information-driven buy proxies and 17 information-driven sell proxies. Note that both the composite method and its goal conceptually differ from existing approaches that construct bottom-up measures of total insider trading activity to predict the market return (e.g., Seyhun (Reference Seyhun1988), Lakonishok and Lee (Reference Lakonishok and Lee2001), Brochet (Reference Brochet2019), and Malliouris, Vermorken, and Vermorken (Reference Malliouris, Vermorken and Vermorken2022)). In contrast, we composite individual cross-sectional methods to identify information-driven trades with the goal of predicting abnormal performance in the cross section of (international) stocks.
The second contribution is an analysis on a global scale, since the literature on information-driven insider measures has so far mostly concentrated on the U.S. market. Non-U.S. countries on average account for 75% of the global gross domestic product and 60% of the world market capitalization during our sample period from 2000 to 2021Footnote 1 and differ from the U.S. market in a variety of ways.Footnote 2 A more comprehensive view thus helps to provide insight into the existence and determinants of information-driven trades. In total, we analyze 3.7 million daily aggregated insider transactions from more than 350,000 insiders in 34 countries. Although there are studies on international or global insider trading, such as Durnev and Nain (Reference Durnev and Nain2007), Dardas and Güttler (Reference Dardas and Güttler2011), Fidrmuc, Korczak, and Korczak (Reference Fidrmuc, Korczak and Korczak2013), Gebka, Korczak, Korczak, and Traczykowski (Reference Gebka, Korczak, Korczak and Traczykowski2017), Brochet (Reference Brochet2019), and Hong, Li, and Zhu (Reference Hong, Li and Zhu2019), they have a different focus. Exceptions include Giamouridis, Liodakis, and Moniz (Reference Giamouridis, Liodakis and Moniz2008) and Dardas (Reference Dardas2012), who employ multivariate regression models with firm and insider characteristics to identify “high conviction” insider trades in the United Kingdom and Western Europe, respectively. Our third contribution is to analyze the potential channels behind the performance of the composite approaches, in part by making use of cross-country heterogeneity.
The baseline composition approach, which we later benchmark against more complex methods, is straightforward. In each firm-month, we count how many of the presumably information-driven buy proxies are observed and subtract the number of observable sell signals.Footnote
3 If the resulting difference is greater than or equal to
$ N $
 (less than or equal to
$ -N $
 ), we assume that there is a composite information-driven buy (sell) signal and consequently buy (sell) and hold the stock in the next calendar month, that is, we assume a one-month holding period. In the baseline analysis, we set
$ N $
 to (only) 2 to achieve a balance between signal strength (and its presumed implication for abnormal returns) and signal frequency (and its implications for sample size and portfolio diversification). We find that this heuristic often has predictive power for both raw and abnormal returns. The predictability is particularly driven by small firms, that is, concentrated in equal-weighted portfolios, and by signals derived from insider buying, that is, concentrated in the long leg.
In equal-weighted portfolios, the one-month Fama and French (Reference Fama and French2018) 6-factor alphasFootnote 4 reach at least 1% for aggregations of both developed and emerging markets, which is also statistically significant at the 1% level. This finding applies regardless of whether the aggregation is based on firm-months, which favors large markets, or country-months, which favors small markets. In value-weighted portfolios, the corresponding results are considerably weaker at 0.23% to 0.79%. However, the return predictability of the composite approach is still statistically significantly greater than the predictability of an unconditional benchmark strategy that mimics insider buying and selling regardless of its presumed information content. Relative to this unconditional insider trading strategy, the outperformance of the composite approach is often in the range of 3% to 4% per year. Overall, these results illustrate the benefits of synthesizing individual trade signals, but they also reveal the limits of cross-sectional return predictability.
Further analyses show that more complex approaches to synthesize the individual trading signals do not lead to an overall improvement in performance. For roughly comparable average portfolio sizes, established machine learning methods perform mostly similarly to the baseline composition approach outlined previously. The machine learning approaches, in which no method emerges as the clear winner in a relative comparison, have more difficulties in predicting alphas in emerging markets. This lack of empirical superiority further justifies using the straightforward, economically intuitive baseline composition approach for the further analyses outlined subsequently.
What explains the performance of the composite measure? Given the elusive and likely multifaceted nature of insider trading, our tests cannot provide a conclusive answer. Nevertheless, in the overall picture, they are at least consistent with an economic mechanism: insiders on average appear to have short-term informational advantages, especially among small firms, by assessing and utilizing public (or at least non-private) but typically locally limited information better than the market does. This line of reasoning is broadly consistent with findings in, for example, Kolasinski and Li (Reference Kolasinski and Li2010), Veenman (Reference Veenman2013), Alldredge and Cicero (Reference Alldredge and Cicero2015), Lambe, Li, and Qin (Reference Lambe, Li and Qin2022), or Contreras, Fidrmuc, and Kozhan (Reference Contreras, Fidrmuc and Kozhan2026). Several results are in line with this assessment.
First, abnormal returns decrease considerably with longer time horizons. For example, at 6-month (as opposed to 1-month) holding periods, the average monthly alpha in equal-weighted portfolios is roughly halved; the effect is even stronger for value-weighted portfolios. This finding suggests a primarily short-term informational advantage. Nevertheless, this short-term advantage does not appear to be related to earnings announcements, as trades in other months tend to yield at least similarly high alphas.
Second, this view is further supported by the strategy’s implementability from an outsider’s perspective. In the monthly baseline analysis, we rely on the actual trading date because our focus is on testing whether insiders have and exploit an information advantage. Switching to the outsider perspective, that is, conditioning only on signals arising from trades that have been reported before the end of the month, tends to decrease returns only slightly. In general, the results point to the importance of limits to arbitrage. Implementation costs, such as search costs, spreads, market impact, idiosyncratic risk, or shorting availability and costs, are likely particularly large for small firms in combination with disclosure delays and short holding periods.
Third, we generally find considerably stronger risk-adjusted performance for regional strategies than for the more mixed country-level strategies. This pattern can be explained by international diversification benefits, as both the unconditional and composite strategies exhibit relatively low correlations between countries. This finding suggests that insiders likely leverage firm-specific, country-specific, or other forms of more locally limited information as opposed to (global) market-wide information for their profitable trades.
Fourth, while the composite strategy tends to be stronger in aggregated emerging markets than in developed markets, the relative benefits, that is, the difference between the composite and unconditional insider trading profitability, are similar across both markets. At the country level, there are many developed (emerging) markets with high (low) alphas. In summary, these results suggest that general differences between emerging and developed markets with respect to the information environment and, in particular, the exploitability of private information (e.g., Bhattacharya, Daouk, Jorgenson, and Kehr (Reference Bhattacharya, Daouk, Jorgenson and Kehr2000), Griffin, Hirschey, and Kelly (Reference Griffin, Hirschey and Kelly2011)) are not a main driver of the performance of the composite measure.
Fifth, a further cross-country analysis shows that country characteristics that proxy for insider trading restrictions and corporate governance have limited explanatory power for country differences in the performance of the composite measure. In particular, the composite measure provides only weak evidence for the monitoring hypothesis, which posits that insider trading regulations or stronger corporate governance prevent insiders from extracting rents, in contrast to the unconditional strategy, which is broadly consistent with it. These findings again indicate that better interpretation of public information, as opposed to opportunistic trading on private information, may be a driver of the composite results. Hence, they are consistent with the notion that insider trading can potentially improve price informativeness (see, e.g., Leland (Reference Leland1992), Bernhardt, Hollifield, and Hughson (Reference Bernhardt, Hollifield and Hughson1995), and Kacperczyk and Pagnotta (Reference Kacperczyk and Pagnotta2024)).
The remainder of the article is organized as follows: Section II describes the data and Section III the methodology. Section IV provides the baseline results. Section V explores the statistical and economic mechanisms behind the findings. Section VI concludes.
II. Data
We use insider transactions data obtained from 2iQ Research, a company specialized in monitoring and analyzing global insider trading activities. For most countries, the sample begins around 2003. The specific sample start dates are shown in Table 1. Start dates vary between 2000 and 2013 and are chosen to ensure a comparable quality and quantity of insider transactions in the cross section as well as in the time series. The end of the sample period is 2021. We only consider open-market purchases and sales reported to local regulators for which we have valid return and market capitalization data. Specifically, in each country sample, we only consider purchases and sales if either the source of an insider transaction is equal to the local regulator or if the transaction was placed on a local exchange. Furthermore, we exclude all transactions not labeled as equity transactions by 2iQ and all transactions that can be identified as a private transaction either through their exchange or transaction label. We also exclude transactions if the transaction price is not within a 20% range of the daily closing price and if the trading volume exceeds the exchange volume for the day. To focus on more informative transactions, we also exclude all routine trades, following the trade-level approach of Cohen, Malloy, and Pomorski (Reference Cohen, Malloy and Pomorski2012). These screens imply that we exclude, among others, private transactions, awards, and option exercises. Finally, we aggregate purchases and sales by an individual insider to obtain net shares bought or sold during a given day. When calculating the information-driven measures, we aggregate purchases and sales by an individual insider to obtain net shares bought or sold during a given month if not stated otherwise.

TABLE 1 Long description
The table contains 18 columns of data for various countries and regions. The columns are: Country/Region, Start Year, Total Insider Trades in thousands, Buy trades, Sell trades, Number of Firms, Number of Insiders, Mean and Median Insiders per Firm, Mean and Median Trades per Firm, Mean and Median Trades per Insider/Firm, Mean and Median Market Capitalization in millions of U S dollars, Mean and Median Trade Value in thousands of U S dollars, and Median Reporting Lag in days.
Key data points include:
* Australia: Start 2003, 66.1 thousand total trades, 2,293 firms, 9,638 insiders, median reporting lag of 4 days.
* Canada: Start 2003, 551.7 thousand total trades, 4,406 firms, 39,880 insiders, median reporting lag of 3 days.
* United Kingdom: Start 2003, 76.1 thousand total trades, 2,274 firms, 17,632 insiders, median reporting lag of 1 day.
* United States: Start 2003, 1,466.0 thousand total trades, 7,889 firms, 119,198 insiders, median reporting lag of 2 days.
* China: Start 2006, 128.1 thousand total trades, 3,441 firms, 25,055 insiders, median reporting lag of 1 day.
* India: Start 2006, 214.4 thousand total trades, 2,678 firms, 31,385 insiders, median reporting lag of 4 days.
* Brazil: Start 2005, 37.6 thousand total trades, 298 firms, 1,094 insiders, median reporting lag of 27 days.
Aggregate regions at the bottom:
* D M (Developed Markets): Start 2003, 2,696.4 thousand total trades, 25,055 firms, 241,082 insiders, median reporting lag of 2 days.
* D M ex. United States: Start 2003, 1,230.5 thousand total trades, 17,166 firms, 125,316 insiders, median reporting lag of 3 days.
* E M (Emerging Markets): Start 2003, 1,029.0 thousand total trades, 14,772 firms, 115,699 insiders, median reporting lag of 3 days.
We restrict the sample to countries that have at least 5,000 valid (after screens) open-market purchases/sales transactions and a minimum of 100 stocks over the entire sample period. A detailed description of all screens is provided in Table OA.2 of the Supplementary Material. The final sample consists of 34 countries and close to 40,000 stocks with more than 3.7 million daily aggregated insider transactions from more than 350,000 corporate insiders. As Table 1 shows, the mean number of insiders per firm varies between 2.7 and 19.5. The average number of trades per firm ranges between 27.65 and 185.82. Table OA.1 of the Supplementary Material reports the different insider relations (categories) and their distribution.
We use stock market and accounting data from Refinitiv Datastream and Worldscope. We apply comprehensive static and dynamic data cleaning procedures largely based on Landis and Skouras (Reference Landis and Skouras2021), Ince and Porter (Reference Ince and Porter2006), Griffin et al. (Reference Griffin, Kelly and Nardari2010), Lee (Reference Lee2011), and Karolyi, Lee, and van Dijk (Reference Karolyi, Lee and van Dijk2012), among others. Details are given in the stock market data screens Section OB in the Supplementary Material. Returns are calculated in USD. Table 1 provides descriptive statistics for the 18 developed and 16 emerging market countries (based on the MSCI classification) in the final sample. We use data from RavenPack News Analytics (see RavenPack-mapping Section OC in the Supplementary Material) to construct a few insider trading signals that take company-specific news into account. As asset pricing models, we either use the self-constructed country-specific Fama and French (Reference Fama and French2018) 6-factor model or the regional versions from Kenneth French’s data library.
III. Methodology
A. Individual Measures of Information-Driven Insider Trading
The literature offers a plethora of different methodologies for the identification of potentially information-driven insider trades, covering, for example, insider trading patterns, the timing of insider trades, the general profitability of past insider trades, the nature of the insider position in the company, and general firm characteristics which are associated with greater information asymmetries.
Our goal is not to implement all proposed information-driven measures but to provide a sufficiently wide range of individual measures for the construction of a meaningful composite. In this context, some signals suggested in the U.S.-based literature cannot be implemented appropriately in our global setting due to lack of sufficient data availability.Footnote
5 In addition, the individual signals must be consistent in terms of their temporal availability to enter the resulting composite measure with a holding period of 1 month. The baseline composite measure always assumes that in calendar month
$ t $
 following the information-driven insider trade (signal) in month
$ t-1 $
 , a long or short position is established according to the expected predictive power of the transaction (signal) direction. The monthly rebalanced trading strategy is based on the actual trade date, disregarding the reporting lag of the transaction. This implies that the strategy mimics information-driven insider trades with some delay for trades that occur at the beginning of month
$ t-1 $
 . Note that an outside investor would potentially not be able to mimic insider trades that occur at the end of month
$ t-1 $
 or trades with greater reporting lags, as those trades would not be observable in real time at the beginning of month
$ t $
 (see Table 1 for the median reporting lags of each country). Consequently, we focus more on investigating the existence of insiders’ short-term informational advantages rather than the actual real-time implementability (see Section V.D).
Given the aforementioned constraints, we implement the following individual measures to identify information-driven insider trades and provide a brief description of the particular economic logic and/or intuition behind the identification:
-
• “Opportunistic trades” (Ali and Hirshleifer (Reference Ali and Hirshleifer2017)): We assume that particularly profitable trades shortly before quarterly earnings announcements (QEAs) are more likely to be information-driven trades (Q3).
-
• “Strong trades,” “Short horizon trades,” and “Unexpected trades” (Akbas et al. (Reference Akbas, Jiang and Koch2020)): We assume that insiders with a high trading frequency, and therefore a short investment horizon, are more likely to execute information-driven trades (SHOR). We apply a similar rationale to insider trades with greater market impact, that is, high daily volume (STRO), and insider trades that are unexpected given the regular trading behavior of an insider (UNEX).
-
• “Insider silence” (Hong and Li (Reference Hong and Li2019)): We assume that sudden insider silence, that is, discontinuing to purchase (PPN) or sell (SSN), following several consecutive purchases/sales, is informative.
-
• “Realized loss sales” (Kelly (Reference Kelly2018)): We assume that a sale at a loss is more “painful” than a sale at a gain, and thus it is assumed to have a higher (negative) information content (LOSS).
-
• “CFO purchases” (Wang, Shin, and Francis (Reference Wang, Shin and Francis2012)): We assume insider purchases by CFOs to be more likely information-driven, as CFOs are in the best position among corporate insiders to have access to informational advantages and also to use them effectively (CFO).
-
• “Accrual trades” (e.g., Beneish and Vargus (Reference Beneish and Vargus2002), Bergstresser and Philippon (Reference Bergstresser and Philippon2006)): We assume that insider transactions by top-level executives are more likely to be information-driven if all company insiders as a group trade in the same direction, while the level of accruals in the last fiscal year suggests a possible manipulation of accruals in favor of the transaction direction (ACC).
-
• “Research & Development trades” (Aboody and Lev (Reference Aboody and Lev2000)): We assume that higher R&D expenditures lead to higher information asymmetries regarding future developments, which increase the likelihood of information-driven insider trades by corporate officers (R&D).
-
• “Idiosyncratic volatility trades” (e.g., Jagolinzer et al. (Reference Jagolinzer, Larcker and Taylor2011), Ben-David et al. (Reference Ben-David, Kim, Moussawi and Roulstone2023)): We assume that higher stock-level idiosyncratic volatility leads to higher information asymmetries regarding future developments or to more pronounced mispricing, both of which increase the likelihood of information-driven insider trades (IVOL).
-
• “Clustered trades” (Alldredge and Blank (Reference Alldredge and Blank2019)): We assume that insider trades in the same direction made by multiple insiders of the same firm within a certain temporal proximity are more likely to be information-driven, as this synchronous trading suggests that the same (shared) information might be exploited by multiple insiders (CLUS).
-
• “Analyst coverage trades” (e.g., Frankel and Li (Reference Frankel and Li2004), Ellul and Panayides (Reference Ellul and Panayides2018)): We assume that an unusually high degree of analyst coverage (controlling for firm size) may indicate greater public interest in and scrutiny of the firm, which makes it harder to exploit nonpublic information for insiders. On the contrary, less attention from analysts might result in more information-driven trades (ANA).
-
• “Residual media coverage trades” and “Selected residual media coverage trades” (e.g., Dai, Parwada, and Zhang (Reference Dai, Parwada and Zhang2015), Sun, Dutta, Huang, and Zhu (Reference Sun, Dutta, Huang and Zhu2021), and Kyung and Nam (Reference Kyung and Nam2023)): We assume that an unusually high degree of media coverage (controlling for firm size) may indicate greater public interest in and scrutiny of the firm, which makes it harder to exploit nonpublic information for insiders. On the contrary, less press attention could result in more information-driven trades (RMC). We apply the same rationale to narrower press coverage dealing with insider trades and related topics (SRMC) such as corporate responsibility or investor relations.
-
• “Press release trades” (e.g., Cheng and Lo (Reference Cheng and Lo2006)): We assume that voluntary firm-initiated news disclosure, that is, press releases, in advance of a planned insider transaction could be motivated to influence the stock price in a favorable direction (VOLD).
-
• “Conditional conservatism trades” (Khalilov and Osma (Reference Khalilov and Osma2020)): We assume it to be more difficult for insiders to speculate on negative news when these are incorporated in the accounting numbers in a timely manner, that is, in times of high conditional accounting conservatism. Therefore, we regard sales of insiders as more likely to be information-driven if the company has low conditional conservatism. On the other hand, we assume that high conditional conservatism leads to a potential undervaluation, as profits are not recognized until the associated cash flows are realized, which offers the opportunity to speculate on good news (CONS).
-
• “Multiple firm insider sales” (Karamanou, Pownall, and Prakash (Reference Karamanou, Pownall and Prakash2021)): We assume that when an insider who is active in multiple firms executes a sale transaction in one firm that is accompanied by at least one purchase transaction in one of his or her other firms in the same month, it is less likely that the sale transaction is liquidity-driven. Therefore, we assume the sale to be information-driven (MFS).
-
• “Persistently profitable trades” (Cline, Gokkaya, and Liu (Reference Cline, Gokkaya and Liu2017)): We assume that insiders with persistently high abnormal returns might exploit information (PROF).
Following economic logic, we interpret sell (buy) transactions as a negative (positive) signal for future performance. We provide a detailed description of the implementation of all information-driven trade measures adapted to our global sample in Table OA.4 of the Supplementary Material. Tables OA.5 and OA.6 of the Supplementary Material provide descriptive statistics for the appearance of each information-driven buy and sell signal across countries, respectively.
B. Composite Measures of Information-Driven Insider Trading
The likelihood that information about a stock’s future performance can reliably be drawn from insider trades presumably increases with the number of trade signals. In addition, individual information-driven signals are not necessarily unambiguous. Hence, different measures can indicate opposing trade directions. Composition rules out such ambiguities by requiring a certain number of unique signals to be considered relevant. We classify each firm-month as information-driven (Buy = 1/Sell = −1) or non-information-driven (0) using the following composition methodology based on a total of 16 buy measures and 17 sell measures:

where
$ Buy{Signal}_{j,i,t} $
 is a dummy variable equal to 1 if any information-driven insider buy occurred in firm
$ i $
 during month
$ t $
 according to the individual information-driven buy measure
$ j $
 ,
$ Sell{Signal}_{k,i,t} $
 is a dummy variable equal to 1 if any information-driven insider sell occurred in firm
$ i $
 during month
$ t $
 according to the individual information-driven sell measure
$ k $
 , and
$ N $
 is the required surplus needed to qualify as an information-driven composite buy (
$ CID=1 $
 ) or sell (
$ CID=-1 $
 ) signal, respectively. In the baseline approach, we use
$ N=2 $
 , which is denoted
$ {CID}^2 $
 , for brevity henceforth
$ CID $
 . For example, we would consider a firm-month to have an information-driven buy signal if three information-driven buy signals and no more than one information-driven sell signal occurred in that month.
To better understand the operation of
$ CID $
 in equation (1), Figure 1 illustrates how many trade signals are generated in the pooled country data set depending on the surplus requirements (
$ N\ge \mathrm{1,2,3,4,5} $
 ) of an information-driven insider trading signal. Graphs A and B clearly show that, for both purchase and sale signals, the absolute threshold of 1, that is, an excess of one purchase (
$ N\ge 1 $
 ) or sale (
$ N\le -1 $
 ) signal, does not lead to a meaningful signal reduction compared to the number of unconditional signals. As surplus requirements increase, correspondingly clearer signals, that is, larger absolute surpluses of individual information-driven purchase or sale signals, are generated. However, a clearer signal also substantially decreases the sample size. Considering this trade-off, we use a
$ CID $
 greater than or equal to 2 (
$ {CID}^2 $
 ) as the baseline approach. This choice is also motivated by the heterogeneous appearance of individual information-driven signals both across measures and across countries (see Tables OA.5 and OA.6 of the Supplementary Material). As such, a
$ CID $
 greater than or equal to 2 prevents the composite signal from being driven by the more prevalent individual information-driven purchase or sale signals. Consequently, combinations of less common signals can also generate a valid composite information-driven signal, thus enabling the use of the full breadth of individual measures. A
$ CID $
 greater than or equal to 3, 4, or 5 is increasingly driven by the most prevalent signals and could potentially not be implementable in countries with low or poorer signal appearances. We report the results of surplus requirements (
$ N $
 ) greater than or equal to 3 (
$ {CID}^3 $
 ) and
$ 4 $
 (
$ {CID}^4 $
 ) in Section V.A.
Figure 1 shows the total number of firm-month signals over the sample period from 2000 to 2021 for the pooled country sample. We show unconditional trade firm-month signals, that is, all months in which at least one insider traded. Furthermore, we report composite firm-month signals greater than or equal to (
$ N\ge $
 ) 1, 2, 3, 4, 5, respectively. A composite firm-month signal (see equation (1)) greater than or equal to 2 shows the number of firm-month with a surplus, that is, absolute value of individual information-driven purchases—individual information-driven sale firm-month signals being greater than or equal to 2 (
$ N\ge 2 $
 ). Graphs A and B show purchases and sales, respectively. We only consider firm-month signals with a minimum absolute surplus of 2 as information-driven (the area to the right of the dashed red line).

FIGURE 1 Long description
Two vertically stacked bar charts.
Graph A, titled Purchases, has a Y-axis labeled Firm Month Signals in 1,000 ranging from 0 to 500. The X-axis lists levels 1, 2, 3, 4, and 5. Each level features a stacked bar where the light gray portion represents C I D Buy Level greater than or equal to N and the dark gray portion represents Unconditional Buy. As the level N increases from 1 to 5, the light gray portion decreases significantly from nearly 450 to approximately 50. A vertical dashed red line is positioned between level 1 and level 2, indicating the threshold for information-driven signals.
Graph B, titled Sales, has a Y-axis labeled Firm Month Signals in 1,000 ranging from 0 to 600. The X-axis lists levels 1, 2, 3, 4, and 5. The light gray portion represents C I D Sell Level greater than or equal to N and the dark gray portion represents Unconditional Sell. Similar to Graph A, the light gray portion decreases as N increases, starting near 580 at level 1 and dropping to approximately 150 at level 5. A vertical dashed red line is also placed between level 1 and level 2.
IV. Baseline Results
A. Unconditional Insider Trading
We start by analyzing unconditional (for brevity henceforth
$ UNC $
 ) insider trades as a benchmark. More precisely, we buy stocks in month
$ t $
 that were bought by (any) insiders in the previous month
$ t-1 $
 and short-sell stocks that were sold, respectively. We use the actual trade date to determine whether an unconditional signal was generated in month
$ t-1 $
 , disregarding the reporting lag of the transaction. Thus, the
$ UNC $
 strategy mimics unconditional insider trades with some delay for insider trades that occurred at the beginning of month
$ t-1 $
 . The
$ UNC $
 strategy considers all individual insider signals before generating a firm-month signal. Thus, we hold a firm in both the long and short legs in month
$ t $
 if at least one insider in that firm was a net buyer and another insider a net seller in month
$ t-1 $
 .
Table 2 shows the raw and abnormal returns (6-factor alphas following Fama and French (Reference Fama and French2018), henceforth FF6 alphas) of the
$ UNC $
 strategy as well as the performance of the long and short legs separately for each country. The t-statistics are Newey and West (Reference Newey and West1987) adjusted.Footnote
6

TABLE 2 Long description
The table is structured with three main performance categories: Long-Short, Long, and Short portfolios. Each category is further divided into Raw Returns (V W and E W), F F 6 alpha (V W and E W), the number of months N, and the average number of firms F.
Key data points include:
* Australia: Long-Short E W Raw Return of 0.973 with a t-statistic of 3.43, significant at the 1% level.
* Canada: Highest average number of firms in the Long-Short portfolio at 722.
* United States: Long-Short E W alpha of 0.912 with a t-statistic of 6.03, significant at the 1% level; average of 1,666 firms.
* Turkey: High Long-Short E W Raw Return of 2.400 and alpha of 2.220, both highly significant.
* South Korea: Long-Short E W Raw Return of 2.032 and alpha of 1.703, both highly significant.
The bottom rows summarize totals:
* Total greater than 0 [Significant]: For Long-Short E W alpha, 34 countries were positive, with 28 being statistically significant.
* Total less than 0 [Significant]: For Short E W alpha, 18 countries were negative, with 6 being statistically significant.
t-statistics are provided in parentheses below each return value. Asterisks indicate significance levels: * for 10%, ** for 5%, and *** for 1%.
Only eight (eight) countries exhibit significantly positive value-weighted raw (abnormal) returns, respectively. The only countries whose raw and abnormal returns are both significantly greater than 0 at the 5% level are France, Germany, Malaysia, Poland, South Korea, Spain, and Turkey. The results are substantially stronger for equal-weighted
$ UNC $
 portfolios, where 26 (raw) and 28 (abnormal) of the
$ UNC $
 equal-weighted long–short returns are positively significant at the 5% level, respectively. The only countries that exhibit insignificant equal-weighted abnormal returns are Denmark, Egypt, Finland, Indonesia, Israel, and the Philippines. In general, the return dispersion is large, both across value-weighted and equal-weighted strategies.
Almost all long legs have positive raw returns and alphas. The performance is especially strong among equal-weighted
$ UNC $
 portfolios, where almost all alphas are statistically significantly positive. The patterns in the short leg are less pronounced. The returns and alphas tend to be more dispersed, but they are statistically insignificant in the majority of cases.
Overall, the profitability of the
$ UNC $
 strategies appears to be limited for value-weighted portfolios. However, there seems to be predictive power for equal-weighted unconditional insider trades in most countries.
B. Composite Measures of Information-Driven Insider Trading
We use the composite approach developed in Section III.B to identify information-driven insider trades. Following the same timing and portfolio construction as described in Section IV.A for the
$ UNC $
 strategy, we construct the
$ CID $
 strategy by buying (selling) a stock if the difference between information-driven insider buying and selling signals in the previous month is greater than or equal to 2 (less than or equal to −2). Table 3 shows the monthly raw returns and FF6 alphas for the
$ CID $
 trading strategy separately for each country.Footnote
7

TABLE 3 Long description
The table reports summary performance statistics for a monthly rebalanced insider trading strategy based on a composite measure C I D.
Header Structure:
* The table is divided into three main portfolio sections: Long-Short, Long, and Short.
* Each section includes columns for Raw Returns (V W and E W), F F 6 alpha (V W and E W), number of months N, and average number of firms F.
* V W stands for Value-Weighted and E W stands for Equal-Weighted.
Data Rows:
* The table lists 34 countries including Australia, Belgium, Brazil, Canada, Chile, China, Denmark, Egypt, Finland, France, Germany, Greece, Hong Kong, India, Indonesia, Israel, Italy, Malaysia, Netherlands, Norway, Pakistan, Philippines, Poland, Singapore, South Africa, South Korea, Spain, Sri Lanka, Sweden, Switzerland, Thailand, Turkey, United Kingdom, and United States.
* For each country, two rows of data are provided: the top row contains the return and alpha values with significance markers (asterisks), and the bottom row contains Newey and West adjusted t-statistics in parentheses.
* Statistical significance is indicated by * for 10 percent, ** for 5 percent, and *** for 1 percent levels.
Summary Statistics at the Bottom:
* Total greater than 0 [Sig.]: Reports the count of positive performances and the number of those that are statistically significant. For example, in the Long-Short E W Raw Returns column, 33 countries had positive returns, 22 of which were significant.
* Total less than 0 [Sig.]: Reports the count of negative performances and the number of those that are statistically significant. For example, in the Short E W F F 6 alpha column, 21 countries had negative alphas, 7 of which were significant.
In total, 9 (10) of the value-weighted raw (abnormal)
$ CID $
 returns are significantly positive at the 5% level. For the equal-weighted
$ CID $
 portfolios, we observe a clearer picture with 22 and 23 statistically significant positive raw and abnormal returns at the 5% level, respectively.
To identify the performance drivers of the
$ CID $
 strategy, we analyze the long and short legs separately. Almost all of the value-weighted raw and abnormal returns of the long legs are positive. Furthermore, 15 and 16 of these value-weighted raw and abnormal
$ CID $
 returns are significant at the 5% level. For equal-weighted portfolios, we observe greater economic magnitude and significance of abnormal returns. In total, 29 countries show significantly positive (at the 5% level) abnormal returns in the long leg. Looking at the short legs, there are only five and seven statistically significant negative value- and equal-weighted abnormal returns at the 5% level, respectively.
Table OA.7 of the Supplementary Material provides an overview of the performance differences at the country level by investing in a portfolio that goes long the respective composite
$ CID $
 approach and short the unconditional
$ UNC $
 benchmark strategy. The comparison at the country level does not provide a conclusive picture. Noticeably, at least three-quarters of the countries show positive improvements (point estimates) in value- and equal-weighted raw and abnormal performance. However, only one-third of the countries show significant positive improvements for equal-weighted raw and abnormal returns, while seven and six countries show significant positive improvements for value-weighted raw and abnormal returns.
In the following, to provide a more general and potentially more meaningful perspective on the improvements produced by the
$ CID $
 strategy, we analyze the performance of all countries in aggregate regions. In Table 4, we report value- and equal-weighted FF6 alphas for the
$ UNC $
 and
$ CID $
 strategies for the long–short (Panel A), long (Panel B), and short (Panel C) portfolios, respectively. Furthermore, we report alphas for a long–short strategy (
$ CID- UNC $
 ) that goes long the respective
$ CID $
 long–short, long, and short strategies and short the respective
$ UNC $
 long–short, long, and short strategies. To account for structural differences between countries, we distinguish between developed markets (DM) and emerging markets (EM). We use the following two aggregation methods: We aggregate all firm-months across all countries in the respective region (DM or EM) to create a regional monthly sample that includes all information-driven (or unconditional) insider trade firm-month signals. This “pooled” sample is dominated by countries with a greater number of information-driven (unconditional) firm-month observations. To weaken the influence of countries with many monthly signals, we additionally calculate “country-neutral” regional results by averaging the respective
$ UNC $
 ,
$ CID $
 , and
$ CID- UNC $
 monthly country strategy return time series in each month. Thus, in the “country-neutral” approach, each country with a valid monthly return receives the same weight in the month under consideration. For both approaches, we require at least 15 stocks per month for a valid long (short) portfolio construction. All abnormal returns for the “pooled” and “country-neutral” regions are calculated using the regional U.S. dollar Fama and French (Reference Fama and French2018) 6-factor model obtained from Kenneth French’s data library.

TABLE 4 Long description
The table is divided into three sections: Panel A for Long-Short, Panel B for Long, and Panel C for Short strategies. Each panel compares U N C F F 6 alpha, C I D F F 6 alpha, and the difference C I D minus U N C F F 6 alpha.
* Panel A (Long-Short): For Pooled D M, the C I D minus U N C difference is 0.275 for V W and 0.286 for E W, both significant at the 1 percent level. For Pooled E M, the difference is 0.323 for V W and 0.383 for E W. Under Country-Neutral implementations, D M shows a difference of 0.136 for V W and 0.282 for E W, while E M shows 0.332 for V W and 0.269 for E W.
* Panel B (Long): For Pooled D M, the C I D minus U N C difference is 0.255 for V W and 0.210 for E W. For Pooled E M, the difference is 0.181 for V W and 0.109 for E W. Under Country-Neutral, D M shows 0.126 for V W and 0.130 for E W, while E M shows 0.282 for V W and 0.010 for E W.
* Panel C (Short): For Pooled D M, the C I D minus U N C difference is minus 0.019 for V W and minus 0.076 for E W. For Pooled E M, the difference is minus 0.142 for V W and minus 0.275 for E W. Under Country-Neutral, D M shows minus 0.009 for V W and minus 0.173 for E W, while E M shows minus 0.139 for V W and minus 0.273 for E W.
All panels report N equals 227 months. T-statistics are provided in parentheses below each alpha value, with asterisks indicating statistical significance levels at 10 percent, 5 percent, and 1 percent.
Panel A of Table 4 reports the FF6 long–short alphas for the value- and equal-weighted
$ UNC $
 and
$ CID $
 strategies, respectively. In the pooled DM sample, the long–short returns for value- and equal-weighted
$ UNC $
 portfolios are −0.05% and 0.72%, respectively. The corresponding returns for the
$ CID $
 DM strategies are 0.23% and 1.01%, respectively. In both cases, only equal-weighted portfolios show significant alphas. The value-weighted (0.28%) and equal-weighted (0.29%)
$ CID- UNC $
 alphas are significantly positive, indicating an outperformance of the
$ CID $
 strategies in the pooled DM samples. For the pooled EM samples, we observe similar results with higher absolute alphas. The value- and equal-weighted
$ UNC $
 alphas are 0.47% and 1.00%, respectively. The corresponding EM
$ CID $
 alphas are higher with 0.79% and 1.39% for the value- and equal-weighted portfolios, respectively. The value-weighted and equal-weighted
$ CID- UNC $
 alphas are 0.32% and 0.38%, statistically significant at the 5% and 1% levels, respectively. In sum, the pooled DM and EM samples reveal a significant outperformance of the
$ CID $
 strategies.
In the country-neutral DM samples, the value- and equal-weighted long–short
$ UNC $
 (
$ CID $
 ) alphas are 0.28% and 0.88% (0.42% and 1.17%), all of which are significant at the 1% level. Furthermore, the
$ CID- UNC $
 differences are significant for both equal- (0.28%) and value-weighted (0.14%) DM portfolios. Similarly, for EM, both the country-neutral value-weighted (0.33%) and equal-weighted (0.27%)
$ CID- UNC $
 alpha differences are significant. In sum, the alternative aggregation method, that is, country-neutral DM and EM portfolios, also suggests a significant outperformance of the
$ CID $
 strategies.
Relative to the more mixed country-level results in Tables 2 and 3 and OA.7 of the Supplementary Material, the high statistical significance of the pooled and country-neutral regional strategies can be explained by international diversification benefits. More precisely, most country-level
$ UNC $
 ,
$ CID $
 , and
$ CID- UNC $
 strategies exhibit low correlation between countries. These findings suggest that informed insider trading tends to be based rather on firm-specific (or country-specific or industry-specific) information as opposed to market or regional information.
Panels B and C of Table 4 report the FF6 alphas for the long and short legs separately. Noticeably, for equal-weighted portfolios, we observe significant
$ CID- UNC $
 alphas for almost all pooled and country-neutral long–short, long, and short portfolios, respectively. This finding suggests that among small firms, the outperformance of
$ CID $
 relative to the unconditional strategy stems from its ability to identify both information-driven buys and sells. Overall, however, the significant
$ UNC $
 ,
$ CID $
 , and
$ CID- UNC $
 long–short alphas are often driven by their long legs, suggesting that insider buying generally has more return predictive ability. Table OA.8 of the Supplementary Material shows similar results for raw returns. In Table OA.9 of the Supplementary Material, we benchmark the
$ CID $
 strategy against the performance obtained from averaging the returns of the individual presumably information-driven strategies outlined in Section III.A.Footnote
8 For this high-hurdle robustness check, we find a statistically significant and economically relevant (often several percent p.a.) superiority of the
$ CID $
 strategy only for equal-weighted portfolios. Notably, the outperformance can be found in all specifications with equal-weighted returns, and it increases with the extent of the signal surplus of the composite strategy (see also Section V.A). In summary, the advantages of signal synthesis materialize in both developed markets and emerging markets but are predominantly found among smaller stocks. In the following, we examine potential statistical and economic mechanisms behind the performance of the
$ CID $
 strategy in more detail.
V. Statistical and Economic Mechanisms
A. More Restrictive Composition Approaches
We test more restrictive versions of the (
$ {CID}^2 $
 ) measure, that is, signal surplus requirements larger than
$ N=2 $
 . Specifically, we set
$ N=3 $
 or
$ N=4 $
 (see equation (1)). Note that even higher surplus requirements, such as
$ N=5 $
 , would not be consistently possible due to the often sparse and heterogeneous signal appearances across countries (see Figure 1).
Table 5 shows the resulting performance statistics for pooled and country-neutral developed (DM) and emerging market (EM) samples. The results show that the more restrictive versions (
$ {CID}^3 $
 and
$ {CID}^4 $
 ) of the composite measure of information-driven trades uniformly, that is, regardless of the country aggregation scheme, show significant positive abnormal long–short returns for equal-weighted portfolios. However, pooled DM value-weighted
$ {CID}^3 $
 and
$ {CID}^4 $
 portfolios and the pooled EM value-weighted
$ {CID}^4 $
 portfolio show insignificant (but still positive) long–short FF6 alpha estimates, which is largely consistent with the baseline measure
$ {CID}^2 $
 in Panel A of Table 4. Evaluating the effectiveness of
$ {CID}^3 $
 and
$ {CID}^4 $
 to improve on the unconditional predictability by looking at the
$ {CID}^3- UNC $
 and
$ {CID}^4- UNC $
 alphas shows substantial differences across samples. These findings are broadly comparable to the baseline measure
$ {CID}^2 $
 in Panel A of Table 4.

TABLE 5 Long description
The table is divided into two main horizontal sections: Pooled and Country-Neutral implementations. Each section contains data for D M (Developed Markets) and E M (Emerging Markets) across four primary metric groups: C I D super 3 F F 6 alpha, C I D super 3 minus U N C F F 6 alpha, C I D super 4 F F 6 alpha, and C I D super 4 minus U N C F F 6 alpha. Metrics include V W (Value-Weighted) and E W (Equal-Weighted) alphas, with t-statistics in parentheses and month counts (N).
Key data points from the Pooled section:
* D M: C I D super 3 V W alpha is 0.334 (1.86) and E W is 1.086 (5.35). C I D super 4 V W alpha is 0.240 (0.95) and E W is 1.269 (5.12).
* E M: C I D super 3 V W alpha is 0.909 (2.79) and E W is 1.430 (8.98). C I D super 4 V W alpha is 0.745 (1.57) and E W is 1.497 (10.63).
Key data points from the Country-Neutral section:
* D M: C I D super 3 V W alpha is 0.565 (4.76) and E W is 1.371 (12.83). C I D super 4 V W alpha is 0.674 (3.60) and E W is 1.769 (6.15).
* E M: C I D super 3 V W alpha is 0.965 (4.46) and E W is 1.359 (8.06). C I D super 4 V W alpha is 1.328 (4.50) and E W is 1.601 (9.44).
Statistical significance is marked by asterisks: * for 10 percent, ** for 5 percent, and *** for 1 percent.
Graph A of Figure 2 shows the difference between the unconditional (
$ UNC $
 ) and all versions of
$ CID $
 (
$ {CID}^2 $
 ,
$ {CID}^3 $
 , and
$ {CID}^4 $
 ) alphas for the pooled DM and EM samples. Graph A shows that a more restrictive
$ CID $
 monotonically increases the benefits of our
$ CID $
 strategy relative to the
$ UNC $
 strategy for the equal-weighted pooled DM sample. However, the equal-weighted pooled EM sample shows increased benefits from
$ {CID}^2 $
 to
$ {CID}^3 $
 , but not additional benefits for the
$ {CID}^4 $
 strategy. The value-weighted pooled EM and DM samples show similar increased benefits from
$ {CID}^2 $
 to
$ {CID}^3 $
 , but reversals back to comparable
$ {CID}^2 $
 alphas for the
$ {CID}^4 $
 strategy.
Figure 2 shows the benefits of our composite measures by displaying the monthly value- (VW) and equal-weighted (EW) FF6 alphas of long–short strategies that go long the long–short composition measure (
$ {CID}^2 $
 ,
$ {CID}^3 $
 ,
$ {CID}^4 $
 ) and short the long–short unconditional strategy (
$ UNC $
 ) for pooled developed (DM) and emerging market (EM) samples in Graph A. Graph B shows the potential benefits of a change in holding periods for our baseline composite measure
$ {CID}^2 $
 by displaying the monthly equal- and value-weighted FF6 alphas of long–short strategies that go long the long–short composition measure (
$ {CID}^2 $
 ) and short the long–short unconditional strategy (
$ UNC $
 ) for various holding periods (1, 2, 3, 6, and 12 months) for pooled developed (DM) and emerging market (EM) samples. Statistical significance at the 10%, 5%, and 1% level is indicated by *, **, and ***, respectively.

FIGURE 2 Long description
The figure consists of two vertically stacked panels, Graph A and Graph B. Both panels use a Y-axis labeled Average Monthly alpha in percentage and share a legend where dark gray bars represent V W alpha and light gray bars represent E W alpha.
Graph A, titled Composition Approaches, compares three methods: C I D super 2, C I D super 3, and C I D super 4.
- In the D M (Developed Markets) section, alpha values increase as the composition power increases, with C I D super 4 reaching approximately 0.55 percent for E W.
- In the E M (Emerging Markets) section, alpha values are more stable across methods, peaking around 0.45 percent for C I D super 3.
Graph B, titled Holding Periods, focuses on the C I D super 2 method across five timeframes: 1 M, 2 M, 3 M, 6 M, and 12 M.
- In both D M and E M, there is a clear downward trend where alpha decreases as the holding period lengthens.
- For D M, the 1 M alpha starts near 0.3 percent and drops to below 0.1 percent at 12 M.
- For E M, the 1 M alpha starts higher at nearly 0.4 percent and similarly declines toward 0.1 percent at 12 M.
Asterisks above bars indicate statistical significance: three asterisks for 1 percent, two for 5 percent, and one for 10 percent.
In contrast, the value- and equal-weighted DM and EM country-neutral portfolios show that more restrictive
$ CID $
 strategies outperform more or less monotonically. We conjecture that the different pooled versus country-neutral results indicate that increasing the
$ CID $
 restrictions works better on a country-level basis and has a somewhat limited ability to increase the benefits in our value-weighted pooled portfolios, which are United States (DM) and China/India (EM) dominated. Overall, the results indicate that the baseline results are robust to the choice of the surplus requirement of the composite measure (
$ N $
 in equation (1)).
B. Composition Approaches Using Machine Learning
Can more complex methods enhance return predictability? Following Gu, Kelly, and Xiu (Reference Gu, Kelly and Xiu2020), Drobetz and Otto (Reference Drobetz and Otto2021), Leippold, Wang, and Zhou (Reference Leippold, Wang and Zhou2022), and Hanauer, Soebhag, Stam, and Hoogteijling (Reference Hanauer, Soebhag, Stam and Hoogteijling2025), among others, we implement a variety of machine learning techniques. Specifically, we employ ordinary least squares (
$ OLS $
 ), least absolute shrinkage and selection operator (
$ LASSO $
 ), elastic net (
$ ENET $
 ), random forest (
$ RF $
 ), gradient boosting regression trees (
$ GBR $
 ), and neural networks with three layers (
$ NN3 $
 ). For all algorithms, we apply an expanding-window approach with disjoint training and testing samples. The initial training period spans 5 years and expands annually. Stock portfolios are formed monthly by sorting stocks into terciles based on their predicted returns. Unlike most of the machine learning literature (e.g., Rasekhschaffe and Jones (Reference Rasekhschaffe and Jones2019), Freyberger, Neuhierl, and Weber (Reference Freyberger, Neuhierl and Weber2020), Tobek and Hronec (Reference Tobek and Hronec2021), and Hanauer and Kalsbach (Reference Hanauer and Kalsbach2023)), we do not use quintile or decile splits in the baseline analysis. Tercile splits result in similar portfolio sizes as in the
$ CID $
 approaches and thus allow for better comparability.Footnote
9 We report quintile split results in Table OA.11 of the Supplementary Material. Further details on the implementation of the machine learning models are provided in Section OA.2 of the Supplementary Material.
Table 6 shows the value- and equal-weighted FF6 alphas for the machine learning-based long–short portfolios (
$ ML $
 ), along with alphas for long–short strategies (
$ ML- UNC $
 ) that go long the long–short machine learning strategies and short the long–short unconditional strategies. We implement the strategies separately for pooled developed (DM) and emerging markets (EM) samples. We do not consider country-neutral approaches, as the limited data, especially in the smaller countries, often do not satisfy the requirements for adequate training of the respective models. Due to the (at least) 5-year training period, the sample period starts in 2008 instead of 2003. This sample period adjustment also affects
$ CID $
 and
$ CID- UNC $
 alphas (see Table 4) that act as a benchmark. These values are therefore shown at the bottom of Table 6. For DM (EM), the value- and equal-weighted FF6
$ CID $
 alphas change to −0.02% and 0.78% (0.46% and 1.28%). The
$ CID- UNC $
 alphas remain statistically significant at the 1% level for equal-weighted portfolios, amounting to 0.21% in DM and 0.25% in EM. For value-weighted portfolios, however, the
$ CID- UNC $
 alpha spreads become statistically insignificant, at 0.12% (DM) and 0.14% (EM), respectively.

TABLE 6 Long description
The table reports monthly value-weighted (V W) and equal-weighted (E W) F F 6 factor alphas and Newey-West adjusted t-statistics for pooled Developed Market (D M) and Emerging Market (E M) implementations. All models use N = 168 months.
* O L S: For D M, E W alpha is 0.927 (t = 4.98). For E M, E W alpha is 0.835 (t = 5.17). O L S minus U N C shows a D M E W alpha of 0.365 (t = 1.99).
* LASSO: For D M, E W alpha is 0.945 (t = 5.04). For E M, E W alpha is 0.840 (t = 5.68). LASSO minus U N C shows a D M E W alpha of 0.383 (t = 2.17).
* E N E T: For D M, E W alpha is 0.715 (t = 4.48). For E M, E W alpha is 0.459 (t = 2.72). E N E T minus U N C shows an E M E W alpha of minus 0.575 (t = minus 2.89).
* R F: For D M, E W alpha is 0.929 (t = 4.42). For E M, V W alpha is 0.574 (t = 1.76) and E W alpha is 0.958 (t = 4.29).
* G B R: For D M, E W alpha is 0.897 (t = 4.72). For E M, V W alpha is 0.553 (t = 1.76) and E W alpha is 0.868 (t = 4.76).
* N N 3: For D M, E W alpha is 0.838 (t = 4.48). For E M, E W alpha is 0.750 (t = 5.38). N N 3 minus U N C shows an E M E W alpha of minus 0.284 (t = minus 1.71).
* C I D: For D M, E W alpha is 0.775 (t = 3.39). For E M, V W alpha is 0.460 (t = 1.75) and E W alpha is 1.284 (t = 8.13). C I D minus U N C shows significant E W alphas for both D M (0.213, t = 5.55) and E M (0.250, t = 4.30).
Turning to the machine learning approaches in Table 6, we observe highly significant equal-weighted alphas around 0.9% in DM across most models, while value-weighted alphas remain insignificant around 0%. In EM, equal-weighted alphas remain significant but are slightly lower at around 0.8% for most models, while value-weighted alphas in EM are around 0.4%, but statistically insignificant. Hence, the machine learning models produce comparable alphas to the
$ CID $
 strategy for DM samples, but much lower alphas for EM samples.
When comparing the machine learning
$ ML- UNC $
 strategies with the
$ CID- UNC $
 strategy, we find only significant and comparable alphas in equal-weighted DM samples for the linear regression (
$ OLS $
 ),
$ LASSO $
 , and random forest (
$ RF $
 ) models. Notably, the equal-weighted
$ ML- UNC $
 alphas in EM are uniformly negative. Value-weighted
$ ML- UNC $
 alphas are mostly positive, but statistically insignificant in all models and in both DM and EM, ranging between −0.16% and 0.29%. Therefore, the machine learning models produce
$ ML- UNC $
 alphas comparable to those of the
$ CID- UNC $
 strategies for value-weighted DM and EM samples and equal-weighted DM samples, but underperform significantly in equal-weighted EM samples. We report statistical tests for the
$ ML- CID $
 return differences in Table OA.23 of the Supplementary Material, which show that none of the machine learning models significantly outperform the straightforward baseline strategy across regions and weighting schemes. Furthermore, a direct comparison of the machine learning models reveals no definitive superior performer.
Notably, the machine learning alpha spreads increase materially for more restrictive quintile splits in the pooled DM sample, but still remain insignificant or negative for the pooled EM sample (see Table OA.11 of the Supplementary Material). Overall, under comparable conditions, more complex methodsFootnote
10 do not outperform the baseline composite strategy (
$ CID- UNC $
 ), which we therefore concentrate on in the remainder of the article.
C. Long Versus Short-Term Information
Our results so far concentrate on one-month ahead performance. However, an information advantage could also be of a longer-term nature. To test this possibility, we examine the profitability of
$ CID $
 insider trades based on longer holding periods ranging from 2 to 12 months. In other words, if a stock has at least two excess buy or sell signals in a month, it is assigned to the long or short portfolio accordingly and remains there for 2, 3, 6, or 12 months. We also implement an analogous portfolio approach for
$ UNC $
 trades, which allows us to study the
$ CID- UNC $
 performance difference.
In Table 7, we report value- and equal-weighted FF6 alphas separately for pooled and country-neutral developed (DM) and emerging market (EM)
$ CID $
 (Panel A) and
$ CID- UNC $
 strategies (Panel B) for different holding periods. We report the
$ UNC $
 alphas for different holding periods in Table OA.12 of the Supplementary Material.

TABLE 7 Long description
The table is divided into two main sections: Panel A and Panel B. Both panels share a common header structure with columns for holding periods of 1 Month, 2 Months, 3 Months, 6 Months, and 12 Months. Each period is subdivided into V W (Value-Weighted) and E W (Equal-Weighted) metrics. The final column N indicates 227 available months.
Panel A: C I D F F 6 alpha (Long-Short)
* Pooled Strategy:
- D M: E W alpha starts at 1.011 (t-stat 4.92) at 1 month and decreases to 0.337 (t-stat 3.35) at 12 months. V W alpha starts at 0.226 and turns negative to -0.053 at 12 months.
- E M: E W alpha starts at 1.387 (t-stat 8.80) and decreases to 0.477 (t-stat 5.62) at 12 months. V W alpha starts at 0.789 and decreases to 0.143.
* Country-Neutral Strategy:
- D M: E W alpha starts at 1.165 and decreases to 0.394. V W alpha starts at 0.418 and decreases to 0.033.
- E M: E W alpha starts at 1.313 and decreases to 0.480. V W alpha starts at 0.794 and decreases to 0.205.
Panel B: C I D minus U N C F F 6 alpha (Long-Short)
* Pooled Strategy:
- D M: E W alpha starts at 0.286 and decreases to 0.086. V W alpha starts at 0.275 and decreases to 0.017.
- E M: E W alpha starts at 0.383 and decreases to 0.072. V W alpha starts at 0.323 and decreases to 0.078.
* Country-Neutral Strategy:
- D M: E W alpha starts at 0.282 and decreases to 0.105. V W alpha starts at 0.136 and decreases to 0.044.
- E M: E W alpha starts at 0.269 and decreases to 0.010. V W alpha starts at 0.332 and decreases to 0.062.
Statistical significance is noted with asterisks, and t-statistics are provided in parentheses below each alpha value.
The main finding is that for both
$ CID $
 and
$ CID- UNC $
 strategies, irrespective of the region or country aggregation scheme, equal-weighted alphas decrease with longer time horizons by half or more, but largely remain significant. For example, the equal-weighted alphas of
$ CID $
 trades in the pooled DM and EM portfolios fall from highly significant 1.01% and 1.39%, respectively, in the 1-month holding period, to still highly significant 0.34% and 0.48%, respectively, in the 12-month holding period. Value-weighted
$ CID $
 alphas are mostly significant with the exception of pooled DM samples and also decrease with longer time horizons. Value-weighted
$ CID- UNC $
 alphas are often significant, but also decrease with longer time horizons, the exception being the country-neutral DM alphas.
Collectively, the economic difference between
$ CID- UNC $
 alphas tends to become smaller over time, which suggests that
$ CID $
 insider trades capture partly a short-term information advantage. Graph B of Figure 2 illustrates this negative relation between time horizon and
$ CID- UNC $
 alphas for the pooled DM and EM portfolios. The results of the country-neutral portfolios are qualitatively comparable, with the exception of the country-neutral DM alphas. Nevertheless, the equal-weighted
$ CID- UNC $
 alphas remain statistically significant at long time horizons, indicating that the
$ CID $
 measure also outperforms the equal-weighted
$ UNC $
 strategies at longer time horizons. In summary, we can confirm the hypothesis that
$ CID $
 trades contain an important short-term information component.
D. Real-Time Perspective and Earnings Months
In this section, we analyze two further aspects regarding the timing of insider transactions. In Panel A of Table 8, we first report the performance of a real-time implementable version of our baseline strategy to outside investors (
$ {CID}_O $
 ), which includes only trades that have been reported to the respective authorities before the end of the previous month, that is, before the portfolio construction. Furthermore, we report in Panel A the performance of a pure insider version of our baseline strategy (
$ {CID}_I $
 ), which includes only trades that have been reported to the respective authorities after the end of the previous month. These trades are therefore not available to outside investors at the time of portfolio formation.Footnote
11

TABLE 8 Long description
The table is divided into two main sections.
Panel A, Outsider versus Insider Perspective (Long-Short), compares C I D sub O and C I D sub I strategies.
- For Pooled D M, C I D sub O shows a V W alpha of 0.285 and E W alpha of 0.842. The difference C I D sub O minus U N C sub O is 0.319 (V W) and 0.262 (E W) over 227 months.
- For Pooled E M, C I D sub O shows a V W alpha of 0.654 and E W alpha of 1.274.
- Country-Neutral D M shows C I D sub O alphas of 0.473 (V W) and 1.048 (E W).
- Country-Neutral E M shows C I D sub O alphas of 0.791 (V W) and 1.253 (E W).
- Insider perspective (C I D sub I) generally shows higher E W alphas, reaching 2.222 for Country-Neutral D M.
Panel B, Q E A (Long-Short), compares months with quarterly earnings announcements (C I D sub Q) and without (C I D sub n Q).
- For Pooled D M, C I D sub Q shows a V W alpha of 0.231 and E W alpha of 0.803 over 167 months.
- For Pooled E M, C I D sub Q shows a negative V W alpha of -0.185 but a positive E W alpha of 1.350.
- In months without announcements (C I D sub n Q), Pooled E M shows a V W alpha of 0.707 and E W alpha of 1.436 over 221 months.
- Country-Neutral D M for C I D sub n Q shows a V W alpha of 0.559 and E W alpha of 1.181.
T-statistics are provided in parentheses below each alpha value, with asterisks indicating statistical significance at the 10%, 5%, and 1% levels.
The
$ {CID}_O $
 alpha (averaged across all EM and DM pooled and country-neutral specifications) decreases by approximately 6 bps, while the
$ {CID}_O-{UNC}_O $
 alpha spreads closely resemble the baseline results in Table 4 across both regions and weighting schemes. The
$ {CID}_I $
 alpha (averaged across all EM and DM pooled and country-neutral specifications) increases often significantly by approximately 43 bps,Footnote
12 while the
$ {CID}_I-{UNC}_I $
 alpha spreads again closely resemble the baseline results in Table 4, with the exception of the value-weighted DM alpha spread becoming insignificant. In Table OA.22 of the Supplementary Material, we formally test whether the pure outsider strategy and pure insider strategy differ from one another and from the baseline strategy. For the
$ CID $
 alphas, we find mainly significant outperformance in equal-weighted DM samples, with the pure insider strategy outperforming the baseline (
$ {CID}_I- CID $
 ) and the outsider strategy (
$ {CID}_I-{CID}_O $
 ),Footnote
13 and the baseline strategy outperforming the outsider strategy (
$ CID-{CID}_O $
 ). For the
$ CID- UNC $
 alpha spreads, we find no significant differences, except for significantly lower returns of the value-weighted pure insider strategy relative to the baseline strategy in developed markets. Overall, the slightly decreased outsider results again point to a short-term information advantage of insiders. Although the pure insider results might suggest a similar interpretation, we cannot directly make this link as the baseline and the pure insider strategy are by design far less comparable than the baseline to the outsider strategy.
In Panel B of Table 8, we perform a similar variation of the baseline strategy to investigate the influence of QEAs. Specifically, we rerun the analysis separately for trades in earnings announcement months on the one hand (
$ {CID}_Q $
 ) and all other months on the other hand (
$ {CID}_{nQ} $
 ). The alphas of trades initiated in months without an earnings announcement are at least as large as, if not larger than, the alphas in earnings months (all respective tests for significant differences in Table OA.22 of the Supplementary Material are insignificant), suggesting that the latter are not a major driver of the success of the baseline analysis.
E. Developed Versus Emerging Markets
The information environment in emerging markets (EM) is likely to be different from that in developed markets (DM) (see also Section V.F). For example, Brochet (Reference Brochet2019) shows that institutions in EM demand less transparency regarding insider trades, which, in turn, increases the predictability of returns. Bhattacharya et al. (Reference Bhattacharya, Daouk, Jorgenson and Kehr2000) find that stock prices in Mexico hardly reacted to usually value-relevant corporate news in the period between 1994 and 1997. Griffin et al. (Reference Griffin, Hirschey and Kelly2011) show that stock prices in DM move more strongly on public news, especially on earnings announcements. These results suggest that insiders in EM, in particular, may have private information advantages. In this respect, the question arises whether the outperformance of
$ CID $
 trades compared to
$ UNC $
 trades is also driven by this mechanism. However, Table 9, which reports tests for differences in abnormal returns between pooled and country-neutral EM and DM portfolios for the
$ UNC $
 ,
$ CID $
 , and
$ CID- UNC $
 strategies, shows that this is unlikely to be the case.

TABLE 9 Long description
The table is divided into three vertical sections: Panel A (Long minus Short), Panel B (Long), and Panel C (Short). Each panel compares Emerging Markets (E M) minus Developed Markets (D M) across three strategy categories: Unconditional (U N C), Information-driven (C I D), and the difference (C I D minus U N C).
* Panel A (Long minus Short): In the Pooled implementation, the U N C V W alpha is 0.514 (z-stat 2.33) and C I D V W alpha is 0.563 (z-stat 1.77). In Country-Neutral, the C I D V W alpha is 0.376 (z-stat 2.23).
* Panel B (Long): In the Pooled implementation, U N C V W alpha is 0.289 and C I D V W is 0.215. In Country-Neutral, the U N C E W alpha is 0.484 (z-stat 2.42) and C I D E W is 0.364 (z-stat 1.69).
* Panel C (Short): In the Pooled implementation, U N C V W alpha is minus 0.225 and C I D V W is minus 0.348. The C I D minus U N C E W alpha is minus 0.199 (z-stat minus 2.41).
Columns for each strategy include Value-Weighted (V W), Equal-Weighted (E W), average number of firms in E M (F E M), and average number of firms in D M (F D M). The number of months (N) is 227 for all implementations. Statistical significance is marked with asterisks.
Panel A reveals that insiders in emerging markets achieve higher long–short alphas, sometimes significantly, than in developed markets for both unconditional insider trades (
$ UNC $
 ) and the composite measure (
$ CID $
 ). However, all
$ CID- UNC $
 alphas show small and insignificant differences between EM and DM, suggesting that differences in the information environment between EM and DM are not the main performance driver of the increased predictability of the
$ CID $
 strategies.
For example, in the pooled analysis with value-weighted returns, the alpha of
$ UNC $
 trades is 0.51% higher in EM than in DM, which is almost equally driven by the long and short legs (see Panels B and C). The respective estimate for
$ CID $
 trades is 0.56%, which is again driven by both the long and short legs (see Panels B and C), leading to an insignificant
$ CID- UNC $
 alpha of 0.05%. In the country-neutral equal-weighted strategy, the alpha difference is 0.16% for
$ UNC $
 trades and 0.15% for
$ CID $
 trades, again leading to an insignificant
$ CID- UNC $
 alpha of −0.01%.
Overall, higher informational advantages in EM manifest themselves already in the performance of unconditional insider trading, not additionally through the composite measure. In summary, there is limited to no evidence for the conjecture that stronger private information advantages, or other possible differences in the information environment between EM and DM, lead to stronger return predictability for information-driven
$ CID $
 trades.
F. Cross-Country Analysis
1. Hypothesis Development and Country Characteristics
In the following, we explore whether selected country characteristics, that is, proxies for insider trading regulation and corporate governance, may explain the variation in performance, as reported in Tables 2 and 3. The literature (e.g., Durnev and Nain (Reference Durnev and Nain2007), Fidrmuc et al. (Reference Fidrmuc, Korczak and Korczak2013)) offers a variety of explanation channels leading to multiple possible hypotheses about the link between insider trading regulations (corporate governance) and abnormal returns following transactions by corporate insiders.
The first hypothesis (monitoring hypothesis) predicts a negative relationship between insider trading regulation (corporate governance) and abnormal returns. If insider regulations or corporate governance limit opportunistic insider trading on nonpublic information, we expect larger positive abnormal returns after purchases and more negative abnormal returns after sales in countries with weaker insider regulations (corporate governance). We develop this more general hypothesis on a rationale similar to Fidrmuc et al. (Reference Fidrmuc, Korczak and Korczak2013) with respect to investor protection. The U.S. country-level results of Ravina and Sapienza (Reference Ravina and Sapienza2010) and Dai, Fu, Kang, and Lee (Reference Dai, Fu, Kang and Lee2016) support this hypothesis by showing that executives and independent directors generate higher returns in firms with the weakest governance and that corporate governance significantly reduces the profitability of insider sales. A second hypothesis, which also argues from a rent extraction perspective (substitution hypothesis), predicts a positive relationship only between corporate governance and abnormal returns. If strong corporate governance limits the direct extraction of private benefits from insiders and, consequently, insiders engage more in opportunistic insider trading as an alternative source of wealth extraction, we expect larger positive abnormal returns after purchases and more negative abnormal returns after sales in countries with stronger corporate governance. The results of Cziraki, De Goeij, and Renneboog (Reference Cziraki, De Goeij and Renneboog2014) support this hypothesis by showing that for Dutch firms with better investor protection standards, abnormal returns following insider transactions are higher.
Another possible hypothesis (information-content hypothesis) predicts a positive relationship between insider trading regulation (corporate governance) and abnormal returns following purchases, while predicting a negative relationship following sales. If insider regulations or corporate governance limit opportunistic insider trading on nonpublic information, outside investors could view insider purchases, that is, committing their own funds and bearing diversification losses, as an especially strong sign regarding the future of a firm. Therefore, we expect higher positive abnormal returns after purchases in countries with stronger insider regulations (corporate governance). The information-content hypothesis suggests a somewhat different reasoning for sale transactions. As insiders could sell for various reasons, including liquidity and diversification, the negative signaling effect of insider sales to outside investors can potentially be mitigated. If insider regulations or corporate governance limit opportunistic insider trading on nonpublic information in countries with stronger regulations (governance), the hypothesis assumes that the mitigating effect will be stronger, leading to sale transactions being perceived as a trustworthy liquidity- or diversification-driven trade signal. Therefore, we expect less (more) negative abnormal returns after sales in countries with stronger (weaker) insider regulations. Once again, we develop this more general hypothesis on a rationale similar to Fidrmuc et al. (Reference Fidrmuc, Korczak and Korczak2013) with respect to investor protection. The cross-country results of Fidrmuc et al. (Reference Fidrmuc, Korczak and Korczak2013) support this hypothesis by documenting a positive (negative) relationship between investor protection and the informativeness of insider purchases (sales) using a European/U.S. country sample. Gebka et al. (Reference Gebka, Korczak, Korczak and Traczykowski2017) document that the profitability of insider purchases is higher in countries with better investor protection, also for a sample of European countries.
Empirically, we test whether country characteristics that proxy for insider trading restrictions and corporate governance, that is, investor protection (AS), litigation risk (CLASSA), timing restrictions on trades (BLACKOUT), and the general prevalence of insider trading (ITR), are related to the performance of our insider trading strategies in 34 developed and emerging market countries.Footnote 14 In the following, we explain the reasoning behind the selection of each variable in the cross-country analysis. We provide a detailed description of the variables and summary statistics for the cross-country variables in Tables OA.14 and OA.17 of the Supplementary Material. To proxy for insider trading restrictions and corporate governance, we use the anti-self-dealing (AS) index from Djankov, La Porta, Lopez-de-Silanes, and Shleifer (Reference Djankov, La Porta, Lopez-de-Silanes and Shleifer2008). AS is a survey-based measure of the legal protection of minority shareholders against expropriation. The index ranges from 0 (weak control of self-dealing transactions) to 1 (strong control). We conjecture that the more laws that are in place to protect minority shareholders, the more difficult it will generally be for corporate insiders to profitably exploit private information advantages. The second proxy is the class action dummy (CLASSA) of Leuz (Reference Leuz2010). CLASSA is equal to 1 if class action lawsuits are possible against illegal corporate insider trading, and 0 otherwise. We conjecture that the litigation risk corporate insiders must face will restrain corporate insiders more from opportunistic insider trading (e.g., Cheng, Huang, and Li (Reference Cheng, Huang and Li2016), Adhikari, Agrawal, and Sharma (Reference Adhikari, Agrawal and Sharma2025)) in countries where class action lawsuits are possible. This variable is likely to express its effect mainly through the short side, as investors are more likely to be severely disturbed by the avoided losses of insiders in the event of their own losses. The third proxy is a variable proposed by Brochet (Reference Brochet2019) that measures timing restrictions on insider trades by determining whether insiders trade during blackout periods (i.e., shortly before a QEA). We calculate blackout periods (BLACKOUT) following Brochet (Reference Brochet2019) as the difference between the percentage of insider trades that occur within 1 month after a QEA and the month before, aggregated by country-quarter. The blackout period measure ranges from −1 (only trades before the QEA in a given quarter = low insider trading restrictions) to 1 (only trades after the QEA in a given quarter = high insider trading restrictions). We conjecture that if insiders must wait until after the QEA to trade because they are not allowed to trade or are restricted from trading shortly before the announcement, it becomes less likely that the information advantage still remains after the QEA.Footnote 15 The fourth proxy is the insider trading restriction index (ITR) of Denis and Xu (Reference Denis and Xu2013). ITR measures the “perceived” degree of insider trading restrictions through a global survey of corporate officers. We conjecture that insider trading is more restricted in countries in which top executives, that is, corporate officers, themselves view insider trading not to be common in the respective domestic market. Therefore, higher ITR values indicate a more restrictive insider trading environment, as insider trading is not common in this case. Our conjectures for all four variables (AS, CLASSA, BLACKOUT, ITR) are in line with the monitoring hypothesis and, with respect to the short legs, also in line with the information-content hypothesis. Finally, we construct a combined insider regulation index (IRI) using all aforementioned individual cross-country variables (AS, CLASSA, BLACKOUT, ITR). We provide further details on the aggregated IRI measure in Table OA.17 of the Supplementary Material.
2. Analysis Based on Insider Trading Restrictions
The cross-country analysis aims to identify cross-country differences that are able to explain the varying abnormal performance of the unconditional (
$ UNC $
 ) and composite (
$ CID $
 ) information-driven insider trading strategies across countries. Therefore, the dependent variables are the country-level long–short raw returns obtained from Tables 2 and 3. Consequently, the independent variables are country characteristics comprising the time-invariant AS, CLASSA, and ITR, the time-averaged BLACKOUT, and the composite IRI (a standardized index of the preceding four proxies). Following Kolasinski and Yang (Reference Kolasinski and Yang2018) and Cochrane (Reference Cochrane2005), we estimate a one-step panel regression framework that jointly identifies the country-level risk-adjusted returns and their relation to country characteristics, using country-specific FF6 factor loadings (implemented via country-factor interactions):

where
$ {R}_{c,t}^{LS} $
 is the value-weighted (equal-weighted) monthly long–short return in country
$ c $
 and month
$ t $
 , based on the country-level portfolios reported in Tables 2 and 3, respectively. The vector
$ {\mathbf{X}}_c $
 contains the time-invariant country-level insider regulation proxies and the vector
$ {\mathbf{F}}_{c,t} $
 contains the country-specific monthly FF6 factor returns. The factor-loading vector
$ {\boldsymbol{\beta}}_c $
 is allowed to vary by country, so that each country has its own exposure to the FF6 factors. The coefficient vector
$ \boldsymbol{\gamma} $
 captures the relation between the insider regulation proxies and cross-country differences in risk-adjusted long–short returns. Standard errors are double-clustered by country and month.
Table 10 reports the empirical results with respect to unconditional (
$ UNC $
 , in Panel A) or composite (
$ CID $
 , in Panel B) information-driven long–short insider trading strategies. In Table OA.15 of the Supplementary Material, we provide the same analysis separately for the long and short portfolios.

TABLE 10 Long description
The table is divided into Panel A for the U N C (unconditional) strategy and Panel B for the C I D (composite information-driven) strategy. Both panels report value-weighted (V W) and equal-weighted (E W) long-short returns across 34 countries.
Panel A (U N C):
- AS (anti-self-dealing index): V W coefficients range from -0.530 to -0.507; E W coefficients range from -0.644 (significant at 1 percent) to -0.397 (significant at 10 percent).
- CLASSA (class action dummy): V W coefficients are -0.256 and -0.196; E W coefficients are -0.114 and -0.052.
- BLACKOUT (blackout periods): V W coefficients are -0.210 and 0.161; E W coefficients are -0.979 and -0.887 (both significant at 5 percent).
- ITR (insider trading restriction index): V W coefficients are -0.047 and -0.032; E W coefficients are -0.053 and 0.045.
- IRI (combined index): V W coefficient is -0.199 (significant at 10 percent); E W coefficient is -0.260 (significant at 5 percent).
- N (observations): Ranges from 6,029 to 6,210.
- R-squared: Ranges from 0.097 to 0.101.
Panel B (C I D):
- AS: V W coefficients are -0.743 and -0.715; E W coefficients are -0.541 and -0.257.
- CLASSA: V W coefficients are -0.225 and -0.123; E W coefficients are -0.066 and -0.004.
- BLACKOUT: V W coefficients are -0.502 and 0.064; E W coefficients are -0.962 and -1.148 (both significant at 10 percent).
- ITR: V W coefficients are -0.103 and -0.084; E W coefficients are -0.014 and 0.102.
- IRI: V W coefficient is -0.281 (significant at 10 percent); E W coefficient is -0.209.
- N (observations): Ranges from 6,029 to 6,210.
- R-squared: Ranges from 0.089 to 0.102.
T-statistics are provided in parentheses below each coefficient. Asterisks indicate statistical significance levels: * for 10 percent, ** for 5 percent, and *** for 1 percent.
Assuming that the monitoring hypothesis is correct, one would expect AS, CLASSA, BLACKOUT, ITR, and IRI to take negative values, as an increase in all of them indicates higher insider trading restrictions.
Panels A and B of Table 10 report the results of the regressions for the value- and equal-weighted long–short implementations of the unconditional (
$ UNC $
 ) and composite (
$ CID $
 ) information-driven insider trading strategies, respectively. The univariate regressions of Panel A show consistent results in line with the monitoring hypothesis, that is, consistently negative although only sometimes significant coefficients.Footnote
16 We only find a significant (at the 5% level) relationship between the equal-weighted
$ UNC $
 strategy and the anti-self-dealing index (AS), the occurrence of blackout periods (BLACKOUT), and the composite insider regulation index (IRI), respectively. This suggests that the abnormal performance of the equal-weighted
$ UNC $
 strategy is greater in countries with lower insider trading restrictions. Judging the explanatory power of insider trading restrictions based on the multiple regression framework which jointly includes all four original proxies reveals no significant relation with respect to the value-weighted
$ UNC $
 strategy and a negative relation (at the 5% level) between the equal-weighted
$ UNC $
 strategy and BLACKOUT only. Nevertheless, at least most of the signs remain negative across proxies and specifications.
Assuming that the relative outperformance of the
$ CID $
 strategy originates from insiders using nonpublic information, we conjecture that the explanatory power of insider trading restriction proxies is stronger for these trading strategies. Contradicting this conjecture, Panel B shows fewer (i.e., no) significant coefficients (at the 5% level) for the insider regulation proxies. This is also confirmed by the insignificant coefficients in all specifications of the cross-country analysis for the long–short
$ CID- UNC $
 strategy in Table OA.16 of the Supplementary Material.Footnote
17
Finally, as an alternative test to the regression-based cross-country analysis, we use the composite insider regulation index (IRI) to create high (HIRI) and low (LIRI) regulation regions via a tercile split to replicate the main DM versus EM analysis of Tables 4 and 9 for the high and low regulation samples. The results are reported in Table OA.21 of the Supplementary Material.Footnote
18 Overall, the high versus low insider regulation sample tests only show limited evidence for a greater outperformance in low regulation regions, as only the value-weighted country-neutral
$ CID- UNC $
 spreads are statistically significant.
Overall, the comparatively weaker findings for the
$ CID $
 strategies in Panel B of Table 10 and the insignificant results for the performance differences between high and low regulation samples may imply that regulatory differences of insider trading restrictions across countries are not a key driver of the strategy performance. Rather than exploiting nonpublic information, informative insiders in the
$ CID $
 strategies may achieve their outperformance primarily through a superior interpretation of public information compared to outside investors.
VI. Conclusion
How to identify information-driven trades by insiders is a long-standing question in the literature. Previous work typically addresses this research question by proposing individual, presumably information-driven signals for the U.S. market. We suggest a novel approach by synthesizing a substantial subset of previously proposed signals into an overall cross-sectional measure and show that it tends to perform well in a global sample, especially for smaller stocks. Further tests find no direct evidence of exploitation of private information, although we caution that private information (exploitation) cannot be measured directly. Instead, they are consistent with the notion that insiders may interpret short-term public information particularly well. Our work suggests different directions for future research. First, the precise information that insiders use to make their buying and selling decisions remains largely unknown. Second, similar composite approaches could be applied to the performance prediction of other presumably informed market participants, such as mutual funds, hedge funds, or analysts.
Supplementary Material
To view supplementary material for this article, please visit http://doi.org/10.1017/S0022109026103366.


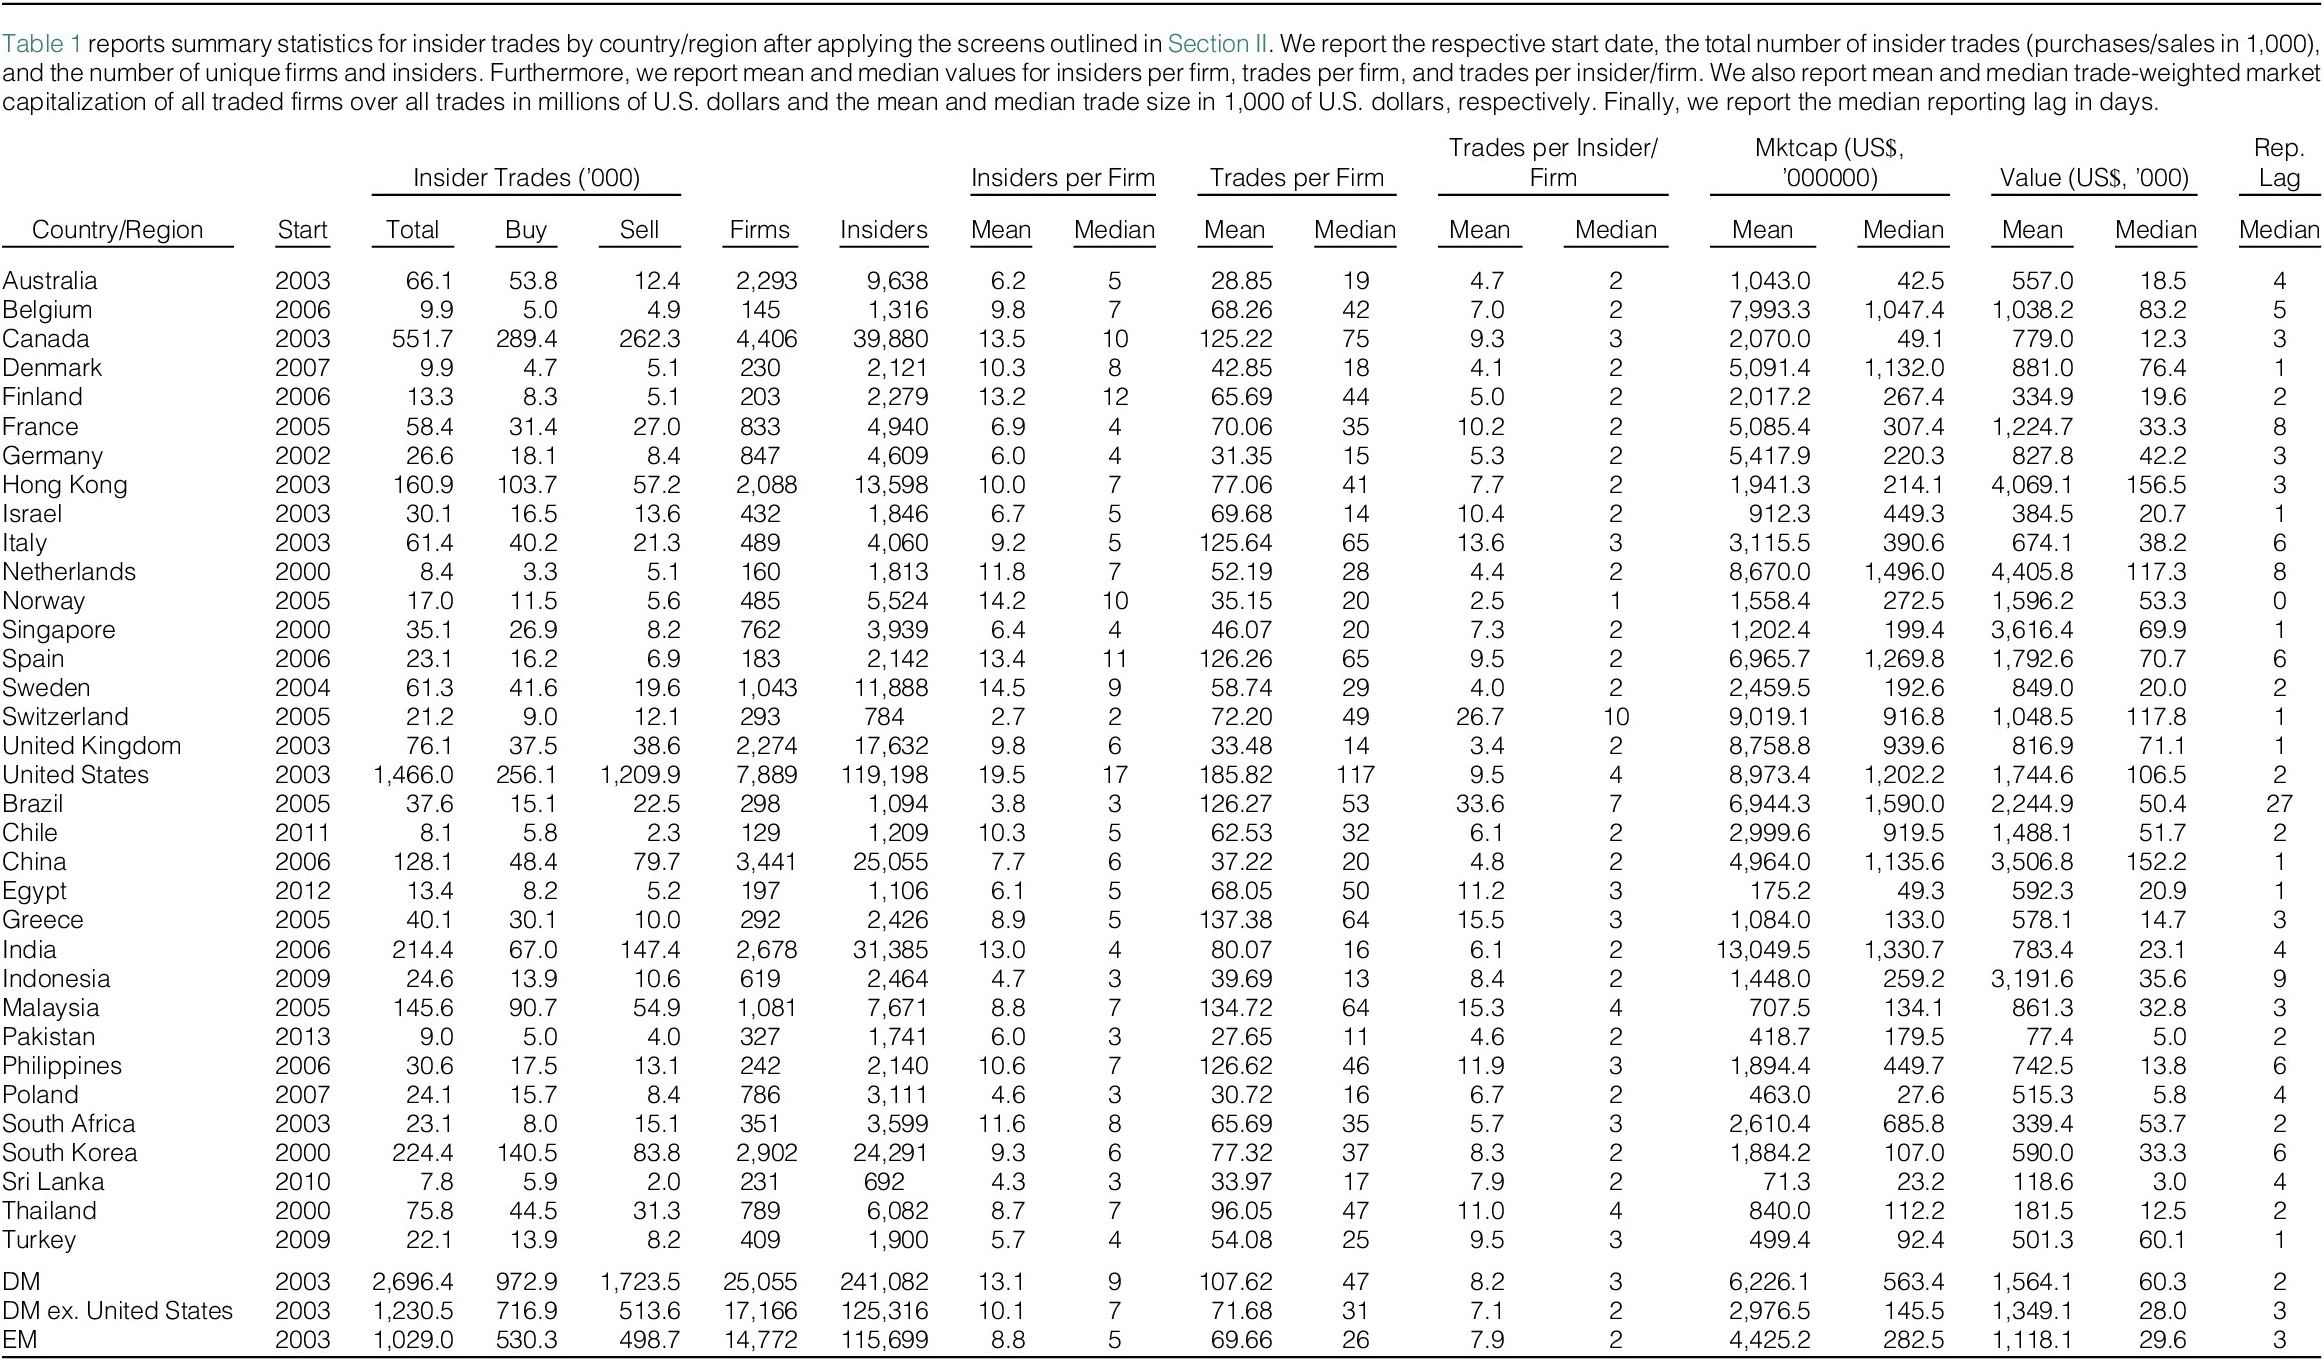
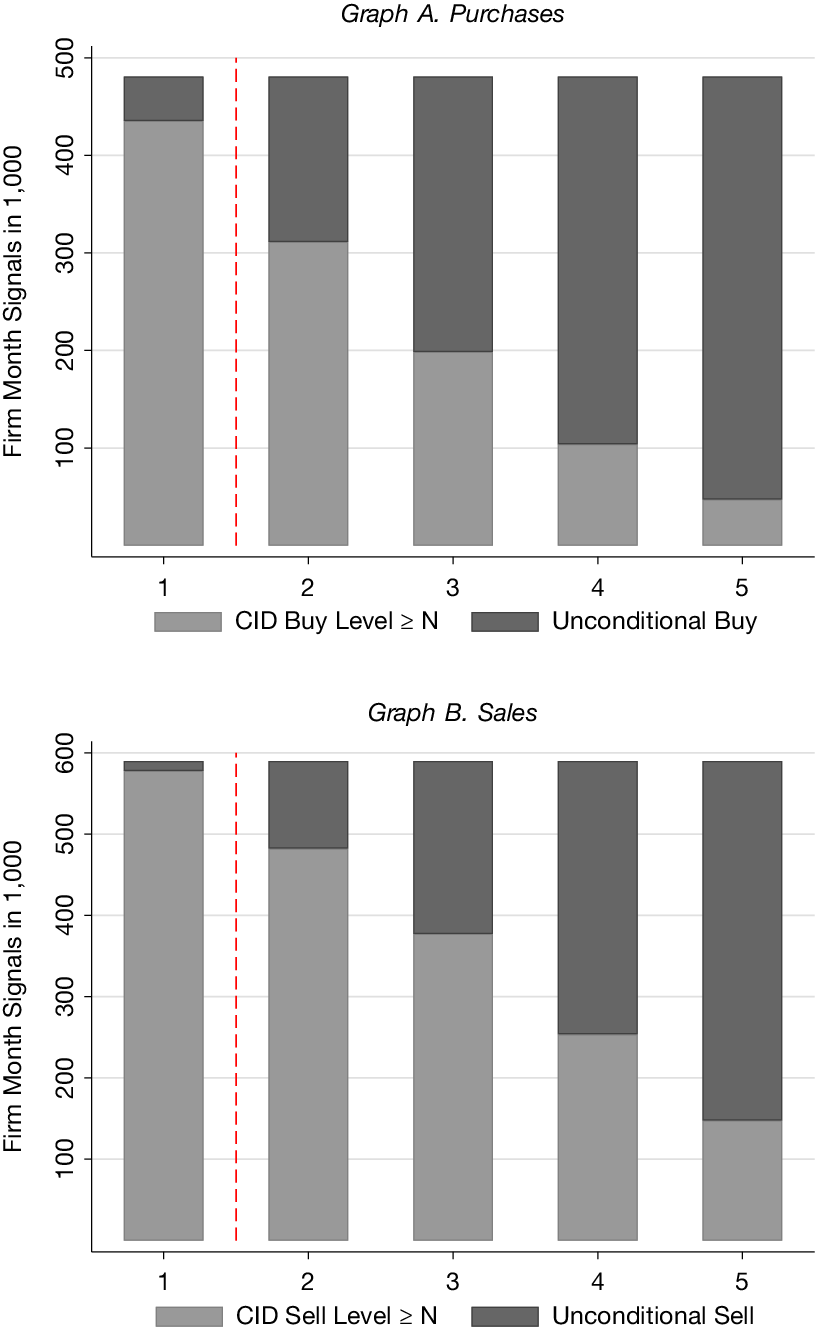


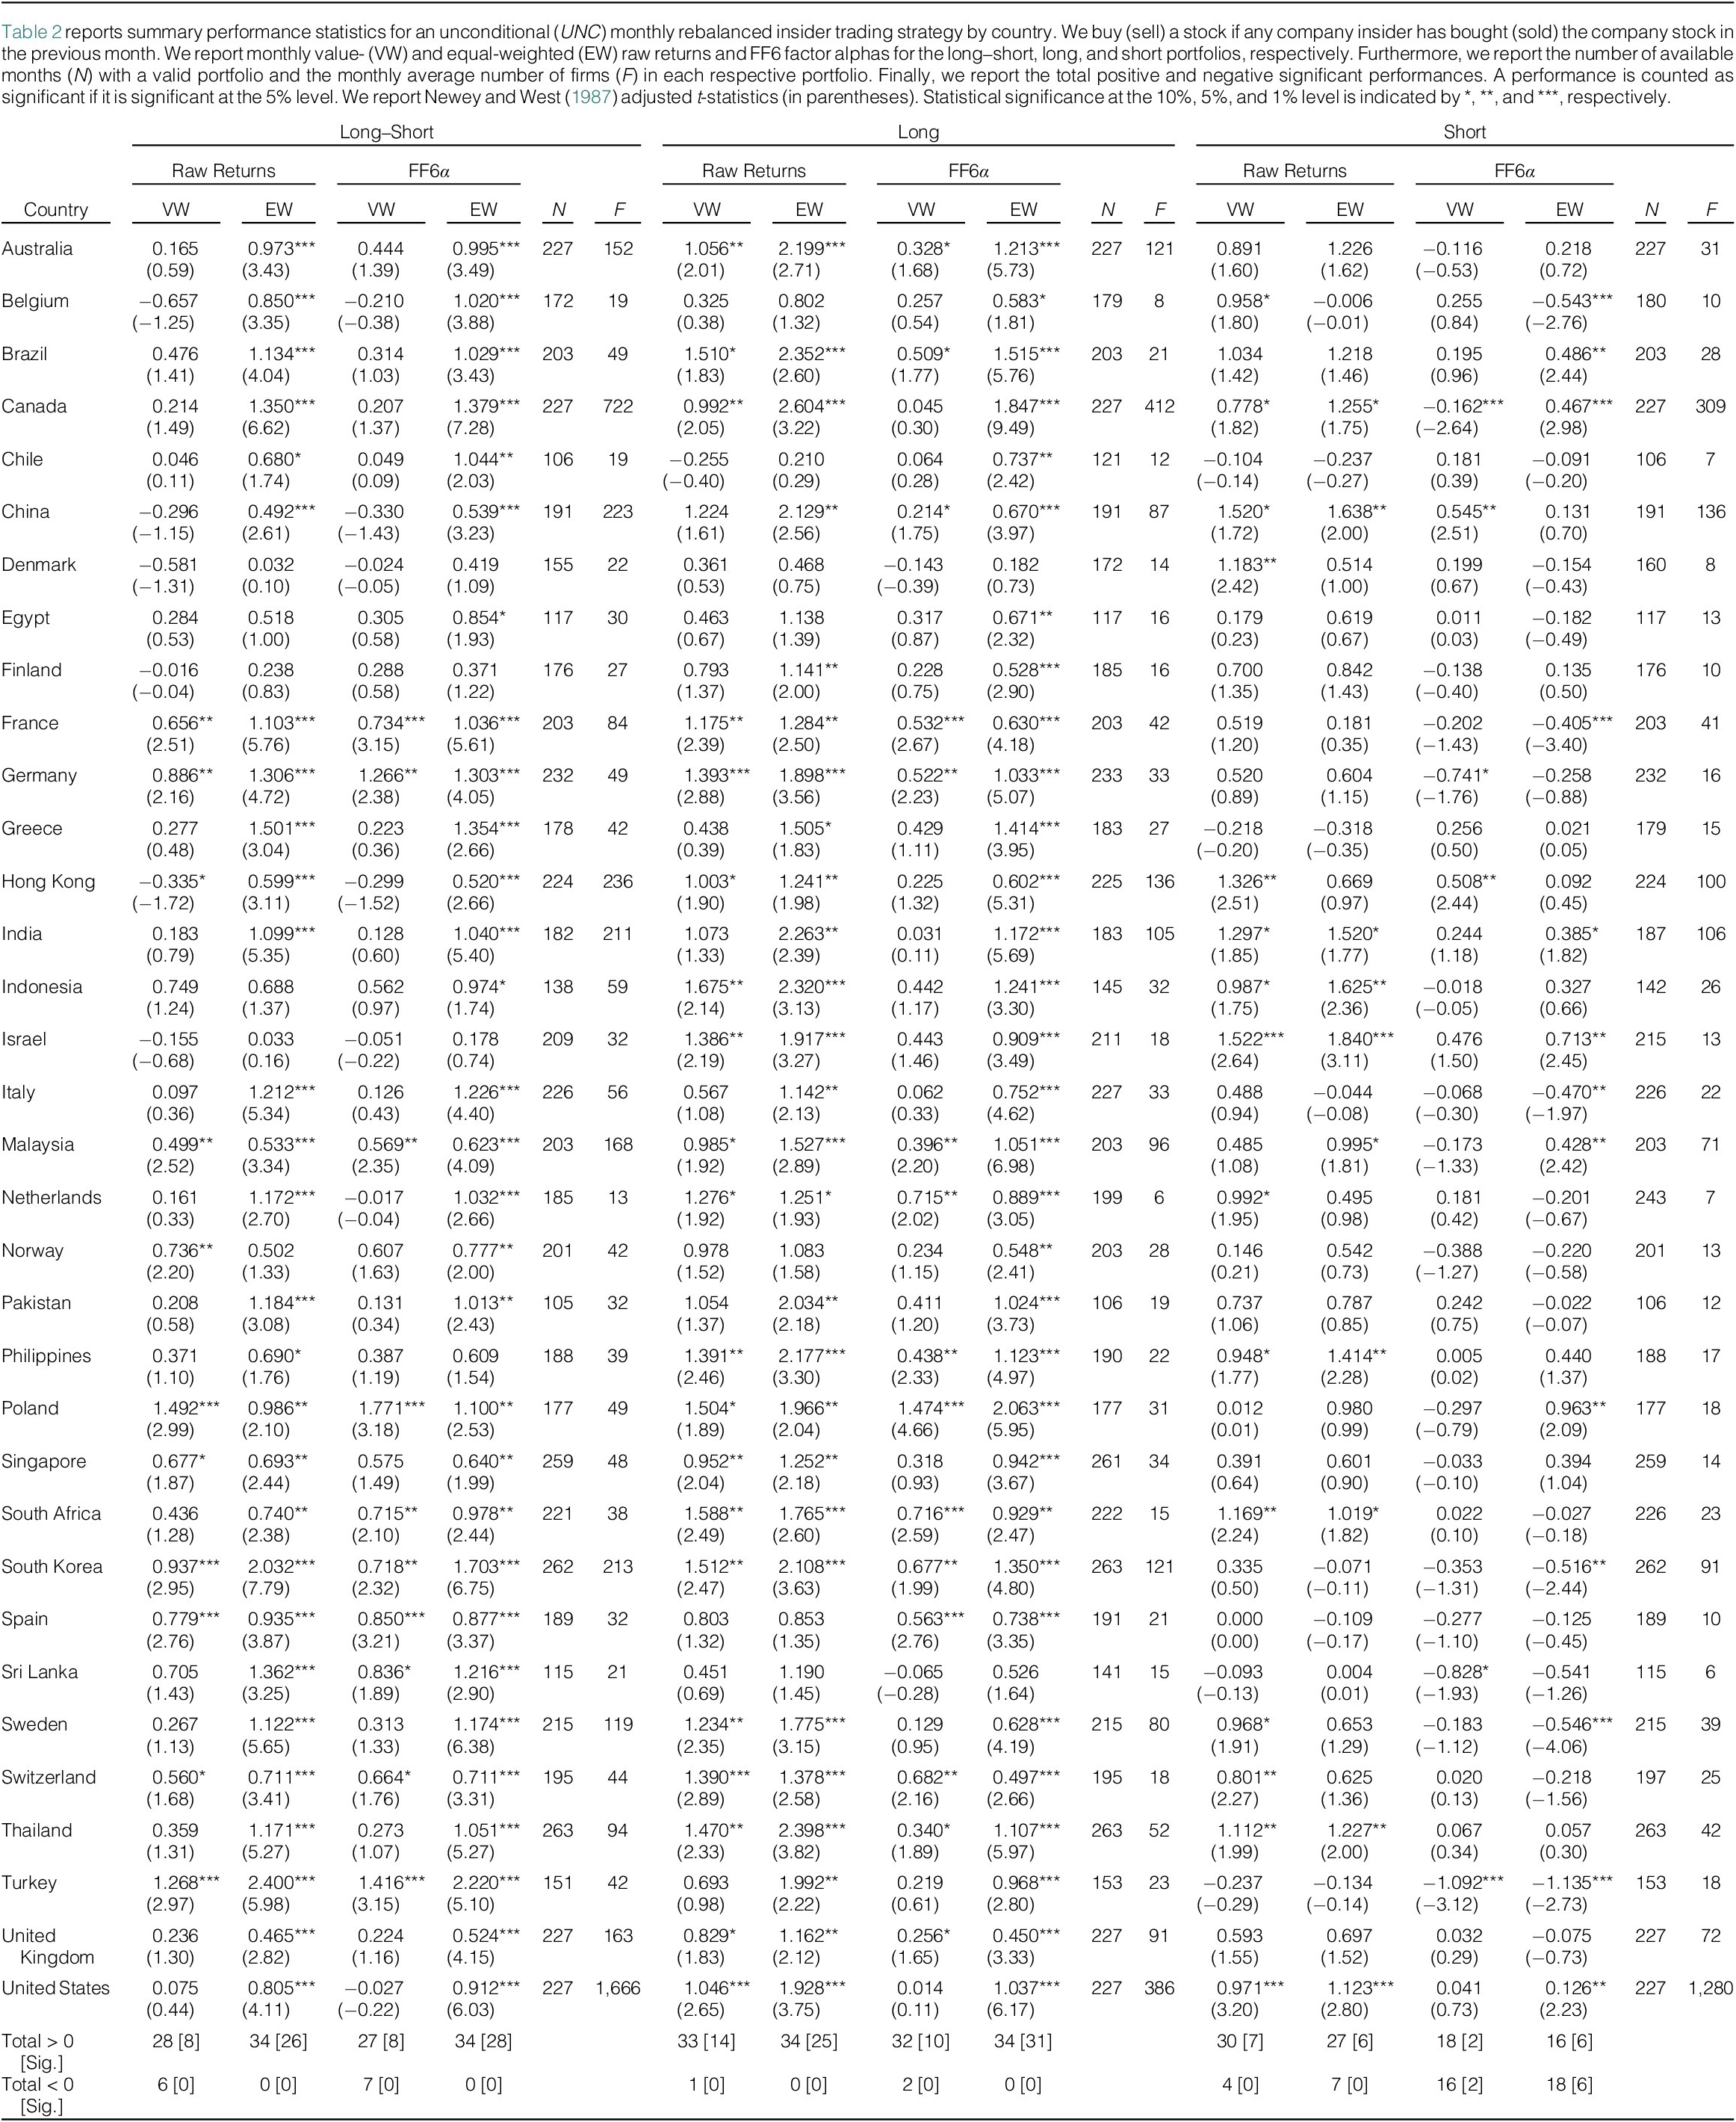
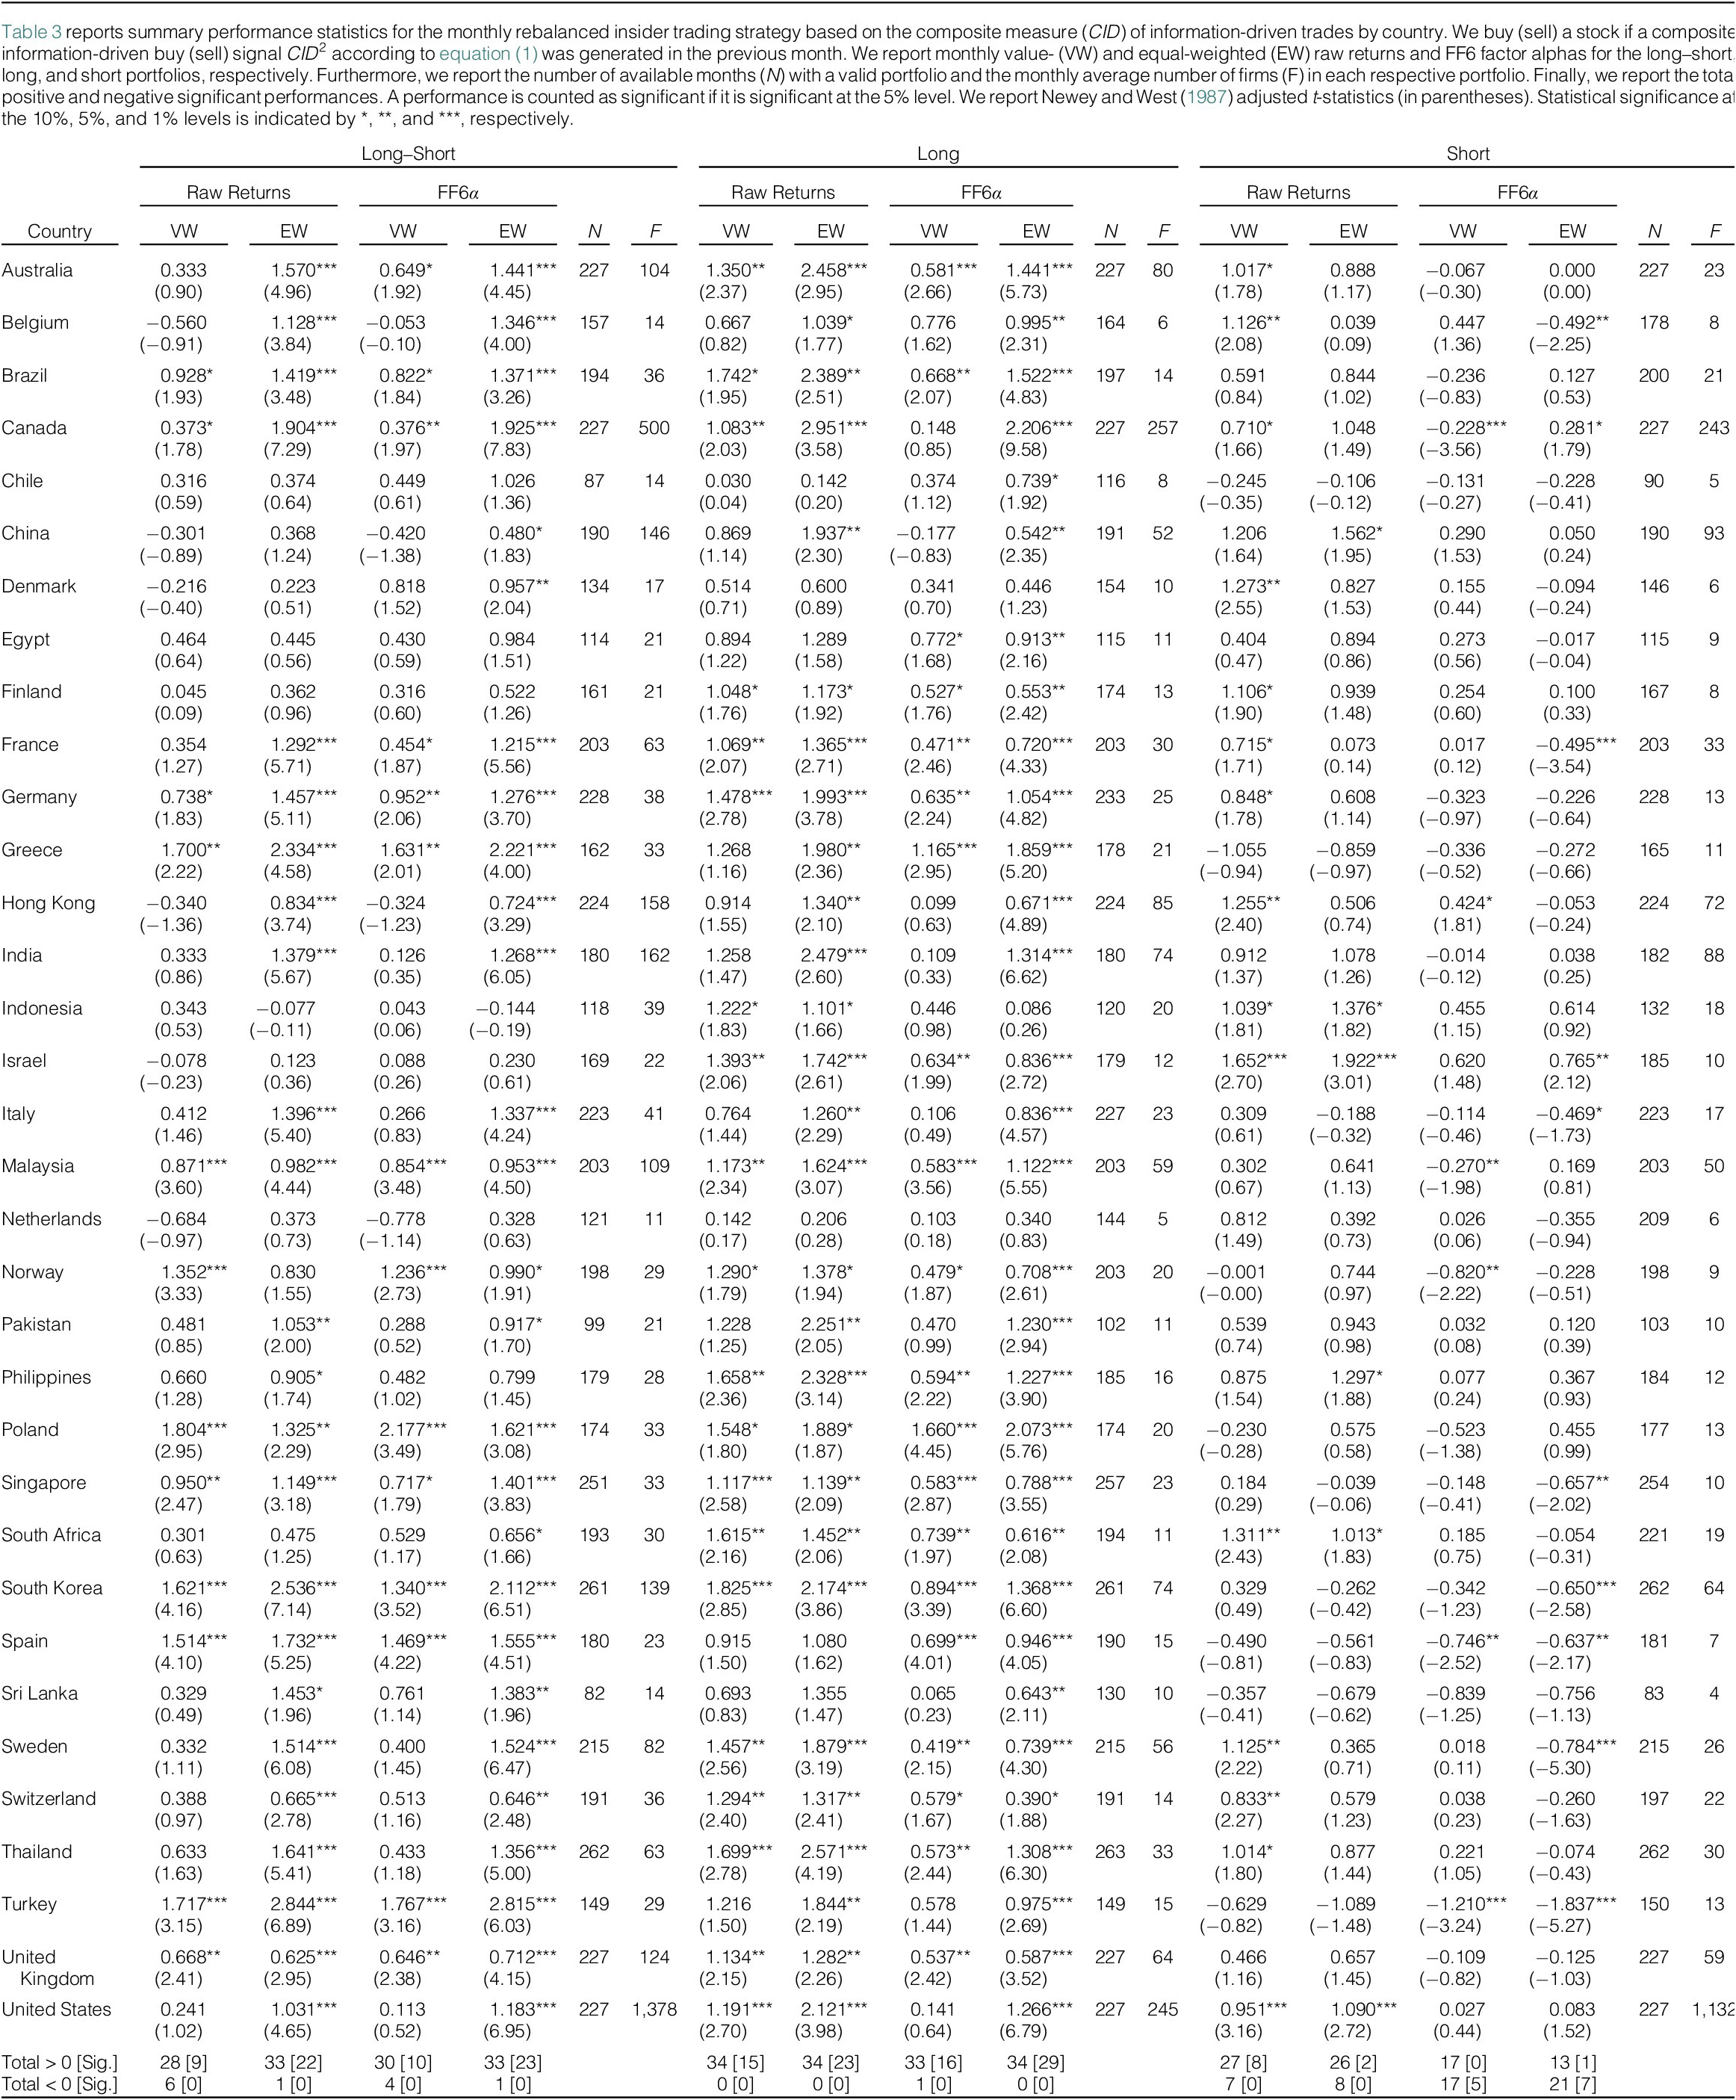
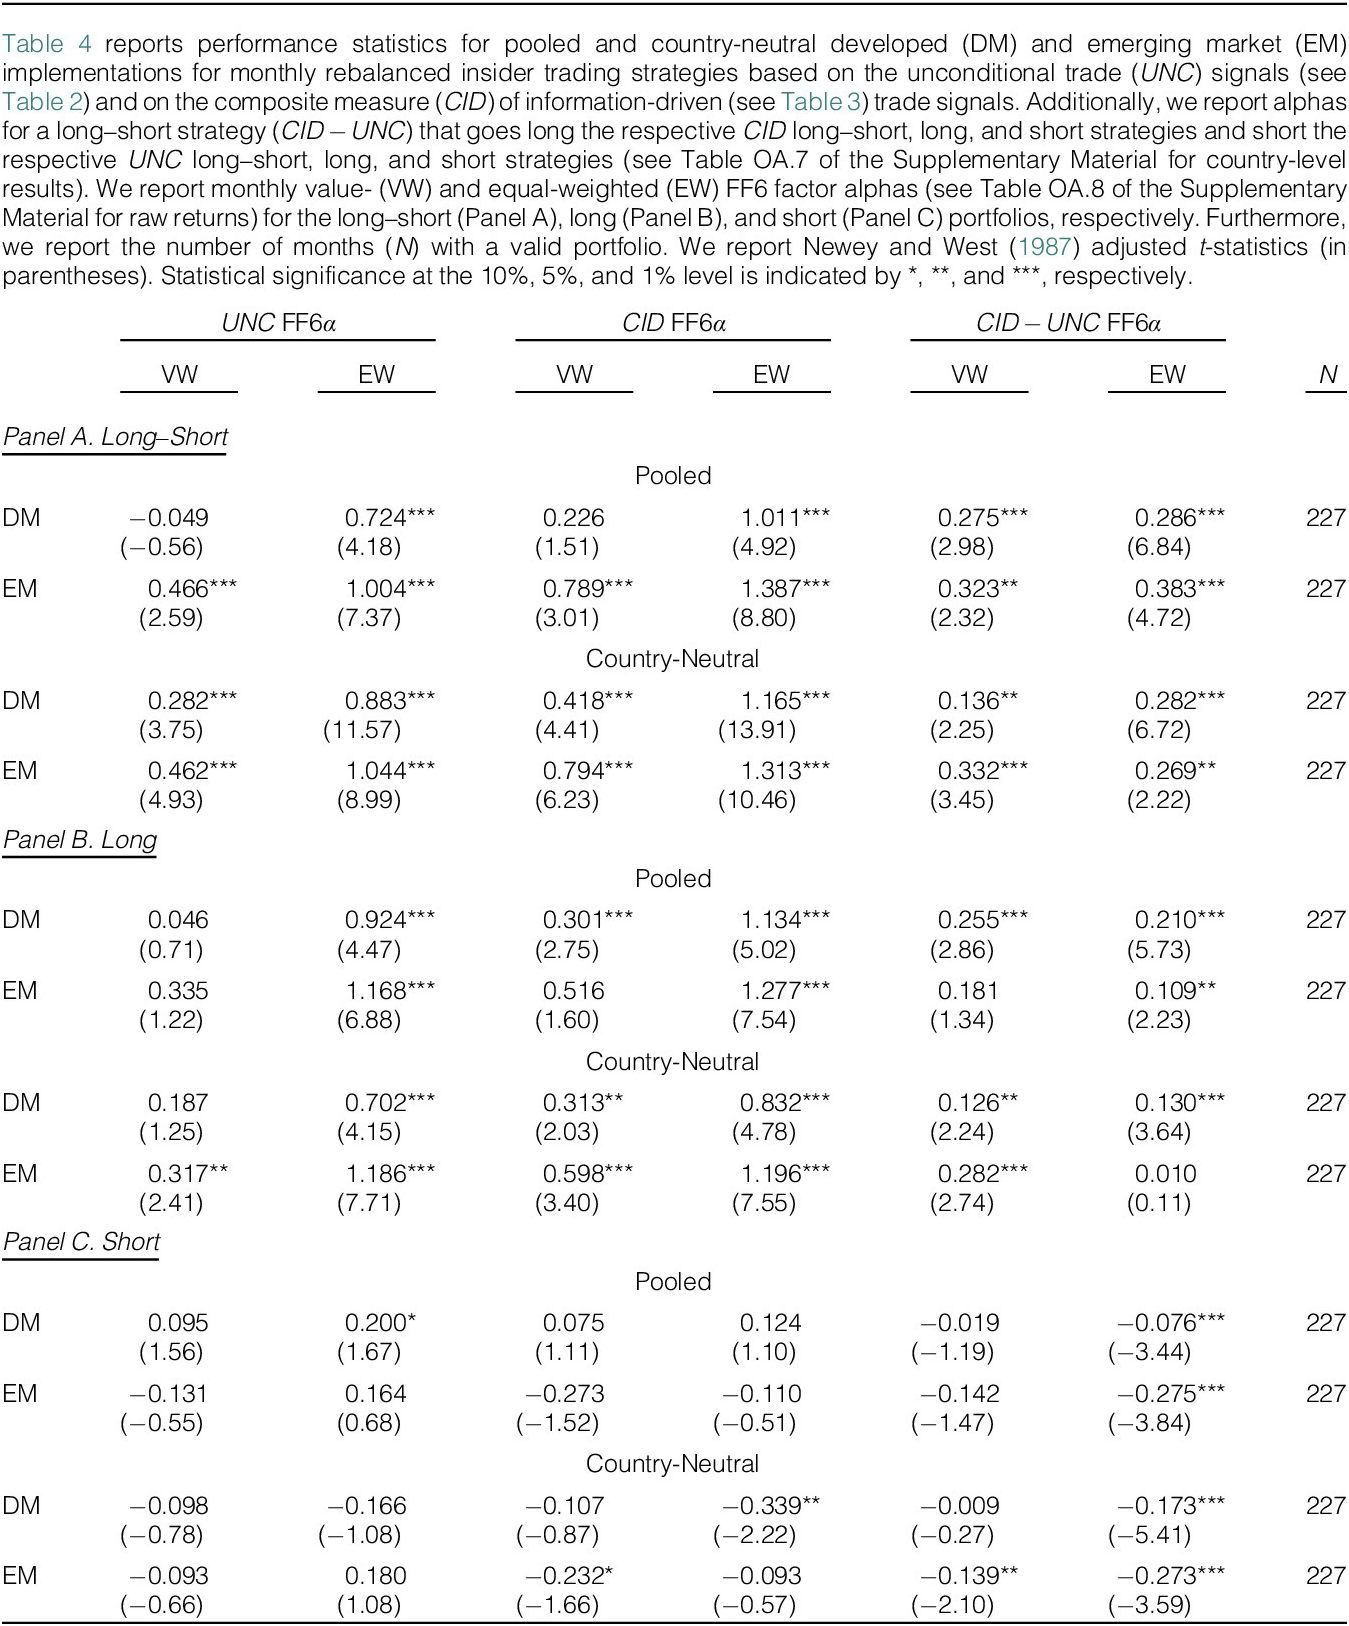
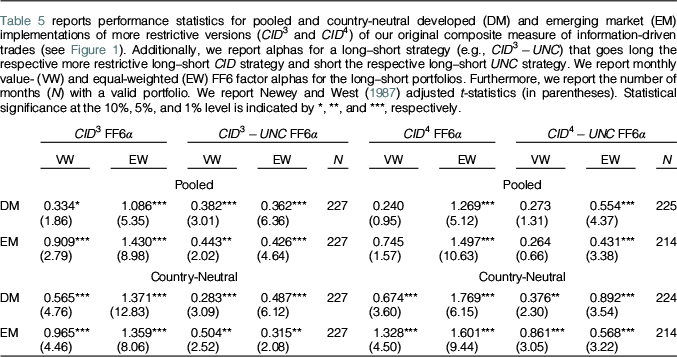
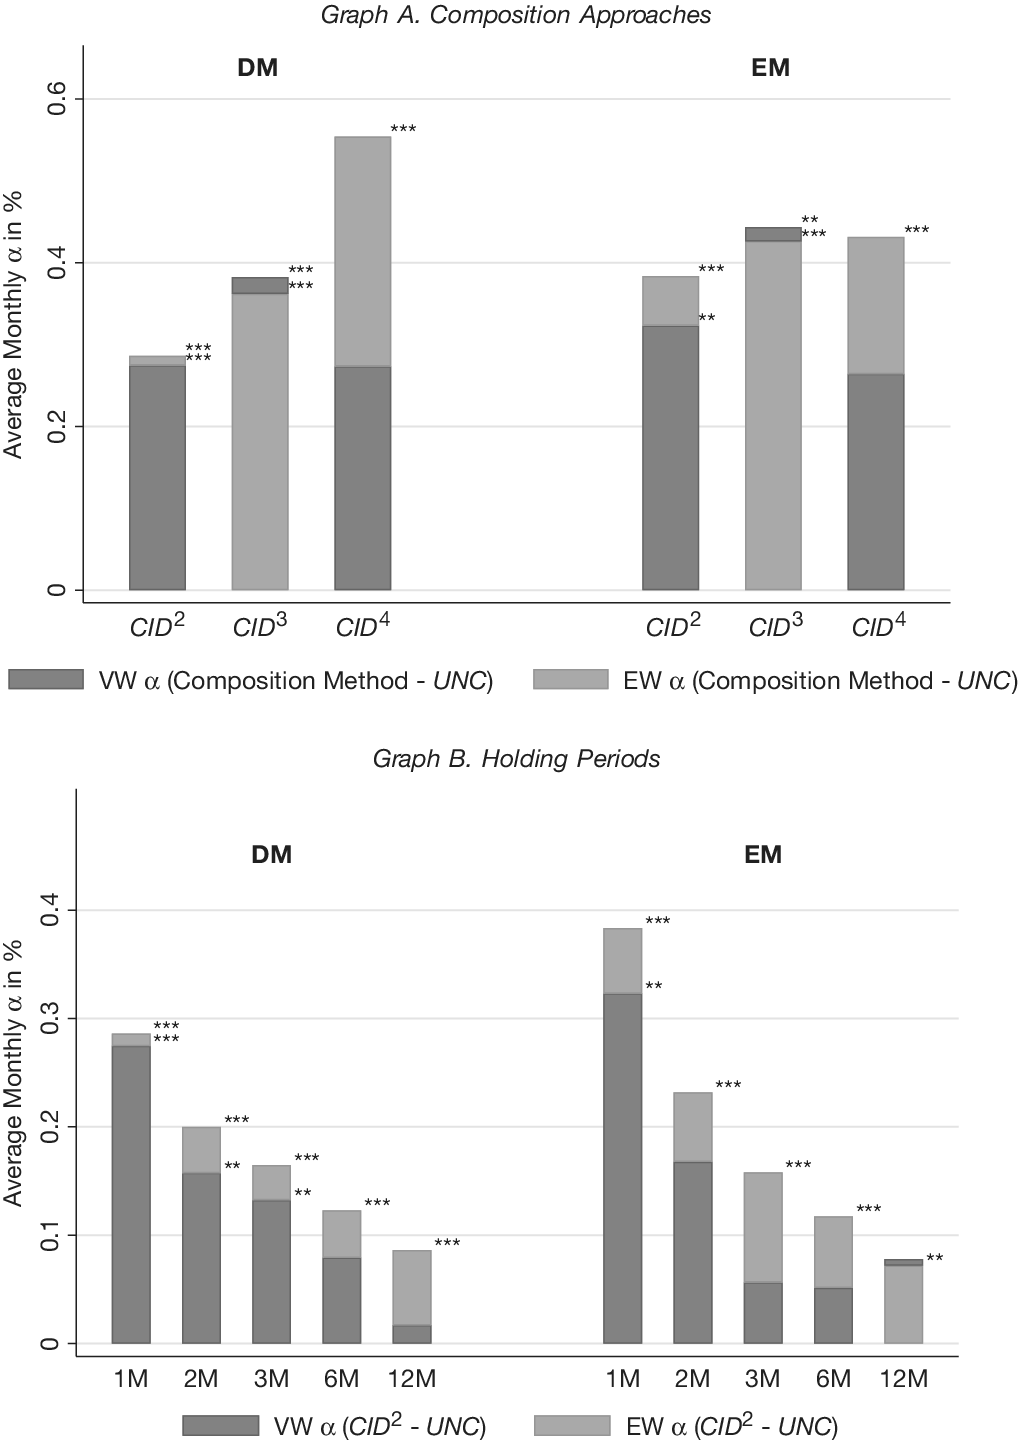


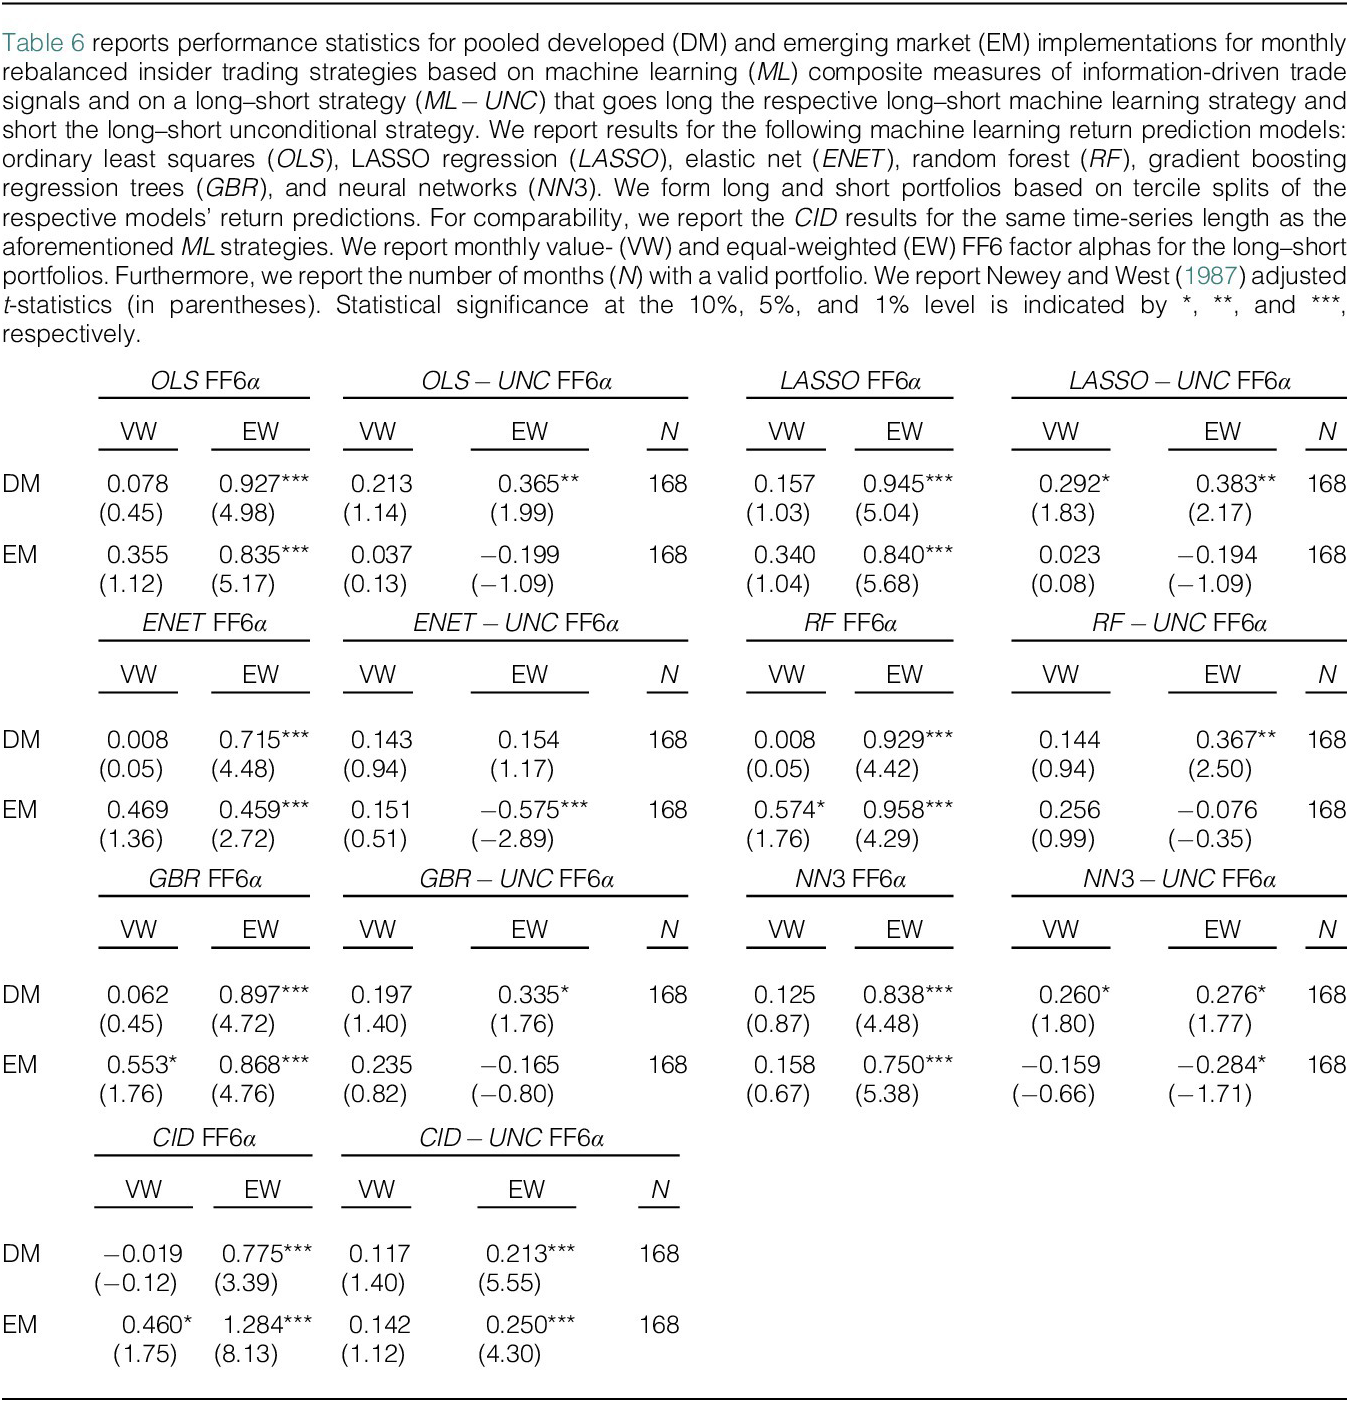
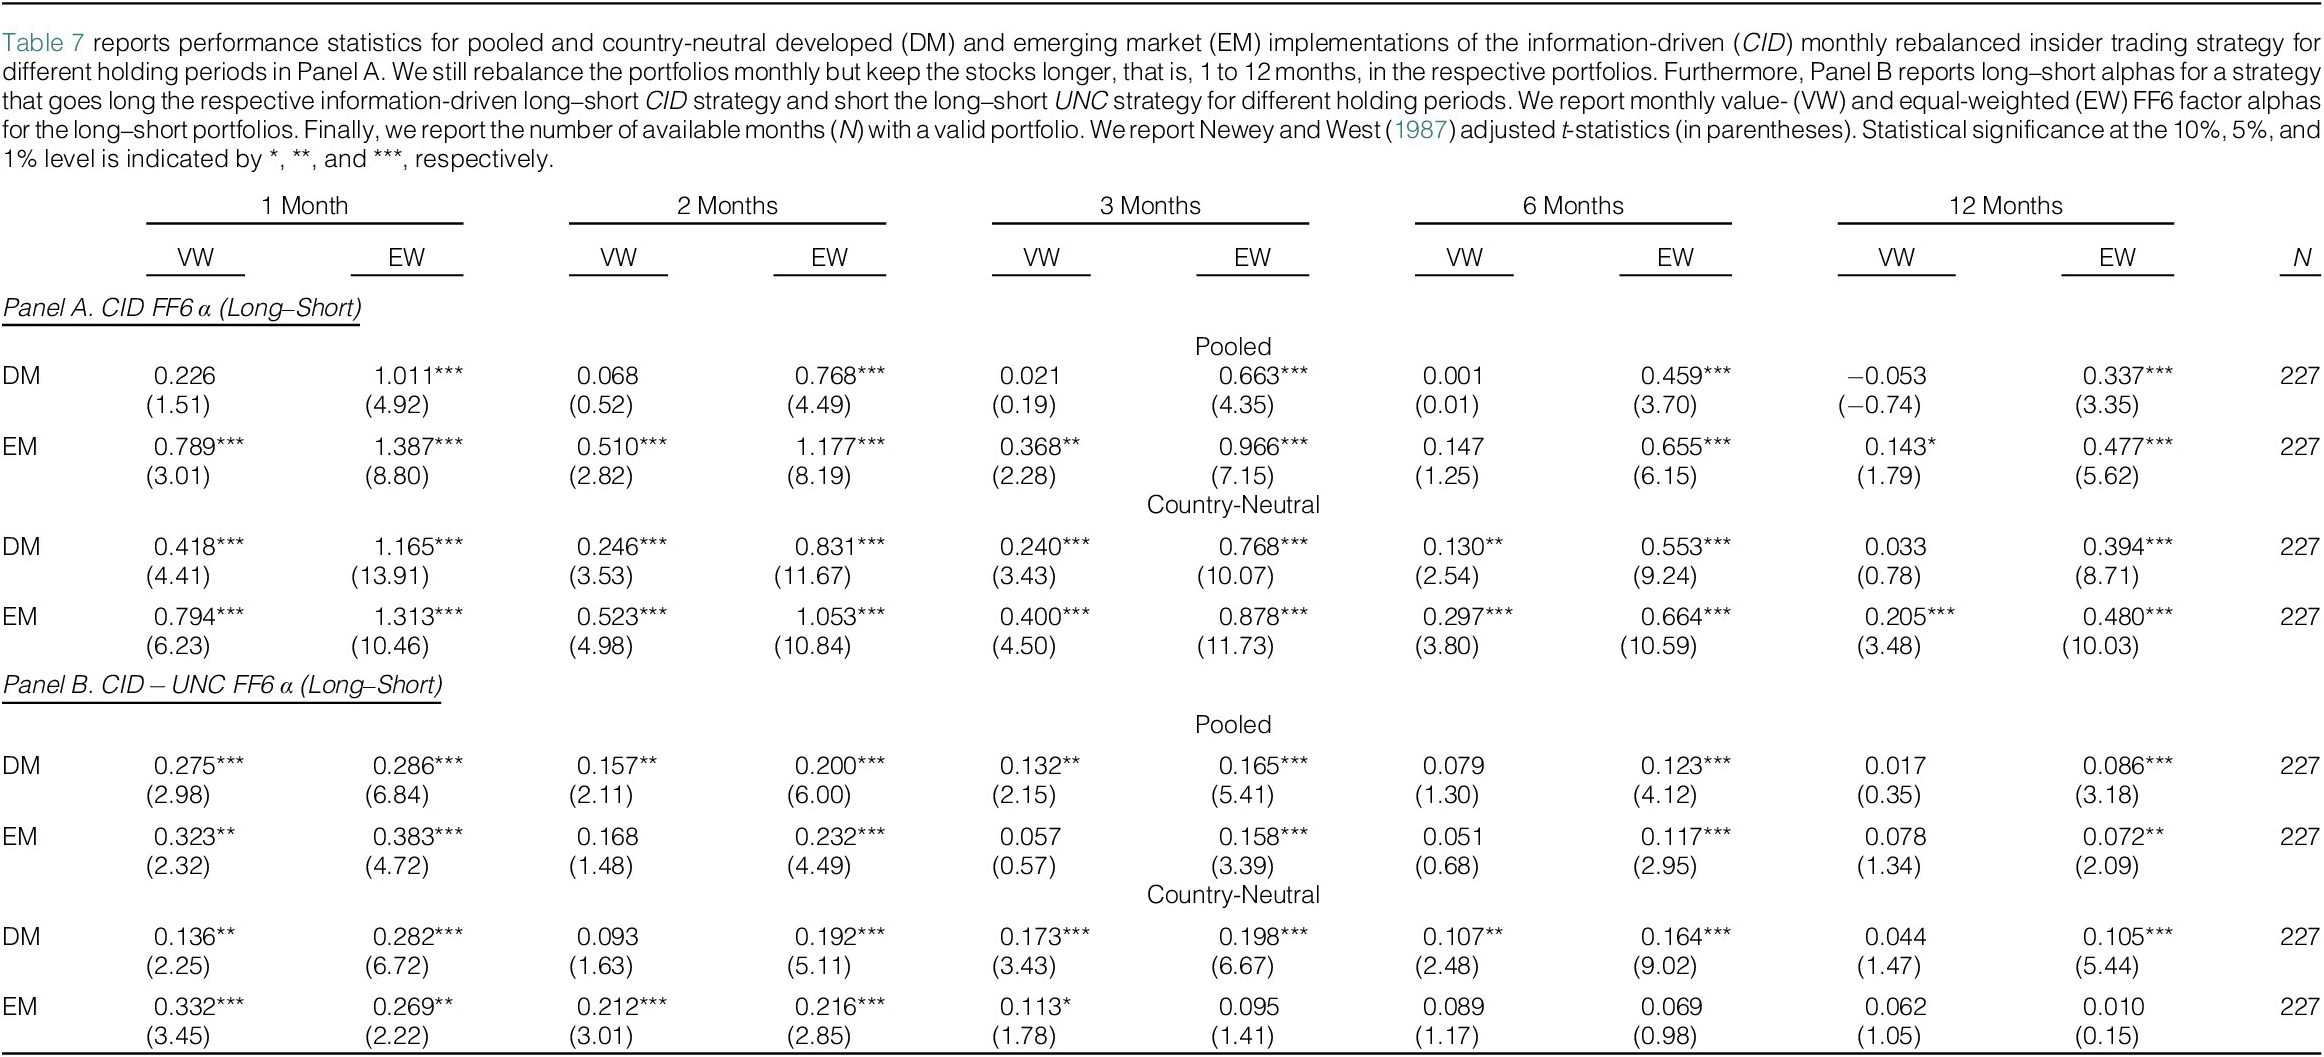
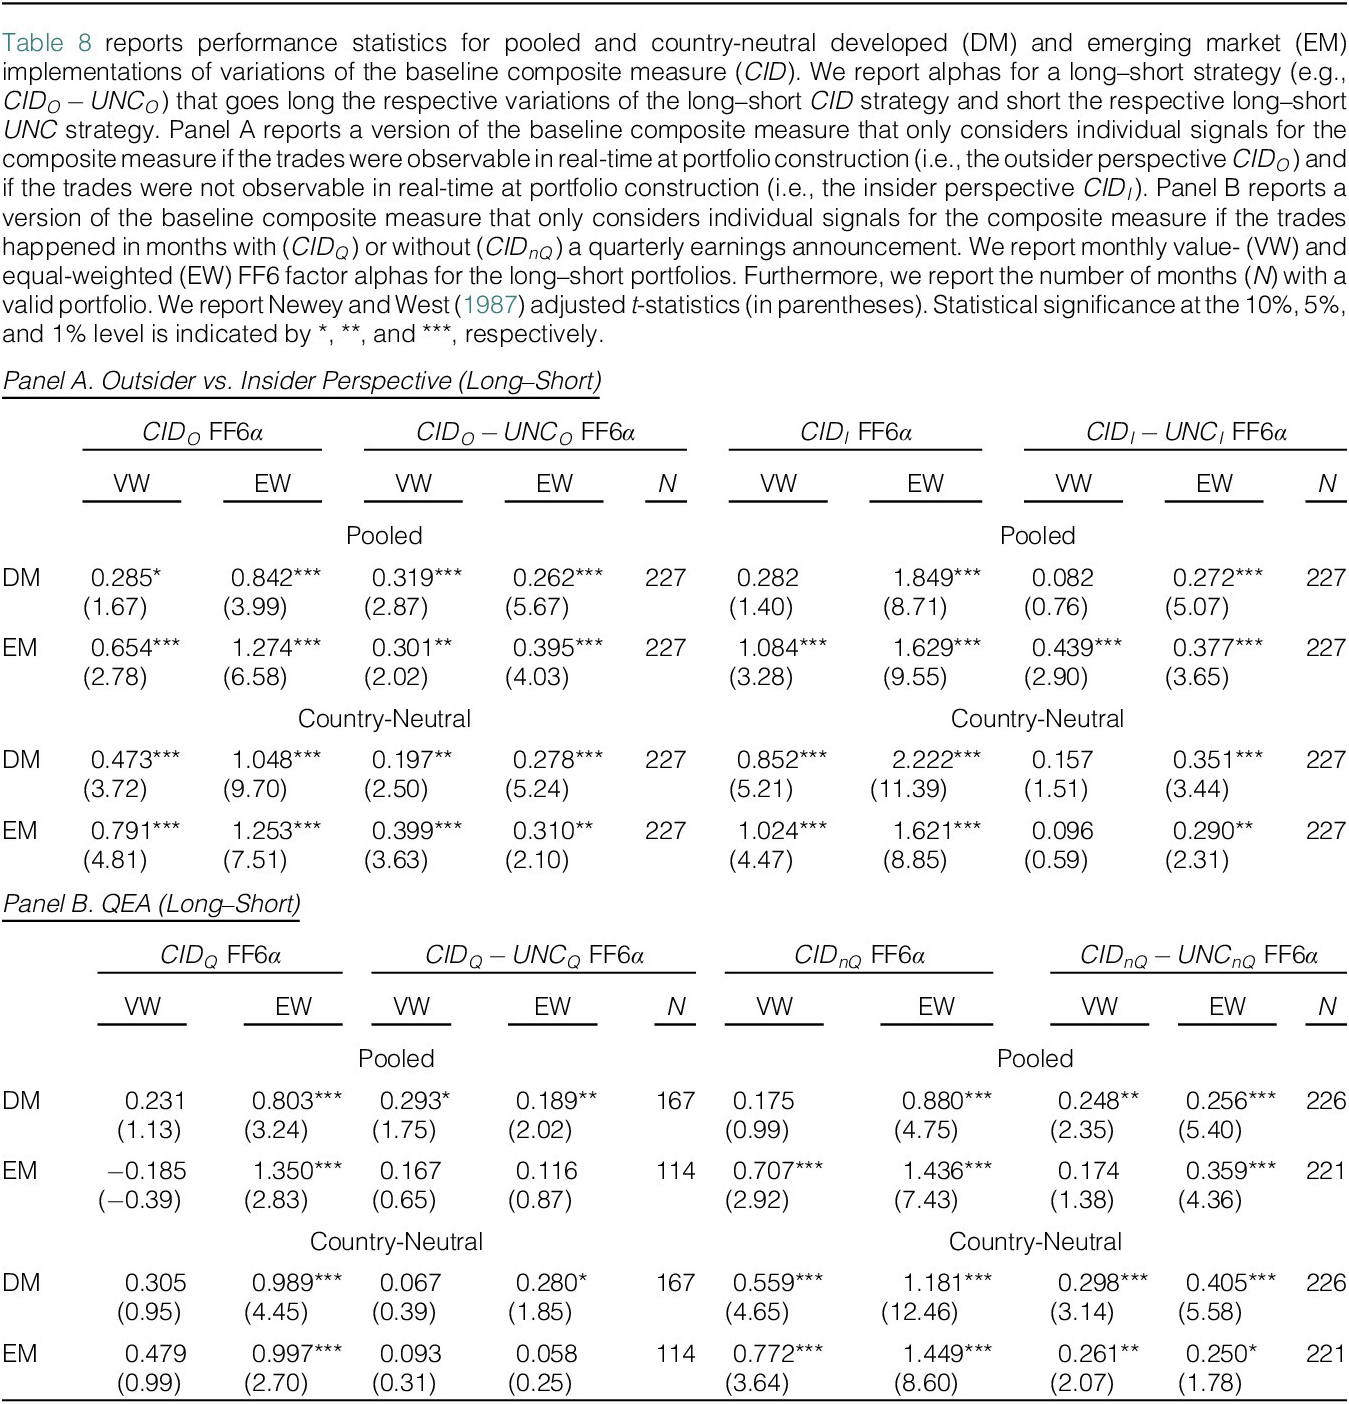
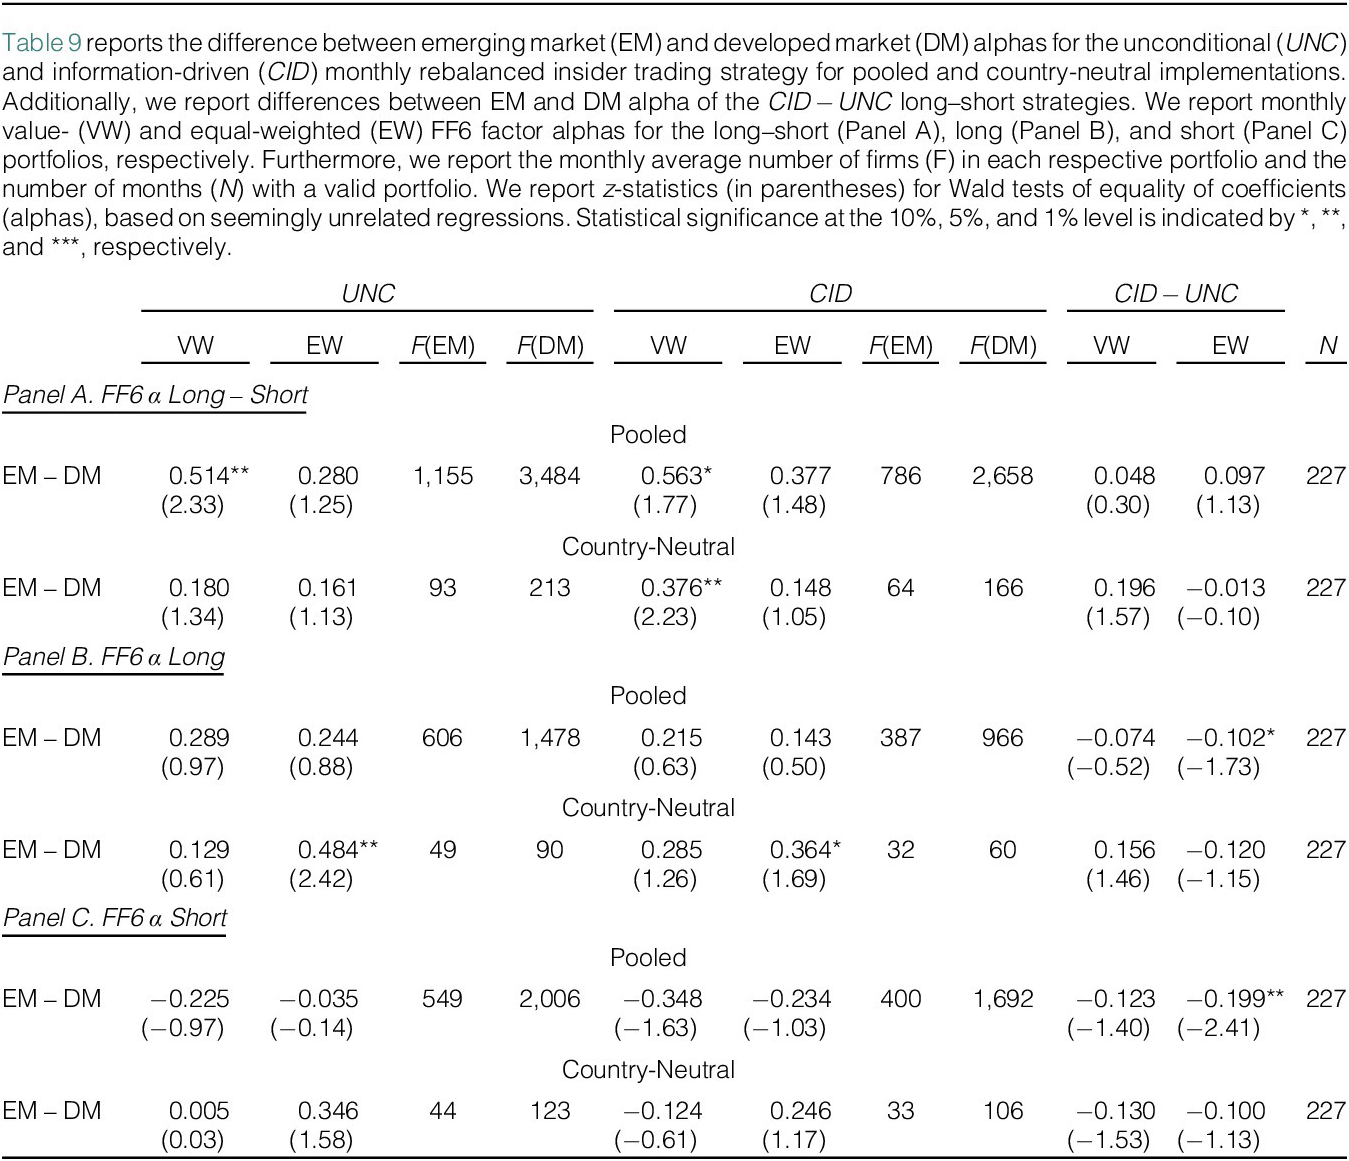
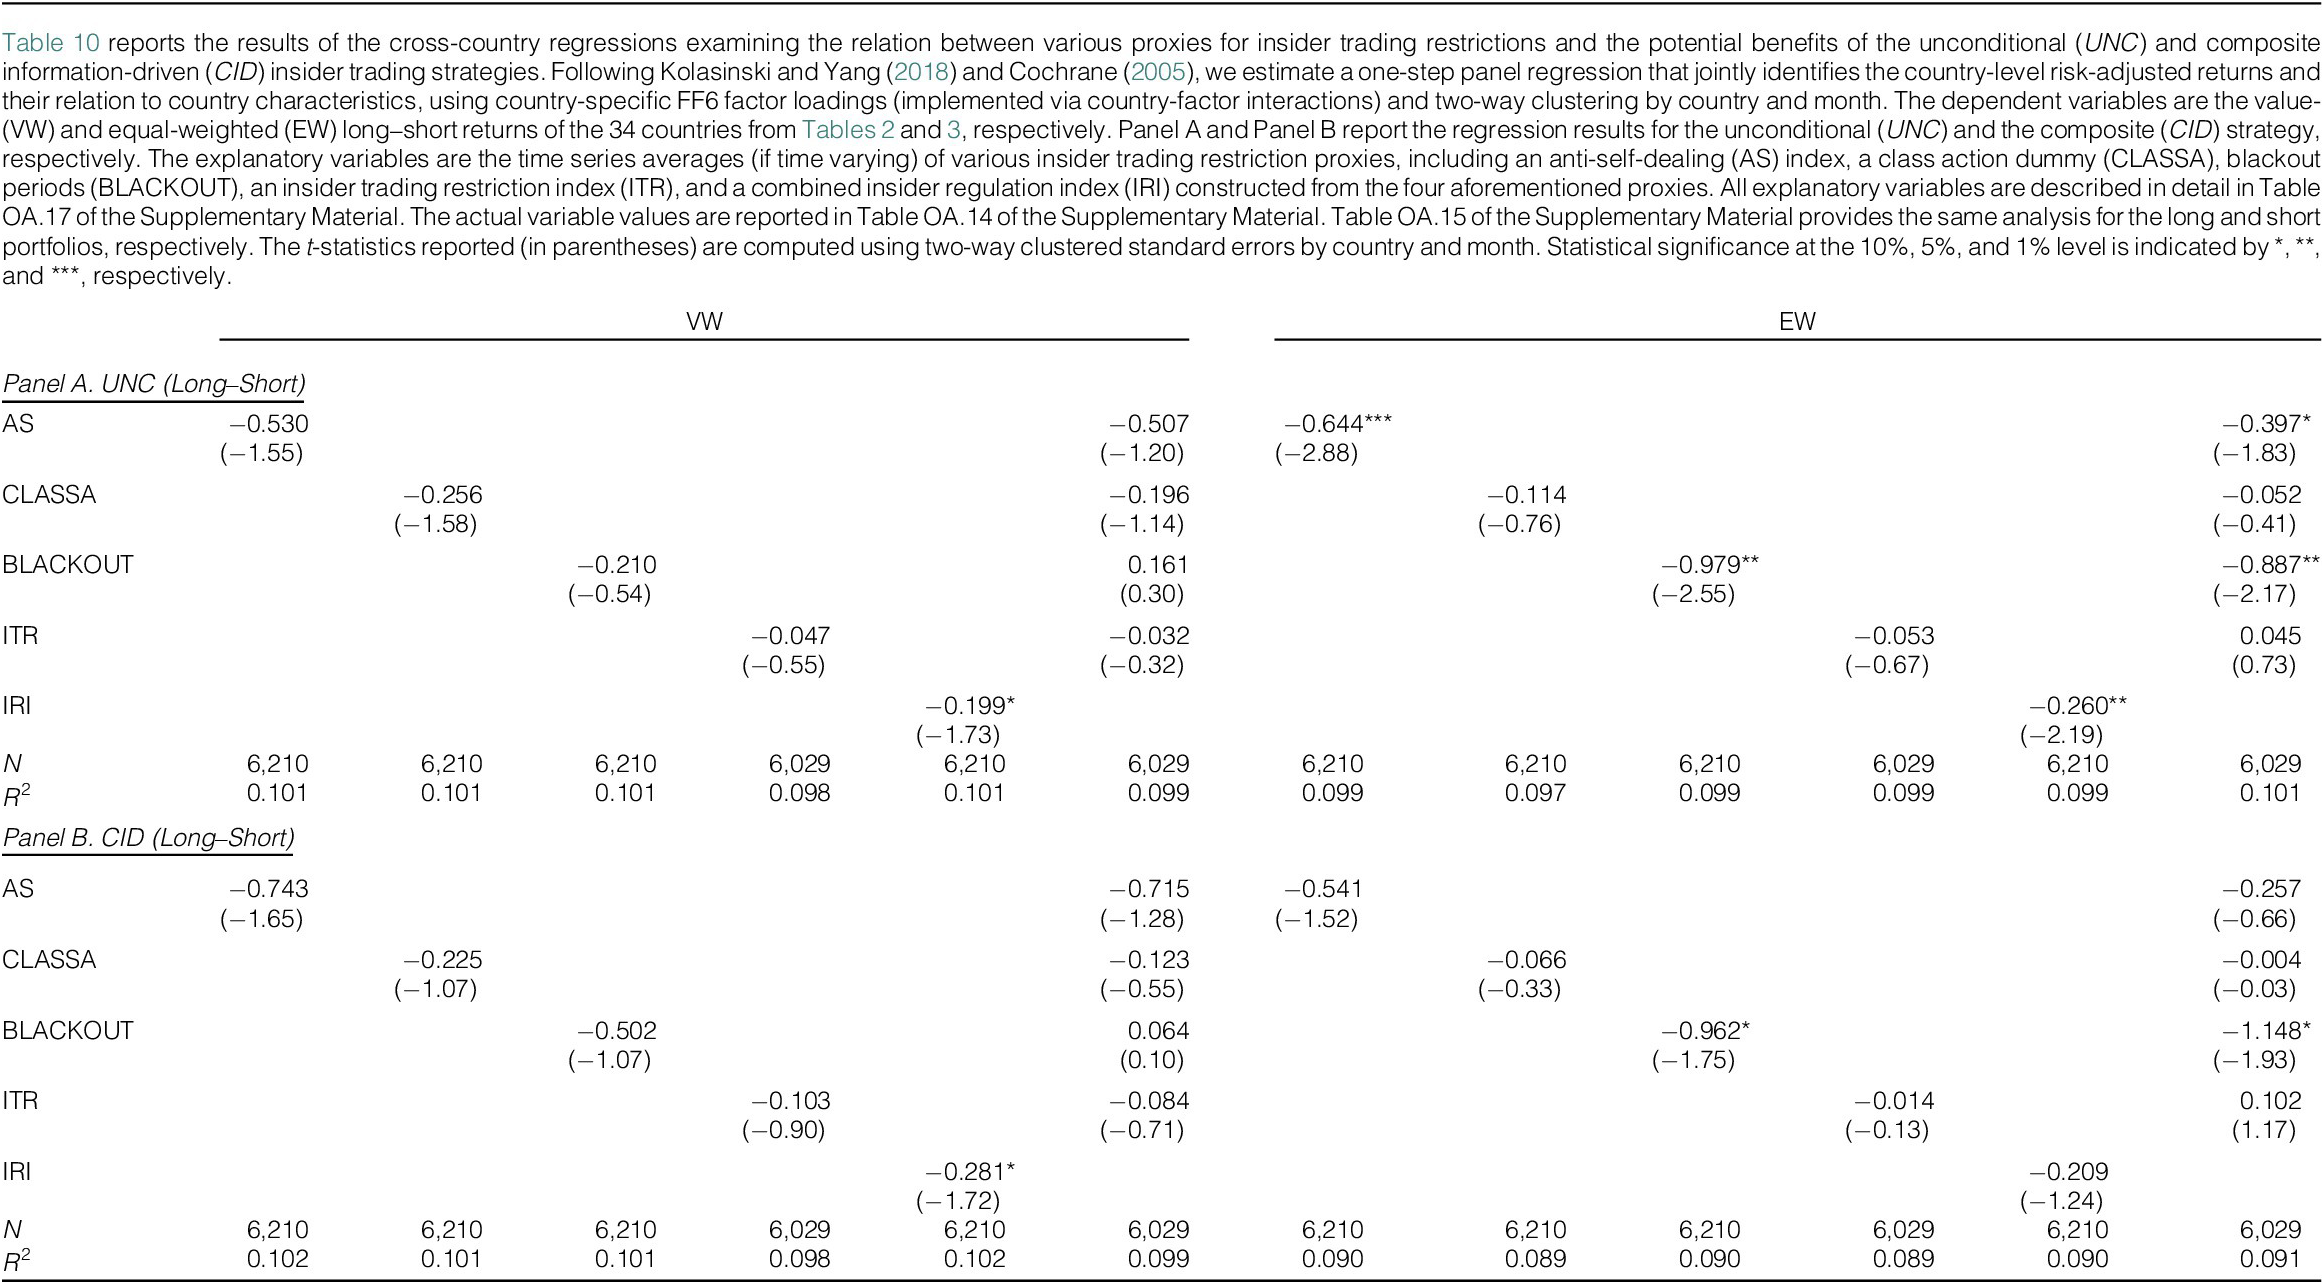


 Open access

