


1. Introduction
Trust has been shown to be important in a variety of economic settings. Higher trust can generate higher stock market participation (Guiso et al. Reference Guiso, Sapienza and Zingales2008; Balloch et al. Reference Balloch, Nicolae and Philip2015), higher saving Bachas et al. Reference Bachas, Gertler, Higgins and Seira2021 faster fintech adoption (Yang Reference Yang2021), and greater financial inclusion (Brown et al. Reference James R., Anthony Cookson and Heimer2019). At the aggregate level, stronger trust can positively affect economic growth (Zak and Knack Reference Zak and Knack2001; Algan and Cahuc Reference Algan and Cahuc2010; Tabellini Reference Tabelini2010; Greif and Tabellini Reference Greif and Tabellini2010) and the development of financial markets (Mayer Reference Mayer2008). Even though trust has been shown to be affected by macro-level factors such as global financial crisis (e.g., Gillespie and Hurley 2013), and the cultural (Mouroutzidou-Damtsa and Milidonis Reference Mourouzidou-Damtsa, Milidonis and Stathopoulos2019) and political environment (e.g., Alesina and Fuchs-Schündeln Reference Alesina and Fuchs-Schündeln2007; Osili and Paulson Reference Osili and Paulson2008) trust and its determinants remain difficult to measure at the micro-level. Many important studies (e.g., Guiso et al. Reference Guiso, Sapienza and Zingales2008, Reference Guiso, Sapienza and Zingales2013; Algan and Cahuc Reference Algan and Cahuc2010) rely on randomized surveys asking about trust in other people or financial institutions (Van der Cruijsen et al. Reference Van der, Carin and Roerink2023). However, these trust questions are not tailored towards specific company events and often use pooled cross-sectional data (e.g., Gallup Analytics) not allowing individual level variation over time.
Thus, understanding how trust can be measured and cultivated at the individual and aggregate level remains a challenging task. Moreover, although many studies have been focusing on factors that help to increase or build trust, loss of trust and its implications for economic decisions are less explored (e.g., D’Acunto et al. Reference D’Acunto, Prokopczuk and Weber2019; Bachas et al. Reference Bachas, Gertler, Higgins and Seira2021). At the same time, emerging studies on financial fraud and household (HH) behaviour (Gurun et al. Reference Gurun, Stoffman and Yonker2018; Giannetti and Wang Reference Giannetti and Wang2016; D’Acunto et. al. Reference DAcunto, Xie and Yao2022; Knűpfer et al. Reference Knüpfer, Rantala, Vihriälä and Vokata2024) emphasize the loss of trust as the driving mechanism behind HH decisions. Improving our understanding of what drives changes in trust, the extent to which losses of trust can be recovered, and subsequent effects on financial decisions becomes especially important in the current climate of fast technology adoption, social media, and influx of innovative retail financial products that are affecting all areas of daily financial life.
We utilize a unique “experiential” research setting using three recent major UK financial failures to analyse how exposure to such corporate failures – and thus experiencing direct investment loss – affects individuals’ trust in financial markets and future financial decisions. At the same time, we analyse changes in trust in individual regulatory bodies and big audit firms that are fundamental components of financial markets architecture. Our research design involves surveying actual investors who were the victims of these large financial scandals. Because such events are unpredictable, we use elicited measures of trust before and after being exposed to the scandal where personal wealth loss was directly experienced. A growing body of literature emphasizes the role of information and communication in shaping people’s expectations and beliefs about economic outcomes and how this translates into their economic decisions (e.g., Coibion et al. Reference Coibion, Gorodnichenko and Weber2022, D’Acunto et al. Reference D’Acunto, Malmendier and Weber2021). We therefore also perform a complementary student survey where we use exposure to the information from the scandal to elicit measures of trust.
The investors in our analysis are actual victims of financial failures rather than representatives of the general population. Specifically, 77 percent have limited or no investment experience, and 42 percent are pensioners. From an average investment of around 39,000 pounds, 27,000 pounds of principal (around 69% of capital) was not recovered when the companies failed. Our corporate failures also occurred quite recently, in the first six months of 2019, and received extensive public attention in the UK. Apart from financial hardship, several suicides have been reported in the general press. These features differentiate our experiential setting and make it complementary to the studies that exploit impacts of more general macroeconomic experiences (e.g., periods of high inflation, financial crises, low stock/bond returns, or real estate market booms/busts) on financial decisions or shaping economic expectations (e.g., Malmendier and Nagel Reference Malmendier and Nagel2011, Reference Malmendier and Nagel2016; Carvalho et al. Reference Carvalho, Gao and Ma2023). In particular, our setting allows us to differentiate our study from events that were experienced many decades earlier (Malmendier and Nagel Reference Malmendier and Nagel2011) or by eliciting a trust measure without the actual experience of financial loss (Guiso et. al. Reference Guiso, Sapienza and Zingales2013). Thus, we can better measure trust changes and capture direct investment loss effects, which, as per Lusardi and Mitchell (Reference Lusardi and Mitchell2014) and Osili and Paulson (Reference Osili and Paulson2014) should generate stronger behavioural responses than older (in time) or indirect exposures.
Our three companies were promising different kinds of innovative finance investments with relatively high returns, while advertising in their promotion materials that they were “regulated by the Financial Conduct Authority (FCA).” London Capital & Finance (LCF) was a saving mini-bond firm promising 3.9–11 percent per annum. A fintech company, Lendy, was a peer-to-peer (P2P) lending platform promising up to 12 percent annual returns. Finally, the Woodford Fund, an open-ended equity fund was run by a famous stock picker, Neil Woodford. In terms of numbers and size of affected investments, LCF had 11,600 investors losing a total of £237m, Lendy had 9,000 investors losing a total of £152m, while Woodford had more than 300,000 investors losing more than 70 percent of their investments from the highest valuation. All these companies provided financial services to ordinary retail investors and failed in 2019 after a relatively short operation period. Some investors had exposure in more than one of these firms. Given the number of investors, financial losses, and surrounding circumstances (regulatory flaws, corporate fraud, misleading sales and advertising, etc.), these failures raised headlines in the press, being often referred to as “scandals” and became a central focus of government and policy debates. A fascinating article a decade later (14th March 2026) in The Sunday Times described these failures as “Britain’s biggest Ponzi scheme” (Armitage Reference Armitage2026).
We designed an anonymous survey involving investors of these failed companies and therefore exposed to (the treatment of) direct investment loss. We also conducted a second survey involving master’s students at Imperial Business School to contrast the role of direct experience versus being exposed to information/reading about these failures. These surveys allow us to elicit an individual’s value of trust at different points in time (before/after the treatment and hypothetically if investors were compensated) and construct our measures of trust loss/gain. Utilizing additional information collected via our surveys allows us to also correlate the changes in trust with other individual demographic and investment characteristics and assess how trust losses/gains vary with individual heterogeneity.
Our results suggest that innovative finance failures significantly reduce investors’ trust on a broad scale, including financial market, regulators, and big audit firms. Trust loss in regulators occurs regardless of their direct involvement in a failed company. Information about losses of others (as per student survey) also reduces trust, but to a smaller extent. Moreover, investors’ trust loss is not fully reversible even if investors were compensated. The trust loss could be lower, however, if investors were compensated via the regulator (e.g., deposit insurance scheme) rather than other venues of administration (e.g., asset recovery). Trust loss also significantly affects investors’ future financial decisions. We find lower probability to invest in risky assets, and our data also suggest a stronger preference for safe/protected assets after exposure to failure.
Importantly, the results from direct exposure to investment loss versus reading about the financial losses of others bring different implications for the ability to regain trust. Information-based trust loss can be fully recovered, but trust loss emanating from direct exposure to financial loss does not recover. Controlling for other characteristics, information-based trust loss also shows insignificant impact on future investment decisions, whereas the effects of direct financial loss on future investment decisions are persistent.
We also explore correlations of trust losses (trust gains) with various individual characteristics. Although we find some patterns of heterogeneity across different specifications – e.g., females (vs. male), marital status, living alone, non-Whites (vs. White), or investment experience – we find no or little differences across age, education, or income. Overall, these characteristics explain little variation in trust changes, suggesting that the actual events are the key drivers rather than heterogeneity across individuals. This is an interesting finding because education, wealth, and income tend to be positively correlated with decisions like stock market participation (see, e.g., Gomes et al. Reference Gomes, Haliassos and Ramadorai2021) but in the case of building and losing trust the exposure to the investment loss dominates all other determinants.
Overall, our paper has several important contributions and implications. First, we contribute to the emerging research on financial fraud and HH behaviour. Although existing studies can only infer that corporate failures operate via changes in trust, we can measure trust changes at the individual level. Thus, we can directly show that exposure to corporate failures and financial fraud generates significant trust losses that affect future financial decisions even in a strong institutional environment such as the UK. Our evidence arises from failures of innovative finance companies that were offering services publicly to ordinary retail investors, and their collapse did not coincide with a financial crisis. Moreover, some of the products were also offered under the individual savings account (ISA) umbrella – a large-scale government scheme that allows ordinary individual investors to invest certain amount of money (at that time 20 000 GBP) with tax-free returns. LCF had secured approval from the tax authority to act as an ISA manager, and therefore it was natural for HHs to infer that these products were not the result of predatory practices.
Second, we are among the first to analyse the reversibility of trust. Unlike previous studies, we had the opportunity to distribute a survey to the actual investors who were affected by the failures. We show that trust recovery is hard; once trust is lost it becomes difficult to restore, even if some investment losses were compensated.
Third, we bring more evidence on the role of personal experience versus information in determining trust and future investment decisions. As such, our paper relates to the recent literature on financial literacy and the evaluation of the effectiveness of the educational programmes to promote it around the world (Lusardi and Mitchell Reference Lusardi and Mitchell2014). Our results suggest that including “learning by doing” approaches into education could strengthen delivering positive financial literacy outcomes. Klapper and Lusardi (Reference Klapper and Lusardi2020) also note that experience can improve financial knowledge.
Fourth, we also contribute to the research on trust, financial institutions, and regulators. Most studies focus on trust in banks (van der Cruijsen et al. Reference Van der, Carin and Roerink2023) where individual investments are often protected by a deposit insurance scheme (see also Prean and Stix Reference Prean and Stix2011). We bring evidence from failures of companies offering unprotected investments. Moreover, we look at financial regulators and audit firms that were directly or indirectly involved with the failed companies and find investor trust losses across all regulatory bodies.Footnote 1 The results also indicate negative spillovers to all regulatory bodies regardless of their involvement and thus loss to generalized institutional trust.
From a policy perspective our paper emphasizes the need for financial regulations to develop trust to attract investors and thus need for trust in institutions. As our analyses indicate, trust recovery is very challenging; once trust is lost it is difficult to restore it to its prior level, even if some investment losses would be compensated. Given the importance of trust in broader financial inclusion, the role of regulators becomes critical in ensuring that trust can be cultivated and maintained to encourage participation in risky asset markets. Our results have implications for the optimal level of regulation depending on the level of social capital in an economy (see Carlin et al. Reference Carlin, Dorobantu and Viswanathan2009).
A particularly concerning feature of the failure episodes we study is the use of misleading advertising that made the risky investments seem like they were part of the deposit insurance scheme because the companies were “regulated by the FCA.” This is reminiscent of the Célérier and Tak (Reference Célérier and Tak2025) misleading advertising with Freedman’s Savings Bank from the 1870s where deposit funds benefited elite networks that eventually led to the collapse of the bank. Misrepresenting risk to investors is a similarly common theme in LCF. The 2026 Sunday Times article describes how “using Google Ads, Facebook and other digital marketing tricks (LCF) pushed the bonds out to thousands of people through a phoney price comparison website that always featured LCF as the ‘best buy.’”We also show that regulators’ reputational capital can suffer from such incidents. This in turn can adversely affect the adoption of potentially beneficial innovative financial products.Footnote 2 Financial regulations (including advertising regulations) can be used to develop investor trust, but for that we need trustworthy institutions to start with.
The remainder of the paper is organized as follows. Section 2 provides the institutional background and describes the three recent UK financial failures we focus on. Section 3 describes our data and research design. Sections 4 and 5 describe the empirical approach and results for investors and students, respectively. Section 6 concludes.
2. Institutional background: Case studies of three recent major financial UK failures
2.1. London Capital & Finance (LCF)Footnote 3
LCF was set up in 2012 as a commercial finance provider to UK companies. In 2013, LCF started selling “mini-bonds” to the public. Over time, these were offered with a maturity ranging between 1 and 5 years and a promise of fixed interest rates in the range of 3.9–11 percent per annum. In June 2016, LCF became a “regulated” entity, officially authorized by the FCA. In November 2017, His Majesty’s Revenue and Customs (HMRC) (the UK tax authority) also granted LCF permission to issue bonds under a tax-free ISA status. Being a “regulated” entity and offering “ISA-ble” products attracted more investors. By January 2019, when LCF collapsed – around 11,600 investors had invested a total of £237m into the bonds.
In December 2018 the FCA ordered LCF to stop distributing marketing materials and promoting bonds to the public and froze company assets and all financial transactions because of “serious concerns about the way the firm was conducting its business.” After a month, LCF entered official administration. Quickly investors found out that bondholders’ money had gone to companies with personal connections with LCF directors. About £58m did not go to any borrowers but instead was paid by LCF as commission to the marketing company, Surge Financial, which was advertising LCF bonds as “Best Saving (or ISA) Rates” (Collinson Reference Collinson2019). Much of the remaining money went into highly speculative property developments; horses and even a helicopter were bought by LCF. As administrators stated: “There are a number of highly suspicious transactions involving a small group of connected people which have led to large sums of bondholders’ money ending up in their personal possession or control.”
There is evidence that the FCA had been notified about the risks with LCF in 2015 – almost a year before authorizing LCF – but no action was taken. LCF was also basically insolvent at least 2 years before its collapse, although the audit firm, Ernst & Young (EY), gave it a healthy check (Burton Reference Burton2019). The questions have been raised also about the role of HMRC and how it granted ISA status to LCF. After the company collapsed, HMRC cancelled its ISA status and bondholders (in addition to losing capital) have been required to pay taxes on all the interest earned from LCF ISA bonds, retrospectively.
In May 2019, Nicky Morgan as Chair of the Treasury committee, requested a formal independent investigation into FCA and its possible regulatory failure (Collinson Reference Collinson2019). The FCA argued that although LCF was a regulated firm, its financial products were not. The investigation was conducted by a well-respected former judge, Dame Elisabeth Gloster. Her report, issued in December 2020, concluded that FCA as a regulator “did not effectively supervise and regulate” LCF. The findings also raised questions about the conduct of Andrew Bailey, the current governor of the Bank of England (BoE), who was chief executive of the FCA during LCF’s operations and collapse. After the report was released, Bailey publicly apologized to LCF bondholders. Treasury minister at that time, John Glen, promised to “take forward the report’s recommendations to ensure our [UK] regulatory system maintains the trust of the consumers it is there to protect” (Vincent Reference Vincent2020).
The Serious Fraud Office (SFO) conducted a separate investigation and froze some personal assets of LCF directors and the director of Surge. The FSCS (Financial Service Compensation Scheme) investigated whether these circumstances would make LCF bondholders eligible to claim at least some of their lost money through the protection scheme. By default, bondholders have been unable to receive FSCS compensation because FCA did not regulate LCF’s bonds, just their marketing activities. This position has been legally challenged by an independent group representing bondholders. By the end of 2020 administrators estimated a recovery return for investors about 20–25 percent at best, and years of lengthy investigations. In 2022 LCF investors were partially compensated for losses up to £68,000 (per investor) via a government scheme approved in November 2021.
2.2. Lendy – P2P property platformFootnote 4
Lendy was founded in 2012, initially as a specialist lender in the marine sector providing funding against secured boats. For years Lendy has been also an active sponsor of Cowes Week, one of the oldest and most respected regattas in the world. In 2014, Lendy obtained an interim “peer-to-peer” license from the FCA, set up a property platform website, and started crowdsourcing from individual investors to write secured loans to property developers (borrowers). Lendy’s website was widely recognized for its easy interface and simple presentation. The company was promising investors up to 12 percent per annum, reassuring them that Lendy’s specialized team of project/loan valuators was scrutinizing every borrower with the value of loans never higher than 70 percent of asset to loan value. At the same time, the UK government was promoting the development of the P2P sector as an innovative way of financing. In July 2018, FCA granted Lendy full authorization to operate as an approved P2P platform.
Over time, Lendy experienced a sharp rise in loan defaults in the run-up to its collapse, at which point two-thirds of its loans had insolvency proceedings against them. Lendy failed in May 2019, when the company went into administration. By that time about 9,000 investors lent their money, in total about £152 million.
Soon after, it was revealed that FCA granted Lendy a full authorization to operate, although it was aware that at the time of Lendy’s approval many of its loans were already in default, and the company was going through serious financial difficulties. The FCA was also concerned about significant “mis-selling” of loans to investors by Lendy (Hurley Reference Hurley2019). In late 2017, FCA asked Lendy to compensate people who had invested in certain loans based on what the FCA deemed to be “incomplete or inaccurate information” to investors. Lendy agreed to a £1.9m remediation scheme, before getting full FCA authorization in July 2018. When Lendy failed, almost £600,000 in promised compensation still had to be paid to investors. Meanwhile, FCA’s full authorization had given to many investors a confidence to continue using the platform. Many invested even more money, unaware of what was going on behind the scenes. The FCA has been investigating the circumstances of Lendy’s failure. However, Lord Myners, the ex-City finance minister, argued that the regulator’s knowledge of Lendy’s poor performance at the time of authorization “emphasises the need for an independent inquiry” (Hurley Reference Hurley2019).
The administrators have since warned investors that they should expect to lose a significant proportion of their investments due to the poor state of Lendy’s loans. Legal investigations during 2020 also showed that Lendy founders misappropriated part of investors’ funds through an offshore company and the courts ordered to freeze their personal assets. At best, recovered returns could be about 58 percent (including interest), but on some loans, recovery could be as low as 7 percent. By the end of 2020, only £16.8m of the £152m loanbook was recovered. Thus, the administration process was approved to continue until 2023 but could extend far beyond. In addition, there have been legal disputes and a trial in 2021 between Lendy’s investors and administrators, regarding the legality of fees and distribution of recovered funds, applied by administrators. Their “distribution waterfall” split investors into two groups, Model 1 and Model 2, which impacted their creditor’s status and thus how and what funds they can receive at the end.
2.3. Woodford Equity Income Fund
Founded in April 2014 by Neil Woodford – for years recognized as the star of pensions and fund management in UK (“UK’s Warren Buffett” (Neate Reference Neate2019)) – at its peak the fund’s value was more than £10 billion (Walker Reference Walker2021). However, in March 2019, after two years of poor performance, fund assets contracted by more than £5bn. The final crisis was triggered because the fund had several holdings in private companies (“illiquid” stocks). As such, the fund was unable to raise enough funds to pay back investors (Atherton Reference Atherton2019). In June 2019 the fund was suspended after blocking investors from withdrawing their money, while still charging fees (about £65,000 a day (Neate Reference Neate2019)). In October 2019, the board announced that the fund with its remaining value of £2.9 bn will be closed and the appointed administrators would liquidate the fund and distribute proceeds to investors. Neil Woodford was sacked as investment manager.
The FCA seemed to have been aware of the fund’s liquidity problems at least since February 2018 but did little to deal with the problems. Lord Myners, the ex-City finance minister, said that the FCA was not “awake” when Woodford started “clever dealings,” which should have raised red flags. The FCA should have scrutinized the illiquid investments of the fund more closely (Bow Reference Bow2019). Nicky Morgan, Chair of the Treasury committee at the time the fund failed, said that FCA chiefs and the BoE would face questions in Parliament about the “troubling episode.”Footnote 5 During questioning, the Governor of the BoE said that “there was a ‘consumer protection’ issue as investors believe putting money into an open-ended fund was akin to a bank account where you can get money out at any time.”Footnote 6
Starting in January 2020 most liquid assets were sold; by the end of 2020 about 70.4 percent of the fund’s value at suspension was returned to investors.Footnote 7 However, the illiquid nature of remaining assets made sales difficult. At the same time, the fund’s value dropped significantly with losses ranging from 36.7 to 47.6 percent across different types of shares.Footnote 8 From a regulatory perspective, LCF, Lendy, and Woodford represent various forms of innovative finance companies. Hence, unlike bank deposits, investments in these companies are not automatically protected by the FSCS, which compensates deposits up to £85,000. During 2019–2020, people caught up in these investment scandals organized multiple protests outside the BoE and FCA. They were criticizing the regulators for not respecting their own “principles of good regulation,” and also calling on (at that time) FCA’s chief executive, Andrew Bailey, to step down.
3. Data and research design
We design two different surveys to analyse how the experience of direct investment loss and then information about losses of others affect individuals’ trust. The first one involves investors, who invested into some (or all) of the three failed companies and thus were exposed to the treatment of “direct loss experience due to company failure.” The second survey involves master’s students in finance or economics programmes at Imperial Business School who were asked to read the summary of what happened. The students were therefore exposed/treated by “information” about losses/experiences of others.
The surveys were distributed and completed during 17 December 2020 – 31 March 2021. We started to approach investors in December to leverage more time over Christmas; students were approached in January after the new semester started. We downloaded all the survey data in April 2021.Footnote 9 Although the student survey was distributed to students directly by us, the survey to investors was distributed primarily through LCF administrators, to reach as many LCF investors as possible. For legal reasons we were not allowed to directly communicate with investors, so the administrators agreed to include the message about our research and survey link at the end of one of their regular emails to investors.Footnote 10 We have also asked representatives of Lendy’s creditors committee to post the survey link on their investor’s online portal. Several investors also volunteered to post our message and survey link on their Facebook/investors group websites, although these groups were quite small. In the end, most of our survey responses, about 58 percent, came through the survey link posted by LCF administrators; 32 percent through the link posted via Lendy and only 10 percent responses came from social media postings.
The surveys were anonymous; asking investors and students, the same (or similar questions) about their: age, gender, ethnicity, marital status, education level, employment status, HH income, HH size, investment experience, stock ownership, whether they “invested in” (students (s) were asked whether they “heard about”) the three failed companies, whether they would invest again “after money lost” (s: after reading about three failed companies and others’ losses). In addition, the investors’ survey also asked about specific companies invested in, principal invested, principal remaining/potentially lost in each company.Footnote 11
The last part of the survey asked questions about investors’ (students’) trust in the UK financial market, UK financial regulatory bodies: FCA, PRA (Prudential Regulation Authority), FSCS (Financial Services Compensation Scheme), HM (Her Majesty’s Treasury), BoE, and big accounting/audit firms.Footnote 12 Although these firms do not directly regulate, they provide important input (e.g., audit of balance sheets) for financial decisions to both regulators and investors (see also Section 2.1.). In the end, the survey asked both groups about their investment decisions “after all” in the future.
We designed the questions on trust to elicit the value of trust in financial markets and each institution at three different points in time for investors (i), as well as students (s), as follows:
-
1. i = level of trust before investment (s: before we ask them to read about three failed companiesFootnote 13).
-
2. i = current level of trust after companies failed (s: level of trust after reading about the three failed companies).
-
3. both (investors and students): level of trust if investors were compensated by regulator or via other ways of administration.
Using this question design, we can construct for every individual the key measures of trust changes used in our analyses: Trust Loss = (1)–(2), capturing the difference in the level of trust before vs. after treatment, and Trust Gain = (3)–(2), capturing the potential gain/recovery of individual trust if investors were compensated.
To compute these measures, we code the values of trust on the 5-degree scale (0 = None; 1 = Low; 2 = Medium; 3 = High; 4 = Very High). The full survey, containing investors’ and students’ questions, as well as coding details, is provided in the Online Appendix.Footnote 14 With elicited measures one may worry about investors’ recall bias. We acknowledge this concern but we think it is unlikely to affect results in our context. As already noted, all the companies failed after a relatively short period of operation in 2019. We conducted our survey in the following year when all the administration processes and investigations were properly established and ongoing. During that time all the events, companies’ histories, and activities were often debated in the press and investors received regular communications from administrators (e.g., emails, reports). Thus, the survey respondents should have been able to recall their past decisions and levels of trust accurately. Importantly, in our analyses we always use trust measures in differences. If respondents either weigh recent information more heavily or have forgotten the past when reporting their trust level ex-ante, our measures of trust losses would be biased downwards (not upwards). As such, our conclusions would still hold, and our results provide a lower bound.Footnote 15
We received complete responses from 610 investors and 90 students.Footnote 16 These sample sizes represent response rates of 5.3 percent for investors (given the pool of LCF investors, the majority of our respondents invested in LCF) and 11.7 percent for students. These rates are aligned with the average response rates on Qualtrics in other studies; Coibion et al. (Reference Coibion, Gorodnichenko and Weber2022) point out that a 5–10 percent response rate in Qualtrics survey is as expected. It is also important to note that we have not compensated anyone for participation. Even though that could potentially increase the response rate, at the same time it would generate adverse selection, attracting individuals who are just after the payment and providing ad-hoc biased responses. Thus, we motivated students using educational arguments and the LCF administrators’ message also highlighted voluntary participation to investors (see Online Appendix for text of messages).
Another selection concern is whether highly affected or angry investors might have been eager to participate in the survey, share their resentment and potentially overestimate impact on trust. However, when distributing our survey, we clearly stated that the survey will be used for research – raising public awareness and contributing to policy change – not for the purpose of money recovery or lawsuits. We believe this helped to mitigate such concerns. In fact, some investors wrote to us that they do not intend to fill the survey because they feel hurt and betrayed and they do not believe any research can change that. As we also explain above, if such selection occurred it would lead to underestimation of trust losses.
Table 1 shows summary statistics on the demographic and investment characteristics of investors in our sample. The largest portion (41.6%) of our investors are more than 65 years old and male; about 8 percent investors are non-White and 30 percent are female; 58 percent investors are married, with different levels of education; and undergraduate/bachelor’s degree, high-school, or apprenticeship is most common, and 5.6 percent have doctorate degree. Most investors are pensioners, 26 percent are employed full-time, and 10 percent are self-employed: with average HH income below 50K pounds. About 32 percent live alone. When it comes to investment experience: 63 percent own stocks, but they report limited (51.8%) or first-time investment experience (14.6%). Most invested in LCF and/or Lendy, about 7 percent invested into the Woodford Fund, and 22 percent also indicated investment in other failed companies. For 49 percent of investors these represented their first-time investment. An average total investment into LCF/Lendy/Woodford was about 38,954 pounds per investor with 26,838 pounds of principal investment still remaining in these companies after their failure, about 69 percent of potential investment loss (if money not recovered). To the question whether “investors would invest again” 63 percent responded “Never again” or “Maybe.”
Summary statistics (610 investors)

Table 1. Long description
The table presents summary statistics on the demographic and investment characteristics of 610 investors. It includes 20 rows and 7 columns. The columns are labeled as Variable, Observations, Mean, St. Dev, Min, and Max. The table is divided into two main sections: Demographics and Investment Characteristics. Each row lists a specific variable, such as age groups, gender, education level, employment status, and investment experience, along with corresponding statistical values. For example, the row for age 34 and less shows 610 observations, a mean of 0.056, a standard deviation of 0.230, a minimum of 0, and a maximum of 1. The table provides detailed data on various demographic and investment variables, highlighting the distribution and characteristics of the investors in the sample.
* Sophisticated investors include two investors that identified themselves as professional/institutional investors.
4. Empirical approach and results: Investors
4.1 Investors: Changes in trust before vs. after company failure
Figure 1A shows the distribution of investors’ responses on their values of trust in financial markets “Before” vs. “After” their investment in the failed companies, with trust coded on the 5-degree scale (0 = None; 1 = Low; 2 = Medium; 3 = High; 4 = Very High). As is clear from the picture, the company failures generated a visible shift in distribution of trust values from the right before company failure (69% investors reported values 3–4) to the left after the failure (only 3% investors reported values 3–4). At the same time the number of “None” and “Low” trust responses increased from 13 to 463 after the failure.
(A): Changes in Trust in Financial Market “Before” vs. “After” Investment – Distributions. The figure shows the distribution of investors’ responses on their values of trust in financial markets “Before” vs. “After” their investment in the failed companies. Trust is coded on the 5-degree scale (0 = None; 1 = Low; 2 = Medium; 3 = High; 4 = Very High). Number of responses for each value is shown at the top of the bars. (B): Changes in Trust in Financial Market if Investors were Compensated by a Regulator (e.g., FSCS). B shows the distribution of investors’ responses on their values of trust in financial markets after company failure vs. if investors were compensated by a “Regulator.” Trust is coded on the 5-degree scale (0 = None; 1 = Low; 2 = Medium; 3 = High; 4 = Very High). The number of responses for each value is shown at the top of the bars. (C): Changes in Trust in Financial Market if Investors were Compensated by Other Venues, Not a Regulator. C shows the distribution of investors’ responses on their values of trust in financial markets after company failure vs. if investors were compensated by “Other venues of Administration.” Trust is coded on the 5-degree scale (0 = None; 1 = Low; 2 = Medium; 3 = High; 4 = Very High). The number of responses for each value is shown at the top of the bars.

Figure 1. Long description
Panel A: Two vertical bar graphs depict the distribution of investors’ responses on their values of trust in the UK financial market before and after their investment in failed companies. Trust is coded on a 5-degree scale (0 = None, 1 = Low, 2 = Medium, 3 = High, 4 = Very High). The left graph shows trust before investment, with frequencies of 4, 9, 177, 346, and 74 for the respective trust levels. The right graph shows trust after companies failed, with frequencies of 171, 292, 128, 14, and 5 for the respective trust levels. Panel B: Two vertical bar graphs depict the distribution of investors’ responses on their values of trust in the UK financial market after company failure versus if investors were compensated by a regulator. The left graph shows trust after company failure, with frequencies of 171, 292, 128, 14, and 5 for the respective trust levels. The right graph shows trust if compensated by a regulator, with frequencies of 42, 236, 176, 117, and 18 for the respective trust levels. Panel C: Two vertical bar graphs depict the distribution of investors’ responses on their values of trust in the UK financial market after company failure versus if investors were compensated by other venues. The left graph shows trust after company failure, with frequencies of 171, 292, 128, 14, and 5 for the respective trust levels. The right graph shows trust if compensated by other venues, with frequencies of 67, 236, 211, 82, and 12 for the respective trust levels.
Such Trust Losses are also documented in Table 2, showing differences in means for all our trust variables “Before” vs. “After” the company failure. Given that all other investor characteristics are constant before/after, such mean differences represent simple difference-in-differences comparison for each investor and reflect the impact of the event – direct investment loss experience – on investors’ trust. All the trust losses are statistically significant at 1 percent, regardless of whether we look on financial markets, accounting firms or individual regulators.Footnote 17 Such losses represent quite large magnitudes of company failures on investors’ trust. Specifically, financial market trust loss (1.78) represents about a 64 percent drop compared with the investors’ initial value of trust (2.78). Big accounting/audit firms experience trust loss of 1.23 or 57 percent. Trust losses of individual regulators are highest, 2.3 (77%) for the FCA – perhaps not surprisingly, given that the FCA was supposed to directly regulate (and protect investors in) all the failed companies. Interestingly, however, regulators not directly involved with failed companies, e.g., the Treasury or BoE also show important losses in trust, about 40 percent each.
Trust variables – differences in means “before” vs. “after” investment in failed companies

Table 2. Long description
A table comparing trust levels in financial entities before and after investment in failed companies. The table has 12 rows and 5 columns. The columns are labeled ‘Trust in’, ‘Mean Before’, ‘Mean After’, ‘Difference (i.e. Trust Loss)’, and ‘N used in the test’. The rows are labeled with different financial entities and regulators. The ‘Trust in’ column includes entries like ‘Financial market’, ‘Big accounting/audit firms’, ‘Regulators FCA’, ‘PRA’, ‘FSCS’, ‘HM Treasury’, ‘BoE’, ‘Financial market and regulators - If investors compensated by FSCS/Regulator’, and ‘Other venues’. The ‘Mean Before’ and ‘Mean After’ columns show the trust levels before and after the investment, respectively. The ‘Difference (i.e. Trust Loss)’ column shows the change in trust levels, with values like 1.78 for ‘Financial market’ and 2.3 for ‘Regulators FCA’. The ‘N used in the test’ column shows the number of participants used in the test for each entity.
The table shows the means, differences in means (Trust Loss/Trust Gain), and their t-tests for all our trust variables, based on investors’ responses. Trust is coded on the 5-degree scale (0=None; 1 = Low; 2 = Medium; 3 = High; 4 = Very High). Significance: *p < 0.10, **p < 0.05, ***p < 0.01.
Top rows show investors values of trust “Before” vs. “After” the company failure and Trust Loss in: Financial Market; Big Accounting/ Audit Firms; and five UK financial regulators (see Section 3 and footnote 11 for more details). Bottom two rows then compare investors’ values of trust in financial market “After” company failure and “If investors were compensated by” a “Regulator” or by “Other venues” of administration and thus possible Trust Gain. a)Responses “Never heard about it before I invested” or “Heard about it, but did not know what they do when I invested” for an institution not included in the mean comparisons as initial values of trust are missing. Similarly, for trust in Financial Market/Regulators “If Investors Compensated by FSCS” 21 responses were missing.
The bottom part of Table 2 shows differences in means of our other variable of interest, Trust Gain – if the investors were somehow compensated. The means, as well as Figures 1B–C, show that an average value of trust in financial markets after company failure would partially recover from 1 to 1.82, if investors received money back through a regulator/deposit insurance scheme (e.g., FSCS). Such a trust gain, however, represents only 46 percent recovery of the original trust loss. Trust could also recover but to a lesser extent, from 1 to 1.57, if investors were compensated through other venues of administration, e.g., asset recovery. Overall, these results show that once lost, trust is hard to recover even if investors were compensated. This is also evident from the email of one of the investors we received:
I am one of the lucky ones in that I got my money or compensation in full from FSCS … I am no longer looking to invest my money in any ISA or tax-free savings or any other investment. … I have lost all trust in any financial advice online and possibly by mouth and in the Government to monitor institutions….
4.2. Trust loss, trust gain, and investors’ characteristics
Showing that company failures brought important losses of investors’ trust, to what extent do investors characteristics correlate with trust losses in financial market, big audit firms, and regulators? Can we predict who will experience higher/lower trust losses/gains in future? Overall, how much variation in trust changes can be explained by individual characteristics vs. the event per se? To address these questions we utilize detailed investor characteristics (see Table 1), we collected through our surveys to run Ordinary Least Squares (OLS) cross-sectional regressions, exploring the correlations between investor characteristics and our key variables: Trust Loss and Trust Gain. Because several characteristics capture the same trends, we estimate different specifications; in all robust standard errors adjusted for heteroscedasticity are reported.
Table 3 shows correlations with trust loss in financial markets, and Tables 4–5 show correlations with trust losses of accounting firms and individual regulators.Footnote 18 Several interesting patterns emerge, namely: investor Age (>65 vs. younger) or HH income does not generate any major differences when it comes to trust losses in financial markets or regulators. In other words, regardless of their age or income, all investors are similarly affected by company failures. Interestingly, Education also does not generate larger/smaller trust losses across investors, all seem to be equally affected by company failures. This result is robust to including education or income separately.Footnote 19
Trust loss in financial market and investors’ characteristics – OLS regressions

Table 3. Long description
The table presents correlations between trust loss in financial markets and various investor characteristics. It includes 8 columns and 61 rows, with column headers such as 1, 2, 3, 4, 5, 6, 7, and 8. Row labels include Age 65 over, Female, Non-White, Married, Employ_Full, Employ_Part, Employ_Self, Annual HH income, Less than 24 999, 25K to 49 999, 50K to 99 999, 100K and greater, One person in HH, Education, High school, Agrentship, UGBA, Master, Professional, Doctorate, Was this first time investment, Owns stocks, Less than 10K, 10K to 49 999, 50K to 100K, More than 100K, Prefer not to say, Investment experience, No experience, Limited experience, Sophisticated, Small business investment, Invested in ICF, Lendly, Woodford, BlackRock B, Others, Principal invested all, Principal lost all, Constant, and Observations. Each row lists correlation values for the respective investor characteristic across the 8 columns. Notable trends and specific values are not summarized here but are detailed in the table.
The table shows results from OLS regressions/corelations between Trust Loss in Financial Market (dependent variable) and various investor and investment type characteristics. Colmn 1 shows a benchmark specification including only investors’ basic demographic variables and education coded as a categorical variable. Column 2 shows more flexible specification, splitting education into different degree levels. Columns 3–4 add alternative measures for investor’s investment experience and dummy for stock ownership. Column 5–6 split stock ownership dummy into different investment levels, investors’ experience into separate categories and include also investment type characteristics. Columns 7–8 streamline regressions by including HH annual income, stock ownership, and whether investor was a first time investor only as categorical or dummy variables, while including investor’s basic demographic and investment type characteristics, Robust standard errors adjusted for heteroscedasticity in brackets. Significance: *p < 0.10; **p < 0.05, and ***p < 0.01.
Trust loss and investors’ characteristics: big accounting/audit firms and FCA – OLS

Table 4. Long description
The table presents data on the correlation between trust loss in financial markets and various investors’ characteristics. It includes 610 observations and 30 columns. The dependent variable is trust loss, and the table lists various independent variables such as age, gender, race, marital status, employment status, household income, education level, and investment experience. Each row provides coefficients and standard errors for these variables. For example, the row for age 65 over shows a coefficient of -0.159 with a standard error of 0.077. The table also includes columns for big accounting/audit firms and Financial Conduct Authority (FCA).
The table replicates OLS regressions in Table 3 – Columns 3,5 and 6 (see notes to Table 3 for details on these specifications). Columns 1–3 show corelations between dependent variable Trust Loss in Big Accounting/ Audit Firms and various investor and investment type characteristics. Columns 4–5 show the same for investor’s Trust Loss in FCA as dependent variable. Robust standard errors adjusted for heteroscedasticity are in brackets. Significance: *p < 0.10; **p < 0.05, and ***p < 0.01.
Trust loss and investors’ characteristics: other regulators – OLS regressions

Table 5. Long description
The table presents data on trust loss in financial companies and investor characteristics, focusing on various demographic and investment factors. It includes columns for different investor characteristics and their corresponding trust loss values across three categories: FSCS, H M Treasury, and Bank of England (BoE). The table has 61 rows and 13 columns, with column headers including dependent variable, FSCS, H M Treasury, and Bank of England (BoE). Each row represents a different investor characteristic, such as age, gender, ethnicity, marital status, employment status, education level, annual household income, and investment experience. The values in the columns represent the trust loss before and after investment in financial companies. Notable trends include variations in trust loss based on different investor characteristics, with specific patterns observed in age groups, education levels, and investment experience.
The table replicates OLS regressions in Table 3 – Columns 3,5 and 6 (see notes to Table 3 for details on these specifications). Columns 1–3 show corelations between dependent variable Trust Loss in FSCS and various investor and investment type characteristics. Columns 4–5 show the same for investor’s Trust Loss in HM Treasury (dependent variable) and Columns 6–8 for investor’s Trust Loss in Bank of England (dependent variable). We dropped analysis for regulator PRA due to small sample (see Table 2). Robust standard errors adjusted for heteroscedasticity are in brackets. Significance: *p < 0.10; **p < 0.05, and ***p < 0.01.
The only difference among investors occurs vis-à-vis trust losses in Big Accounting/Audit firms (Table 4, Columns 1–3). Those with undergraduate/masters’ and doctorate degrees experience significantly smaller trust losses. These investors likely took accounting during their studies and thus may have more realistic beliefs about accounting documents and their reliability when it comes to investment. Females on the other hand experience larger losses of trust, especially towards regulators. One explanation is that women are more trusting to start with and thus end-up more disappointed when bad events such as company failures happen. Weber (Reference Weber2023), Coibion et al. (Reference Coibion, Gorodnichenko and Weber2022), and D’Acunto et al. (Reference D’Acunto, Malmendier and Weber2021) find a “gender gap” and a tendency for women to overestimate economic outcomes such as inflation compared with men. Fully Employed also experience higher trust losses in financial market, but not in regulators. This could be due to their higher opportunity costs compared with retired and not working (control group). Although most of our investors are White (Table 1) Non-White investors seem to experience (weakly) lower trust losses. Married investors also experience lower trust losses – this could be thanks to extra source of income or partner’s support. Those living alone (one person in HH) also exhibit lower trust losses. Although this may seem surprising given their opposite situation to married, but at the same time this could be explained by having no dependents and more flexibility when financial constrains arise, compared with those who live in larger HHs.
The results on Investment Experience further suggest that Stock ownership creates no difference on trust loss, but higher overall Investment Experience tends to reduce investors’ trust losses. This is perhaps not surprising as more experience helps to generate more realistic expectations when it comes to investment risk/returns. Not surprisingly, investors with higher total Principal Investment and/or Principal (potentially) Lost in failed companies are more sensitive and experience higher trust losses across the board. We also observe differences in trust losses across different company types. Specifically, Woodford Fund investors experience lower trust loss in financial markets than LCF or Lendy investors (property/loan-based companies). This might arise either because Woodford was an open equity fund and/or entered wound-up process after its failure repaying investors right away.Footnote 20 At the same time, there are no significant differences in trust losses across three companies for the FCA (Table 4, Columns 4–6) that was directly regulating all of them.
Although these regressions reveal several important correlations that could help us to predict who will experience higher/lower trust losses, the R-squared in these regressions are relatively low, suggesting that the event/experience of direct investment loss remains the main driver of variation in the trust loss variables rather than investors’ heterogeneity.
Finally, Table 6 shows the same type of regressions for Trust Gain. These results show that Full- and Part-time Employed can recover higher levels of trust, but only when compensated through regulatory scheme (e.g., FSCS) that typically pay investors from government money rather than asset recovery (i.e., other venues of administration). At the same time wealthier (higher Owns stocks) and more experienced investors experience smaller gains in trust than the first-time investors (control group). These results, as well as insignificance of other characteristics, further echo the prior discussion that once investors’ trust is lost, it is hard to recover it regardless of investors’ characteristics.
Trust gain in financial market if investors compensated by FSCS/regulator or other venues

Table 6. Long description
A table with 61 rows and 20 columns showing the impact of various investor characteristics on trust gain in the financial market. The table includes coefficients and standard errors for each characteristic. Row 1: Dependent variable, Trust gain in financial market if investors compensated by FSCS/regulator or other venues. Row 2: Age 65 over, -0.128 (-0.093, -0.164). Row 3: Female, 0.099 (0.059, 0.138). Row 4: Non-White, 0.046 (0.033, 0.058). Row 5: Married, 0.129 (0.087, 0.172). Row 6: Employ_Full, 0.114 (0.084, 0.144). Row 7: Employ_Part, 0.043 (0.007, 0.078). Row 8: Employ_Self, 0.089 (0.041, 0.137). Row 9: Annual HH income Less than 24 999, -0.132 (-0.240, -0.024). Row 10: Annual HH income 25K to 49 999, -0.075 (-0.135, -0.014). Row 11: Annual HH income 50K to 99 999, -0.130 (-0.212, -0.048). Row 12: Annual HH income 100K and greater, -0.238 (-0.324, -0.152). Row 13: One person in HH, 0.025 (0.007, 0.042). Row 14: Education High school, 0.129 (0.046, 0.212). Row 15: Education Apprenticeship, 0.162 (0.052, 0.272). Row 16: Education UGBA, 0.116 (0.027, 0.205). Row 17: Education Master, 0.137 (0.041, 0.233). Row 18: Education Professional, 0.136 (0.079, 0.193). Row 19: Education Doctorate, 0.167 (0.048, 0.287). Row 20: Was this first time investment, -0.116 (-0.164, -0.068). Row 21: Owns stocks Less than 10K, -0.189 (-0.234, -0.144). Row 22: Owns stocks 10K to 49 999, -0.115 (-0.168, -0.062). Row 23: Owns stocks 50K to 100K, -0.195 (-0.281, -0.109). Row 24: Owns stocks More than 100K, -0.233 (-0.337, -0.129). Row 25: Owns stocks Prefer not to say, -0.224 (-0.322, -0.126). Row 26: Investment experience Limited experience, -0.300 (-0.399, -0.201). Row 27: Investment experience Sophisticated, -0.319 (-0.324, -0.403). Row 28: Small business investment, -0.633 (-0.679, -0.587). Row 29: Invested in LCF, -0.050 (-0.103, 0.003). Row 30: Lendy, 0.241 (0.181, 0.301). Row 31: Woodford F., -0.132 (-0.173, -0.091). Row 32: Blackstone B, -0.314 (-0.387, -0.241). Row 33: Others, -0.162 (-0.217, -0.107). Row 34: Principal investment all, 0.000 (0.000, 0.000). Row 35: Principal lost all, 0.000 (0.000, 0.000). Row 36: Constant, 0.453 (0.390, 0.516). Row 37: Observations, 610. Row 38: R-squared, 0.090. Row 39: Adj R-squared, 0.070. Row 40: Residual Std. Error, 0.410 (df = 569).
The table replicates OLS regressions in Table 3 – Columns 3,5 and 6 (see notes to Table 3 for details on these specifications), while using as dependent variable investor’s Trust Gain in Financial Market if investors were compensated. Columns 1–3 show corelations between trust gain if investors were compensated by a Regulator (e.g. FSCS) and various investor and investment type characteristics. Columns 4–6 show the same results for investors’ trust gain if investors were compensated by Other Venues of administration. Robust standard errors adjusted for heteroscedasticity are in brackets. Significance: *p < 0.10; **p < 0.05, and ***p < 0.01.
4.3. Trust loss – investors: Effect on future investment decisions?
In this section we move the analyses a step forward, by looking how investors’ trust loss in financial markets affect their (potential) future investment decisions. To do so we utilize responses to the following survey question: “Given your experiences with any of the mentioned failed companies and administration processes, would you be willing to invest in UK financial market again?” (see Online Appendix, Q25). Based on responses, we created (ordered) variable Would invest after all ifcoded as follows: 0 = Never again; 1 = Maybe – depends on the amount of money I get back; 2 = Yes – if I get all my money back; 3 = Yes – if I get at least some of my money back, 4 = Yes – regardless of whether I get money back or not.
Using this as our dependent variable, we estimate linear probability (OLS) and ordered probit regressions to analyse correlations with investors’ Trust Loss in financial market. The results are shown in Table 7. Columns 1–4 show results from OLS, Columns 5–8 show results from ordered probit. For both sets of regressions, we first show benchmark results including Trust Loss without any controls (Columns 1 and 5). The other columns show results including Trust Loss while controlling for various vectors of investors characteristics as in Table 3 – Columns 3, 5, and 6, respectively. Both OLS and probit estimations show significant negative effect of higher Trust Loss on whether investors would invest in future or not. Although controlling for investors’ characteristics slightly reduces Trust Loss estimates (in absolute values), the significantly negative effect remains regardless of the specification. The estimates (top row of the table) are also quite similar across OLS and probit specifications. Overall, higher Trust Loss reduces probability of future investment by 0.4–0.5 point, or by about 30–37 percent, given the mean in our sample, 1.35 (Table 1).
How does investor’s trust loss in financial market affect their future investment decision?

Table 7. Long description
Table 7: The table presents the results of linear probability (OLS) and ordered probit regressions analyzing the correlation between investors’ trust loss in the financial market and their future investment decisions. The table has 10 rows and 8 columns. Column headers are: Dependent variable, 1, 2, 3, 4, 5, 6, 7, 8. Row labels include Trust loss in financial market, Controls (investors’ characteristics), Predict Outcome, Constant, Observations, R squared. Row 1: Trust loss in financial market, OLS: -0.533, -0.431, -0.395, -0.399, Ordered probit: -0.483, -0.460, -0.450, -0.452. Row 2: Controls (investors’ characteristics), No, Yes, Yes, Yes, No, Yes, Yes, Yes. Row 3: Predict Outcome, 0, 0.178, 0.164, 0.157, 0.158, 1, 0.002, 0.003, 0.005, 0.005, 2, -0.037, -0.046, -0.048, -0.048. Row 4: Constant, 2.302, 1.849, 1.021, 1.025, 3, -0.069, -0.075, -0.076, -0.077, 4, -0.073, -0.046, -0.038, -0.038. Row 5: Observations, 610, 610, 610, 610, 610, 610, 610, 610. Row 6: R squared, 0.162, 0.364, 0.426, 0.423.
Controls include the same Investors’ Characteristics in Columns 2 and 6 as in Column 3 (Table 3); in Columns 3 and 7 as in Column 5 (Table 3), and in Columns 4 and 8 as in Column 6 (Table 3); the same specifications are also reported in Tables 4–6. Dependent variable is ordered five-level categorical variable coded as follows: 0 = Never again; 1 = Maybe – depends on the amount of money I get back; 2 = Yes – if I get all my money back; 3 = Yes – if I get at least some of my money back. 4 = Yes – regardless of whether I get money back or not. For comparison with OLS, estimated coefficients from ordered probit are reported at the top. Below that marginal effects at the means of “Trust Loss in Financial Market” predicting probability of each value of dependent variable are reported.
The table shows results from linear probability model (OLS) in Columns 1–4 and Ordered Probit in Columns 5–8. Robust standard errors adjusted for heteroscedasticity are in brackets. Significance: *p < 0.10; **p < 0.05, and ***p < 0.01.
Looking on probability of each response outcome (0,1,2,3,4) and their marginal effects at sample mean (bottom panel of probit results) further shows that higher Trust Loss significantly increases the outcome (0), i.e., that investors will “Never again” invest in financial market. At the same time, probabilities of responses (2,3,4) and thus chances that investors will invest if they get all/at least some or no money back are also significantly lower with higher Trust Loss.
Sub-sample probit analyses in Table 8 additionally show that controlling for investors’ characteristics, first-time investors have higher probability of investing “0 = Never again” than other investors, as a result of higher Trust Loss. Moreover, the probability of “1 = Maybe” outcome and chances of considering investment conditional on getting some money back is also significantly negative, although more experienced investors may consider investing again.
Trust loss in financial market and future investment decision: first-time vs. other investors

Table 8. Long description
A table comparing investment decisions between first-time and other investors based on trust loss in financial markets. The table has 10 rows and 8 columns. The columns are labeled as follows: Dependent variable, First-time Investors (with sub-columns 1, 2, 3, 4), and Other Investors (with sub-columns 5, 6, 7, 8). The rows are labeled with different investment decision outcomes: 0 = Never again, 1 = Maybe – depends on the amount of money I get back, 2 = Yes – if I get all my money back, 3 = Yes – if I get at least some of my money back, 4 = Yes – regardless whether I get money back or no, Controls (investors’ characteristics), and Observations. Each cell contains numerical values representing the marginal effects at means for the respective investor groups and conditions. The table shows how different levels of trust loss impact future investment decisions differently for first-time and other investors.
So, “If investors decided to invest their money again in future – what type of investment would they most likely consider?” The distribution of responses to this survey question (see Online Appendix, Q26) are summarized in Table 9. Most investors would consider bank accounts or other protected/safe assets. Thirty-seven percent would also consider property. Investing via financial adviser also seems unattractive (only 16%). This is perhaps not surprising, given that many investors were misled by individuals deemed to be financial experts or official websites marketing financial products. At the same time, only 12 percent investors believe that their experiences would allow them to make safe decisions for themselves in future and 10 percent would not invest into any asset listed.
Would invest after all into what? Summary of investors’ responses

Table 9. Long description
A table titled ‘Would invest after all into what? Summary of investors’ responses’ with eight rows and five columns. The columns are labeled ‘Mean’, ‘Stand. Dev.’, ‘Min’, and ‘Max’. The rows are labeled with different investment options: Commodities, Property, Stock market, (via) Financial adviser, Bank account/Bldg. society (protected), Also other financial products if protected, Any financial product – given all my experience believe would be able to make a safe decision for myself in future, and None of the above. Each row provides the mean, standard deviation, minimum, and maximum values for the respective investment option. For example, Commodities have a mean of 0.17, a standard deviation of 0.38, a minimum of 0, and a maximum of 1. The table shows that the most preferred investment option is Bank account/Bldg. society (protected) with a mean of 0.64, while the least preferred is None of the above with a mean of 0.10.
The table provides summary statistics of investors’ responses to the survey question: “If you decided to invest your money in future – what type of investment would you most likely consider? Select all that apply “.
Overall, these results show that losses of trust – as experienced by investors in our failed innovative finance companies – affect future investors’ decisions and significantly reduce the likelihood of future risky investments. Because trust loss is not recoverable, this would hold even if investors were compensated. Thus, in a broader context, our results suggest that moral hazard associated with compensating investors is unlikely to arise after directly experiencing investment loss.
5. Empirical approach and results: Students
This section focuses on analyses of an analogous survey for students that now captures the impact of information rather than own experience on individual trust in financial markets, accounting firms and regulators. Unlike investors, all our master’s students represent quite a homogenous group, so we dropped – Age, Married, Employment, HH income, and Education from our analyses. Also, 57 percent students are non-White (43% Asian, 13% Other), so in the analyses we put dummies for these categories separately. Table S1 shows all student demographic and investment characteristics. About 40 percent are female, and 18 percent live alone. About 34 percent are from economics and strategy programme, 31 percent are from MSc Finance, and the remaining 35 percent are from other finance-related programmes. Most students reported limited investment experience, and about 36 percent have none or first-time experience. Almost 68 percent of students own stocks (majority owns less than 50K), and about 28 percent heard about our three failed companies already. After reading about what happened to these companies (“Would they invest if …”), only 3 percent responded “Never,” 30 percent answered “Maybe,” and the rest chose various “yes” options.
5.1. Students: Changes in trust before vs. after reading about three failed companies
Figure S1A shows a downward shift in the distribution of students’ values of trust after the information treatment, a qualitatively similar result with the investors. Figures S1B–S1C document potential gains in students’ trust if investors of the failed company would be compensated by a regulator or other venues of administration. Table S2 shows the differences in means. Students, as investors, show significant Trust Losses in financial markets, big audit firms, and regulators, but their losses (due to information) are much smaller than the trust losses of investors (due to direct investment loss). Importantly, when it comes to Trust Gain, compensation of investors can fully recover students’ Trust Loss in financial markets, but only if provided via a regulator. Other venues of money recovery only partially restore the lost trust.
5.2. Trust loss, trust gain, and students’ characteristics
Even though the student sample is relatively small and we cannot study correlations between Trust Loss (Trust Gain) with as many individual characteristics as for investors, our results shown in Tables S3 and S4 reveal several important patterns. First, being Female, living alone (one person in HH), and differences in Investment Experience show again some significant correlations with Trust Loss (in financial markets or accounting firms), suggesting important role of these characteristics for trust formation. Moreover, opposite signs of some estimates compared with investors indicate that information (about losses of others) may trigger different responses in individual trust than own experience. As for investors, we also find (weaker) evidence that Non-White, especially Asians, have lower trust-losses. Second, Ownership of stocks (already at this stage of life) plays an important role for trust formation. Those with higher value of stocks are more sensitive to information about losses of others than those without stocks. But this effect is U-shaped; most wealthy (more than 100K) show lower trust loss. Third, students who already Heard about failed company (e.g., friends, news) tend to have lower trust loss (especially in key regulators), suggesting that sensitivity to information diminishes over time; new information has a stronger impact.Footnote 21 Finally, students in MSc Finance exhibit highest trust loss in financial markets. Given the focus of their studies, this finding might be explained by the (degree of) sensitivity to information in trust formation.
Other individual characteristics explain little variation in trust losses. The R-squared in the regressions remains low – suggesting again that the event “per-se,” i.e., information about losses of others, remains to be the key driver rather than heterogeneity in individual characteristics. Similarly, for Trust Gain (Table S4), insignificant correlations show that information about possible compensation of others brings similar gains in the trust values of students, regardless of their characteristics. In other words, as shown in Table S2, on average, information about compensation of others generates significant trust gains. However, as Table S4 further shows, there are no systematic differences among people with certain characteristics that would be more easily influenced (e.g., by media or government) to revert their trust compared with others. What matters most for trust gain is the information that investors/others are compensated and how – via regulator (e.g., FSCS) or by other venues.
5.3. Trust loss – students: Effect on future investment decisions?
In this section we analyse student responses to the same type of question posed to investors (Section 4.3), namely: “After learning what happened to the investors of the mentioned failed companies, would you be willing to invest in UK financial market?” (Online Appendix, Part C, Q23). Based on the responses, we again construct an (ordered) dependent variable, coded as follows: 0 = Never again; 1 = Maybe – depends on how much money investors in those failed companies get back; 2 = Yes – if investors in those failed companies get all their money back; 3 = Yes – if investors in those failed companies get at least some of their money back; 4 = Yes – regardless of whether investors in those failed companies get money back or not. Table S5 shows results from OLS (linear probability model) and ordered probit looking on the impact of student’s Trust Loss in financial market on the probability of investment. Colums 1 and 4 show the benchmark specification without controlling for student characteristics. Columns 2–3 and 5–6 show specifications while controlling for the same sets of student characteristics as Table S3 (and Table S4), Columns 1–2, respectively. The first row shows estimates of the overall effect of Trust Loss for both OLS and ordered probit. The bottom panel of the probit shows marginal effects at means for each response outcome (0,1,2,3,4).
Unlike for investors, Trust Loss shows a significantly positive effect on probability of investment without and with partial controls (Columns 1–2 and 4–5). Once all controls are included, the estimate of Trust Loss noticeably drops and becomes insignificant in both OLS and ordered probit (Columns 3 and 6). Marginal effects for each outcome show the same. Controlling for student characteristics Trust Loss has no effect on investment probabilities. This is an important difference to investors. Their trust loss, triggered by own experience of direct investment loss, shows a significantly negative effect on investment probabilities across all specifications. In other words – although investors change investment behaviour after a direct investment loss, students do not change their investment behaviour. Table S6 further echoes this message by showing that after all the information about the failed companies, most students would still invest in stocks/property/commodities rather than protected assets (e.g., deposits). Not so many students would invest with a financial adviser either.
Overall, these results indicate that just passive information/learning is not enough to stop people from making potentially risky investments. We also need some form of experiential learning, i.e., feeling of money loss first-hand. This is a potential venue for future research given our relatively small sample of students.
6. Conclusion
We analyse how exposure to corporate failures of innovative finance companies – and thus experiencing direct investment loss – affects individuals’ trust in financial markets, regulators, big audit firms, and future financial decisions. We utilize a unique “experiential” research setting including the three recent major UK financial failures, namely: LCF, Lendy, and the Woodford Fund. We design and analyse a survey involving investors directly exposed to investment losses in these failures. We also analyse the information effects (triggered by reading about these failures) via a student survey.
Our results suggest that exposure to such failures significantly reduces investors’ trust in financial markets, regulators, and big audit firms. Investors’ trust loss is not fully reversible even if investors are compensated. Trust loss could be lower, however, if investors are compensated via the regulator (e.g., deposit insurance scheme) rather than other venues of administration (e.g., asset recovery). Information about losses of others (as per student survey) also reduces trust but to a smaller extent. Trust loss also significantly affects investors’ future financial decisions. We find lower probability to invest at all; our data also suggest a stronger preference for safe/protected assets after exposure to failure. Unlike the case for investors, the student survey results show that information-based trust loss can be fully recovered, and such trust loss has an insignificant impact on future investment decisions.
We also explore correlations of trust losses (trust gains) with various individual demographic and investment characteristics. Although we find some patterns of heterogeneity across different specifications – e.g., females (vs. male), marital status, living alone, non-Whites (vs. White), investment experience – we find no or little differences across age, education, or income. At the same time, these characteristics explain little variation in trust changes overall, suggesting that events per se are the key drivers, rather than heterogeneity across individuals.
Overall, our paper shows how susceptible trust in the overall financial system can be to the failures of companies offering new financial products even in a country such as the UK with relatively well-developed financial regulatory framework. Our findings also emphasize the importance of own experience versus information in determining trust and future investment decisions.
Supplementary material
The supplementary material for this article can be found at https://doi.org/10.1017/flw.2026.10013.
Acknowledgements
We would like to thank the editor and anonymous referees for constructive comments. We would also like to thank Smith & Williamson LLP, the administrators of LCF company, for their help with distributing the survey used in this research to LCF investors. We would also like to thank Panayiotis Andreou (discussant), Michael Haliassos, Andreas Milidonis, and participants at the Central Bank of Cyprus Conference on Financial Literacy, as well as participants in the SIOE Conference for their comments. We are responsible for any errors.
Competing Interests
None.
Changes in Trust in Fin. Mkt “before” vs. “after” reading about failed companies – distributions. The figure shows the distribution of students’ responses on their values of trust in financial markets “before” vs. “after” reading about failed companies. Trust is coded on the 5-degree scale (0 = None; 1 = Low; 2 = Medium; 3 = High; 4 = Very High). Number of responses for each value is shown at the top of the bars.

Figure S1A. Long description
The figure shows the distribution of students’ responses on their values of trust in financial markets “Before” vs. “After” reading about failed companies. Trust is coded on the 5-degree scale (0=None; 1=Low; 2=Medium; 3=High; 4=Very High). Number of responses for each value is shown at the top of the bars.
Changes in Trust in Fin. Mkt if Investors were compensated by a regulator (e.g., FSCS). Figures S1B shows the distribution of students’ responses on their values of trust in financial markets after reading about failed companies vs. if investors were compensated by a “Regulator”. Trust is coded on the 5-degree scale (0 = None; 1 = Low; 2 = Medium; 3 = High; 4 = Very High). Number of responses for each value is shown at the top of the bars.

Figure S1B. Long description
Figure S1B shows the distribution of students’ responses on their values of trust in financial markets after reading about failed companies vs. if investors were compensated by a “Regulator”. Trust is coded on the 5-degree scale (0=None; 1=Low; 2=Medium; 3=High; 4=Very High). Number of responses for each value is shown at the top of the bars.
Changes in Trust in Fin. Mkt if Investors were Compensated by Other Venues, not a Regulator. Figure S1C shows the distribution of students’ responses on their values of trust in financial markets after reading about failed companies vs. if investors were compensated by “Other venues of Administration”. Trust is coded on the 5-degree scale (0 = None; 1 = Low; 2 = Medium; 3 = High; 4 = Very High). Number of responses for each value is shown at the top of the bars.

Figure S1C. Long description
Figure S1C shows the distribution of students’ responses on their values of trust in financial markets after reading about failed companies vs. if investors were compensated by “Other venues of Administration”. Trust is coded on the 5-degree scale (0=None; 1=Low; 2=Medium; 3=High; 4=Very High). Number of responses for each value is shown at the top of the bars.
Summary statistics (90 students)

Table S1. Long description
The table presents demographic and investment characteristics with their respective mean, standard deviation, minimum, and maximum values. It has 18 rows and 5 columns. The columns are labeled as Variable, Mean, St. Dev., Min, and Max. The table is divided into two main sections: Demographics and Investment Characteristics. Under Demographics, variables include Female, NonWhite, Asian, Other_nonWhite, 1 person in HH, MSc ESB Program, and MSc Finance Program. Under Investment Characteristics, variables include Investment Experience (None so far, First-time, Limited exper., Sophisticated), Owns Stocks (directly or indirectly), Owns Stocks (how much) (Less than 10K, 10K to 49 999, 50K to 100K, More than 100K, Prefer not to say), Heard about Failed Companies (news, friends), and Would Invest If. Each row provides the mean, standard deviation, minimum, and maximum values for the respective variable.
Trust variables – differences in means “before” vs. “after” reading about failed companies

Table S2. Long description
The table compares trust levels in various financial market entities and regulators before and after a certain event. It has 12 rows and 4 columns. The columns are labeled ‘Trust in’, ‘Mean’, ‘N used in the test’, and ‘Difference’. The ‘Trust in’ column lists entities such as FinMkt, Big Accounting/Audit Firms, and various regulators like FCA, PRA, FSCS, HM Treasury, and BoE. The ‘Mean’ column has sub-columns ‘Before’, ‘After’, and ‘Difference (i.e., Trust Loss)’, showing trust levels on a 5-degree scale from 0= None to 4= Very High. The ‘N used in the test’ column shows the number of participants in the test for each entity. Notable trends include a decrease in trust levels after the event for all listed entities, with the ‘Difference’ column showing the magnitude of trust loss. For example, trust in FinMkt decreased from 2.14 to 1.59, a loss of 0.56. Similarly, trust in the FCA decreased from 2.52 to 1.73, a loss of 0.78. The table also includes a section on trust gain if investors are compensated by FSCS/Regulator or other venues, showing an increase in trust levels.
The table shows the means, differences in means (Trust Loss/Trust Gain) and their t-tests for all our trust variables, based on students’ responses. Trust is coded on the 5-degree scale (0 = None; 1 = Low; 2 = Medium; 3 = High; 4 = Very High). Significance: * p < 0.10, ** p < 0.05, *** p < 0.01.
Top rows show students’ values of trust “Before” vs. “After” reading about failed companies and Trust Loss in: Financial Market; Big Accounting/ Audit Firms and 5 UK financial regulators (see Section 3 and footnote 11 for more details). Bottom two rows then compare students’ values of trust in financial market “After” reading about failed companies and “If investors were compensated by” a “Regulator” or by “Other venues” of administration and thus possible Trust Gain. a) When student reported that they “Never heard about it” or “Heard about it, but do not know what they do” for an institution (before reading about failed companies), these obs. are not included in mean comparisons as initial values of trust are missing.
Trust loss in financial market and regulators after reading about failed companies & students’ characteristics – OLS regressions

Table S3. Long description
The table presents data on trust loss before and after reading about a failed company, focusing on various contexts such as Big Accounting/Audit Firms, Financial Conduct Authority (FCA), HM Treasury, and Bank of England (BoE). It includes 19 rows and 10 columns, with column headers including FinMkt, Big Acc./Audit Firms, FCA, HM Treasury, and BoE. Row labels include categories like Female, NonWhite, Asian, Other_nonWhite, 1 person in HH, Invest. Experience, First-time, Limited exper., Sophisticated, Owns stocks, Less than 10K, 10K to 49 999, 50K to 100K, More than 100K, Prefer not to say, Heard about Failed Co., ESB, Finance, and Constant. Each row contains values representing trust loss metrics for each context. Notable trends include significant values for categories like 1 person in HH, First-time, and Owns stocks across different contexts.
The table shows results from OLS regressions/corelations between student’s Trust Loss in FinMkt after reading about failed companies, as dependent variable (col. 1–2), and student characteristics. Cols. 3–4 show the same results for student’s Trust Loss in Big Accounting/Audit Firms and Cols. 5–10 show the results for student trust losses in UK financial regulators as dependent variables (we dropped analysis for regulators: PRA and FSCS due to small sample, see Table S2). The first column for each dependent variable shows the benchmark specification including student ethnicity (NonWhite) as a dummy variable, and student stock ownership and investment experience as categorial variables. The second specifications then allow more flexibility by splitting these variables into separate categories. Robust standard errors adjusted for heteroscedasticity in brackets. Significance: * p < 0.10; ** p < 0.05 and *** p < 0.01.
Students’ trust gain in FinMkt if investors in failed co. compensated by FSCS/regulator or other venues

Table S4. Long description
The table compares trust gain in financial markets if investors were compensated by FSCS and other venues. It has 30 rows and 5 columns. The columns are labeled ‘Dep. Var.’, ‘By FSCS’, and ‘By Other Venues’. The rows include variables such as Female, NonWhite, Asian, Other_nonWhite, 1 person in HH, Invest. Experience, First-time, Limited exper., Sophisticated, Owns stocks, Less than 10K, 10K to 49 999, 50K to 100K, More than 100K, Prefer not to say, Heard about Failed Co., ESB, Finance, and Constant. Each row contains values and standard errors in brackets. Notable trends include the significant positive value for the 50K to 100K income bracket under ‘By FSCS’ and the significant negative value for ‘Prefer not to say’ under the same column. The table also includes the number of observations and R-squared values for each model.
The table replicates OLS regressions in Table S3 – cols. 1, 2 (see notes to Table S3 for details on these specifications), while using as dependent variable student’s Trust Gain in Financial Market if investors were compensated. Cols. 1–2 shows corelations between student’s trust gain if investors in failed companies were compensated by a Regulator (e.g., FSCS) and various student characteristics. Cols. 4–5 show the same results for student’s trust gain if investors were compensated by Other Venues of administration, as dependent variable. Robust standard errors adjusted for heteroscedasticity in brackets. Significance: * p < 0.10; ** p < 0.05 and *** p < 0.01.
How does Students’ Trust Loss in FinMkt affect their Future Investment Decision?

Table S5. Long description
The table presents data on the impact of trust loss in financial markets on investment decisions. It includes columns for OLS and Ordered Probit models, with controls for students’ characteristics. The table has 9 rows and 6 columns. Column headers are: Dep. Var., OLS 1, OLS 2, OLS 3, Ordered Probit 4, Ordered Probit 5, and Ordered Probit 6. Row labels include Trust Loss in FinMkt, Controls (Students’ Characteristics), Constant, Obs., and R2. Each row contains specific values and standard errors in brackets. The table also includes marginal effects at means for different predicted values of the dependent variable.
The table shows results from linear probability model (OLS) in Cols. 1–3 and Ordered Probit in Cols. 4–6. Robust standard errors adjusted for heteroscedasticity in brackets. Significance: * p < 0.10; ** p < 0.05 and *** p < 0.01.
Controls – include the same Students’ Characteristics in cols. 2 and 5 as in Column 1 (Tables S3 & S4); in cols. 3 and 6 as in Column 2 (Tables S3 & S4). Dependent variable is ordered 5-level categorical variable coded as follows: 0 = Never; 1 = Maybe – depends on how much money investors in those failed co. get back; 2 = Yes – if investors in those failed co. get all their money back; 3 = Yes – if investors in those failed co. get at least some of their money back. 4 = Yes – regardless whether investors in those failed co. get money back or not. For comparison with OLS, estimated coefficients from ordered probit are reported at the top. Below that marginal effects at the means of ‘Trust loss in FinMkt’ predicting probability of each value of dependent variable are reported.
Would invest after learning about failed co. into what? Summary of students’ responses

Table S6. Long description
The table presents data on student investment preferences and their statistical measures. It has 8 rows and 5 columns. The columns are labeled Mean, Stand. Dev., Min, and Max. The rows are labeled with different investment options and a final category for none of the above. Row 1: Commodities, Mean 0.31, Stand. Dev. 0.47, Min 0, Max 1. Row 2: Property, Mean 0.54, Stand. Dev. 0.5, Min 0, Max 1. Row 3: Stock Market, Mean 0.58, Stand. Dev. 0.5, Min 0, Max 1. Row 4: (via) Financial Adviser, Mean 0.27, Stand. Dev. 0.44, Min 0, Max 1. Row 5: Bank Acct./Bldg. Society (protected), Mean 0.22, Stand. Dev. 0.42, Min 0, Max 1. Row 6: Also Other Fin. Products if protected, Mean 0.13, Stand. Dev. 0.34, Min 0, Max 1. Row 7: Any Fin. Product - believe would be able to make a safe decision for myself, regardless of bad experiences of others, Mean 0.17, Stand. Dev. 0.37, Min 0, Max 1. Row 8: None of the above, Mean 0.01, Stand. Dev. 0.11, Min 0, Max 1.
The table provides summary statistics of students’ responses to the survey question: “If you decided to invest your money in future – what type of investment would you most likely consider? Select all that apply”.
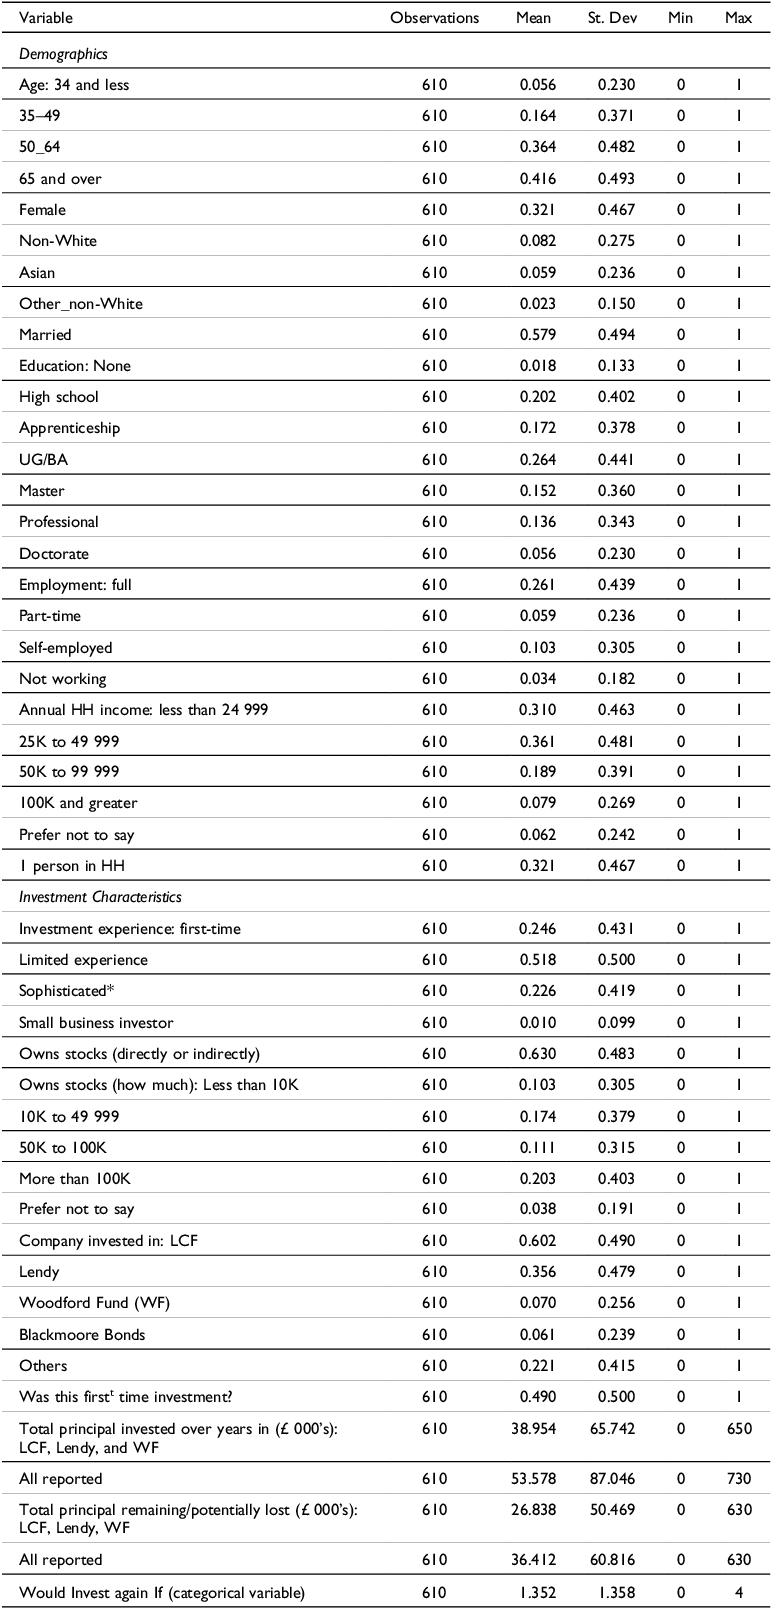
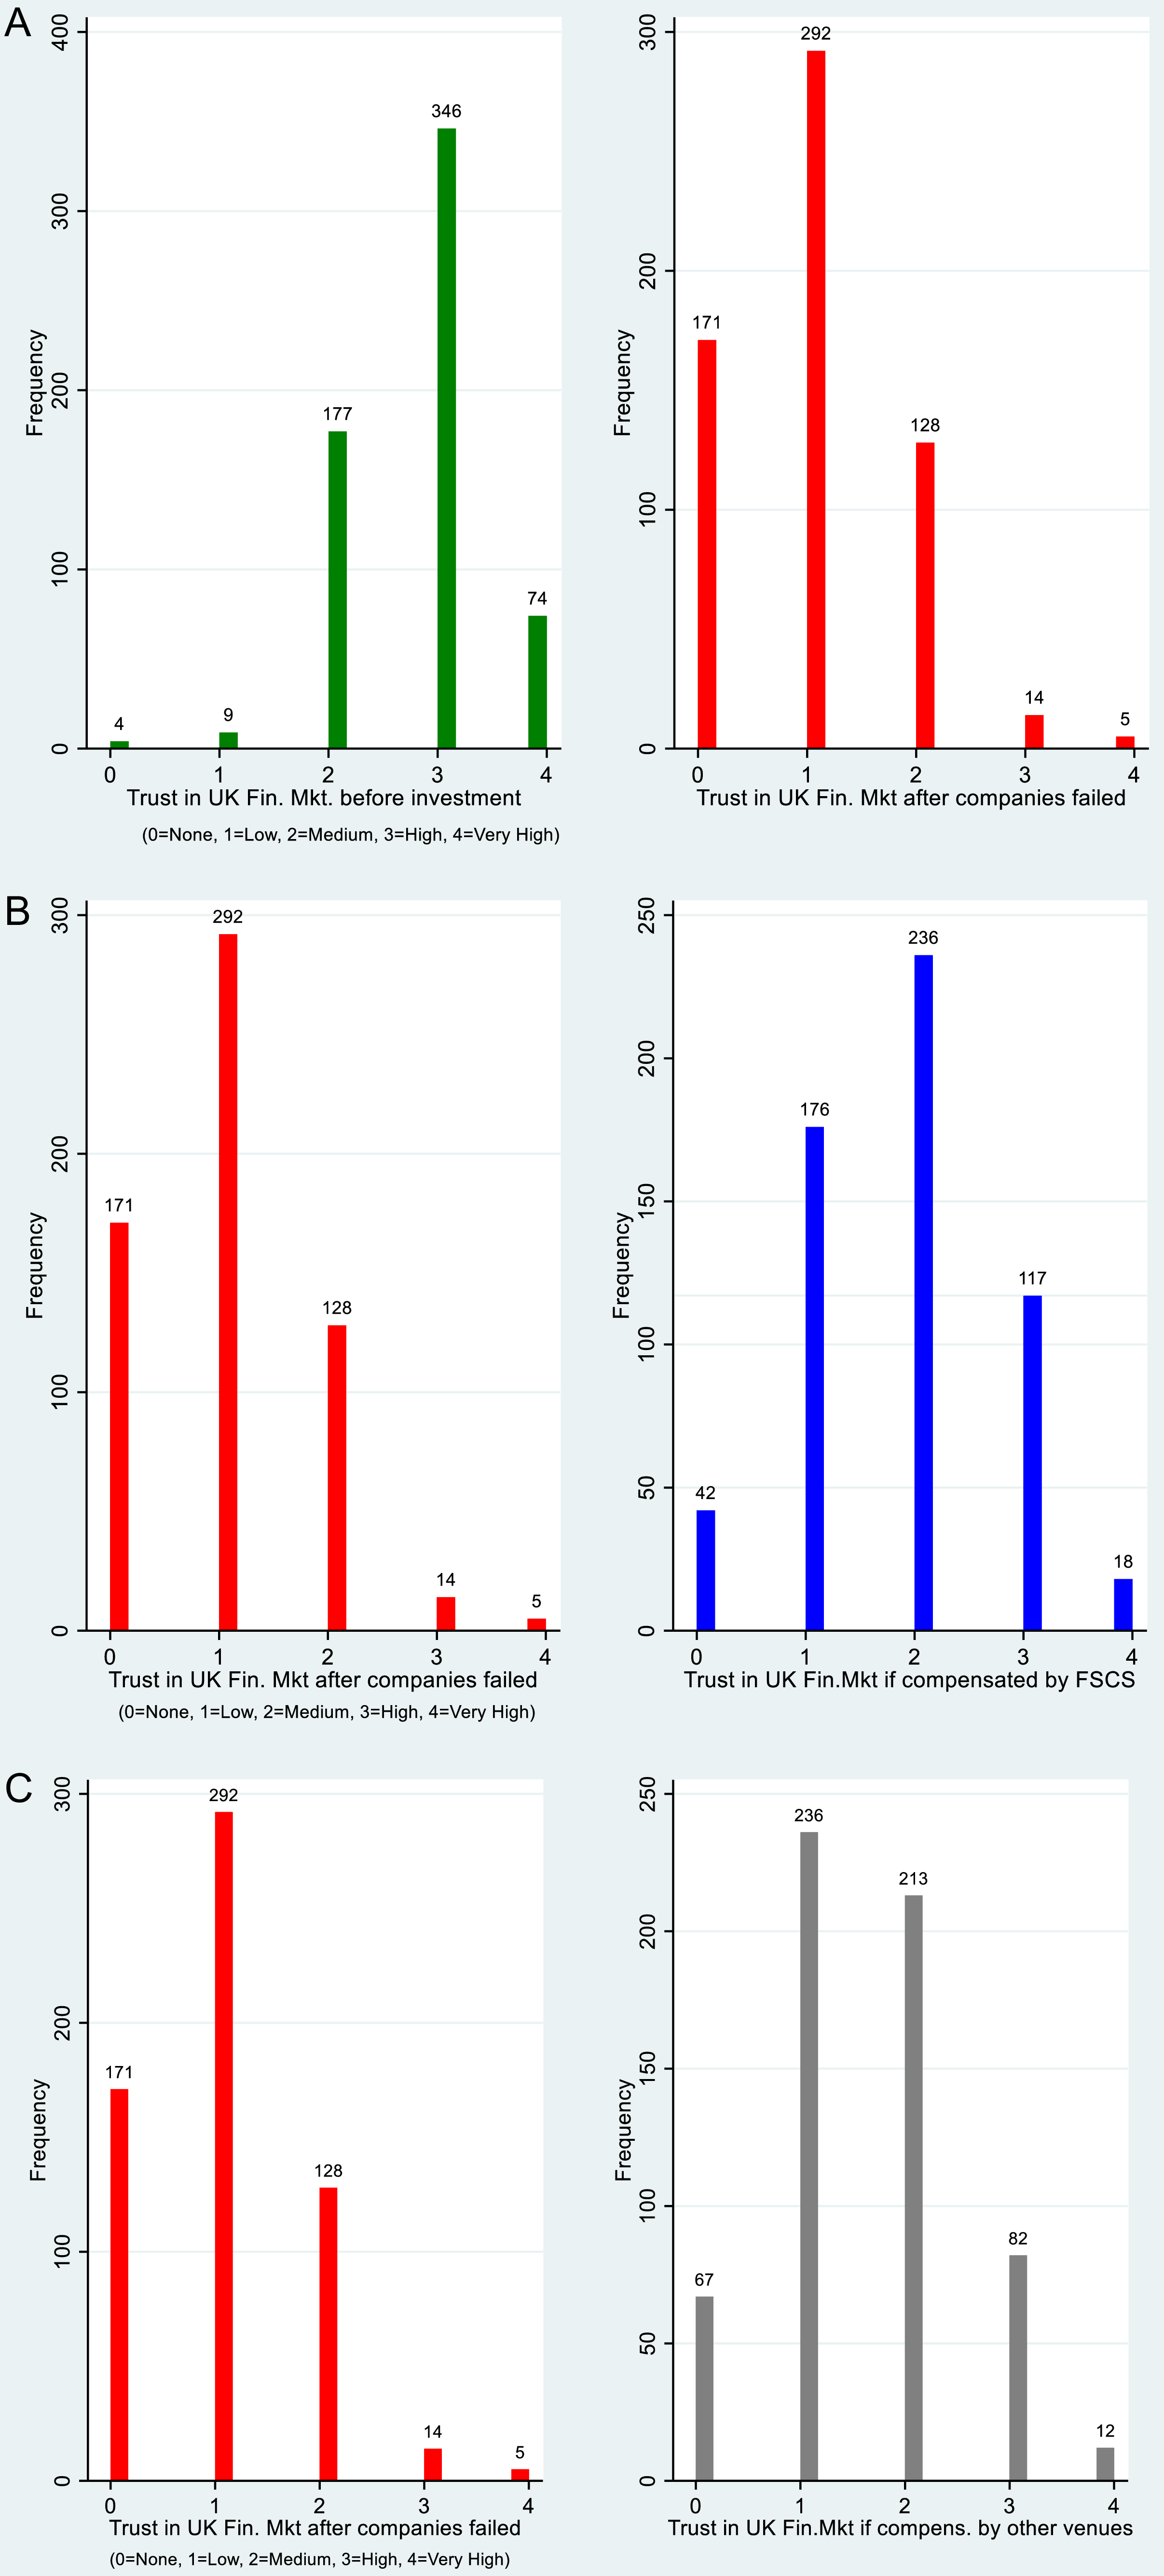
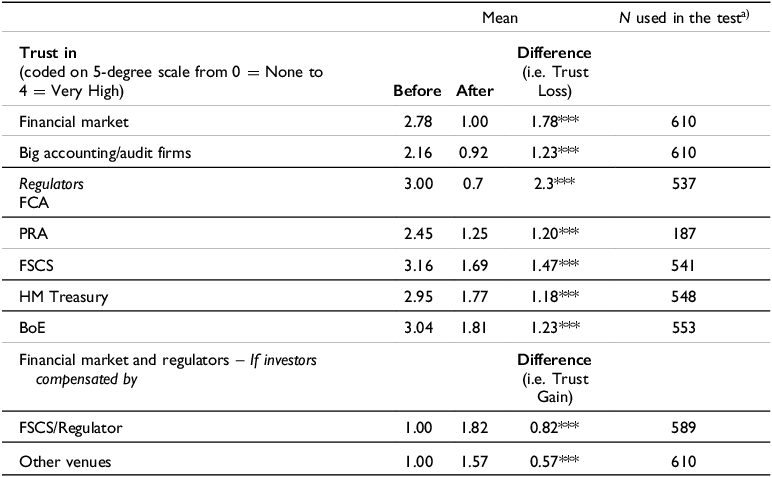
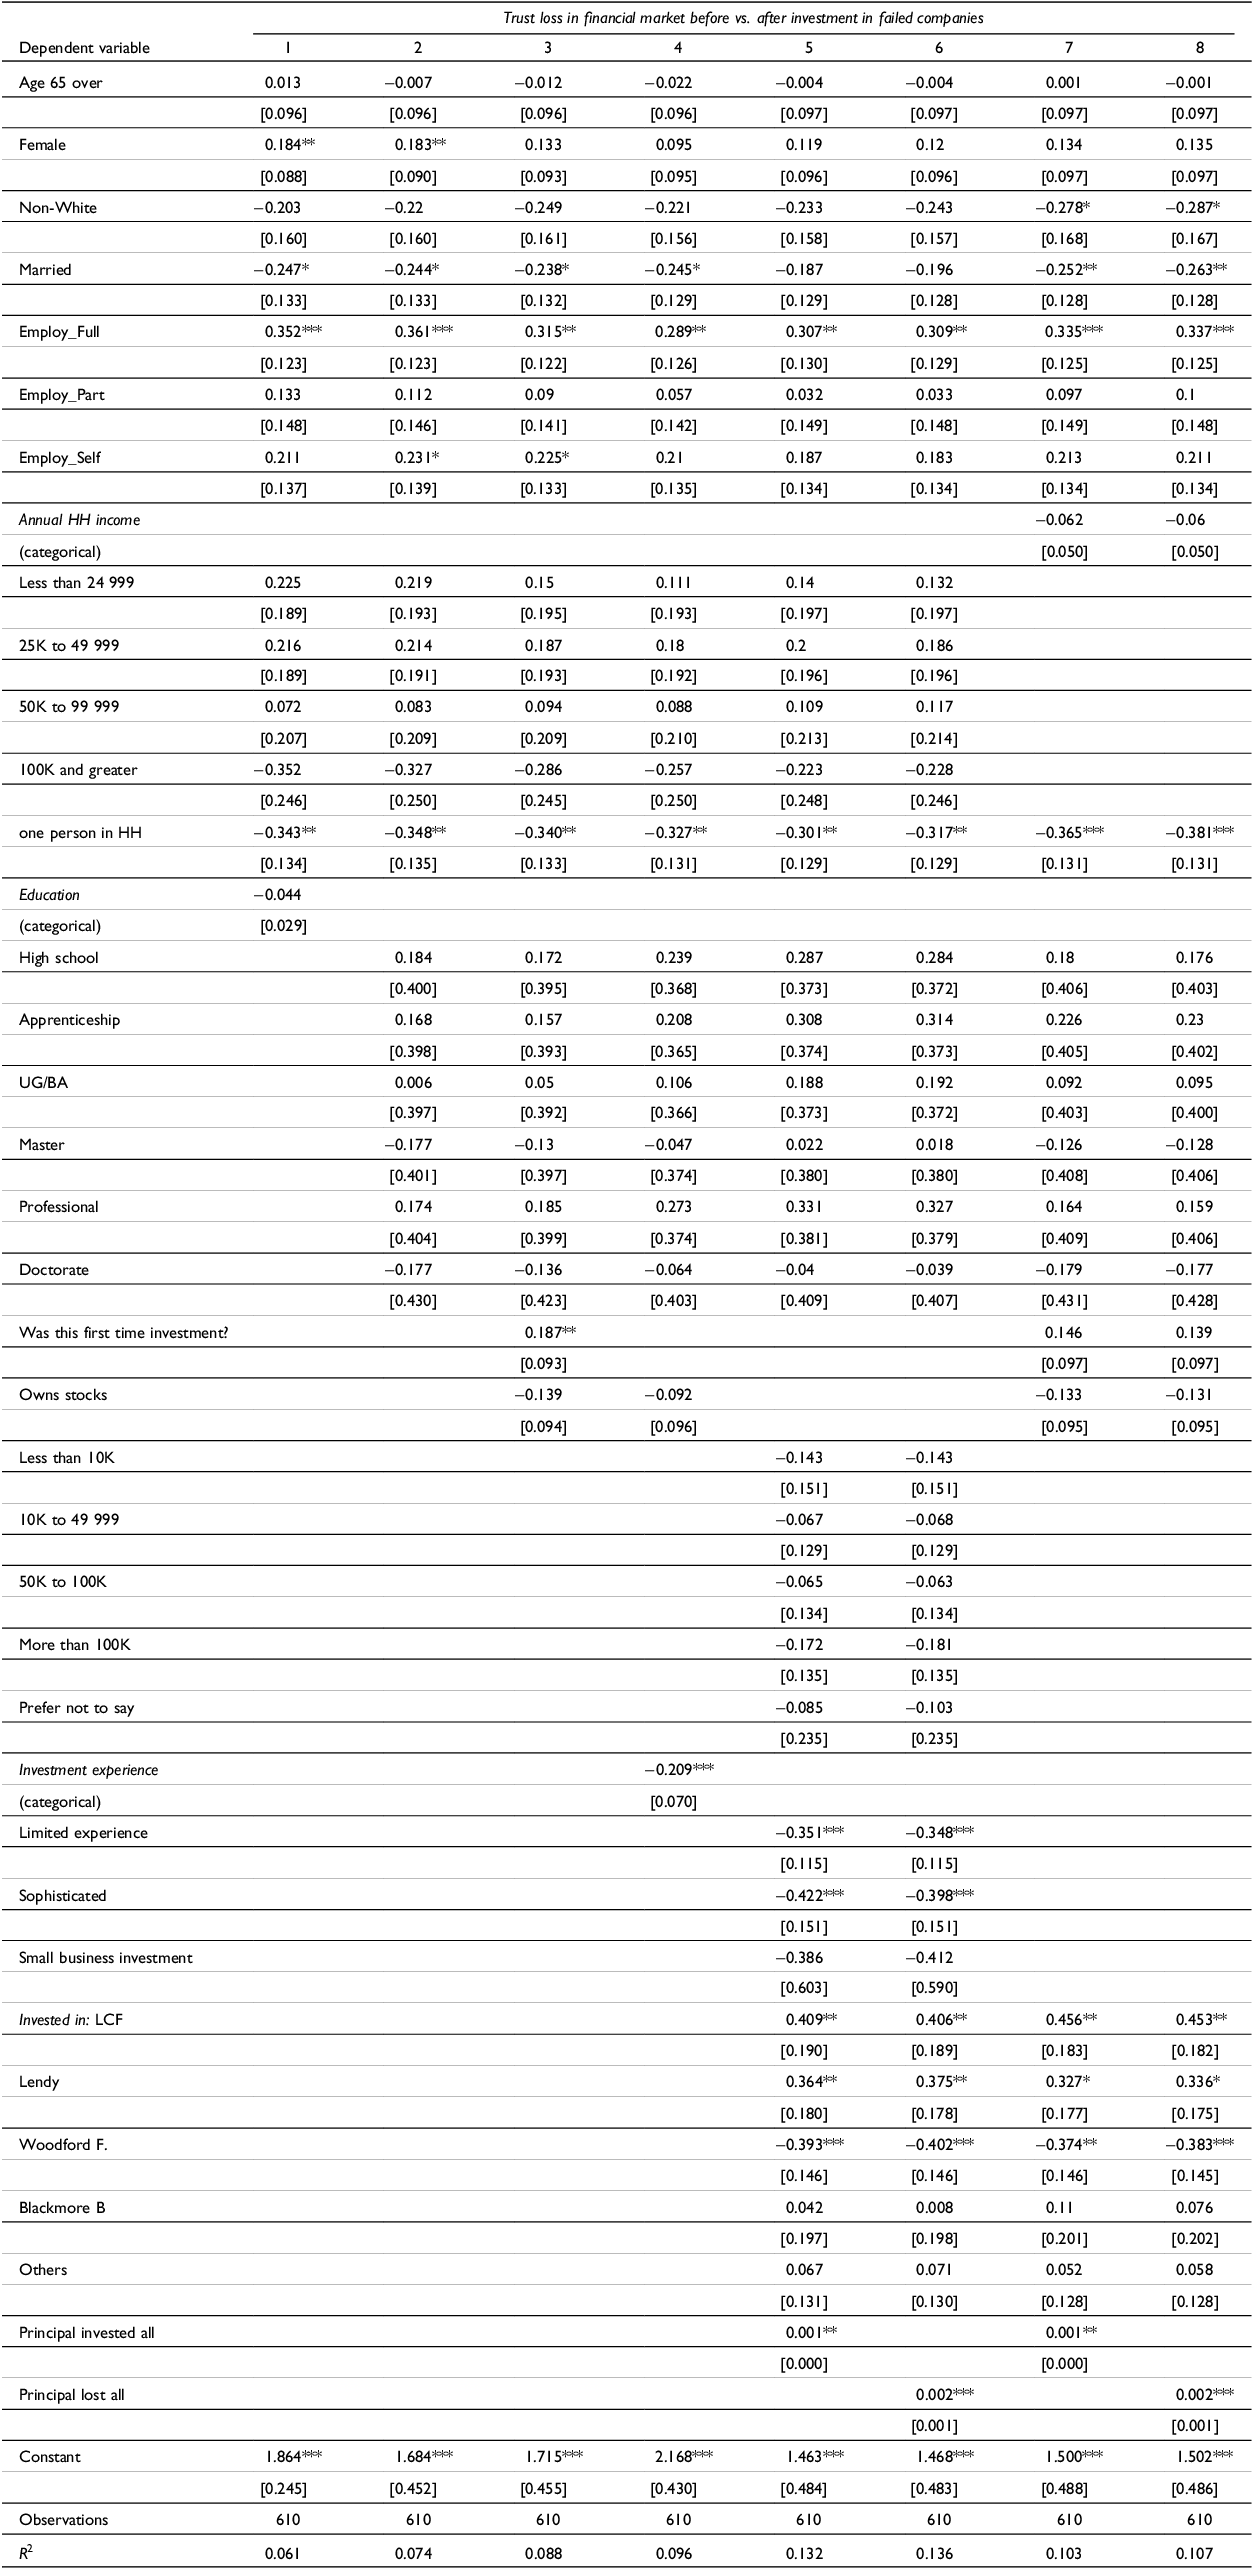
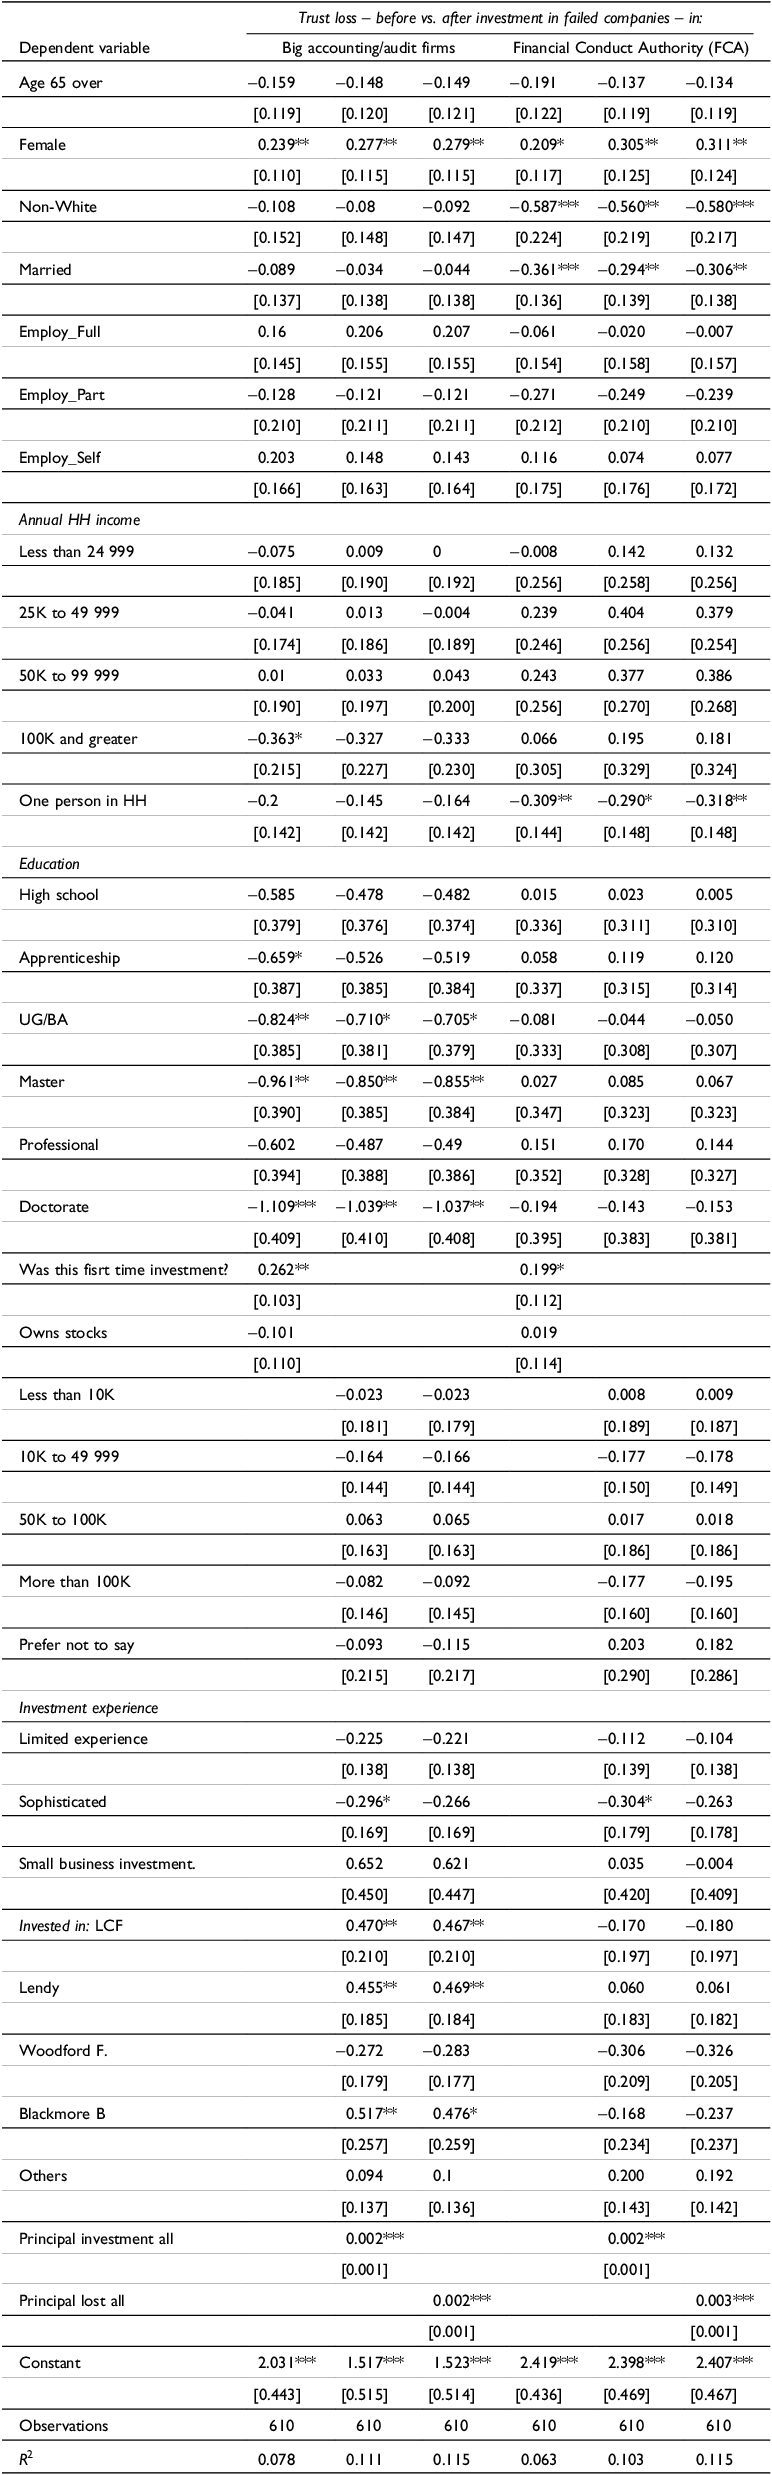
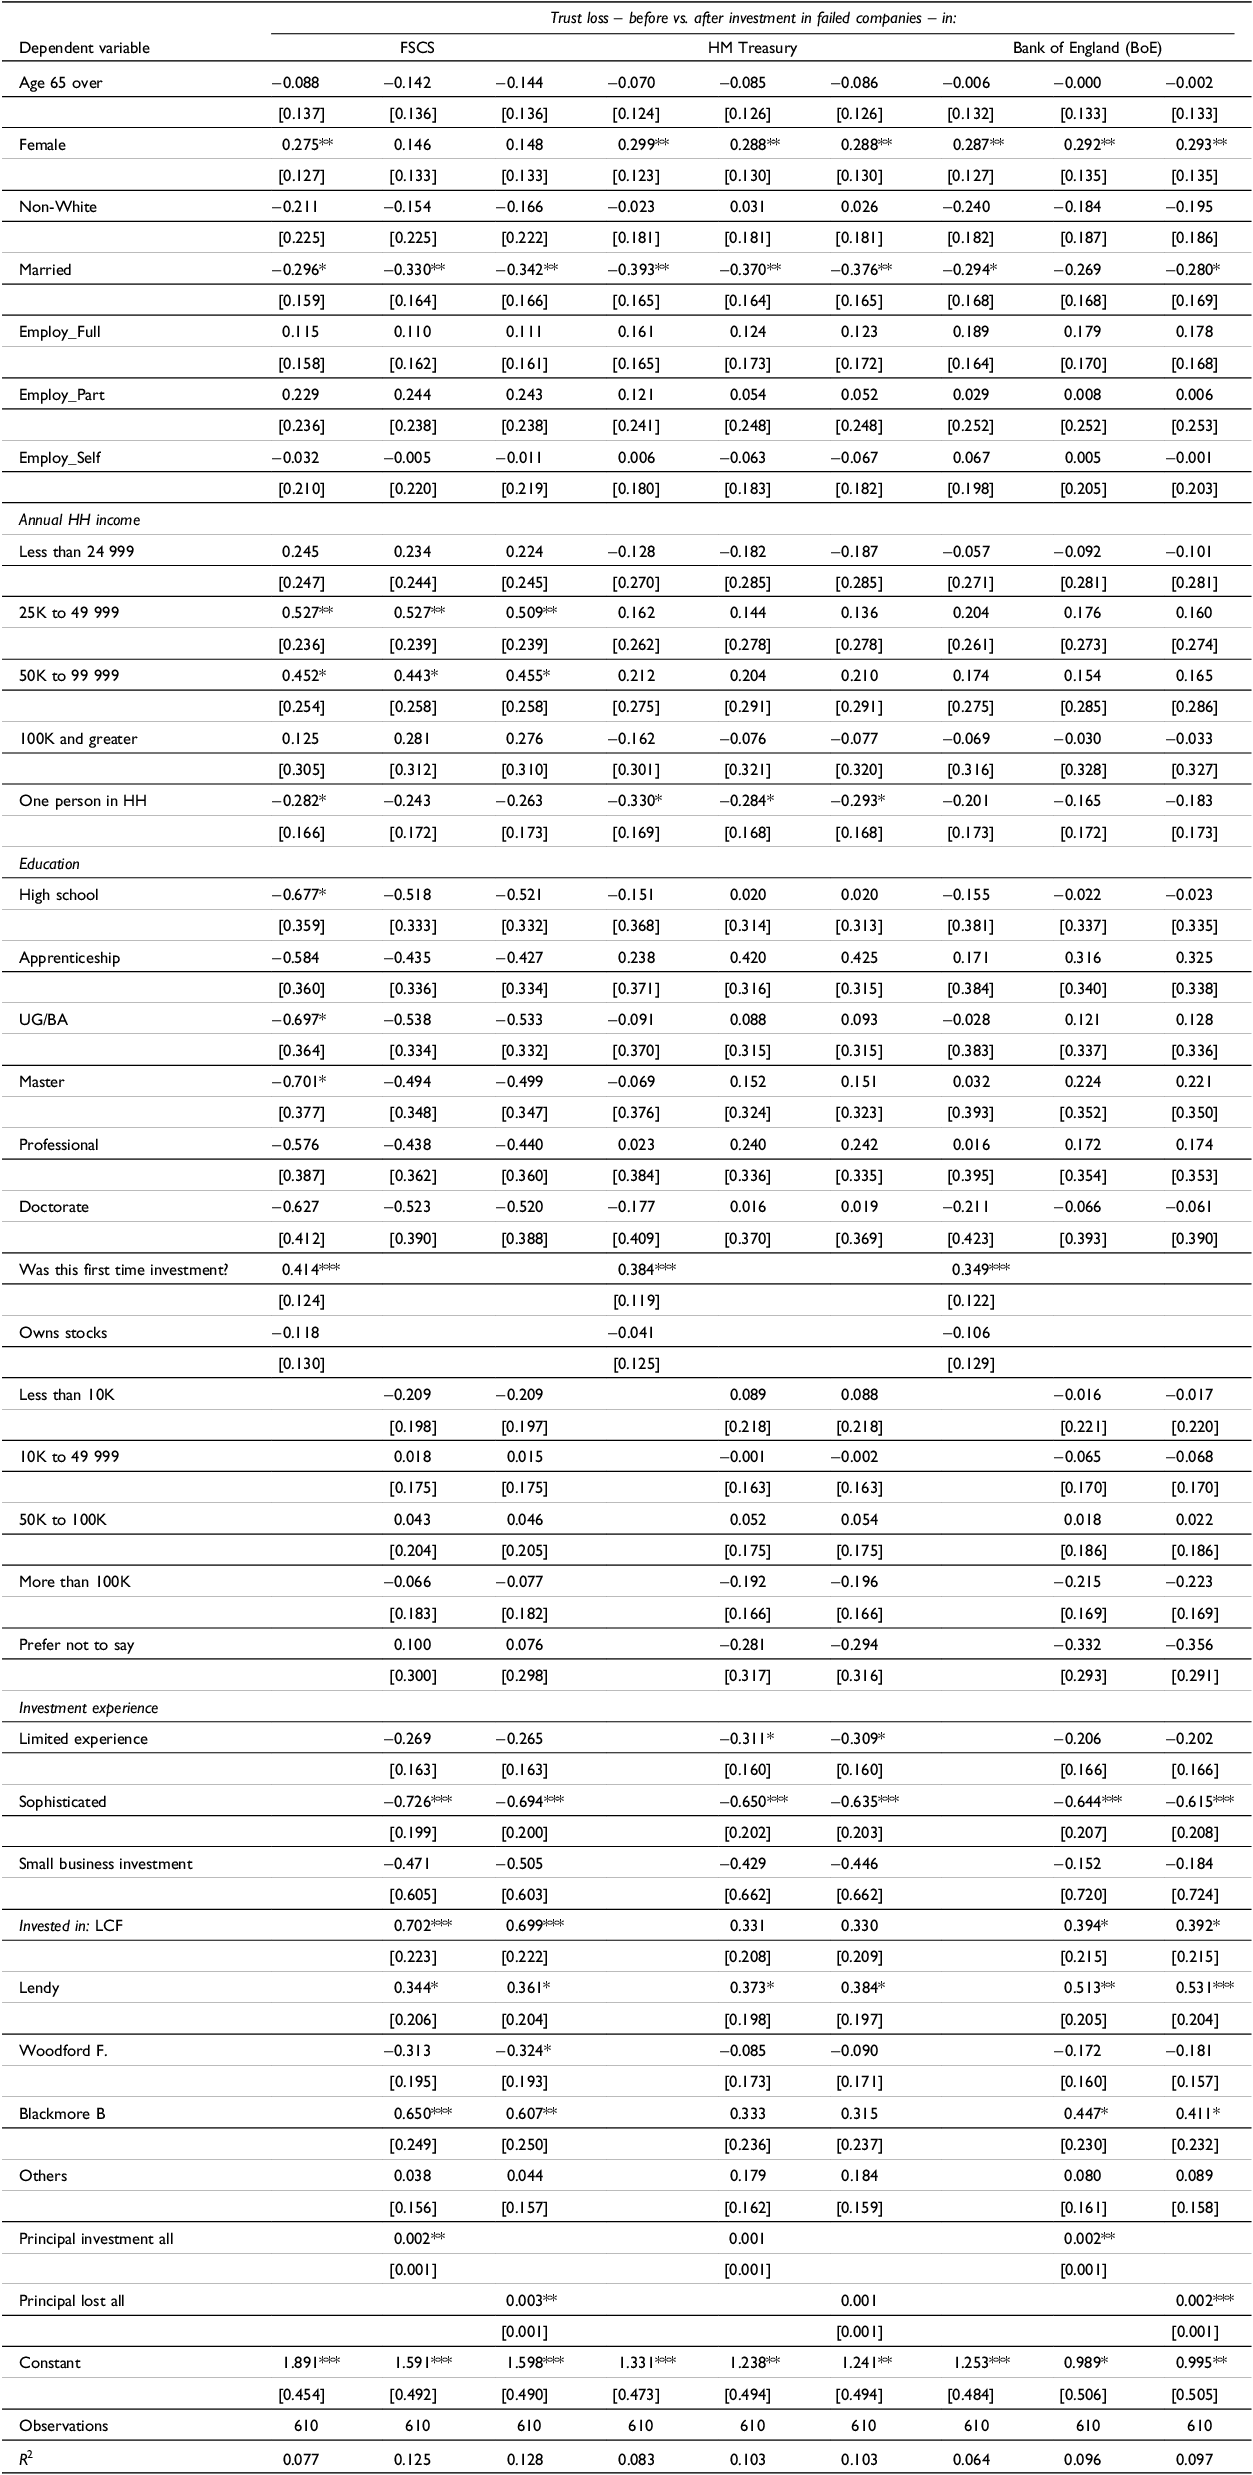
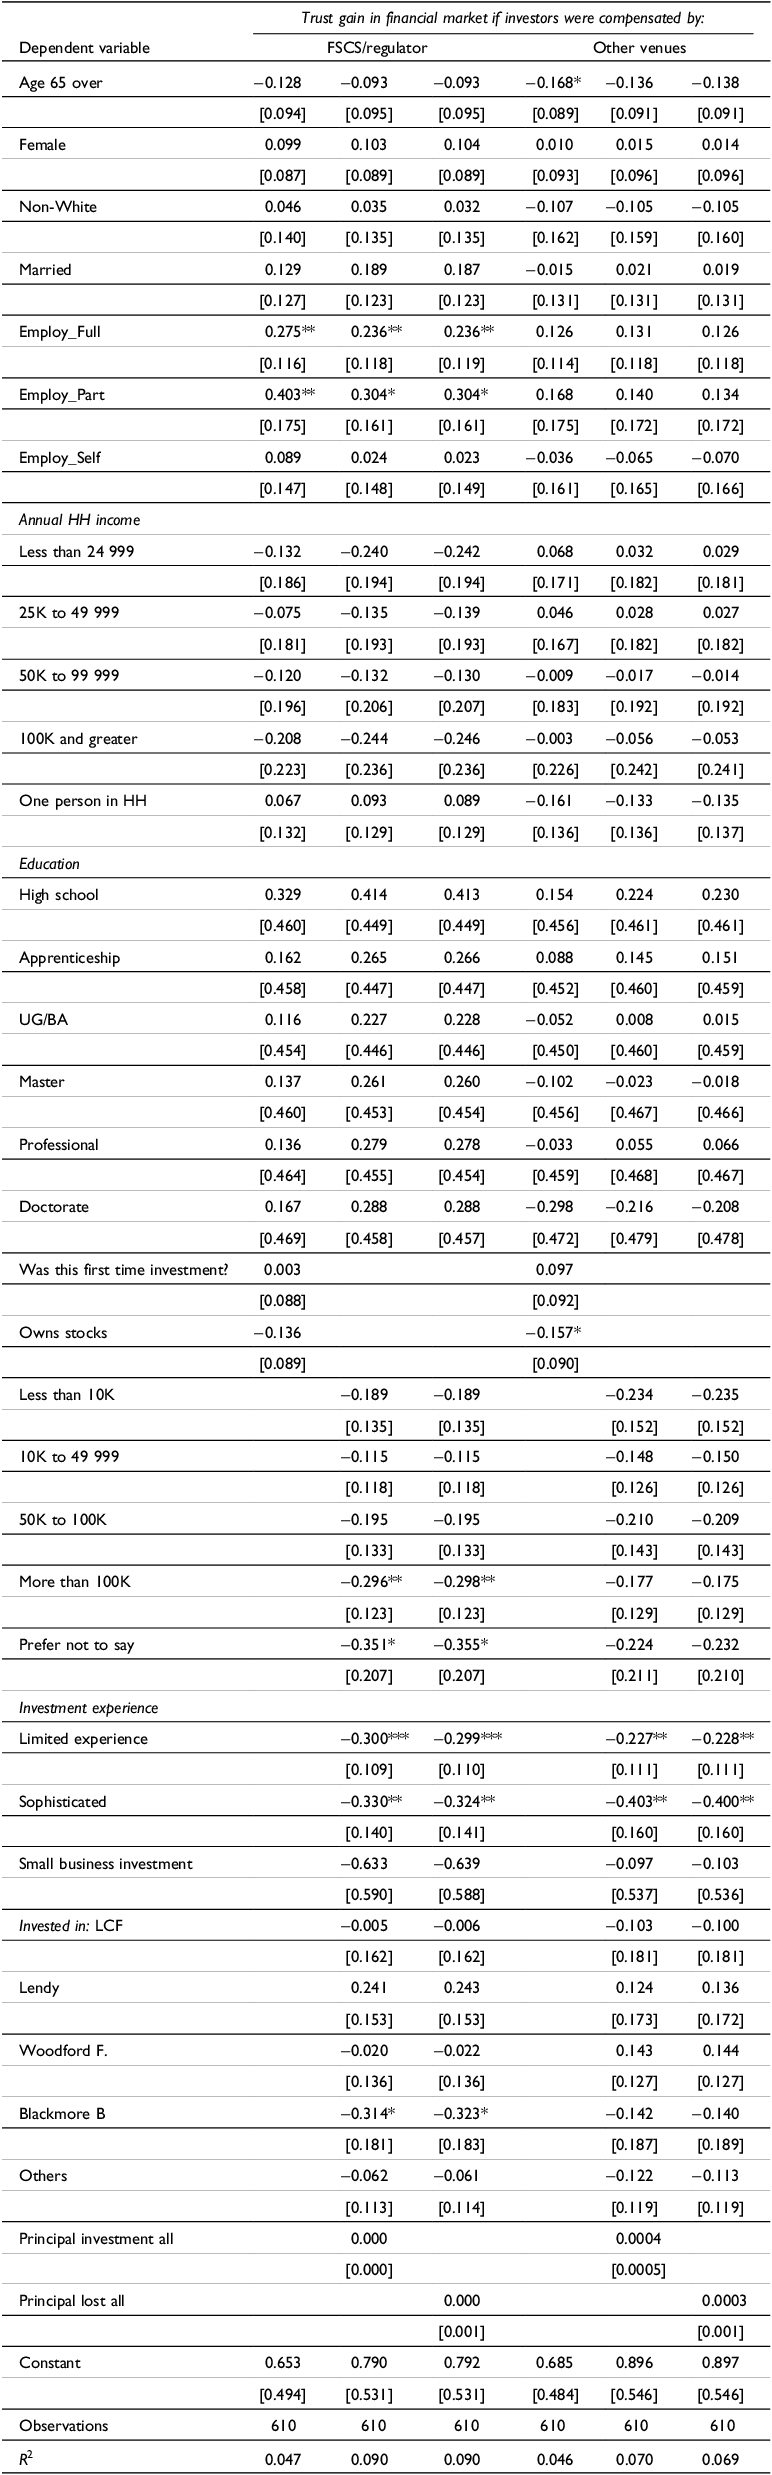
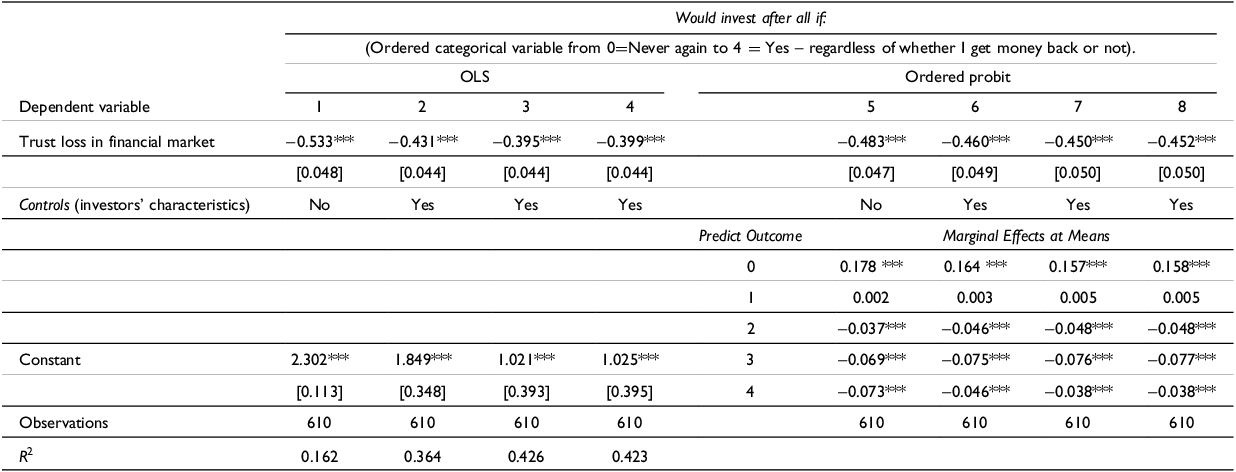
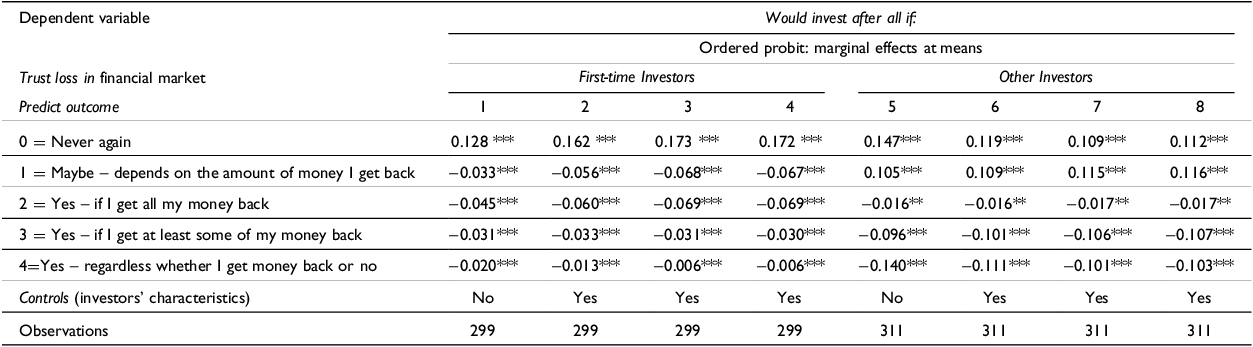
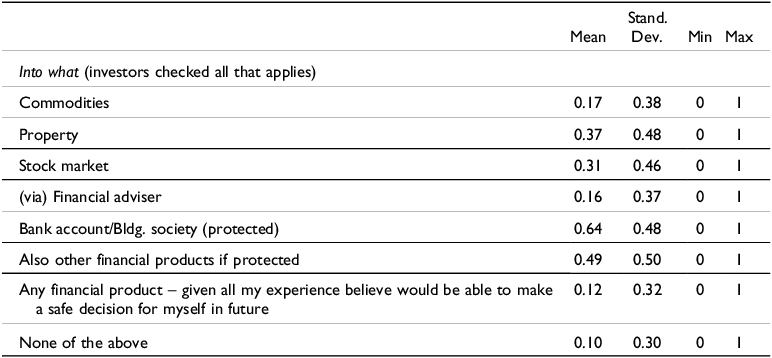


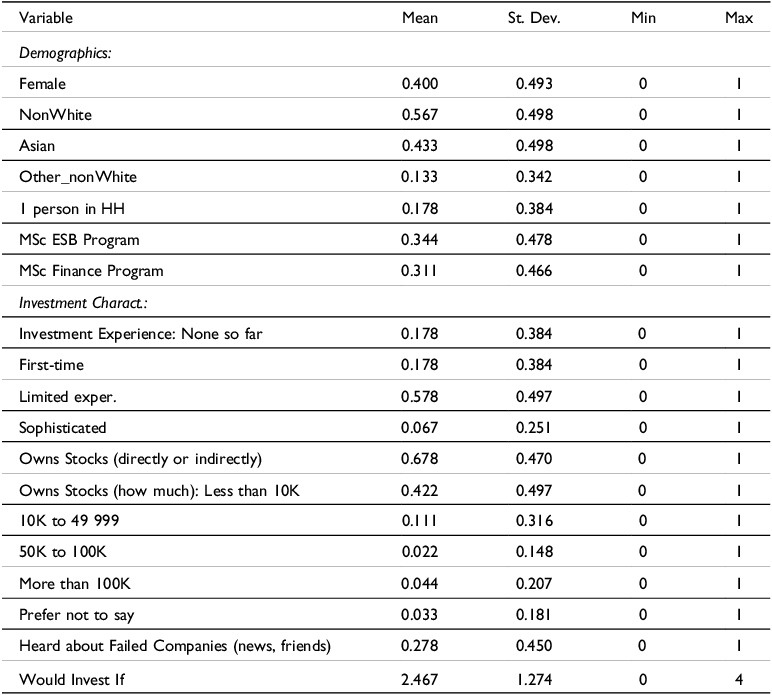
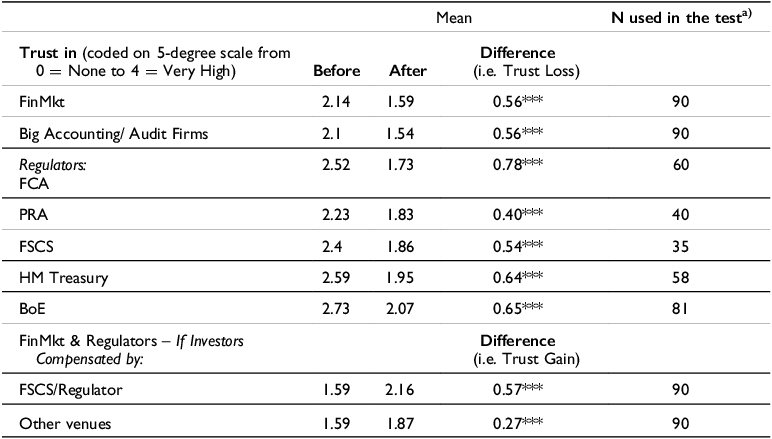
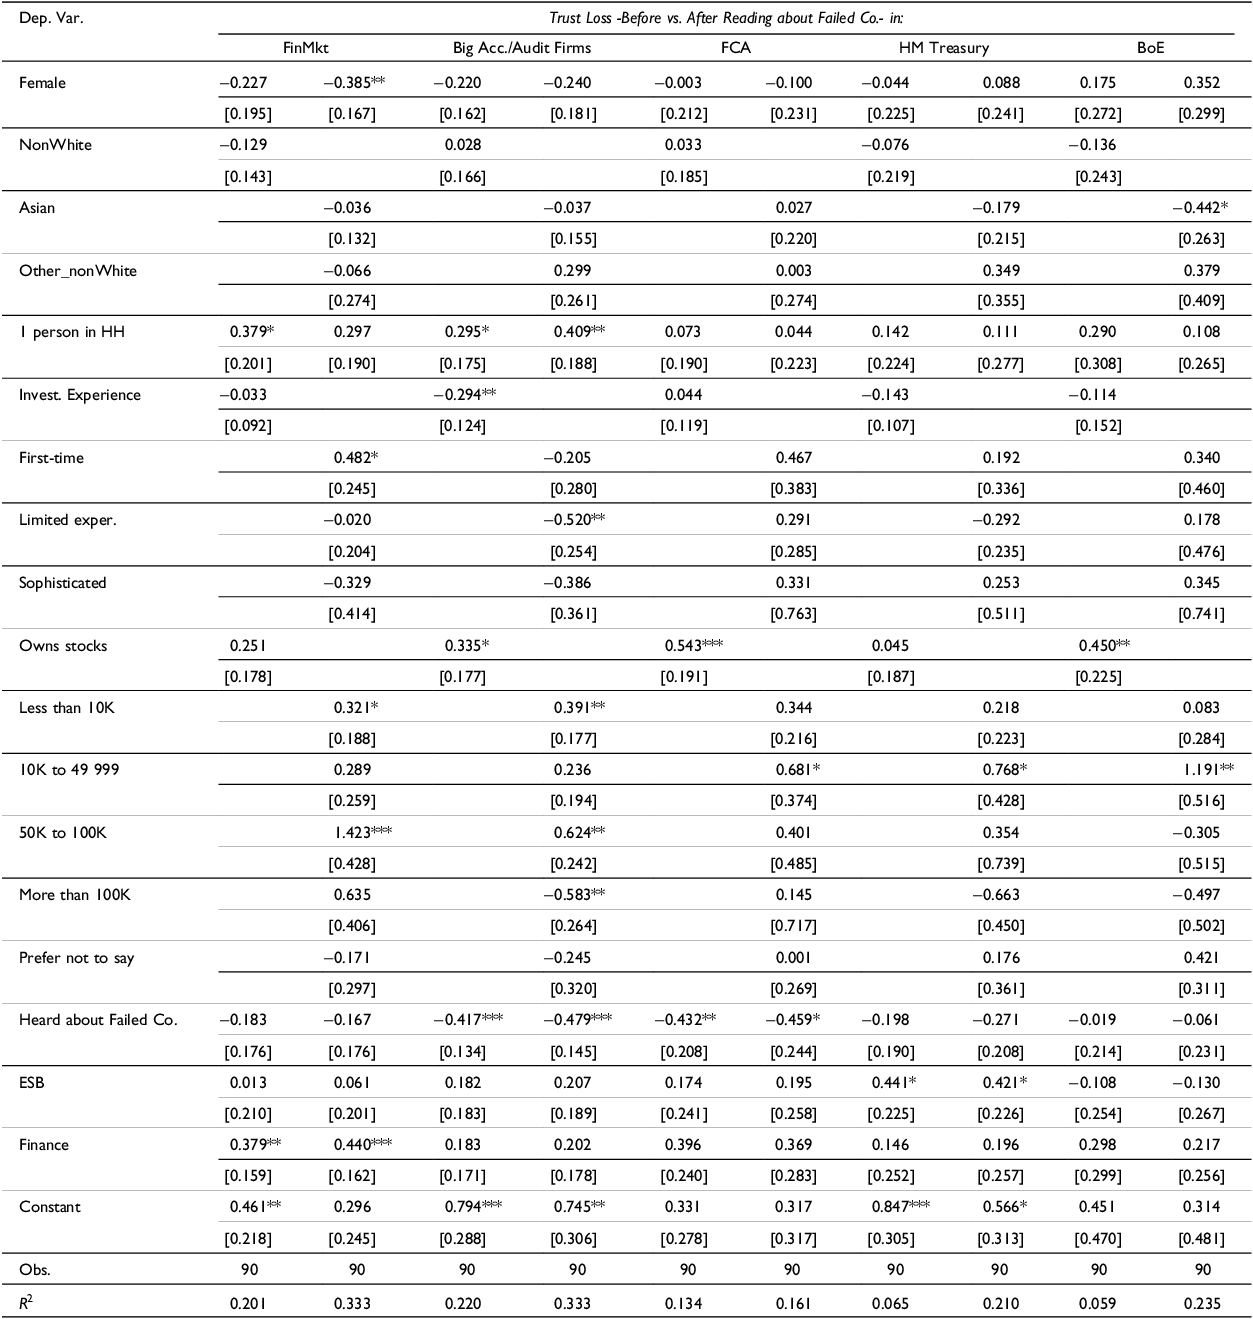
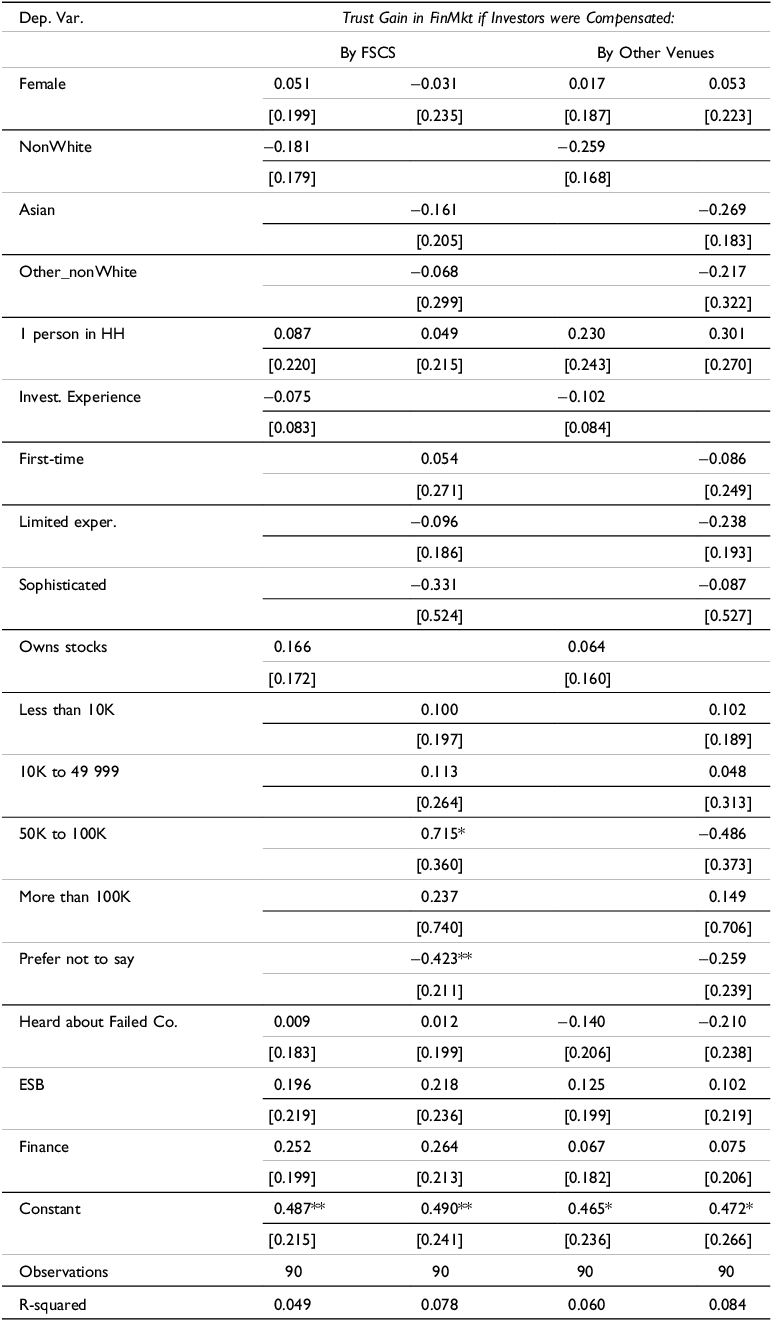
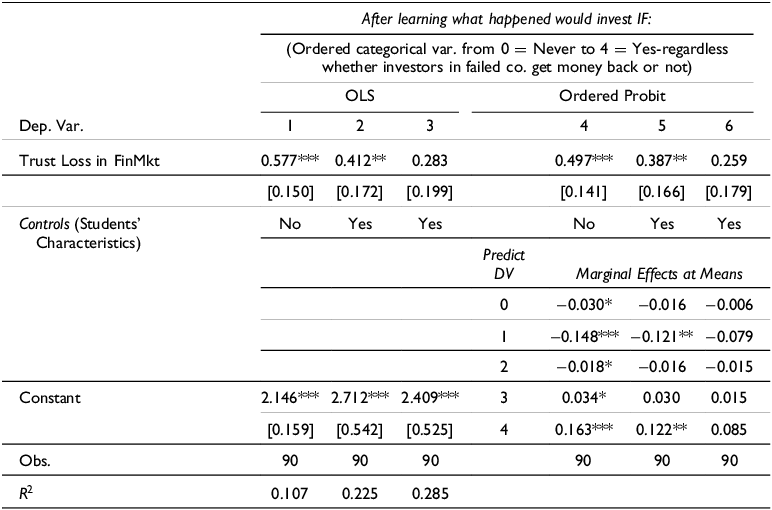
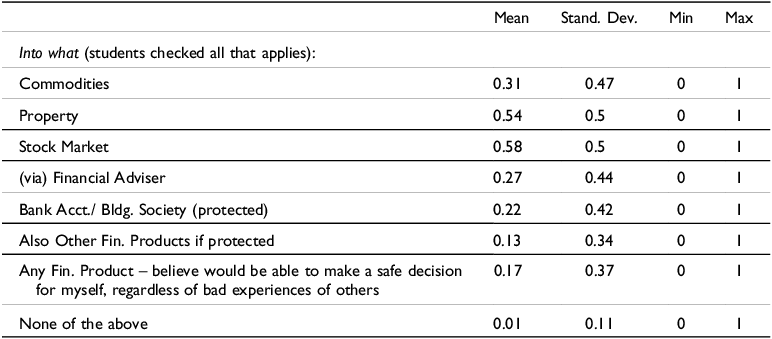


 Open access

