


1 Introduction
Rayleigh streaming generated by a plane standing wave between two infinite plates or inside a cylindrical tube is considered in the present paper. This acoustic wind is a mean flow generated by Reynolds stresses in the Stokes boundary layer formed along the solid walls of an acoustic guide (with no other mean flow and a no-slip boundary condition on the guide walls). It is usually referred to as Rayleigh streaming because Lord Rayleigh (Reference Rayleigh1884) was the first to develop an analytical solution that describes the steady vortices generated in the core of the fluid in a wide channel formed by two infinite parallel adiabatic plates. These vortices, also called outer cells, are the main object of the present study.
Rayleigh–Nyborg–Westervelt (RNW) classical approach. Consider a standing plane acoustic wave of wavelength
 $\unicode[STIX]{x1D706}$
and angular frequency
 $\unicode[STIX]{x1D714}$
propagating in a wide channel formed by two infinite parallel plates. Assuming that the viscous penetration depth is small compared to the channel width and that they are both small compared to the wavelength, Rayleigh (Reference Rayleigh1884) established the equations that govern the second-order velocity (responsible for the streaming motion), based on successive approximations. These second-order equations were obtained in the case of slow streaming motion (associated with low acoustic amplitudes) and therefore they are linear. The source terms that create the streaming motion are provided by the solution of the first-order problem (linear acoustics). In Rayleigh’s solution the first-order motion is assumed to be divergence free in the viscous boundary layer. The resulting reference solution for the second-order velocity, far away from the guide wall is
 $$\begin{eqnarray}\displaystyle & \displaystyle \bar{u}_{Rayleigh}=-\frac{3U_{ac}^{2}}{16c_{0}}\sin (2kx)\left[1-3\left(\frac{y}{R}\right)^{2}\right], & \displaystyle\end{eqnarray}$$
 $$\begin{eqnarray}\displaystyle & \displaystyle \bar{v}_{Rayleigh}=-\frac{3U_{ac}^{2}}{8c_{0}}kR\cos (2kx)\left[\frac{y}{R}-\left(\frac{y}{R}\right)^{3}\right], & \displaystyle\end{eqnarray}$$
with
 $\bar{u}_{Rayleigh}$
(respectively
 $\bar{v}_{Rayleigh}$
) the axial (respectively vertical) component of the streaming velocity i.e. the time average over an acoustic period of the velocity component,
 $U_{ac}$
the acoustic velocity amplitude at its antinode,
 $c_{0}$
the speed of sound,
 $R$
the channel half-width,
 $x$
the axial coordinate,
 $k$
the complex wavenumber and
 $y$
the distance from the guide axis. Rayleigh’s analysis was applied to the case of a large cylindrical guide by Schuster & Matz (Reference Schuster and Matz1940) yielding the following second-order velocity components:
 $$\begin{eqnarray}\displaystyle & \displaystyle \bar{u}_{Rayleigh}=-\frac{3U_{ac}^{2}}{8c_{0}}\sin (2kx)\left[1-2\left(\frac{y}{R}\right)^{2}\right], & \displaystyle\end{eqnarray}$$
 $$\begin{eqnarray}\displaystyle & \displaystyle \bar{v}_{Rayleigh}=-\frac{3U_{ac}^{2}}{8c_{0}}kR\cos (2kx)\left[\frac{y}{R}-\left(\frac{y}{R}\right)^{3}\right], & \displaystyle\end{eqnarray}$$
where here
 $R$
is the cylinder radius. In order to obtain these solutions, terms in
 $e^{-(R-y)/\unicode[STIX]{x1D6FF}_{\unicode[STIX]{x1D708}}}$
were neglected in the complete Rayleigh solution, with
 $\unicode[STIX]{x1D6FF}_{\unicode[STIX]{x1D708}}=\sqrt{2\unicode[STIX]{x1D708}/\unicode[STIX]{x1D714}}$
the acoustic viscous boundary layer thickness. Here
 $\unicode[STIX]{x1D708}$
is the gas kinematic viscosity, related to the gas dynamic viscosity
 $\unicode[STIX]{x1D707}$
by the classical relation
 $\unicode[STIX]{x1D708}=\unicode[STIX]{x1D707}/\unicode[STIX]{x1D70C}_{0}$
, where
 $\unicode[STIX]{x1D70C}_{0}$
is the reference gas density. This is valid far enough from the wall. These expressions show the main characteristics of Rayleigh streaming: velocities are of second order in powers of acoustic Mach number
 $M=U_{ac}/c_{0}$
, with counter-rotating vortices that span
 $\unicode[STIX]{x1D706}/4$
in the axial direction. The transverse streaming velocity is much smaller and has a
 $\unicode[STIX]{x1D706}/4$
spatial phase shift with the axial streaming velocity.
Later Westervelt (Reference Westervelt1953) and Nyborg (Reference Nyborg1953) improved this analytical model by proposing a complete solution to the problem considered by Rayleigh. This solution is based on a vorticity equation and there is no assumption on the divergence of the acoustic velocity. The theoretical description issued from the works of Rayleigh, Westervelt and Nyborg is usually associated with the so-called RNW streaming theory Lighthill (Reference Lighthill1978).
Sources of streaming. The analytical studies mentioned above (and most of the subsequent ones) are based on the same process of derivation of the streaming velocity: write fundamental laws of fluid motion, use a perturbation method with asymptotic expansions and then time average. As discussed by Lighthill (Reference Lighthill1978), this process leads to an equation of the form
 $$\begin{eqnarray}\displaystyle \unicode[STIX]{x1D707}\unicode[STIX]{x1D6FB}^{2}\bar{\boldsymbol{u}}=-\bar{\boldsymbol{F}}+\unicode[STIX]{x1D735}\bar{p}, & & \displaystyle\end{eqnarray}$$
where
 $\bar{p}$
is the second-order pressure and
 $\bar{\boldsymbol{F}}$
is a product of first-order quantities and their derivatives. The source terms composing
 $\bar{\boldsymbol{F}}$
are based on acoustic quantities. They are also referred to as Reynolds stresses.
In all studies mentioned above, the source terms that appear in the transverse momentum equation are neglected, as discussed by Lighthill (Reference Lighthill1978). The averaged acoustic velocity source term
 $\bar{\boldsymbol{F}}$
(Reynolds stresses) is approximated as the sum of the two largest source terms, that are associated with the axial momentum equation. The variation of these two source terms with the radius was analysed analytically in annular resonators, in the case of a pure travelling wave by Amari, Gusev & Joly (Reference Amari, Gusev and Joly2003). An investigation of the streaming flow generation through the analysis of the contribution of each source term was conducted recently by Paridaens, Kouidri & Jebali Jerbi (Reference Paridaens, Kouidri and Jebali Jerbi2013), in the case of a thermoacoustic system. Again, only the two dominant Reynolds stress terms were considered.
One of the goals of the present study is to show that one of the terms that compose
 $\bar{\boldsymbol{F}}$
and that is classically neglected in the analysis of Rayleigh streaming can be responsible for drastic change of acoustic streaming patterns within a given range of guide geometry. It will be shown that it can be the case even in the linear regime. A modified analytical expression for the streaming velocity is proposed, that takes into account the other two acoustic source terms associated with the transverse component of the momentum equation. This represents an improved approximation for the Rayleigh problem. This enriched solution exhibits an unexpected balance between outer Rayleigh streaming sources.
RNW theory. (II) sketch of inner and outer streaming cells in the case of two infinite parallel plates, showing lines (c) and (d). (I) axial acoustic velocity
 $u^{\prime }$
profile along line (c). (III) axial streaming velocity
 $\bar{u}$
profile along line (d). (IV) axial streaming velocity
 $\bar{u}$
profile along line (c).

Beyond RNW streaming. As stated above, RNW analysis concerns streaming in wide channels outside the viscous boundary layers that results in large counter-rotating vortices usually referred to as outer vortices. These vortices are actually generated by a driving mean flow taking place inside the viscous boundary layers, associated with slender counter-rotating vortices usually referred to as inner streaming vortices. A sketch of inner and outer streaming cells, as well as transverse and axial profiles of the axial streaming velocity are shown in figure 1, in the case of a
 $\unicode[STIX]{x1D706}/2$
resonator. Schlichting (Reference Schlichting1932) first described the inner streaming vortices, under the hypothesis of incompressible flow. Reviews of theoretical investigations for inner and outer streaming were proposed by Nyborg (Reference Nyborg and Mason1965) and Zarembo (Reference Zarembo and Rozenberg1971). As shown by figure 1, the limit between inner and outer streaming cells is generally considered to be equal to
 $3\unicode[STIX]{x1D6FF}_{\unicode[STIX]{x1D708}}$
from the wall. In the present study the evolution of this limit with the dimensions of the channel will be briefly addressed.
Rott (Reference Rott1974) improved the description of outer streaming by taking into account thermal effects and Qi (Reference Qi1993) included the fluid compressibility and temperature effects to improve the description of inner streaming. Investigations of streaming in channels of arbitrary width with a mean temperature gradient were performed by Waxler (Reference Waxler2001) and Bailliet et al. (Reference Bailliet, Gusev, Raspet and Hiller2001) in the context of thermoacoustic applications where heat transport associated with the streaming flow is an important mechanism that may limit the efficiency of the systems. Sugimoto (Reference Sugimoto2016) obtained a nonlinear thermoacoustic wave equation inside narrow channels and the associated streaming flow results can be applied to pore modelling in thermoacoustic engines.
Also in thermoacoustics the overall mass transport velocity is usually considered instead of the time-averaged velocity:
 $$\begin{eqnarray}\displaystyle \overline{\boldsymbol{u}}^{M}=\frac{\overline{\unicode[STIX]{x1D70C}\boldsymbol{u}}}{\bar{\unicode[STIX]{x1D70C}}}. & & \displaystyle\end{eqnarray}$$
Here the previously considered
 $\bar{\boldsymbol{u}}$
velocity is called Eulerian streaming velocity. Hamilton, Ilinskii & Zabolotskaya (Reference Hamilton, Ilinskii and Zabolotskaya2003a
), Olson & Swift (Reference Olson and Swift1997) adopted a Lagrangian approach, considering the density weighted average velocity
 $\overline{\boldsymbol{u}}^{M}$
, also referred to as the Favre average (Favre Reference Favre1965), because it is responsible for effective mass and heat transport. Hamilton et al. (Reference Hamilton, Ilinskii and Zabolotskaya2003a
), Hamilton, Ilinskii & Zabolotskaya (Reference Hamilton, Ilinskii and Zabolotskaya2003b
) proposed an analytical solution for the average mass transport velocity with or without temperature effects. They studied the influence of the channel width on the relative size of the inner and outer streaming vortices. Most of the present study is conducted following an Eulerian approach but the consequences of the results presented thereafter will also be briefly discussed following a Lagrangian approach.
Thermoacoustic applications which require large amplitude acoustic waves also led the authors to reconsider the hypothesis of slow streaming that is one of the bases of RNW streaming, as discussed in the extensive review proposed by Boluriaan & Morris (Reference Boluriaan and Morris2003). In the last decades experimental studies (Thompson, Atchley & Maccarone Reference Thompson, Atchley and Maccarone2004; Moreau, Bailliet & Valière Reference Moreau, Bailliet and Valière2008) and numerical studies (Menguy & Gilbert Reference Menguy and Gilbert2000a
; Daru et al.
Reference Daru, Baltean-Carlès, Weisman, Debesse and Gandikota2013; Reyt et al.
Reference Reyt, Daru, Bailliet, Moreau, Valière, Baltean-Carlès and Weisman2013) on acoustic streaming from slow to fast regimes were performed (the fast regime is associated with high amplitude acoustics). These studies exhibited streaming behaviour departing from the RNW theory: in the fast regime the dependence of the streaming velocity on the acoustic velocity is no longer parabolic and new streaming cells can emerge near the guide axis. In the slow regime, it was found that the axial streaming velocity along the axis, when normalized by Rayleigh’s solution, is a linear function of the ratio
 $\unicode[STIX]{x1D6FF}_{\unicode[STIX]{x1D708}}/R$
(Daru et al.
Reference Daru, Reyt, Bailliet, Weisman and Baltean-Carlès2017a
). Another goal of the present study is to quantify further this linear function, and also to show a dependency on the aspect ratio (length over width or length over radius) of the wave guide.
The hypotheses are listed in § 2, along with a description of the geometries under study. Section 3 then focuses on the rectangular case. The classical Rayleigh solution of the (first order) acoustic problem is described (§ 3.1) and the source terms for the streaming flow are deduced (§ 3.2). An analysis of the influence of each of the source terms is conducted and their effect on streaming flow patterns is highlighted (§§ 3.2.1–3.2.6). The effect of both Reynolds stress source terms, classically considered, is shown first, and then the effects of the third and fourth source terms, classically neglected, are also discussed.
The influence of the aspect ratio of the channel geometry on the streaming velocity is quantified. The results show that for specific values of the aspect ratio new streaming counter-rotating cells appear next to the guide axis. Then other characteristics of the streaming flow are examined in §§ 3.2.7–3.2.9: slip velocity, mass transport velocity, transverse component of streaming velocity. The axisymmetric case is briefly addressed in § 4.
2 Position of the problem
In the present approach, the discussed geometry is valid for both a cylindrical acoustic guide and acoustic flow between two infinite parallel plates. We consider a rectangular (or cylindrical) channel, of length
 $L$
, and half-width (or radius)
 $R$
, filled with a perfect gas of density
 $\unicode[STIX]{x1D70C}_{0}$
and pressure
 $p_{0}$
. The sound velocity in the ideal gas is
 $c_{0}=\sqrt{\unicode[STIX]{x1D6FE}p_{0}/\unicode[STIX]{x1D70C}_{0}}$
,
 $\unicode[STIX]{x1D6FE}$
being the specific heat ratio (
 $\unicode[STIX]{x1D6FE}=1.4$
for air). We use a coordinate system
 $(x,y)$
(or
 $(x,r)$
) with the origin located at the centre of the channel, that is
 $-L/2\leqslant x\leqslant L/2$
,
 $-R\leqslant y\leqslant R$
(or
 $0\leqslant r\leqslant R$
).
By exploiting the symmetry of the problem, only the upper half-channel
 $0\leqslant y\leqslant R$
is considered in the plane case. The symbolic computational software Mathematica (Wolfram 2018) is used to solve the equations throughout this study.
Throughout this work, the angular frequency is always considered to be equal to
 $\unicode[STIX]{x1D714}_{0}$
, the angular frequency corresponding to the acoustic standing wave resonating at its first mode along
 $x$
(so-called
 $\unicode[STIX]{x1D706}/2$
mode), in the case of a non-viscous gas (
 $\unicode[STIX]{x1D714}_{0}=\unicode[STIX]{x03C0}c_{0}/L$
).
It is assumed that an acoustic wave propagates laminarly along the
 $x$
axis of the guide. There is no mean flow apart from acoustic streaming. A main hypothesis is that the wave is plane. More precisely the condition that only plane modes propagate is that the working frequency is lower than the first mode cutoff frequency. In cylindrical guides the cutoff frequency is
 $f_{c(1,0)}=1.84c_{0}/2\unicode[STIX]{x03C0}R$
(e.g. Pierce Reference Pierce1989) and the condition of a plane wave is equivalent to
 $\unicode[STIX]{x1D706}>2\unicode[STIX]{x03C0}/1.84R$
. In the case of a half-wavelength guide, the plane wave condition becomes
 $L/R>1.7$
. For rectangular channels the cutoff frequency is
 $c_{0}/2R$
or equivalently
 $L/R>1$
.
Another important hypothesis is that the effect of viscosity is assumed to be concentrated in the near wall region, that is, volume viscosity is neglected because the real part of the wavenumber associated with volume viscosity is negligible compared to the one associated with the viscous boundary layer. This hypothesis is valid if
 $1/(ReSh)\ll 1$
, where
 $Re=\unicode[STIX]{x1D70C}_{0}c_{0}^{2}/(\unicode[STIX]{x1D707}\unicode[STIX]{x1D714})$
is the acoustic Reynolds number and
 $Sh=\unicode[STIX]{x1D6FF}_{\unicode[STIX]{x1D708}}/R$
is the Shear number (Menguy & Gilbert Reference Menguy and Gilbert2000b
).
We also make the assumption of an isentropic flow, in order to exclude thermal effects on streaming that are not within the scope of this work. Under these hypotheses, acoustic pressure is independent of
 $y$
, and, as a consequence of isentropy, so is acoustic density.
Finally, several hypotheses on streaming flow are imposed. Only channels with moderate to large width values (
 $R/\unicode[STIX]{x1D6FF}_{\unicode[STIX]{x1D708}}\gtrsim 6$
) are considered here in which outer streaming vortices do exist (Bailliet et al.
Reference Bailliet, Gusev, Raspet and Hiller2001; Hamilton et al.
Reference Hamilton, Ilinskii and Zabolotskaya2003a
). Another hypothesis is that
 $(R/L)^{2}\ll 1$
which means that momentum diffusion in the axial direction is negligible with respect to momentum diffusion in the transverse direction. Moreover the present study concerns the slow streaming regime, in which the streaming flow equations are linear. This hypothesis is valid if inertial effects are negligible, which is usually related to small values of the nonlinear Reynolds number
 $Re_{NL}=(M/Sh)^{2}\ll 1$
(Menguy & Gilbert Reference Menguy and Gilbert2000b
).
3 Flow between two parallel plates
3.1 Acoustics
Let us note
 $u^{\prime }$
and
 $v^{\prime }$
the axial and vertical components of the acoustic velocity, and
 $\unicode[STIX]{x1D70C}^{\prime }=\unicode[STIX]{x1D70C}-\unicode[STIX]{x1D70C}_{0}$
,
 $p^{\prime }=p-p_{0}$
the associated density and pressure fluctuations. Using the hypothesis
 $\unicode[STIX]{x2202}^{2}u^{\prime }/\unicode[STIX]{x2202}x^{2}\ll \unicode[STIX]{x2202}^{2}u^{\prime }/\unicode[STIX]{x2202}y^{2}$
, the linearized equations governing acoustics are
 $$\begin{eqnarray}\displaystyle & \displaystyle \frac{\unicode[STIX]{x2202}\unicode[STIX]{x1D70C}^{\prime }}{\unicode[STIX]{x2202}t}+\unicode[STIX]{x1D70C}_{0}\left(\frac{\unicode[STIX]{x2202}u^{\prime }}{\unicode[STIX]{x2202}x}+\frac{\unicode[STIX]{x2202}v^{\prime }}{\unicode[STIX]{x2202}y}\right)=0 & \displaystyle\end{eqnarray}$$
 $$\begin{eqnarray}\displaystyle & \displaystyle \unicode[STIX]{x1D70C}_{0}\frac{\unicode[STIX]{x2202}u^{\prime }}{\unicode[STIX]{x2202}t}+\frac{\unicode[STIX]{x2202}p^{\prime }}{\unicode[STIX]{x2202}x}=\unicode[STIX]{x1D707}\frac{\unicode[STIX]{x2202}^{2}u^{\prime }}{\unicode[STIX]{x2202}y^{2}} & \displaystyle\end{eqnarray}$$
 $$\begin{eqnarray}\displaystyle & \displaystyle \frac{\unicode[STIX]{x2202}p^{\prime }}{\unicode[STIX]{x2202}y}=0. & \displaystyle\end{eqnarray}$$
 $p^{\prime }=c_{0}^{2}\unicode[STIX]{x1D70C}^{\prime }$
.
The following change of variables is introduced
 $$\begin{eqnarray}\displaystyle {\hat{y}}=y/\unicode[STIX]{x1D6FF}_{\unicode[STIX]{x1D708}},\quad \hat{x}=x/L,\quad \hat{t}=t/T,\quad \hat{R}=R/\unicode[STIX]{x1D6FF}_{\unicode[STIX]{x1D708}},\quad \hat{L}=L/\unicode[STIX]{x1D6FF}_{\unicode[STIX]{x1D708}}, & & \displaystyle\end{eqnarray}$$
 $T$
being the acoustic time period so that
 $L/T=(1/2)c_{0}$
. The half-channel is then described by
 $-1/2\leqslant \hat{x}\leqslant 1/2$
,
 $0\leqslant {\hat{y}}\leqslant \hat{R}$
and the dependency on
 $\hat{x}$
is of
 $e^{i\unicode[STIX]{x03C0}\hat{x}}$
form. Let us note that this is only a convenient change of variables that allows us to work with non-dimensional parameters
 $\hat{R}$
and
 $\hat{L}$
instead of dimensional values of
 $R$
and
 $L$
. Velocity, pressure and density are left in dimensional units.
The boundary and symmetry conditions for
 $u^{\prime }$
and
 $v^{\prime }$
with respect to
 ${\hat{y}}$
are
 $$\begin{eqnarray}u^{\prime }=0\quad \text{at }{\hat{y}}=\hat{R};\quad \frac{\unicode[STIX]{x2202}u^{\prime }}{\unicode[STIX]{x2202}{\hat{y}}}=0\quad \text{at }{\hat{y}}=0,\end{eqnarray}$$
 $$\begin{eqnarray}v^{\prime }=0\quad \text{at }{\hat{y}}=0\text{ and }{\hat{y}}=\hat{R}.\end{eqnarray}$$
Following Rayleigh (Reference Rayleigh1884), the axial acoustic velocity is expressed as
 $$\begin{eqnarray}\displaystyle u^{\prime }(\hat{x},{\hat{y}},\hat{t}) & = & \displaystyle U_{ac}\cos (\unicode[STIX]{x03C0}\hat{x})[(-1+\text{e}^{{\hat{y}}-\hat{R}}\cos (\hat{R}-{\hat{y}}))\cos (2\unicode[STIX]{x03C0}\hat{t})\nonumber\\ \displaystyle & & \displaystyle +\,\text{e}^{{\hat{y}}-\hat{R}}\sin (\hat{R}-{\hat{y}})\sin (2\unicode[STIX]{x03C0}\hat{t})\!],\end{eqnarray}$$
where
 $U_{ac}$
is the acoustic amplitude at the velocity antinode.
Using the hypothesis that
 $\unicode[STIX]{x1D70C}^{\prime }$
depends on
 $\hat{x}$
and
 $\hat{t}$
only, together with the boundary conditions, equation (3.1a
) is integrated with respect to
 ${\hat{y}}$
to obtain the vertical acoustic velocity component
 $$\begin{eqnarray}\displaystyle v^{\prime }(\hat{x},{\hat{y}},\hat{t}) & = & \displaystyle -\frac{\unicode[STIX]{x03C0}U_{ac}}{2\hat{R}}\frac{1}{\hat{L}}\sin (\unicode[STIX]{x03C0}\hat{x})[\!{\hat{y}}(\cos (2\unicode[STIX]{x03C0}\hat{t})+\sin (2\unicode[STIX]{x03C0}\hat{t}))+\hat{R}\text{e}^{{\hat{y}}-\hat{R}} (\!\sin (\hat{R}-{\hat{y}}-2\unicode[STIX]{x03C0}\hat{t})\nonumber\\ \displaystyle & & \displaystyle -\,\cos (\hat{R}-{\hat{y}}-2\unicode[STIX]{x03C0}\hat{t})\!)+\text{e}^{-\hat{R}}(\hat{R}-{\hat{y}})(\cos (\hat{R}-2\unicode[STIX]{x03C0}\hat{t})-\sin (\hat{R}-2\unicode[STIX]{x03C0}\hat{t}))\!].\qquad\end{eqnarray}$$
Finally the density fluctuation
 $\unicode[STIX]{x1D70C}^{\prime }$
is obtained by integrating (3.1a
) with respect to time
 $$\begin{eqnarray}\displaystyle \unicode[STIX]{x1D70C}^{\prime }(\hat{x},\hat{t}) & = & \displaystyle \frac{\unicode[STIX]{x1D70C}_{0}U_{ac}}{2c_{0}\hat{R}}\sin (\unicode[STIX]{x03C0}\hat{x})[(1-2\hat{R})\sin (2\unicode[STIX]{x03C0}\hat{t})-\cos (2\unicode[STIX]{x03C0}\hat{t})\nonumber\\ \displaystyle & & \displaystyle +\,\text{e}^{-\hat{R}}(\cos (\hat{R}-2\unicode[STIX]{x03C0}\hat{t})+\sin (\hat{R}-2\unicode[STIX]{x03C0}\hat{t}))\!].\end{eqnarray}$$
3.2 Streaming flow
The averaged equations are derived from the Navier–Stokes equations with each variable
 $f$
divided into a fluctuating, periodic, component
 $f^{\prime }$
, and a steady component
 $\overline{f}$
(corresponding to the streaming flow) according to
 $$\begin{eqnarray}\displaystyle f=\overline{f}+f^{\prime }. & & \displaystyle\end{eqnarray}$$
where the overline denotes the average operator in time over one period. For any two variables
 $f$
and
 $g$
 $$\begin{eqnarray}\displaystyle \overline{fg}=\overline{f}\overline{g}+\overline{f^{\prime }g^{\prime }}. & & \displaystyle\end{eqnarray}$$
Using the hypotheses that
 $\unicode[STIX]{x2202}^{2}/\unicode[STIX]{x2202}x^{2}\ll \unicode[STIX]{x2202}^{2}/\unicode[STIX]{x2202}y^{2}$
and
 $Re_{NL}=(M/Sh)^{2}\ll 1$
, the Navier–Stokes equations are averaged in time over one period, linearized and simplified as
 $$\begin{eqnarray}\displaystyle \left\{\begin{array}{@{}l@{}}\displaystyle \unicode[STIX]{x1D70C}_{0}\left(\frac{\unicode[STIX]{x2202}\overline{u}}{\unicode[STIX]{x2202}x}+\frac{\unicode[STIX]{x2202}\overline{v}}{\unicode[STIX]{x2202}y}\right)=-\frac{\unicode[STIX]{x2202}}{\unicode[STIX]{x2202}x}(\overline{\unicode[STIX]{x1D70C}^{\prime }u^{\prime }})-\frac{\unicode[STIX]{x2202}}{\unicode[STIX]{x2202}y}(\overline{\unicode[STIX]{x1D70C}^{\prime }v^{\prime }})\\ \displaystyle \unicode[STIX]{x1D707}\frac{\unicode[STIX]{x2202}^{2}\overline{u}}{\unicode[STIX]{x2202}y^{2}}=\frac{\unicode[STIX]{x2202}\overline{p}}{\unicode[STIX]{x2202}x}+\unicode[STIX]{x1D70C}_{0}\frac{\unicode[STIX]{x2202}}{\unicode[STIX]{x2202}x}(\overline{u^{\prime }u^{\prime }})+\unicode[STIX]{x1D70C}_{0}\frac{\unicode[STIX]{x2202}}{\unicode[STIX]{x2202}y}(\overline{u^{\prime }v^{\prime }})\\ \displaystyle \unicode[STIX]{x1D707}\frac{\unicode[STIX]{x2202}^{2}\overline{v}}{\unicode[STIX]{x2202}y^{2}}=\frac{\unicode[STIX]{x2202}\overline{p}}{\unicode[STIX]{x2202}y}+\unicode[STIX]{x1D70C}_{0}\frac{\unicode[STIX]{x2202}}{\unicode[STIX]{x2202}x}(\overline{u^{\prime }v^{\prime }})+\unicode[STIX]{x1D70C}_{0}\frac{\unicode[STIX]{x2202}}{\unicode[STIX]{x2202}y}(\overline{v^{\prime }v^{\prime }}).\end{array}\right. & & \displaystyle\end{eqnarray}$$
where
 $\overline{u}$
,
 $\overline{v}$
and
 $\overline{p}$
are the averaged velocity components and pressure.
Making the same change of variables as in § 3.1, equations (3.9) above are rewritten as
 $$\begin{eqnarray}\displaystyle \left\{\begin{array}{@{}l@{}}\displaystyle \unicode[STIX]{x1D70C}_{0}\left(\frac{\unicode[STIX]{x2202}\overline{u}}{\unicode[STIX]{x2202}\hat{x}}+\hat{L}\frac{\unicode[STIX]{x2202}\overline{v}}{\unicode[STIX]{x2202}{\hat{y}}}\right)=-\frac{\unicode[STIX]{x2202}}{\unicode[STIX]{x2202}\hat{x}}(\overline{\unicode[STIX]{x1D70C}^{\prime }u^{\prime }})-\hat{L}\frac{\unicode[STIX]{x2202}}{\unicode[STIX]{x2202}{\hat{y}}}(\overline{\unicode[STIX]{x1D70C}^{\prime }v^{\prime }})\\ \displaystyle \unicode[STIX]{x1D70C}_{0}\frac{\unicode[STIX]{x03C0}}{2}c_{0}\frac{\unicode[STIX]{x2202}^{2}\overline{u}}{\unicode[STIX]{x2202}{\hat{y}}^{2}}=\frac{\unicode[STIX]{x2202}\overline{p}}{\unicode[STIX]{x2202}\hat{x}}+\unicode[STIX]{x1D70C}_{0}\frac{\unicode[STIX]{x2202}}{\unicode[STIX]{x2202}\hat{x}}(\overline{u^{\prime }u^{\prime }})+\unicode[STIX]{x1D70C}_{0}\hat{L}\frac{\unicode[STIX]{x2202}}{\unicode[STIX]{x2202}{\hat{y}}}(\overline{u^{\prime }v^{\prime }}).\\ \displaystyle \unicode[STIX]{x1D70C}_{0}\frac{\unicode[STIX]{x03C0}}{2}c_{0}\frac{\unicode[STIX]{x2202}^{2}\overline{v}}{\unicode[STIX]{x2202}{\hat{y}}^{2}}=\hat{L}\frac{\unicode[STIX]{x2202}\overline{p}}{\unicode[STIX]{x2202}{\hat{y}}}+\unicode[STIX]{x1D70C}_{0}\frac{\unicode[STIX]{x2202}}{\unicode[STIX]{x2202}\hat{x}}(\overline{u^{\prime }v^{\prime }})+\unicode[STIX]{x1D70C}_{0}\hat{L}\frac{\unicode[STIX]{x2202}}{\unicode[STIX]{x2202}{\hat{y}}}(\overline{v^{\prime }v^{\prime }}).\end{array}\right. & & \displaystyle\end{eqnarray}$$
The boundary conditions for
 $\overline{u}$
and
 $\overline{v}$
are
 $$\begin{eqnarray}\displaystyle \overline{u}=0\quad \text{at }{\hat{y}}=\hat{R};\quad \frac{\unicode[STIX]{x2202}\overline{u}}{\unicode[STIX]{x2202}{\hat{y}}}=0\quad \text{at }{\hat{y}}=0,\end{eqnarray}$$
 $$\begin{eqnarray}\overline{v}=0\quad \text{at }{\hat{y}}=0\text{ and }{\hat{y}}=\hat{R},\end{eqnarray}$$
 $$\begin{eqnarray}\int _{0}^{\hat{R}}\overline{u}\,\text{d}{\hat{y}}=0.\end{eqnarray}$$
The third condition in (3.11) is obtained by integrating the continuity equation in (3.10) over the half-width of the channel.
The expression of the five averaged products (Reynolds stresses) on the right-hand side of (3.10) are obtained from (3.4), (3.5) and (3.6):
 $$\begin{eqnarray}\displaystyle \overline{\unicode[STIX]{x1D70C}^{\prime }u^{\prime }} & = & \displaystyle \frac{\unicode[STIX]{x1D70C}_{0}U_{ac}^{2}}{8c_{0}\hat{R}}\sin (2\unicode[STIX]{x03C0}\hat{x})\{1-\text{e}^{{\hat{y}}-\hat{R}}(\cos (\hat{R}-{\hat{y}})+(2\hat{R}-1)\sin (\hat{R}-{\hat{y}}))\nonumber\\ \displaystyle & & \displaystyle +\,\text{e}^{{\hat{y}}-2\hat{R}}(\cos {\hat{y}}+\sin ({\hat{y}}))-\text{e}^{-\hat{R}}(\cos (\hat{R})+\sin (\hat{R}))\},\end{eqnarray}$$
 $$\begin{eqnarray}\displaystyle \overline{\unicode[STIX]{x1D70C}^{\prime }v^{\prime }} & = & \displaystyle \frac{\unicode[STIX]{x03C0}\unicode[STIX]{x1D70C}_{0}U_{ac}^{2}}{4c_{0}\hat{R}}\frac{1}{\hat{L}}\sin ^{2}(\unicode[STIX]{x03C0}\hat{x})\{{\hat{y}}+\text{e}^{{\hat{y}}-\hat{R}}(-\hat{R}\cos (\hat{R}-{\hat{y}})+\sin (\hat{R}-{\hat{y}})(1-\hat{R}))\nonumber\\ \displaystyle & & \displaystyle +\,\text{e}^{{\hat{y}}-2\hat{R}}\sin {\hat{y}}+\text{e}^{-\hat{R}}((\hat{R}-{\hat{y}})\cos \hat{R}+(\hat{R}-{\hat{y}}-1)\sin \hat{R})\},\end{eqnarray}$$
 $$\begin{eqnarray}\displaystyle \overline{u^{\prime }u^{\prime }}={\textstyle \frac{1}{2}}U_{ac}^{2}\cos ^{2}(\unicode[STIX]{x03C0}\hat{x})(1+\text{e}^{2({\hat{y}}-\hat{R})}-2\text{e}^{{\hat{y}}-\hat{R}}\cos (\hat{R}-{\hat{y}})), & & \displaystyle\end{eqnarray}$$
 $$\begin{eqnarray}\displaystyle \overline{u^{\prime }v^{\prime }} & = & \displaystyle \frac{\unicode[STIX]{x03C0}U_{ac}^{2}}{8\hat{R}\hat{L}}\sin (2\unicode[STIX]{x03C0}\hat{x})\{\!{\hat{y}}+\text{e}^{{\hat{y}}-\hat{R}}(-(\hat{R}+{\hat{y}})\cos (\hat{R}-{\hat{y}})+(\hat{R}-{\hat{y}})\sin (\hat{R}-{\hat{y}}))\nonumber\\ \displaystyle & & \displaystyle +\,\hat{R}\text{e}^{2({\hat{y}}-\hat{R})}+\text{e}^{{\hat{y}}-2\hat{R}}(({\hat{y}}-\hat{R})\cos {\hat{y}}+(\hat{R}-{\hat{y}})\sin {\hat{y}})\nonumber\\ \displaystyle & & \displaystyle +\,\text{e}^{-\hat{R}}((\hat{R}-{\hat{y}})\cos \hat{R}-(\hat{R}-{\hat{y}})\sin \hat{R})\!\},\end{eqnarray}$$
 $$\begin{eqnarray}\displaystyle \overline{v^{\prime }v^{\prime }} & = & \displaystyle \frac{\unicode[STIX]{x03C0}U_{ac}^{2}}{\hat{L}^{2}}\frac{1}{4\hat{R}^{2}}\sin ^{2}(\unicode[STIX]{x03C0}\hat{x})\{\!{\hat{y}}^{2}-2\text{e}^{{\hat{y}}-\hat{R}}{\hat{y}}\hat{R}\cos (\hat{R}-{\hat{y}})+\text{e}^{2({\hat{y}}-\hat{R})}\hat{R}^{2}\nonumber\\ \displaystyle & & \displaystyle +\,2\hat{R}\text{e}^{{\hat{y}}-2\hat{R}}({\hat{y}}-\hat{R})\cos {\hat{y}}+2\text{e}^{-\hat{R}}{\hat{y}}({\hat{y}}+\hat{R})\cos \hat{R}+\text{e}^{-2\hat{R}}(\hat{R}-{\hat{y}})^{2}\!\}.\end{eqnarray}$$
Under the hypothesis
 $\hat{R}\gtrsim 6$
, terms of the same magnitude as
 $\text{e}^{-\hat{R}}$
or smaller can be neglected in the previous expressions of the averaged products. Nevertheless, all symbolic calculations were performed using the full expressions.
Following Westervelt (Reference Westervelt1953), we take the curl of the momentum equations, which eliminates pressure, and use the assumption
 $\unicode[STIX]{x2202}\overline{v}/L\unicode[STIX]{x2202}\hat{x}\ll \unicode[STIX]{x2202}\overline{u}/\unicode[STIX]{x1D6FF}_{\unicode[STIX]{x1D708}}\unicode[STIX]{x2202}{\hat{y}}$
, to obtain
 $$\begin{eqnarray}\displaystyle -\frac{\unicode[STIX]{x03C0}}{2}c_{0}\hat{L}\frac{\unicode[STIX]{x2202}^{3}\overline{u}}{\unicode[STIX]{x2202}{\hat{y}}^{3}}=-\hat{L}\frac{\unicode[STIX]{x2202}^{2}(\overline{u^{\prime }u^{\prime }})}{\unicode[STIX]{x2202}\hat{x}\unicode[STIX]{x2202}{\hat{y}}}-\hat{L}^{2}\frac{\unicode[STIX]{x2202}^{2}(\overline{u^{\prime }v^{\prime }})}{\unicode[STIX]{x2202}{\hat{y}}^{2}}+\frac{\unicode[STIX]{x2202}^{2}(\overline{u^{\prime }v^{\prime }})}{\unicode[STIX]{x2202}\hat{x}^{2}}+\hat{L}\frac{\unicode[STIX]{x2202}^{2}(\overline{v^{\prime }v^{\prime }})}{\unicode[STIX]{x2202}\hat{x}\unicode[STIX]{x2202}{\hat{y}}}. & & \displaystyle\end{eqnarray}$$
Classical studies (e.g. Rayleigh Reference Rayleigh1884, Westervelt Reference Westervelt1953, Bailliet et al.
Reference Bailliet, Gusev, Raspet and Hiller2001, Hamilton et al.
Reference Hamilton, Ilinskii and Zabolotskaya2003a
) always consider an added approximation in which the last two source terms on the right-hand side of (3.17) are negligible. Neglecting these two terms was justified by an analysis of the orders of magnitude, based on the variations in the viscous boundary layer. The usual assumptions are
 $\unicode[STIX]{x2202}/\unicode[STIX]{x2202}x\propto 1/\unicode[STIX]{x1D706}\propto 1/L$
and
 $\unicode[STIX]{x2202}/\unicode[STIX]{x2202}y\propto 1/\unicode[STIX]{x1D6FF}_{\unicode[STIX]{x1D708}}$
so that
 $\unicode[STIX]{x2202}/\unicode[STIX]{x2202}\hat{x}\propto 1$
and
 $\unicode[STIX]{x2202}/\unicode[STIX]{x2202}{\hat{y}}\propto 1$
. Therefore equations (3.14), (3.15), (3.16) yield
 $$\begin{eqnarray}\displaystyle \hat{L}\frac{\unicode[STIX]{x2202}^{2}(\overline{u^{\prime }u^{\prime }})}{\unicode[STIX]{x2202}\hat{x}\unicode[STIX]{x2202}{\hat{y}}}\propto \hat{L}U_{ac}^{2},\quad \hat{L}^{2}\frac{\unicode[STIX]{x2202}^{2}(\overline{u^{\prime }v^{\prime }})}{\unicode[STIX]{x2202}{\hat{y}}^{2}}\propto \hat{L}U_{ac}^{2},\quad \frac{\unicode[STIX]{x2202}^{2}(\overline{u^{\prime }v^{\prime }})}{\unicode[STIX]{x2202}\hat{x}^{2}}\propto \frac{U_{ac}^{2}}{\hat{L}},\quad \hat{L}\frac{\unicode[STIX]{x2202}^{2}(\overline{v^{\prime }v^{\prime }})}{\unicode[STIX]{x2202}\hat{x}\unicode[STIX]{x2202}{\hat{y}}}\propto \frac{U_{ac}^{2}}{\hat{L}}. & & \displaystyle \nonumber\\ \displaystyle & & \displaystyle\end{eqnarray}$$
It follows that the third and fourth terms are respectively
 $1/\hat{L}^{2}$
smaller than the first two terms.
In his analysis, Lighthill (Reference Lighthill1978) states that making a decision to keep or neglect a term should be based on an order of magnitude analysis and not a perturbation expansion alone. In the present work it will be shown that even an order of magnitude analysis on the acoustic source terms is not sufficient to neglect a term. This is because the different terms in (3.17) do not have the same
 ${\hat{y}}$
dependence; some are proportional to
 ${\hat{y}}$
, others to
 ${\hat{y}}^{2}$
and others do not have any
 ${\hat{y}}$
dependence so that the successive integrations over
 ${\hat{y}}$
needed to obtain
 $\bar{u}$
from (3.17) together with the boundary conditions will change the balance between the effects of these different source terms. Even though they do not have the same order of magnitude, the source terms can have effects of the same order on the streaming velocity. Therefore, they will all be considered. (The change in balance between the source terms can take place independently of the fact that
 $\unicode[STIX]{x2202}\bar{v}/L\unicode[STIX]{x2202}\hat{x}\ll \unicode[STIX]{x2202}\bar{u}/\unicode[STIX]{x1D6FF}_{\unicode[STIX]{x1D708}}\unicode[STIX]{x2202}{\hat{y}}$
, which is given by the fundamental equations for streaming (3.9). Thus the process of keeping all the terms on the right-hand side of (3.17) is consistent with neglecting the
 $\bar{v}$
term on its left-hand side.)
In order to analyse in detail the effect of each of the source terms, we will consider separately the four problems linked to each source term. We will normalize the solutions with Rayleigh’s solution on the axis
 $\overline{u}_{R}=-(3/16)U_{ac}^{2}/c_{0}\sin (2\unicode[STIX]{x03C0}\hat{x})$
. The solution of problem
 $i$
, associated with the
 $i$
th source term, will be denoted by
 $\overline{u}_{i}$
,
 $i=1,2,3,4$
. In the following, for the sake of simplicity, the expressions for each solution
 $\overline{u}_{i}$
will be presented in an approximated form, in which terms of the same magnitude as
 $\text{e}^{-\hat{R}}$
or smaller will be neglected with respect to terms of order
 $1/\hat{R}^{n}$
, for
 $n\in \mathbb{N}$
. However the symbolic computations are still performed using the full expressions.
3.2.1 Problem 1: first source term
When reducing equation (3.17) by taking into account the first source term only, the equation to be solved is
 $$\begin{eqnarray}\displaystyle \frac{\unicode[STIX]{x03C0}}{2}c_{0}\frac{\unicode[STIX]{x2202}^{3}\overline{u}_{1}}{\unicode[STIX]{x2202}{\hat{y}}^{3}}=\frac{\unicode[STIX]{x2202}^{2}(\overline{u^{\prime }u^{\prime }})}{\unicode[STIX]{x2202}\hat{x}\unicode[STIX]{x2202}{\hat{y}}}, & & \displaystyle\end{eqnarray}$$
with boundary conditions (3.11a,b
)–(3.11d
), for
 $\overline{u}_{1}$
. Integrating equation (3.19) and using the boundary conditions yields the following simplified solution:
 $$\begin{eqnarray}\displaystyle \overline{u}_{1}(\hat{x},{\hat{y}}) & = & \displaystyle -\frac{U_{ac}^{2}}{16c_{0}}\sin (2\unicode[STIX]{x03C0}\hat{x})\left\{15\frac{{\hat{y}}^{2}}{\hat{R}^{3}}-\frac{15}{\hat{R}}-6\frac{{\hat{y}}^{2}}{\hat{R}^{2}}\right.\nonumber\\ \displaystyle & & \displaystyle +\left.2(1+2\text{e}^{2({\hat{y}}-\hat{R})}+8\text{e}^{{\hat{y}}-\hat{R}}\sin (\hat{R}-{\hat{y}}))\right\}.\end{eqnarray}$$
Along the axis, by normalizing with Rayleigh’s solution and neglecting smaller terms, we obtain at
 $O(1/\hat{R})$
:
 $$\begin{eqnarray}\displaystyle \frac{\overline{u}_{1}(\hat{x},0)}{\overline{u}_{R}}=\frac{2}{3}-\frac{5}{\hat{R}}. & & \displaystyle\end{eqnarray}$$
The second-order pressure gradient can also be obtained, and as expected is independent of
 ${\hat{y}}$
. It is given by
 $$\begin{eqnarray}\displaystyle \frac{\text{d}\overline{p}_{1}}{\text{d}\hat{x}}=\frac{\unicode[STIX]{x1D70C}_{0}\unicode[STIX]{x03C0}U_{ac}^{2}}{16}\sin (2\unicode[STIX]{x03C0}\hat{x})\left(8+\frac{6}{\hat{R}^{2}}-\frac{15}{\hat{R}^{3}}\right). & & \displaystyle\end{eqnarray}$$
3.2.2 Problem 2: second source term
The equation to be solved for the acoustic streaming issued from the second source term in equation (3.17) is
 $$\begin{eqnarray}\displaystyle \frac{\unicode[STIX]{x03C0}}{2}c_{0}\frac{\unicode[STIX]{x2202}^{3}\overline{u}_{2}}{\unicode[STIX]{x2202}{\hat{y}}^{3}}=\hat{L}\frac{\unicode[STIX]{x2202}^{2}(\overline{u^{\prime }v^{\prime }})}{\unicode[STIX]{x2202}{\hat{y}}^{2}}, & & \displaystyle\end{eqnarray}$$
with boundary conditions (3.11a,b
)–(3.11d
) for
 $\overline{u}_{2}$
. Integrating (3.23) gives the following simplified expression for
 $\overline{u}_{2}$
 $$\begin{eqnarray}\displaystyle \overline{u}_{2}(\hat{x},{\hat{y}}) & = & \displaystyle -\frac{U_{ac}^{2}}{32c_{0}}\sin (2\unicode[STIX]{x03C0}\hat{x})\left\{\frac{1}{\hat{R}}+3\frac{{\hat{y}}^{2}}{\hat{R}^{3}}(1-2\hat{R})+2(1-2\text{e}^{2({\hat{y}}-\hat{R})})\right.\nonumber\\ \displaystyle & & \displaystyle +\left.\frac{4}{\hat{R}}\text{e}^{{\hat{y}}-\hat{R}}[(-1+2{\hat{y}})\cos (\hat{R}-{\hat{y}})+(1-2\hat{R})\sin (\hat{R}-{\hat{y}})]\right\}.\end{eqnarray}$$
Along the axis, we obtain at the order
 $O(1/\hat{R})$
:
 $$\begin{eqnarray}\displaystyle \frac{\overline{u}_{2}(\hat{x},0)}{\overline{u}_{R}}=\frac{1}{3}+\frac{1}{6\hat{R}}, & & \displaystyle\end{eqnarray}$$
and the corresponding pressure gradient is
 $$\begin{eqnarray}\displaystyle \frac{\text{d}\overline{p}_{2}}{\text{d}\hat{x}}=-\frac{\unicode[STIX]{x1D70C}_{0}\unicode[STIX]{x03C0}U_{ac}^{2}}{32}\sin (2\unicode[STIX]{x03C0}\hat{x})\left(\frac{4}{\hat{R}}-\frac{6}{\hat{R}^{2}}+\frac{3}{\hat{R}^{3}}\right). & & \displaystyle\end{eqnarray}$$
3.2.3 Analysis of the effect of the first two source terms
It is interesting to analyse the right-hand side of the axial component of the momentum equation in (3.10). For the first problem, the right-hand side is
 $\text{RHS}_{1}=\unicode[STIX]{x2202}\overline{p}_{1}/\unicode[STIX]{x2202}\hat{x}+\unicode[STIX]{x1D70C}_{0}(\unicode[STIX]{x2202}/\unicode[STIX]{x2202}\hat{x})(\overline{u^{\prime }u^{\prime }})$
. For the second problem, the right hand side is
 $\text{RHS}_{2}=\unicode[STIX]{x2202}\overline{p}_{2}/\unicode[STIX]{x2202}\hat{x}+\unicode[STIX]{x1D70C}_{0}\hat{L}(\unicode[STIX]{x2202}/\unicode[STIX]{x2202}{\hat{y}})(\overline{u^{\prime }v^{\prime }})$
.
The right-hand sides are therefore composed of two terms, a pressure gradient term and a Reynolds stress term. Figure 2 shows, for
 $\hat{R}=20$
, at
 $\hat{x}=-1/4$
, the transverse profile of both terms composing
 $\text{RHS}_{1}$
figures 2(a) and
 $\text{RHS}_{2}$
2(b), normalized by
 $\unicode[STIX]{x1D70C}_{0}U_{ac}^{2}$
. Comparing figure 2(a,b) shows that the terms in
 $\text{RHS}_{2}$
are much smaller than in
 $\text{RHS}_{1}$
, and also that the pressure gradient and Reynolds stress terms almost compensate each other in the core of the guide, for both problems 1 and 2. The pressure gradients of problems 1 and 2 have opposite signs, and also
 $\text{d}\overline{p}_{2}/\text{d}\hat{x}$
is much smaller than
 $\text{d}\overline{p}_{1}/\text{d}\hat{x}$
, with
 $\text{d}\overline{p}_{2}/\text{d}\hat{x}\rightarrow 0$
when
 $\hat{R}$
becomes large (refer to equations (3.22) and (3.26)).
Figure 2(c) shows the transverse profile of the complete right-hand sides
 $\text{RHS}_{1}$
and
 $\text{RHS}_{2}$
, normalized by
 $\unicode[STIX]{x1D70C}_{0}U_{ac}^{2}$
, again for
 $\hat{R}=20$
, at
 $\hat{x}=-1/4$
. This figure shows that the two complete right-hand sides are of the same order, with significant values only near the wall. This stresses the fact that streaming is generated only by viscous boundary layer effects. The outer streaming is created from momentum diffusion of the velocity created near the guide wall, and not from pressure gradient effects. As stated by Menguy & Gilbert (Reference Menguy and Gilbert2000a
) (p. 253): pressure is created directly by the acoustic wave, and not by the mean flow. Outer streaming flow can thus be considered as a driven flow, similar to a Couette flow (see the driven cavity analogy developed in Daru et al. (Reference Daru, Weisman, Baltean-Carlès, Reyt and Bailliet2017b
)).
The resulting normalized axial streaming velocity transverse profiles are plotted on figure 2(d). The following observation can be made: the first problem is responsible for the inner streaming (Schlichting streaming), while the second problem only contributes to the outer streaming (Rayleigh streaming), as also noticed in Paridaens et al. (Reference Paridaens, Kouidri and Jebali Jerbi2013). This is related to the fact that
 $\text{RHS}_{2}$
vanishes for
 ${\hat{y}}=\hat{R}$
, while
 $\text{RHS}_{1}$
does not, as can be seen in figure 2(c).
Variation with
 ${\hat{y}}$
, for
 $\hat{x}=-1/4$
and
 $\hat{R}=20$
of (a) Reynolds stresses term (red solid line) and normalized pressure gradient term (red dashed line) in
 $\text{RHS}_{1}$
, (b) Reynolds stresses term (blue solid line) and normalized pressure gradient term (blue dashed line) in
 $\text{RHS}_{2}$
, (c) total normalized
 $\text{RHS}_{1}$
(red solid line) and
 $\text{RHS}_{2}$
(blue dashed line), (d) normalized axial streaming velocity
 $\overline{u}_{1}/\overline{u}_{R}$
(red solid line) and
 $\overline{u}_{2}/\overline{u}_{R}$
(blue dashed line).

Let us now consider the superposition of problems
 $1$
and
 $2$
considered above, which is usually assumed in the literature to give the total axial streaming velocity
 $\overline{u}_{1+2}=\overline{u}_{1}+\overline{u}_{2}$
. Figure 3 shows the normalized axial streaming velocity transverse profiles
 $\overline{u}_{1}$
,
 $\overline{u}_{2}$
and
 $\overline{u}_{1+2}$
. This figure also illustrates that the first problem is responsible for the inner streaming, while the second problem only contributes to the outer streaming: only
 $\overline{u}_{1}$
takes a positive value near the wall, while
 $\overline{u}_{2}$
remains negative.
The expression for
 $\overline{u}_{1+2}$
obtained on the axis is approximated as:
 $$\begin{eqnarray}\displaystyle \frac{\overline{u}_{1+2}(\hat{x},0)}{\overline{u}_{R}}=1-\frac{29}{6}\frac{1}{\hat{R}}. & & \displaystyle\end{eqnarray}$$
For large guides (
 $\hat{R}\gg 1$
, but still
 $(\hat{R}/\hat{L})^{2}\ll 1$
), we thus recover Rayleigh’s solution. As noticed by Lighthill (Reference Lighthill1978) and as shown by equations (3.21) and (3.25), the contributions of the first and second source terms in Rayleigh’s solution are respectively
 $2/3$
and
 $1/3$
. Equation (3.27) also shows a linear variation with
 $1/\hat{R}$
, which is not negligible for moderate values of
 $\hat{R}$
. The first source term is the main contributor to this dependency:
 $-5$
in (3.21) versus
 $1/6$
in (3.25).
Axial streaming velocities
 $\overline{u}_{1}(-1/4,{\hat{y}})/\overline{u}_{R}$
(red solid line),
 $\overline{u}_{2}(-1/4,{\hat{y}})/\overline{u}_{R}$
(blue dashed line) and
 $\overline{u}_{1+2}(-1/4,{\hat{y}})/\overline{u}_{R}$
(black dot-dashed line).
 $\hat{R}=50$
.

The total axial pressure gradient is
 $$\begin{eqnarray}\displaystyle \frac{\text{d}\overline{p}_{1+2}}{\text{d}\hat{x}}=\frac{\unicode[STIX]{x1D70C}_{0}\unicode[STIX]{x03C0}U_{ac}^{2}}{2}\sin (2\unicode[STIX]{x03C0}\hat{x})\left(1-\frac{1}{8\hat{R}}+\frac{3}{16\hat{R}^{2}}-\frac{27}{32\hat{R}^{3}}\right). & & \displaystyle\end{eqnarray}$$
It follows that, for large values of
 $\hat{R}$
 $$\begin{eqnarray}\displaystyle \frac{\text{d}\overline{p}_{1+2}}{\text{d}\hat{x}}\simeq \frac{\text{d}\overline{p}_{1}}{\text{d}\hat{x}}=\frac{\unicode[STIX]{x1D70C}_{0}\unicode[STIX]{x03C0}U_{ac}^{2}}{2}\sin (2\unicode[STIX]{x03C0}\hat{x}). & & \displaystyle\end{eqnarray}$$
Integrating equation (3.29) with respect to
 $\hat{x}$
yields
 $$\begin{eqnarray}\displaystyle \overline{p}_{1+2}\simeq \overline{p}_{1}=p_{0}-\frac{\unicode[STIX]{x1D70C}_{0}U_{ac}^{2}}{4}\cos (2\unicode[STIX]{x03C0}\hat{x}). & & \displaystyle\end{eqnarray}$$
When scaling
 $\overline{p}_{1+2}-p_{0}$
by
 $(\unicode[STIX]{x1D6FE}/4)p_{0}(U_{ac}/c_{0})^{2}$
, we recover the theoretical result for the dimensionless hydrodynamic streaming pressure known in the literature
 $P_{2s}=-\text{cos}(2\unicode[STIX]{x03C0}\hat{x})$
(e.g. Menguy & Gilbert Reference Menguy and Gilbert2000a
).
3.2.4 Problem 3: third source term
We now consider the third source term, yielding the following equation
 $$\begin{eqnarray}\displaystyle \frac{\unicode[STIX]{x03C0}}{2}c_{0}\hat{L}\frac{\unicode[STIX]{x2202}^{3}\overline{u}_{3}}{\unicode[STIX]{x2202}{\hat{y}}^{3}}=-\frac{\unicode[STIX]{x2202}^{2}(\overline{u^{\prime }v^{\prime }})}{\unicode[STIX]{x2202}\hat{x}^{2}}, & & \displaystyle\end{eqnarray}$$
with boundary conditions (3.11a,b
)–(3.11d
) for
 $\overline{u}_{3}$
. Integrating (3.31) gives the simplified solution
 $$\begin{eqnarray}\displaystyle \overline{u}_{3}(\hat{x},{\hat{y}}) & = & \displaystyle \frac{\unicode[STIX]{x03C0}^{2}U_{ac}^{2}}{480c_{0}}\frac{1}{\hat{L}^{2}}\sin (2\unicode[STIX]{x03C0}\hat{x})\left\{4\hat{R}^{3}+150-\frac{585}{\hat{R}}+\frac{720}{\hat{R}^{2}}\right.\nonumber\\ \displaystyle & & \displaystyle -\,3{\hat{y}}^{2}\left(\frac{240}{\hat{R}^{4}}-\frac{315}{\hat{R}^{3}}+\frac{150}{\hat{R}^{2}}+8\hat{R}\right)+60\text{e}^{2({\hat{y}}-\hat{R})}+20\frac{{\hat{y}}^{4}}{\hat{R}}\nonumber\\ \displaystyle & & \displaystyle +\left.20\text{e}^{{\hat{y}}-\hat{R}}\left(\left(12-\frac{18}{\hat{R}}\right)\cos (\hat{R}-{\hat{y}})-\frac{18}{\hat{R}}\sin (\hat{R}-{\hat{y}})+12\frac{{\hat{y}}}{\hat{R}}\sin (\hat{R}-{\hat{y}})\right)\right\}.\nonumber\\ \displaystyle & & \displaystyle\end{eqnarray}$$
Along the axis we obtain, neglecting terms of order
 $O(\text{e}^{-\hat{R}})$
and smaller
 $$\begin{eqnarray}\displaystyle \frac{\overline{u}_{3}(\hat{x},0)}{\overline{u}_{R}}=-\frac{2\unicode[STIX]{x03C0}^{2}}{45}\left(\frac{\hat{R}}{\hat{L}}\right)^{2}\left[\hat{R}+\frac{75}{2}-\frac{585}{4\hat{R}}+\frac{180}{\hat{R}^{2}}\right]. & & \displaystyle\end{eqnarray}$$
Since the term in brackets is always positive, velocity
 $\overline{u}_{3}$
is of the opposite sign to Rayleigh’s solution. Thus the associated vortices are reversed.
Note that in this equation the dominant term
 $\hat{R}(\hat{R}/\hat{L})^{2}$
could increase significantly for large values of
 $\hat{R}$
. However, our working hypotheses are that the linear regime of streaming is respected, that is
 $Re_{NL}=(M\hat{R})^{2}\ll 1$
, and also that
 $(\hat{R}/\hat{L})^{2}\ll 1$
. These relations imply that the product
 $\hat{R}(\hat{R}/\hat{L})^{2}$
and consequently the velocity component
 $\bar{u}_{3}$
will both remain bounded for large values of
 $\hat{R}$
.
The second-order pressure gradient in the
 $x$
direction can be calculated from
 $$\begin{eqnarray}\displaystyle \frac{\unicode[STIX]{x2202}\overline{p}_{3}}{\unicode[STIX]{x2202}\hat{x}}=\unicode[STIX]{x1D70C}_{0}\frac{\unicode[STIX]{x03C0}}{2}c_{0}\frac{\unicode[STIX]{x2202}^{2}\overline{u}_{3}}{\unicode[STIX]{x2202}{\hat{y}}^{2}}, & & \displaystyle\end{eqnarray}$$
yielding
 $$\begin{eqnarray}\displaystyle \frac{\unicode[STIX]{x2202}\overline{p}_{3}}{\unicode[STIX]{x2202}\hat{x}} & = & \displaystyle -\frac{\unicode[STIX]{x1D70C}_{0}\unicode[STIX]{x03C0}^{3}U_{ac}^{2}}{2\hat{L}^{2}}\sin (2\unicode[STIX]{x03C0}\hat{x})\left\{\frac{3}{\hat{R}^{4}}-\frac{63}{16\hat{R}^{3}}+\frac{15}{8\hat{R}^{2}}+\frac{\hat{R}}{10}-\frac{{\hat{y}}^{2}}{2\hat{R}}-\frac{1}{20}\text{e}^{2({\hat{y}}-\hat{R})}\right.\nonumber\\ \displaystyle & & \displaystyle +\left.\frac{1}{2}\text{e}^{{\hat{y}}-\hat{R}}\left(\frac{-1+2{\hat{y}}}{\hat{R}}\cos (\hat{R}-{\hat{y}})+\left(\frac{1}{\hat{R}}-2\right)\sin (\hat{R}-{\hat{y}})\right)\right\}.\end{eqnarray}$$
For this source term the axial pressure gradient (which is very small) does depend on
 ${\hat{y}}$
.
3.2.5 Problem 4: fourth source term
Considering the fourth source term yields
 $$\begin{eqnarray}\displaystyle \frac{\unicode[STIX]{x03C0}}{2}c_{0}\hat{L}\frac{\unicode[STIX]{x2202}^{3}\overline{u_{4}}}{\unicode[STIX]{x2202}{\hat{y}}^{3}}=-\hat{L}\frac{\unicode[STIX]{x2202}^{2}(\overline{v^{\prime }v^{\prime }})}{\unicode[STIX]{x2202}\hat{x}\unicode[STIX]{x2202}{\hat{y}}}, & & \displaystyle\end{eqnarray}$$
with boundary conditions (3.11a,b
)–(3.11d
) for
 $\overline{u}_{4}$
. Integrating equation (3.36) and using the boundary conditions, the following simplified solution is found:
 $$\begin{eqnarray}\displaystyle \overline{u}_{4}(\hat{x},{\hat{y}})=\frac{\unicode[STIX]{x03C0}^{2}U_{ac}^{2}}{120c_{0}}\sin (2\unicode[STIX]{x03C0}\hat{x})\left(\frac{\hat{R}}{\hat{L}}\right)^{2}\left[1-6\left(\frac{{\hat{y}}}{\hat{R}}\right)^{2}+5\left(\frac{{\hat{y}}}{\hat{R}}\right)^{4}\right]. & & \displaystyle\end{eqnarray}$$
Along the axis we obtain the following expression for the normalized axial streaming velocity
 $$\begin{eqnarray}\displaystyle \frac{\overline{u}_{4}(\hat{x},0)}{\overline{u}_{R}}=\frac{2\unicode[STIX]{x03C0}^{2}}{45}\left(\frac{\hat{R}}{\hat{L}}\right)^{2}. & & \displaystyle\end{eqnarray}$$
Comparing equations (3.38) and (3.33) shows that
 $\overline{u}_{4}(\hat{x},0)/\overline{u}_{R}$
is equal to
 $-1/\hat{R}$
times the first term of
 $\overline{u}_{3}(\hat{x},0)/\overline{u}_{R}$
. The contribution of the fourth source term is thus negligible for large enough guides.
3.2.6 Superposition of solutions
Gathering together the four components
 $\overline{u}_{1}$
,
 $\overline{u}_{2}$
,
 $\overline{u}_{3}$
and
 $\overline{u}_{4}$
, and neglecting the lower-order terms, the total streaming velocity along the axis is given by
 $$\begin{eqnarray}\displaystyle \frac{\overline{u}(\hat{x},0)}{\overline{u}_{R}}=\frac{\mathop{\sum }_{i=1}^{4}\overline{u}_{i}(\hat{x},0)}{\overline{u}_{R}}=1-\frac{29}{6}\frac{1}{\hat{R}}-\frac{2\unicode[STIX]{x03C0}^{2}}{45}\frac{\hat{R}^{3}}{\hat{L}^{2}}\left[1+\frac{73}{2\hat{R}}-\frac{585}{4\hat{R}^{2}}+\frac{180}{\hat{R}^{3}}\right]. & & \displaystyle\end{eqnarray}$$
This expression shows that, under certain circumstances, the streaming flow can be reversed on the axis (
 $\overline{u}(\hat{x},0)/\overline{u}_{R}<0$
). This occurs when
 $$\begin{eqnarray}\displaystyle \hat{L}<\hat{L}_{limit}=\unicode[STIX]{x03C0}\sqrt{\frac{2}{45}}\left(\frac{\hat{R}^{3}\left(1+\displaystyle \frac{73}{2\hat{R}}-\displaystyle \frac{585}{4\hat{R}^{2}}+\displaystyle \frac{180}{\hat{R}^{3}}\right)}{1-\displaystyle \frac{29}{6}\frac{1}{\hat{R}}}\right)^{1/2}. & & \displaystyle\end{eqnarray}$$
Figure 4 shows the variation with
 $\hat{R}$
of the limit value
 $\hat{L}_{limit}/\hat{R}$
. For geometries that fall under the curve, there exists a reversed flow on the axis. Minimum values are
 $\hat{R}=13.52,\hat{L}/\hat{R}=L/R=5.24$
. These values are compatible with the hypothesis
 $(\hat{R}/\hat{L})^{2}\ll 1$
. For example, for
 $\hat{R}=100$
, reversed outer streaming velocity occurs if
 $\hat{L}<789$
, or
 $L/R<7.89$
.
In order to characterize the possible applications, let us consider a practical case of reverse flow along the guide axis. Let
 $\hat{L}$
and
 $\hat{R}$
be fixed. For resonance conditions,
 $\unicode[STIX]{x1D706}=2L$
and
 $\unicode[STIX]{x1D714}=\unicode[STIX]{x03C0}c_{0}/L$
. Using
 $\unicode[STIX]{x1D6FF}_{\unicode[STIX]{x1D708}}^{2}=2\unicode[STIX]{x1D708}/\unicode[STIX]{x1D714}$
and
 $\hat{L}=L/\unicode[STIX]{x1D6FF}_{\unicode[STIX]{x1D708}}$
, the following equations are obtained
 $$\begin{eqnarray}\displaystyle L=\frac{2\unicode[STIX]{x1D708}}{\unicode[STIX]{x03C0}c_{0}}\hat{L}^{2},\quad R=L\frac{\hat{R}}{\hat{L}}. & & \displaystyle\end{eqnarray}$$
Let
 $\hat{L}=789$
and
 $\hat{R}=100$
, as previously. Taking standard values corresponding to air,
 $\unicode[STIX]{x1D708}=1.496\times 10^{-5}~\text{m}^{2}~\text{s}^{-1}$
and
 $c_{0}=343.82~\text{m}~\text{s}^{-1}$
, we obtain
 $L=17.2~\text{mm}$
,
 $R=2.15~\text{mm}$
and the resonance frequency
 $f=10~\text{kHz}$
. These dimensions are small and could concern microfluidics systems, where Rayleigh streaming is used, for example within the field of acoustic particle trapping and manipulation or efficient fluid mixing. It is interesting to remark that some experiments in microfluidics have shown Rayleigh streaming vortices rotating in the opposite direction to that expected. Our results could give an explanation to this phenomenon that is a subject of debate (Wiklund, Green & Ohlin Reference Wiklund, Green and Ohlin2012).
Limit value
 $\hat{L}_{limit}(\hat{R})/\hat{R}$
under which the flow is reversed on the axis. Minimum values:
 $\hat{R}=13.52,\hat{L}_{limit}/\hat{R}=5.24$
.

Axial streaming velocities
 $\overline{u}_{1}(\hat{x},{\hat{y}})/\overline{u}_{R}$
(red solid line),
 $\overline{u}_{2}(\hat{x},{\hat{y}})/\overline{u}_{R}$
(blue dashed line),
 $\overline{u}_{3}(\hat{x},{\hat{y}})/\overline{u}_{R}$
(green dotdashed line) and
 $\overline{u}_{4}(\hat{x},{\hat{y}})/\overline{u}_{R}$
(purple dotted line).
 $\hat{R}=50$
,
 $\hat{L}=500$
. (a)
 ${\hat{y}}=0$
; (b)
 $\hat{x}=-1/4$
.

Figure 5 shows the four components
 $\overline{u}_{1}/\overline{u}_{R}$
,
 $\overline{u}_{2}/\overline{u}_{R}$
,
 $\overline{u}_{3}/\overline{u}_{R}$
and
 $\overline{u}_{4}/\overline{u}_{R}$
along the axis (a) and along
 ${\hat{y}}$
for
 $\hat{x}=-1/4$
(b). Here we have
 $\hat{R}=50$
and
 $\hat{L}=500$
. We notice that the fourth contribution is negligible, and that the third contribution is of the same order of magnitude as the second one. Figure 6 shows the total axial velocity
 $\overline{u}$
profile for
 $\hat{R}=100$
and two values of
 $\hat{L}$
:
 $\hat{L}=600$
and
 $\hat{L}=8000$
. The difference between the two profiles is important in the core of the guide, whereas in the very near wall region, both profiles are very close.
Total normalized axial streaming velocity transverse profile
 $u(-1/4,{\hat{y}})/\overline{u}_{R}$
for
 $\hat{R}=100$
and
 $\hat{L}=600$
(solid line),
 $\hat{L}=8000$
(dashed line).

This feature was also observed (even though the acoustic regime and the geometric configuration were different) in experiments as well as numerical simulations, that revealed situations where the outer streaming flow was greatly modified (up to occurrence of reverse flow), while the inner streaming flow was nearly unmodified (Reyt et al. Reference Reyt, Daru, Bailliet, Moreau, Valière, Baltean-Carlès and Weisman2013; Reyt, Bailliet & Valière Reference Reyt, Bailliet and Valière2014).
At this stage we have shown that the usually neglected third source term of outer streaming is responsible for drastic change of behaviour of acoustic streaming for certain
 $(\hat{L},\hat{R})$
conditions. The ratio
 $R/\unicode[STIX]{x1D6FF}_{\unicode[STIX]{x1D708}}$
is usually considered as the criterion to differentiate between different streaming regimes, from narrow guides with only inner cells to large guides with mostly outer cells. The present study implies that not only
 $R/\unicode[STIX]{x1D6FF}_{\unicode[STIX]{x1D708}}$
but also
 $R/L$
ratios should be considered in order to examine the organization of the streaming flow.
In the following sections we consider the impact of this finding on other characteristics of streaming flow: slip velocity, mass transport velocity, vertical component of streaming velocity.
3.2.7 Slip velocity
The viscous boundary layer vortex thickness (inner streaming) was estimated to be approximatively equal to
 $1.9\unicode[STIX]{x1D6FF}_{\unicode[STIX]{x1D708}}$
by Schlichting (Reference Schlichting1932), who did not consider streaming outside the boundary layer. As shown by experiments (Moreau et al.
Reference Moreau, Bailliet and Valière2008), the limit for large guides between inner and outer streaming cells is
 $3\unicode[STIX]{x1D6FF}_{\unicode[STIX]{x1D708}}$
from the wall, as illustrated in figure 1. At
 $3\unicode[STIX]{x1D6FF}_{\unicode[STIX]{x1D708}}$
from the guide wall, the axial streaming velocity was indeed found to reach its maximum. The flow in the core of the guide is initiated by transverse diffusion of momentum from there. This position is the limit between inner and outer streaming cells and the value of the axial streaming velocity at non-dimensional
 ${\hat{y}}={\hat{y}}^{l}=\hat{R}-3$
is thus generally considered as a slip velocity when inner streaming is not described. Rayleigh’s solution for the slip velocity is given by
 $\overline{u}_{R}^{SV}=(3/8)U_{ac}^{2}/c_{0}\sin (2\unicode[STIX]{x03C0}\hat{x})$
.
The actual non-dimensional transverse location
 ${\hat{y}}^{SV}$
of the maximum of the axial streaming velocity can however deviate from this standard value, depending on values of
 $\hat{R}$
and
 $\hat{L}$
. Figure 7 shows the difference (or offset)
 ${\hat{y}}^{SV}-{\hat{y}}^{l}$
between the actual and standard location of the slip velocity as a function of
 $\hat{R}$
(for
 $6<\hat{R}<200$
), for two values of
 $\hat{L}$
. For the largest value of
 $\hat{L}$
, we note that the actual location shifts slightly away from the wall as
 $\hat{R}$
increases (it is placed at the standard value for
 $\hat{R}=28$
). This is in agreement with previous results showing the evolution of the axial streaming velocity transverse profile with the ratio
 $R/\unicode[STIX]{x1D6FF}_{\unicode[STIX]{x1D708}}$
(e.g. figure 4 of Bailliet et al. (Reference Bailliet, Gusev, Raspet and Hiller2001) and figure 4 of Hamilton et al. (Reference Hamilton, Ilinskii and Zabolotskaya2003a
)).
For the smallest value of
 $\hat{L}$
, the actual location of the slip velocity shifts closer to the wall as
 $\hat{R}$
increases. This can be related to the fact that the
 $\overline{u}_{3}$
contribution becomes large (see figure 5).
Difference (or offset) between the actual location
 ${\hat{y}}^{SV}$
and the standard location
 $\hat{R}-3$
of the slip velocity, as a function of
 $\hat{R}$
. Solid line:
 $\hat{L}=8000$
, dashed line:
 $\hat{L}=500$
.

Figure 8 shows the axial slip velocity
 $\overline{u}$
, normalized by
 $\overline{u}_{R}^{SV}$
, at the actual position
 ${\hat{y}}={\hat{y}}^{SV}$
(corresponding to figure 7). It can be noted that the normalized value goes naturally to almost 1 as
 $\hat{R}$
becomes large for the largest value of
 $\hat{L}$
. However this is not the case for the smallest value of
 $\hat{L}$
and the normalized value is reduced significantly for
 $\hat{R}>50$
.
Normalized axial slip velocity at position
 ${\hat{y}}={\hat{y}}^{SV}$
, as a function of
 $\hat{R}$
. Solid line:
 $\hat{L}=8000$
, dashed line:
 $\hat{L}=500$
.

Here again we explore the limit of validity of the classical approach by showing that both the position and the value of the slip velocity are dependent not only on
 $\hat{R}$
but also on
 $\hat{L}$
. This is stressed also by results shown in figure 9 that gives a comparison of the slip velocity and the maximum normalized axial velocity on the guide axis, for
 $\hat{L}=8000$
and
 $\hat{L}=500$
. We can see that the axial slip velocity departs from Rayleigh’s solution more than that on the axis for small values of
 $\hat{R}$
(the solid curve is below the dashed curve). For large values of
 $\hat{R}$
, the opposite is true: the slip velocity departs from Rayleigh’s solution less than the axial streaming velocity on the guide axis. Comparing figure 9 (a,b) shows that this tendency is emphasized for smaller values of
 $\hat{L}$
, due to increased importance of
 $\overline{u}_{3}$
.
Normalized axial slip velocity versus
 $\hat{R}$
(solid line), and maximum normalized axial streaming velocity on the axis (dashed line). (a)
 $\hat{L}=8000$
, (b)
 $\hat{L}=500$
.

3.2.8 Average mass transport velocity
The streaming velocity considered up to now in this study, is often referred to as ‘Eulerian’ time-average velocity. The ‘average mass transport’ velocity, associated with streaming mass transport, is often considered, especially for thermoacoustic applications where heat transport due to streaming is the relevant quantity of interest. The axial component of the average mass transport velocity
 $\overline{u}^{M}$
, at the first order of approximation, is given by
 $$\begin{eqnarray}\displaystyle \overline{u}^{M}(\hat{x},{\hat{y}})=\overline{u}+\frac{\overline{\unicode[STIX]{x1D70C}^{\prime }u^{\prime }}}{\unicode[STIX]{x1D70C}_{0}}. & & \displaystyle\end{eqnarray}$$
Along the axis, using (3.12) and neglecting terms of order
 $O(\text{e}^{-\hat{R}})$
and lower, it follows that
 $$\begin{eqnarray}\displaystyle \frac{\overline{u}^{M}(\hat{x},0)}{\overline{u}_{R}}=1-\frac{11}{2}\frac{1}{\hat{R}}-\frac{2\unicode[STIX]{x03C0}^{2}}{45}\frac{\hat{R}^{2}}{\hat{L}^{2}}\left[\hat{R}-1+\frac{30}{\hat{R}^{2}}-\frac{60}{\hat{R}^{3}}+\frac{45}{\hat{R}^{4}}\right]. & & \displaystyle\end{eqnarray}$$
Axial velocities
 $\overline{u}^{M}(-1/4,{\hat{y}})/\overline{u}_{R}$
(dashed line),
 $\overline{u}(-1/4,{\hat{y}})/\overline{u}_{R}$
(solid line). (a)
 $\hat{R}=6$
,
 $\hat{L}=8000$
, (b)
 $\hat{R}=50$
,
 $\hat{L}=8000$
, (c)
 $\hat{R}=90$
,
 $\hat{L}=8000$
, (d)
 $\hat{R}=6$
,
 $\hat{L}=500$
, (e)
 $\hat{R}=50$
,
 $\hat{L}=500$
, (f)
 $\hat{R}=90$
,
 $\hat{L}=500$
.

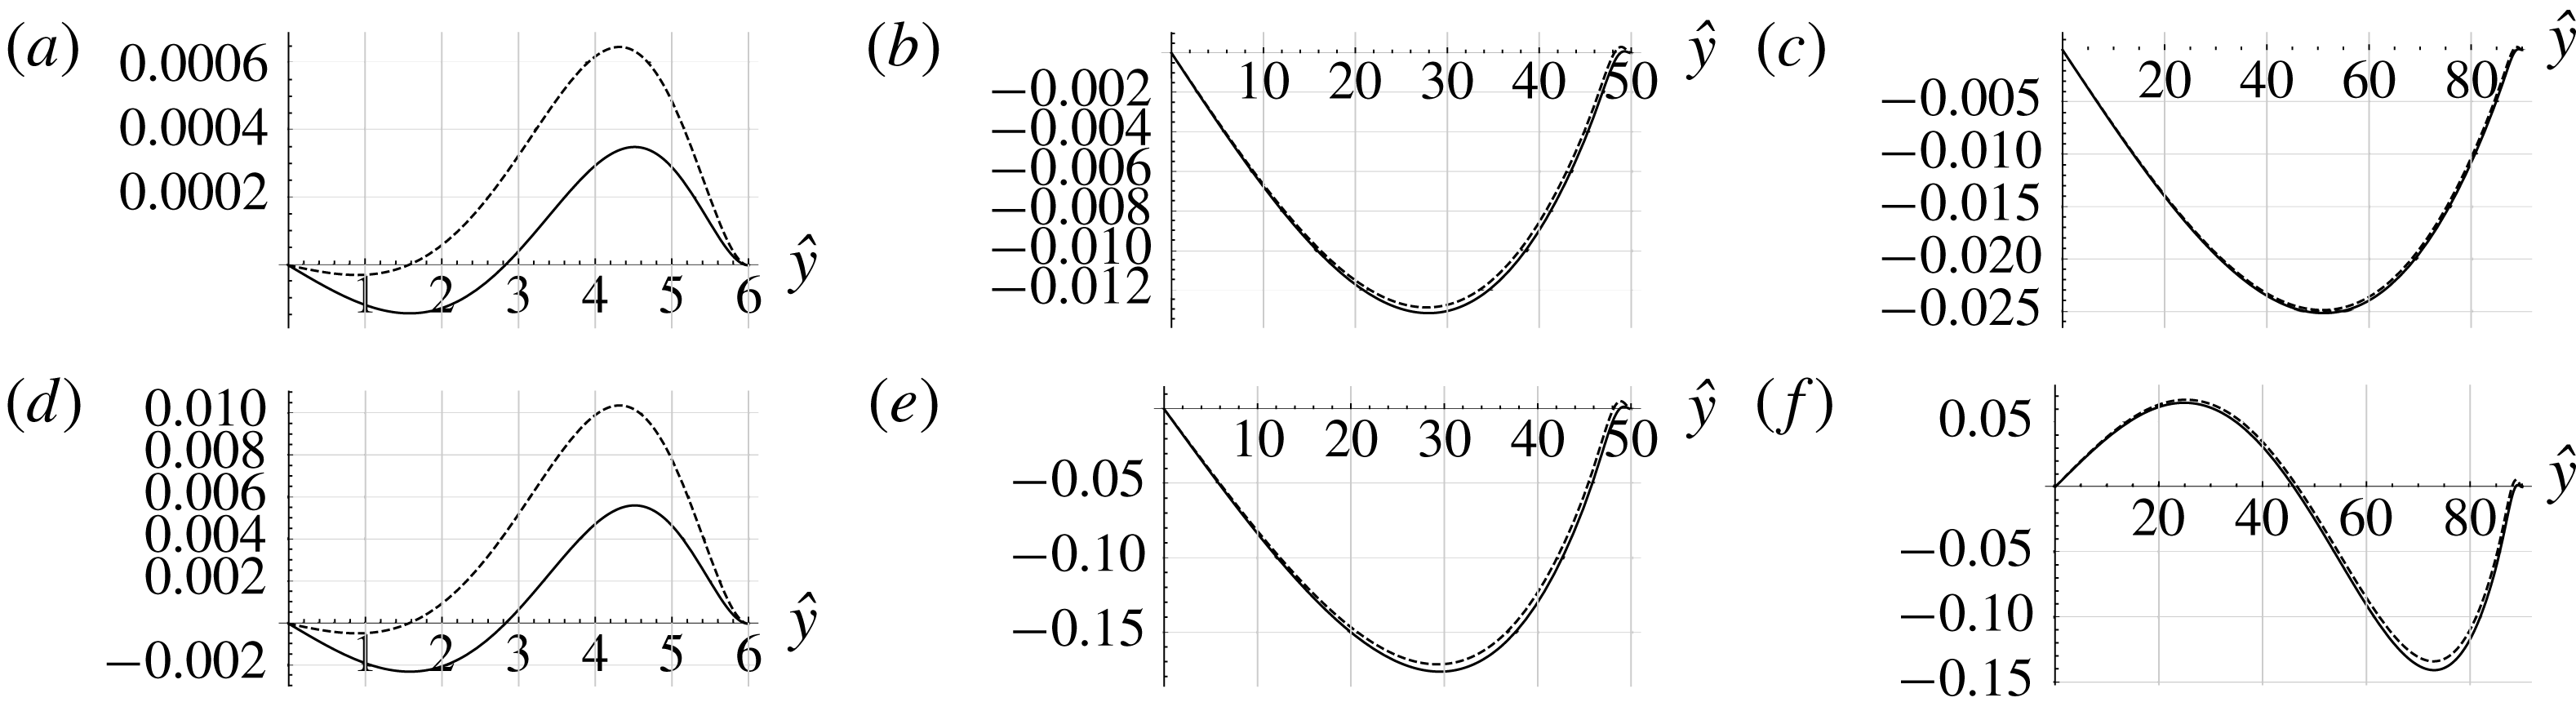
Figure 10 shows the transverse profiles of axial streaming velocities
 $\overline{u}$
and
 $\overline{u}^{M}$
, for three values of
 $\hat{R}$
(6, 50 and 90), and two values of
 $\hat{L}$
(8000 and 500). The difference between
 $\overline{u}$
and
 $\overline{u}^{M}$
is most significant in the viscous boundary layer, as usually considered. For small values of
 $\hat{R}$
, differences are significant everywhere, including on the axis. These differences between
 $\overline{u}$
and
 $\overline{u}^{M}$
are obviously associated with the additional term
 $\overline{\unicode[STIX]{x1D70C}^{\prime }u^{\prime }}$
. As shown by expressions (3.4) and (3.6) this term is nearly zero since it is the product of two terms nearly in quadrature apart from viscous boundary layers effects. Indeed on the axis the acoustic velocity oscillates as
 $\cos (2\unicode[STIX]{x03C0}\hat{t})$
(see dominant terms in equation (3.4)) and the acoustic density oscillates as
 $\sin (2\unicode[STIX]{x03C0}\hat{t})$
(see dominant terms in equation (3.6)). This feature is associated with the standing wave character of the oscillation in the guide under study that is closed at both ends and excited at its resonance frequency. In such resonators acoustic pressure (and thus density oscillations) are in quadrature with acoustic velocity due to boundary layers effects. Therefore for large guides (see figure 10
b,c,e,f) the difference between
 $\overline{u}$
and
 $\overline{u}^{M}$
is only significant close to the wall. For narrow guides, the inner streaming takes up most of the guide, thus
 $\overline{u}$
and
 $\overline{u}^{M}$
are different through the whole guide section (see figure 10
a,d).
Also in the case
 $\hat{R}=90$
and
 $\hat{L}=500$
(figure 10
f), the change of sign of
 $\overline{u}$
at
 ${\hat{y}}\approx 25$
indicates the appearance of a new vortex with reverse flow near the axis.
3.2.9 Vertical streaming velocity
It can also be useful to consider the vertical component of streaming velocity, especially to detect the appearance of new cells. Let us define the average mass transport vertical velocity variable given by, in the first order of approximation
 $$\begin{eqnarray}\displaystyle \overline{v}^{M}(\hat{x},{\hat{y}})=\overline{v}+\frac{\overline{\unicode[STIX]{x1D70C}^{\prime }v^{\prime }}}{\unicode[STIX]{x1D70C}_{0}}. & & \displaystyle\end{eqnarray}$$
The continuity equation (first equation in (3.10)) becomes
 $$\begin{eqnarray}\displaystyle \frac{\unicode[STIX]{x2202}\overline{u}^{M}}{\unicode[STIX]{x2202}\hat{x}}+\hat{L}\frac{\unicode[STIX]{x2202}\overline{v}^{M}}{\unicode[STIX]{x2202}{\hat{y}}}=0. & & \displaystyle\end{eqnarray}$$
Integrating equation (3.45) and using the boundary conditions (3.11c ) yields the simplified expression
 $$\begin{eqnarray}\displaystyle \overline{v}^{M}(\hat{x},{\hat{y}}) & = & \displaystyle \frac{\unicode[STIX]{x03C0}U_{ac}^{2}}{16c_{0}\hat{L}}\cos (2\unicode[STIX]{x03C0}\hat{x})\left\{\frac{{\hat{y}}}{\hat{R}}\left(-33+6\hat{R}-4\unicode[STIX]{x03C0}^{2}\frac{\hat{R}^{4}}{\hat{L}^{2}}\right)+\frac{{\hat{y}}^{3}}{\hat{R}^{3}}\left(11-6\hat{R}+\frac{8\unicode[STIX]{x03C0}^{2}}{15}\frac{\hat{R}^{4}}{\hat{L}^{2}}\right)\right.\nonumber\\ \displaystyle & & \displaystyle -\,\frac{4\unicode[STIX]{x03C0}^{2}}{15}\frac{\hat{R}^{4}}{\hat{L}^{2}}\frac{{\hat{y}}^{5}}{\hat{R}^{5}}+\text{e}^{{\hat{y}}-\hat{R}}\left[\cos (\hat{R}-{\hat{y}})\left(16+4\frac{{\hat{y}}}{\hat{R}}\right)+\sin (\hat{R}-{\hat{y}})\left(16-4\frac{{\hat{y}}}{\hat{R}}\right)\right]\nonumber\\ \displaystyle & & \displaystyle +\left.2\text{e}^{2({\hat{y}}-\hat{R})}\right\}.\end{eqnarray}$$
The Eulerian velocity
 $\overline{v}$
can be obtained using (3.44) and (3.13). Figure 11 shows the vertical velocities
 $\overline{v}$
and
 $\overline{v}^{M}$
for several values of
 $\hat{R}$
and two values of
 $\hat{L}$
. For small values of
 $\hat{R}$
(figure 11
a,d),
 $\overline{v}$
and
 $\overline{v}^{M}$
are very different. Also in the case
 $\hat{R}=90$
and
 $\hat{L}=500$
(figure 11
f), the change of sign of
 $\overline{v}$
and
 $\overline{v}^{M}$
at
 ${\hat{y}}\approx 46$
indicates the appearance of a new vortex with reverse flow near the axis.
Vertical average mass transport velocities
 $\overline{v}^{M}(-1/2,{\hat{y}})/\overline{u}_{R}$
(dashed line),
 $\overline{v}(-1/2,{\hat{y}})/\overline{u}_{R}$
(solid line). (a)
 $\hat{R}=6$
,
 $\hat{L}=8000$
, (b)
 $\hat{R}=50$
,
 $\hat{L}=8000$
, (c)
 $\hat{R}=90$
,
 $\hat{L}=8000$
, (d)
 $\hat{R}=6$
,
 $\hat{L}=500$
, (e)
 $\hat{R}=50$
,
 $\hat{L}=500$
, (f)
 $\hat{R}=90$
,
 $\hat{L}=500$
.
Finally, as a summary, figure 12 shows the streamlines of the streaming flow plotted using (3.42) and (3.46), for
 $\hat{R}=90$
and
 $\hat{L}=500$
and
 $8000$
. For such large values of
 $\hat{R}$
, the inner streaming is restrained in a very small region near the wall. For
 $\hat{L}=8000$
, Rayleigh streaming is composed of two counter-rotating vortices as usual, while for
 $\hat{L}=500$
it is composed of four vortices, the flow along the axis being reversed.
Streamlines of the mass transport velocity for
 $\hat{R}=90$
;
 $\hat{L}=500$
(a),
 $\hat{L}=8000$
(b). (c) Zoom on the inner region of top figure.

4 The axisymmetric case
Streaming flow in cylindrical guides shows common features with the one between plates. It is composed of toroidal vortices that span
 $\unicode[STIX]{x1D706}/4$
in the axial direction and inner and outer vortices coexist. Figure 1 corresponds to the streaming patterns observed in an axial section. However the value of the axial streaming velocity on the axis, and the position of the centre of the outer streaming vortex, are quite different from the case of parallel plates. We have performed an analysis similar to that presented above for the case of a cylindrical guide. One goal is to deduce the condition for
 $L/R$
such that additional counter-rotating streaming cells appear, associated with the third source term.
4.1 Acoustics
With the same change of variables as in the plane case (
 $\hat{r}=r/\unicode[STIX]{x1D6FF}_{\unicode[STIX]{x1D708}}$
, where
 $r$
is the radial coordinate), the linearized equations governing acoustics in the axisymmetric case are
 $$\begin{eqnarray}\displaystyle & \displaystyle \frac{1}{2}c_{0}\frac{\unicode[STIX]{x2202}\unicode[STIX]{x1D70C}^{\prime }}{\unicode[STIX]{x2202}\hat{t}}+\unicode[STIX]{x1D70C}_{0}\left(\frac{\unicode[STIX]{x2202}u^{\prime }}{\unicode[STIX]{x2202}\hat{x}}+\hat{L}\frac{1}{\hat{r}}\frac{\unicode[STIX]{x2202}}{\unicode[STIX]{x2202}\hat{r}}(\hat{r}v^{\prime })\right)=0 & \displaystyle\end{eqnarray}$$
 $$\begin{eqnarray}\displaystyle & \displaystyle \unicode[STIX]{x1D70C}_{0}\frac{c_{0}}{2}\frac{\unicode[STIX]{x2202}u^{\prime }}{\unicode[STIX]{x2202}\hat{t}}+c_{0}^{2}\frac{\unicode[STIX]{x2202}\unicode[STIX]{x1D70C}^{\prime }}{\unicode[STIX]{x2202}\hat{x}}=\unicode[STIX]{x1D70C}_{0}\frac{\unicode[STIX]{x03C0}}{2}c_{0}\frac{1}{\hat{r}}\frac{\unicode[STIX]{x2202}}{\unicode[STIX]{x2202}\hat{r}}\left(\hat{r}\frac{\unicode[STIX]{x2202}u^{\prime }}{\unicode[STIX]{x2202}\hat{r}}\right) & \displaystyle\end{eqnarray}$$
 $$\begin{eqnarray}\displaystyle & \displaystyle \frac{\unicode[STIX]{x2202}\unicode[STIX]{x1D70C}^{\prime }}{\unicode[STIX]{x2202}\hat{r}}=0, & \displaystyle\end{eqnarray}$$
 $u^{\prime }$
and
 $v^{\prime }$
are the axial and radial components of the acoustic velocity. The boundary conditions for
 $u^{\prime }$
and
 $v^{\prime }$
remain given by (3.3), replacing
 ${\hat{y}}$
by
 $\hat{r}$
.
We start again with a given axial velocity solution of (4.1), approximated following Schuster & Matz (Reference Schuster and Matz1940) for moderate and large channels (
 $\hat{R}\geqslant 6$
)
 $$\begin{eqnarray}\displaystyle u^{\prime }(\hat{x},\hat{r},\hat{t}) & = & \displaystyle U_{ac}\cos (\unicode[STIX]{x03C0}\hat{x})\left[\left(-1+\frac{1}{2}\frac{\text{I}_{0}((1-\text{i})\hat{r})}{\text{I}_{0}((1-\text{i})\hat{R})}+\frac{1}{2}\frac{\text{I}_{0}((1+\text{i})\hat{r})}{\text{I}_{0}((1+\text{i})\hat{R})}\right)\cos (\unicode[STIX]{x1D714}\hat{t})\right.\nonumber\\ \displaystyle & & \displaystyle -\left.\left(\frac{1}{2\text{i}}\frac{\text{I}_{0}((1-\text{i})\hat{r})}{\text{I}_{0}((1-\text{i})\hat{R})}-\frac{1}{2\text{i}}\frac{\text{I}_{0}((1+\text{i})\hat{r})}{\text{I}_{0}((1+\text{i})\hat{R})}\right)\sin (\unicode[STIX]{x1D714}\hat{t})\right],\end{eqnarray}$$
where
 $\text{I}_{0}$
is the modified Bessel function of the first kind.
Using the hypothesis that
 $\unicode[STIX]{x1D70C}^{\prime }$
depends on
 $\hat{x}$
and
 $\hat{t}$
only, together with the boundary conditions, equation (4.1a
) is integrated with respect to
 $\hat{r}$
to obtain the radial acoustic velocity component
 $$\begin{eqnarray}\displaystyle v^{\prime }(\hat{x},\hat{r},\hat{t}) & = & \displaystyle \frac{\unicode[STIX]{x03C0}}{4}U_{ac}\frac{\hat{r}}{\hat{L}}\sin (\unicode[STIX]{x03C0}\hat{x})\left[\frac{\text{}_{0}\tilde{F}_{1}\left(;2,\displaystyle \frac{\text{i}\hat{r}^{2}}{2}\right)-\text{}_{0}\tilde{F}_{1}\left(;2,\displaystyle \frac{\text{i}\hat{R}^{2}}{2}\right)}{\text{I}_{0}((1+\text{i})\hat{R})}(\cos (\unicode[STIX]{x1D714}\hat{t})-\text{i}\sin (\unicode[STIX]{x1D714}\hat{t}))\right.\nonumber\\ \displaystyle & & \displaystyle +\left.\frac{\text{}_{0}\tilde{F}_{1}\left(;2,\displaystyle \frac{-\text{i}\hat{r}^{2}}{2}\right)-_{0}\tilde{F}_{1}\left(;2,\displaystyle \frac{-\text{i}\hat{R}^{2}}{2}\right)}{\text{I}_{0}((1-\text{i})\hat{R})}(\cos (\unicode[STIX]{x1D714}\hat{t})+\text{i}\sin (\unicode[STIX]{x1D714}\hat{t}))\right],\end{eqnarray}$$
where
 $_{0}\tilde{F}_{1}(;b,z)$
is the regularized confluent hypergeometric function.
4.2 Streaming flow equations
Using the same change of variables as in the plane case, the equations to be solved are
 $$\begin{eqnarray}\displaystyle \left\{\begin{array}{@{}l@{}}\displaystyle \unicode[STIX]{x1D70C}_{0}\left(\frac{\unicode[STIX]{x2202}\overline{u}}{\unicode[STIX]{x2202}\hat{x}}+\hat{L}\frac{1}{\hat{r}}\frac{\unicode[STIX]{x2202}}{\unicode[STIX]{x2202}\hat{r}}(\hat{r}\overline{v})\right)=-\frac{\unicode[STIX]{x2202}}{\unicode[STIX]{x2202}\hat{x}}(\overline{\unicode[STIX]{x1D70C}^{\prime }u^{\prime }})-\hat{L}\frac{1}{\hat{r}}\frac{\unicode[STIX]{x2202}}{\unicode[STIX]{x2202}\hat{r}}(\hat{r}\overline{\unicode[STIX]{x1D70C}^{\prime }v^{\prime }})\\ \displaystyle \unicode[STIX]{x1D70C}_{0}\frac{\unicode[STIX]{x03C0}}{2}c_{0}\frac{1}{\hat{r}}\frac{\unicode[STIX]{x2202}}{\unicode[STIX]{x2202}\hat{r}}\left(\hat{r}\frac{\unicode[STIX]{x2202}\overline{u}}{\unicode[STIX]{x2202}\hat{r}}\right)=\frac{\unicode[STIX]{x2202}\overline{p}}{\unicode[STIX]{x2202}\hat{x}}+\unicode[STIX]{x1D70C}_{0}\frac{\unicode[STIX]{x2202}}{\unicode[STIX]{x2202}\hat{x}}(\overline{u^{\prime }u^{\prime }})+\unicode[STIX]{x1D70C}_{0}\hat{L}\frac{1}{\hat{r}}\frac{\unicode[STIX]{x2202}}{\unicode[STIX]{x2202}\hat{r}}(\hat{r}\overline{u^{\prime }v^{\prime }})\\ \displaystyle \unicode[STIX]{x1D70C}_{0}\frac{\unicode[STIX]{x03C0}}{2}c_{0}\frac{1}{\hat{r}}\frac{\unicode[STIX]{x2202}}{\unicode[STIX]{x2202}\hat{r}}\left(\hat{r}\frac{\unicode[STIX]{x2202}\overline{v}}{\unicode[STIX]{x2202}\hat{r}}\right)=\hat{L}\frac{\unicode[STIX]{x2202}\overline{p}}{\unicode[STIX]{x2202}\hat{r}}+\unicode[STIX]{x1D70C}_{0}\frac{\unicode[STIX]{x2202}}{\unicode[STIX]{x2202}\hat{x}}(\overline{u^{\prime }v^{\prime }})+\unicode[STIX]{x1D70C}_{0}\hat{L}\frac{1}{\hat{r}}\frac{\unicode[STIX]{x2202}}{\unicode[STIX]{x2202}\hat{r}}(\hat{r}\overline{v^{\prime }v^{\prime }})\end{array}\right. & & \displaystyle\end{eqnarray}$$
and the boundary conditions for
 $\overline{u}$
and
 $\overline{v}$
are now
 $$\begin{eqnarray}\overline{u}=0\quad \text{at }\hat{r}=\hat{R};\quad \frac{\unicode[STIX]{x2202}\overline{u}}{\unicode[STIX]{x2202}\hat{r}}=0\quad \text{at }\hat{r}=0,\end{eqnarray}$$
 $$\begin{eqnarray}\overline{v}=0\quad \text{at }\hat{r}=0\text{ and }\hat{r}=\hat{R},\end{eqnarray}$$
 $$\begin{eqnarray}\displaystyle \int _{0}^{\hat{R}}\hat{r}\overline{u}\,\text{d}\hat{r}=0.\end{eqnarray}$$
The average products of fluctuations are calculated with the expressions of
 $u^{\prime }$
and
 $v^{\prime }$
from equations (4.2) and (4.3). Since the complete expressions are complicated, we only give here
 $\overline{u^{\prime }u^{\prime }}$
and
 $\overline{u^{\prime }v^{\prime }}$
:
 $$\begin{eqnarray}\displaystyle \overline{u^{\prime }u^{\prime }}(\hat{x},\hat{r})=\frac{U_{ac}^{2}}{2}\cos ^{2}(\unicode[STIX]{x03C0}\hat{x})\frac{(\text{I}_{0}((1+\text{i})\hat{r})-\text{I}_{0}((1+\text{i})\hat{R}))(\text{I}_{0}((1-\text{i})\hat{r})-\text{I}_{0}((1-\text{i})\hat{R}))}{\text{I}_{0}((1-\text{i})\hat{R})\text{I}_{0}((1+\text{i})\hat{R})}\quad & & \displaystyle\end{eqnarray}$$
 $$\begin{eqnarray}\displaystyle \overline{u^{\prime }v^{\prime }}(\hat{x},\hat{r}) & = & \displaystyle \frac{1}{16}(1-\text{i})\frac{\unicode[STIX]{x03C0}U_{ac}^{2}}{\hat{R}}\frac{1}{\hat{L}}\frac{\sin (2\unicode[STIX]{x03C0}\hat{x})}{\text{I}_{0}((1-\text{i})\hat{R})\text{I}_{0}((1+\text{i})\hat{R})} [(\text{I}_{0}((1-\text{i})\hat{r})\nonumber\\ \displaystyle & & \displaystyle -\,\text{I}_{0}((1-\text{i})\hat{R}))\left(\hat{R}I_{1}((1+\text{i})\hat{r})-\hat{r}I_{1}((1+\text{i})\hat{R})\right)\nonumber\\ \displaystyle & & \displaystyle +\,(I_{0}((1+\text{i})\hat{r})-I_{0}((1+\text{i})\hat{R}))(\hat{R}\text{J}_{1}((1+\text{i})\hat{r})-\hat{r}\text{J}_{1}((1+\text{i})\hat{R}))],\end{eqnarray}$$
where
 $\text{J}_{1}$
is the Bessel function of the first kind.
Taking the curl of the momentum equations results in
 $$\begin{eqnarray}\displaystyle -\frac{\unicode[STIX]{x03C0}}{2}c_{0}\hat{L}\frac{\unicode[STIX]{x2202}}{\unicode[STIX]{x2202}\hat{r}}\left(\frac{1}{\hat{r}}\frac{\unicode[STIX]{x2202}}{\unicode[STIX]{x2202}\hat{r}}\left(\hat{r}\frac{\unicode[STIX]{x2202}\overline{u}}{\unicode[STIX]{x2202}\hat{r}}\right)\right) & = & \displaystyle -\hat{L}\frac{\unicode[STIX]{x2202}^{2}(\overline{u^{\prime }u^{\prime }})}{\unicode[STIX]{x2202}\hat{r}\unicode[STIX]{x2202}\hat{x}}\nonumber\\ \displaystyle & & \displaystyle -\,\hat{L}^{2}\frac{\unicode[STIX]{x2202}}{\unicode[STIX]{x2202}\hat{r}}\left(\frac{1}{\hat{r}}\frac{\unicode[STIX]{x2202}(\hat{r}\overline{u^{\prime }v^{\prime }})}{\unicode[STIX]{x2202}\hat{r}}\right)+\frac{\unicode[STIX]{x2202}^{2}(\overline{u^{\prime }v^{\prime }})}{\unicode[STIX]{x2202}\hat{x}^{2}}+\hat{L}\frac{1}{\hat{r}}\frac{\unicode[STIX]{x2202}^{2}(\hat{r}\overline{v^{\prime }v^{\prime }})}{\unicode[STIX]{x2202}\hat{x}\unicode[STIX]{x2202}\hat{r}}.\qquad\end{eqnarray}$$
4.3 Results
In the same way as in the plane case, we consider separately the four problems associated with each source term in equation (4.8).
(a)
 $T(\hat{r},20)$
(solid line), approximated function (dashed line). (b) Maximum relative error as a function of
 $\hat{R}$
(log–log plot).

However, there is no symbolic form for the integral of terms of the form
 $T(\hat{r},\hat{R})=\text{Re}[(1+\text{i})\text{I}_{0}((1+\text{i})\hat{r})/\text{I}_{0}((1+\text{i})\hat{R})\cdot I_{1}((1-\text{i})\hat{r})/\text{I}_{0}((1-\text{i})\hat{R})]$
that appear in the successive integrations. Nevertheless these terms can be approximated with good accuracy using an exponential function that can be integrated symbolically. Figure 13 (a) shows
 $T(\hat{r},20)$
together with the approximated function (a purely exponential function based on a two-point interpolation) that is used instead in the successive integrations. The curves are nearly superimposed and indistinguishable. The maximum relative error between the two functions is represented in a log–log plot in figure 13 (b) for values of
 $\hat{R}$
between 6 and 200, showing excellent accuracy and a variation in
 $1/\hat{R}^{2}$
. The full expressions for the streaming velocity components are not developed below, since the formulae are very lengthy. Instead, the following fitted formula is obtained for the axial streaming velocity along the axis, normalized by Rayleigh’s solution, which is now
 $\overline{u}_{R}=-(3/8)U_{ac}^{2}/c_{0}\sin (2\unicode[STIX]{x03C0}\hat{x})$
 $$\begin{eqnarray}\displaystyle \frac{\overline{u}}{\overline{u}_{R}}=1-5.676\frac{1}{\hat{R}^{0.98}}-0.296\frac{\hat{R}^{2.98}}{\hat{L}^{2}}. & & \displaystyle\end{eqnarray}$$
This expression shows a similar but slightly different dependence on
 $\hat{R}$
compared to that obtained in the plane case (3.39). It also shows that an extra cell of reversed flow may still appear near the axis in circumstances where the ratio
 $\hat{R}^{2.98}/\hat{L}^{2}$
in the third term is not negligible. More precisely, the condition for this is
 $$\begin{eqnarray}\displaystyle \hat{L}\leqslant \hat{L}_{limit}(\hat{R})=\left(\frac{0.296\hat{R}^{2.98}}{1-\displaystyle \frac{5.676}{\hat{R}^{0.98}}}\right)^{1/2}. & & \displaystyle\end{eqnarray}$$
Figure 14 shows, for the axisymmetric case, the variation with
 $\hat{R}$
of
 $\hat{L}_{limit}/\hat{R}$
for the appearance of reverse flow on the axis. For example, for
 $\hat{R}=100$
, the extra cell will appear for
 $\hat{L}<536$
in the axisymmetric case, that is for a shorter guide than in the plane case. Note that for small values on the vertical axis of figure 14 the limit of validity of the hypothesis
 $(R/L)^{2}\ll 1$
is reached.
This has to be kept in mind when assessing geometries compatible with the existence of the extra cell.
Limit value
 $\hat{L}_{limit}(\hat{R})/\hat{R}$
under which the flow is reversed on the axis. Minimum values:
 $\hat{R}=11.93,\hat{L}/\hat{R}=2.6$
.

Axial velocities
 $\overline{u}(-1/4,{\hat{y}})/\overline{u}_{R}$
,
 $\hat{L}=500$
(solid line),
 $\hat{L}=8000$
(dashed line). (a)
 $\hat{R}=6$
, (b)
 $\hat{R}=50$
, (c)
 $\hat{R}=100$
.

Radial velocities
 $\overline{v}(-1/2,{\hat{y}})/\overline{u}_{R}$
,
 $\hat{L}=500$
(solid line),
 $\hat{L}=8000$
(dashed line). (a)
 $\hat{R}=6$
, (b)
 $\hat{R}=50$
, (c)
 $\hat{R}=100$
.

Figures 15 and 16 show the radial profiles of axial and radial streaming velocities
 $\overline{u}$
,
 $\overline{v}$
, for three values of
 $\hat{R}$
(6, 50 and 100), and two values of
 $\hat{L}$
(500 and 8000). The behaviour of the streaming flow is similar to that in the plane case. The inner streaming is of lower amplitude than in the plane case. It is also seen that the centre of the outer vortex is closer to the wall than in the plane case, as expected (Rayleigh Reference Rayleigh1884). The influence of the third source term is visible in the case
 $\hat{R}=50,\hat{L}=500$
. An extra vortex appears and the flow is reversed on the axis for
 $\hat{R}=100,\hat{L}=500$
. Figure 17 shows the corresponding streamlines of the mass transport velocity in an axial plane section. The inner vortex is very narrow in this case and not visible on this figure.
Streamlines of the mass transport velocity in an axial plane section for
 $\hat{R}=100$
;
 $\hat{L}=500$
(a),
 $\hat{L}=8000$
(b).

5 Conclusion
Rayleigh’s outer streaming flow in standing wave guides (infinite parallel plates or cylindrical tubes) was revisited, by solving the full linear streaming equations for moderate to large guides, using symbolic computations. The effect of each Reynolds stress source term was analysed separately and several features that were not previously reported were exhibited: analysis of the effect of the two classically dominant Reynolds stress source terms highlighted the commonly accepted fact that the streaming flow is generated only by viscous boundary layer effects. The outer streaming is created from momentum diffusion of the velocity created near the guide wall, and not from pressure gradient effects. The dependency with the guide’s length and the radius of the axial streaming velocity normalized by Rayleigh’s solution along the axis was quantified. It was shown that the effect of the third Reynolds stress source term which is usually neglected can become important for some geometrical parameters that were identified. In these situations, a vortex with reverse flow is created along the guide axis. Several characteristics of the streaming flow were analysed, such as slip velocity, mass transport velocity and transverse component of streaming flow, in connection with the effect of the third source term. For all these characteristics it was shown that not only the ratio of wave guide width (or radius) to viscous boundary layer thickness, but also the ratio of guide width (or radius) to guide length, are driving criteria for the organization of streaming.



