




1. Introduction
In many instances of considerable physical interest, fluids display configurations of highly concentrated vorticity. When a high-Reynolds-number flow interacts with a solid boundary, for example, separation causes the ejection of strong vorticity from within the boundary layer in the form of vortex layers and vortex cores (Schlichting Reference Schlichting1960). The formation and the evolution of these structures assume particular importance also because they are the primary source of dissipation in the bulk of the fluid.
This paper presents a thorough study of the dynamics of thin vortex layers at high Reynolds numbers and a comparison of their evolution, as predicted by the Navier–Stokes (NS) equations, with the motion of an equivalent inviscid vortex sheet, as predicted by the Birkhoff–Rott (BR) equation. It is well known that the BR equation, governing the motion of an inviscid vortex sheet, suffers from the Kelvin–Helmholtz instability according to which small disturbances grow exponentially. The main consequence of such instability is ill-posedness, revealing itself via curvature-blow up, see Caflisch & Orellana (Reference Caflisch and Orellana1989) and Duchon & Robert (Reference Duchon and Robert1988).
The seminal work of Moore (Reference Moore1979) contained the analytical procedures, based on formal asymptotic expansion, indicating that the components of the vortex sheet curve develop branch singularities of order 3/2, and that the curvature blows up due to an inverse square-root singularity. This remarkable result was later supported by the analysis presented in Baker, Meiron & Orszag (Reference Baker, Meiron and Orszag1982), Moore (Reference Moore1985), Duchon & Robert (Reference Duchon and Robert1988), Caflisch & Orellana (Reference Caflisch and Orellana1989), Brady & Pullin (Reference Brady and Pullin1999), and by numerical simulations (Krasny Reference Krasny1986b; Shelley Reference Shelley1992; Baker, Caflisch & Siegel Reference Baker, Caflisch and Siegel1993; Ishihara & Kaneda Reference Ishihara and Kaneda1995; Cowley, Baker & Tanveer Reference Cowley, Baker and Tanveer1999; Nitsche Reference Nitsche2001) for both 2D and 3D vortex sheet flow.
The singularity formation sets the limit of applicability of the BR equation in predicting the vortex sheet motion. To go beyond the singularity time, one needs to invoke some regularization of the BR solution or use different mathematical models. In the former case,  $\delta$-vortex blob regularization (Krasny Reference Krasny1986a; Baker & Beale Reference Baker and Beale2004; Baker & Pham Reference Baker and Pham2006; Lopes Filho et al. Reference Lopes Filho, Lowengrub, Nussenzveig Lopes and Zheng2006; Sohn Reference Sohn2011) and BR-
 $\alpha$ model (Holm, Nitsche & Putkaradze Reference Holm, Nitsche and Putkaradze2006; Bardos, Linshiz & Titi Reference Bardos, Linshiz and Titi2008; Caflisch et al. Reference Caflisch, Gargano, Sammartino and Sciacca2017) are commonly used to regularize the singular kernel of the BR equation. These regularizations prevent the singularity formation, which allows the continuation of the vortex sheet motion up to the typical roll-up phenomena observed in shear layer flows. However, despite the regularization induced by these models, some phenomena resembling the singular behaviour are still present: for example, Caflisch et al. (Reference Caflisch, Gargano, Sammartino and Sciacca2017), the regularized BR-
 $\alpha$ solution has complex singularities that, in the limit
 $\alpha \rightarrow 0$ get close to the real axis, producing spiking and pinching both in the curvature and in the true vortex strength of the sheet.
Baker & Shelley (Reference Baker and Shelley1990) approximated the vortex sheet with an inviscid layer of uniform vorticity and, writing BR-like equations for the bounding interfaces of the layer, they were able to follow in time the layer motion and to analyse the roll-up phenomenon in the limit of zero initial thickness. Benedetto & Pulvirenti (Reference Benedetto and Pulvirenti1992) rigorously proved that the dynamics of a thin vortex layer of uniform vorticity, in the zero thickness limit, approximates the vortex sheet motion. Tryggvason, Dahm & Sbeih (Reference Tryggvason, Dahm and Sbeih1991) used the 2D NS equations to reproduce the motion of an array of viscous vortex blobs distributed along a curve; the authors compared the NS dynamics, at small viscosity, with the  $\delta$-vortex blob regularization of the BR equation for small blob size: they showed that most of the large-scale features characterizing the
 $\delta$–BR curve were also captured by the viscous layer induced by the vortex blobs sequence. Viscosity effects were also included in the model proposed in Dhanak (Reference Dhanak1994), where an integrodifferential BR-like equation was derived from the zero thickness limit of a viscous layer of non-uniform vorticity. However, subsequent numerical analysis (Sohn Reference Sohn2013) showed that this viscous version of the BR equation does not prevent the formation of singularity in the solution. Surface tension and density stratification have also been used as regularizing agent in Hou, Lowengrub & Shelley (Reference Hou, Lowengrub and Shelley1997), Baker & Nachbin (Reference Baker and Nachbin1998), Pugh & Shelley (Reference Pugh and Shelley1998), Baker & Beale (Reference Baker and Beale2004) and Chen & Forbes (Reference Chen and Forbes2011).
The continuation of the vortex sheet solution after the singularity time can also be viewed as related to the more general problem of the global (or local) existence of weak solutions for the 2D Euler equations with vortex sheet initial data. The rigorous results reported in DiPerna & Majda (Reference DiPerna and Majda1987a,Reference DiPerna and Majdab), Delort (Reference Delort1991), and Lopes Filho, Nussenzveig Lopes & Xin (Reference Lopes Filho, Nussenzveig Lopes and Xin2001) ensure the global existence of measured-value solutions for Euler equations, although no information is given for the structure of the solution, let alone if it remains a smooth vortex sheet satisfying the BR equation. Existence results were also obtained as zero viscosity limit for NS equations (Majda Reference Majda1993; Schochet Reference Schochet1995), the  $\alpha \rightarrow 0$ limit of the Euler-
 $\alpha$ equation (Bardos, Linshiz & Titi Reference Bardos, Linshiz and Titi2010) and using point vortex approximation (Liu & Xin Reference Liu and Xin1995).
A recent result by Székelyhidi (Reference Székelyhidi2011) has shown that infinitely many non-stationary weak solutions of the Euler equations for vortex sheet initial data exist and satisfy energy conservation. Previous numerical evidence of non-uniqueness was first reported in Pullin (Reference Pullin1989), where it was shown that multiple self-similar solutions of a class of vortex sheet configurations dependent on a parameter, produced non-trivial spiral-sheet structures in the limit in which the parameter approaches the value for which the initial configuration is a stationary solution of the Euler equations. This conclusion was also supported by the numerical analysis performed in Lopes Filho et al. (Reference Lopes Filho, Lowengrub, Nussenzveig Lopes and Zheng2006) in which multiple solutions of the 2D Euler equations were determined for a vortex sheet with non-distinguished vorticity sign. Non-uniqueness can also be suggested by highlighting the differences coming from different regularizations of the BR equation. Majda (Reference Majda1993), Schochet (Reference Schochet1995), Liu & Xin (Reference Liu and Xin1995) and Bardos et al. (Reference Bardos, Linshiz and Titi2010) reported rigorous analyses where regularized models have been shown, in the zero regularization limits, to converge to weak Euler solutions with vortex sheet initial data. However, several numerical tests have pointed out that small-scale irregular features are typical of certain regularizations only, raising the question of whether the various regularized solutions converge to different limits in the zero regularization regime. For instance, in Tryggvason et al. (Reference Tryggvason, Dahm and Sbeih1991) and, subsequently, in Nitsche, Taylor & Krasny (Reference Nitsche, Taylor and Krasny2003) it was shown that many large-scale features of the roll-up process, such as the number of outer spiral turns at a fixed time, are similarly captured by a sequence of viscous vortex blobs governed by the NS equations and by the  $\delta$–BR curve, although in Nitsche et al. (Reference Nitsche, Taylor and Krasny2003) the more detailed analysis showed that some small-scale differences arise in the innermost part of the core of the spiral. These irregular features were due to the onset of chaos in a particular resonance band, which develops after a large time in the
 $\delta$–BR solution as depicted in Krasny & Nitsche (Reference Krasny and Nitsche2002) and later in Sohn (Reference Sohn2014), and were not observed in the viscous vortex blobs motion governed by the NS equations. Furthermore, Holm et al. (Reference Holm, Nitsche and Putkaradze2006) considered both
 $\delta$-vortex blob and Euler-
 $\alpha$ regularizations for vortex sheet motion in planar and axisymmetric flows: inner core dynamics and spiral vortex sheet roll-up showed different small-scale behaviours due to differences in the spiral core oscillations. However, the authors admit that further investigations are necessary to verify that these differences remain in the zero regularization limit.
The aim of this work is essentially twofold. First, we shall deal with the analysis of a 2D viscous layer flow governed by the NS equation. One could expect that a vortex sheet is the approximation of a real viscous flow in which vorticity is strongly concentrated on a layer of small thickness. The previously cited works (Tryggvason et al. Reference Tryggvason, Dahm and Sbeih1991; Nitsche et al. Reference Nitsche, Taylor and Krasny2003), where the authors studied a viscous layer and compared it with a vortex sheet flow, deal with a low-viscosity regime but fixed (non-dependent from the viscosity) initial thickness of the layer. Although various initial thicknesses were considered, this fixed finite thickness is a regularized agent itself; hence, it remains to understand how the layer behaves in both the zero viscosity and thickness limits. Instead, we shall assume that the layer thickness depends on the square root of viscosity  $\nu$ (or the inverse of the square root of the Reynolds number
 $Re$). Although the layer motion shows some similarities for the various
 $Re$ considered, we describe two different
 $Re$ number dynamics. In the moderate- to high-
 $Re$-number regime (
 $Re> O(10^3)$), the flow evolution is characterized by mixing events in which vorticity is rapidly advected within the main core of the layer from the thin braid attached. Conversely, in the low-
 $Re$ regime (
 $Re\leqslant O(10^3)$) these events are not present. These differences will be highlighted by the analysis of the enstrophy decay rate (the palinstrophy), and by the different topological structure and complex singularities of the central curve centred within the layer.
The second aim is to understand the possible structure of the layer in the zero regularization limit. To accomplish this, we shall focus on the evolution of the central material curve of the layer. We shall see that, in the zero regularization limit, the central curve has, at a point of zero circulation, diverging curvature and vortex strength; this structure is similar to what is predicted in Baker & Shelley (Reference Baker and Shelley1990) for inviscid layers of uniform vorticity. We shall give further evidence for the above scenario through the analysis of the complex singularities of the curvature and vortex strength, and we shall see how they have character compatible with a diverging behaviour. We shall also perform a direct comparison of the outcomes of the viscous layer with the motion governed by the  $\delta$-vortex blob regularization of the BR equation. We shall see that the two solutions present quantitative differences in the small regularizations regime. These discrepancies might suggest that the various regularizations presented for the vortex sheet show different behaviour in the zero regularization limit.
We have also briefly analysed the Euler solutions having a vortex layer as the initial datum. This analysis will allow us to highlight the different roles played by the two regularizing agents (viscosity and finite layer thickness) in resolving the vortex sheet dynamics.
The plan of the paper is the following. In § 2, we present the general framework by defining our initial setup for the viscous layer, and we describe the layer motion in the zero thickness limit. In § 3, we apply the singularity analysis to the material curve centred within the layer, and to the curvature as well to the vorticity intensity. Section 4 is devoted to the comparison between the singularities developed by the NS vortex layer and those present in the regularized vortex-blob evolution of the vortex sheet. In § 5, we summarize our results.
2. Vortex layers
2.1. Formulation and initial set-up
In the 2D periodic domain  $D^*=[-L_x/2,L_x/2]\times [-L_y/2,L_y/2]$, we consider an incompressible viscous flow. We assume that the evolution is governed by the NS equations which in the vorticity streamfunction formulation are
 \begin{equation} \left.\begin{gathered} \frac{\partial \omega^*}{\partial t^*}+\boldsymbol{u}^*\boldsymbol{\cdot}\boldsymbol{\nabla}_{\boldsymbol{x}^*} \omega^*=\nu\boldsymbol{\nabla}^2_{\boldsymbol{x}^*}\omega,\\ \boldsymbol{\nabla}_{\boldsymbol{x}^*}^\perp\psi^*=\boldsymbol{u}^*,\quad \boldsymbol{\nabla}_{\boldsymbol{x}^*}^2 \psi^*={-}\omega^*, \end{gathered}\right\} \end{equation}
where  $\boldsymbol {x}^*=(x^*,y^*)\in D^*$,
 $\boldsymbol {\nabla }_{\boldsymbol {x}^*}=(\partial _{x^*},\partial _{y^*})$,
 $\boldsymbol {\nabla }_{\boldsymbol {x}^*}^\perp =(\partial _{y^*},-\partial _{x^*})$,
 $\boldsymbol {u}^*=(u^*,v^*)$ is the velocity field,
 $\psi ^*$ is the streamfunction,
 $\omega ^*$ is the vorticity and
 $\nu$ is the kinematic viscosity.
We make the equations non-dimensional using the characteristic length  $\lambda ={L_x}/{2{\rm \pi} }$ and the quantity
 $\varGamma ={\int _{D^*}\omega _0^* \,\textrm {d}S^*}$, where
 $\omega _0^\star$ is the initial datum. Non-dimensional quantities are thus defined as
 \begin{equation} (x,y)=\frac{(x^*,y^*)}{\lambda}, \quad t=t^*\frac{\varGamma}{\lambda^2},\quad (u,v)=(u^*,v^*)\frac{\lambda}{\varGamma}, \quad\omega=\frac{\omega^*\lambda^2}{\varGamma}, \end{equation}
whereas the Reynolds number is
 \begin{equation} Re=\frac{\varGamma}{\nu}. \end{equation}
The governing equations can therefore be written in non-dimensional form as
 $$\begin{gather} \partial_t \omega+u\partial_x \omega+v\partial_y \omega=\frac{1}{Re} (\partial^2_{xx}\omega+\partial^2_{yy} \omega), \end{gather}$$
 $$\begin{gather}\partial^2_{xx} \psi+\partial^2_{yy} \psi={-}\omega, \end{gather}$$
 $$\begin{gather}u=\partial_y \psi,\quad v={-}\partial_x \psi, \end{gather}$$
 $$\begin{gather}\omega(x,y,t=0)=\omega_0. \end{gather}$$
We shall solve the above system in the periodic domain  $D=[-{\rm \pi},{\rm \pi} ]\times [-{\rm \pi},{\rm \pi} ]$, having fixed the aspect ratio
 $L_y/L_x=1$, and
 $L_x=2{\rm \pi}$. Equation (2.4) is the vorticity transport equation, (2.5) is the Poisson equation for the streamfunction and (2.6a,b) relate the velocity components to the streamfunction.
The initial data we consider in this paper consist of intense positive vorticity highly concentrated on a small layer of thickness  $O(Re^{-1/2})$ around a curve
 $\phi (x)$. To be more specific, introducing the rescaled variable
 $Y=Re^{1/2}(y-\phi (x))$, the vortex layer initial data we shall consider, are of the form
 \begin{equation} \omega_0(x,y)= Re^{1/2}f(x,Y), \end{equation}
where  $f(x,Y)>0$ has decay in
 $Y$ fast enough such that
 $\int f(x,Y)\,\textrm {d}Y$ is finite. We shall make the choice
 \begin{equation} f(x,Y)=\exp({-}Y^2/2)/ \sqrt{2{\rm \pi}},\quad \phi(x)=\sin(x)/2, \end{equation}
which means that the profile of the vorticity, in the  $y$-direction, is a Gaussian layer with thickness of order
 $Re^{-1/2}$ centred around a sinusoidal profile. In the limit of the thickness going to zero, that is,
 $Re\rightarrow \infty$, the layer shrinks to a sheet coinciding with
 $y=\phi (x)$. The reasons for the
 $O(Re^{-1/2})$ scaling are two. From the mathematical point of view, the vortex layer is considered a possible regularization of a vortex sheet: the viscous dissipation, after an
 $O(1)$ time, would spread a vortex sheet into a layer of
 $O(Re^{-1/2})$ thickness, which is therefore considered a realistic approximation of a vortex sheet. From the physical perspective, vortex layers often arise from the detachment of boundary layers from obstacles interacting with high-Reynolds-number flows. The thickness of these shear/vortex layers is related to the boundary layer thickness before separation, which is
 $O(Re^{-1/2})$; see the classical textbook Schlichting (Reference Schlichting1960) and the interesting discussion in the recent paper Widmann & Tropea (Reference Widmann and Tropea2015).
For our purposes, it is of interest to follow the motion of the centre of the layer (that we shall denote  $\mathcal {C}(t)$). This is done by placing, at
 $t=0$,
 $N+1$ particles on
 $\phi (x)$ and transporting them using the velocity field
 $(u,v)$ generated by the NS equations. Namely, let
 $(x_j(0),y_j(0))$ for
 $j=0,\ldots N$, be the particles initially placed at
 $(\theta _j,\phi (\theta _j))$,
 $\theta _j=-{\rm \pi} +j2{\rm \pi} /N$. The Lagrangian evolution of the generic particle
 $\boldsymbol {x}(\theta _j,t)=(x_j(t),y_j(t))$ is given by
 \begin{equation} \frac{\textrm{d}\kern0.06em x_j}{\textrm{d}t}=u(x_j(t),y_j(t)), \quad \frac{\textrm{d}y_j}{\textrm{d}t}=v(x_j(t),y_j(t)).\end{equation}
A relevant related quantity that we analyse is the vorticity distribution computed on the material curve  $\mathcal {C}$
 \begin{equation} \omega_{\mathcal{C}}(\theta,t)=\omega(\boldsymbol{x}(\theta,t)). \end{equation}
Spatial discretization of the NS equation is achieved through a fully spectral method, while a semi-implicit third-order Runge–Kutta scheme is used to evolve in time the system; see Zhong (Reference Zhong1996) for more details. At each time step, to solve (2.10a,b), the velocity field  $(u,v)$ is spectrally interpolated in the position of the particles
 $(x_j(t),y_j(t))$. All simulations started with a coarser grid and periodically increased when the small spatial scales developed: this required a periodic check on the saturation of the spectrum of the solution (the vorticity), and the new resolution was adopted before all the modes were excited. The maximum attained grid was
 $32\,768\times 32\,768$ for the larger
 $Re$. Thanks to the spectrally accurate spatial discretization, the numerical errors are mainly due to the time discretization. Therefore, the numerical scheme has third-order convergence. We did not use any filtering technique for the vortex layer computations, as the viscosity damps the growth of the round-off error. Instead, filtering was necessary for the BR computations; see § 4.1.
2.2. Roll-up, enstrophy dissipation and mixing
In this section, we analyse the dynamics of the vortex layer flow for all the  $Re$ considered. We shall see how, in all cases, the roll-up of the layer and the formation of two vortex cores characterizes the first stage of the evolution. This is analysed in § 2.2.1. The subsequent stages, instead, depend on
 $Re$. In the moderate- to high-
 $Re$ regime (
 $5\times 10^3 \leqslant Re<7.5\times 10^4$), we shall observe strong enstrophy dissipation with palinstrophy growth and mixing events; see § 2.2.2. For the low-
 $Re$ regime (
 $Re\sim 10^3$), one observes none of the above: the merging of the two cores is the only phenomenon worth mentioning, see § 2.2.3.
2.2.1. Initial stage: core formation
In figures 1 and 2, we show the vorticity distribution and the material curve  $\mathcal {C}$ for the moderate- to high-
 $Re$ and the low-
 $Re$ regimes, respectively.
The vorticity distribution at various times for  $Re=2\times 10^{4}$ (a–c) and the corresponding palinstrophy distribution density (d–f): (a)
 $\omega$ at
 $t=2.4$; (b)
 $\omega$ at
 $t=2.875$; (c)
 $\omega$ at
 $t=4.2$; (d)
 $|\boldsymbol {\nabla }\omega |^2$ at
 $t=2.4$; (e)
 $|\boldsymbol {\nabla }\omega |^2$ at
 $t=2.875$; (f)
 $|\boldsymbol {\nabla }\omega |^2$ at
 $t=4.2$. Only one main core is shown, the other is obtained by symmetry with respect to the point
 $(0,{\rm \pi} )$. The black lines represent the material curve
 $\mathcal {C}$ computed by (2.10a,b). At
 $t=2.4$, when mixing effects are evident, the total palinstrophy begins to increase; see also figure 3. We report the case
 $Re=10^4$ in supplementary movie 1 available at https://doi.org/10.1017/jfm.2021.966.

The vorticity distribution at various times for  $Re=10^{3}$ (a–c) and the corresponding palinstrophy density distribution (d–f): (a)
 $\omega$ at
 $t=3.2$; (b)
 $\omega$ at
 $t=4.6$; (c)
 $\omega$ at
 $t=10$; (d)
 $|\boldsymbol {\nabla }\omega |^2$ at
 $t=3.2$; (e)
 $|\boldsymbol {\nabla }\omega |^2$ at
 $t=4.6$; (f)
 $|\boldsymbol {\nabla }\omega |^2$ at
 $t=10$. The black lines represent the material curve
 $\mathcal {C}$ computed by (2.10a,b). The roll-up behaviour, typical of the vortex layer motion, is visible. The palinstrophy distribution attains its maxima on the braids in the vicinity of the core.

We recall that in the limit  $Re\rightarrow \infty$, the initial datum (2.7) consists of the sinusoidal vortex sheet originally introduced in Moore (Reference Moore1978), and that a pair of curvature singularities, symmetric with respect to the origin, appears in the vortex sheet curve (Cowley et al. Reference Cowley, Baker and Tanveer1999). Here the initial datum is regular, and no singularity, in the NS solution, can develop; however, in the layer motion, one can observe physical events associated with the blow-up in the vortex sheet solution. In fact, the vorticity within the layer is advected toward the points where the Moore singularities would be in the case
 $Re\rightarrow \infty$. At these points, as a consequence of the incompressibility, the layer bulges outwards. This leads to the formation of two symmetric cores of vorticity, with trailing arms that wrap around them (the cores are visible, at different times, in figures 1(a,b) and 2(a,b) for
 $Re=2\times 10^4$ and
 $Re=10^3$, respectively). We can interpret core formation also in terms of the winding of
 $\mathcal {C}$: for high enough
 $Re$, this curve, as already mentioned, closely follows the dynamics predicted by the vortex sheet equation, thereby showing the typical roll-up. The vorticity carried by the curve
 $\mathcal {C}$, consequently, mixes and folds because different points of the curve get very close; see figure 1(a–c). The result is the formation of a vortex core around which increasing portions of the curve wrap, leading to the growth of the core. It is clear that this stage resembles and replicates the initial roll-up stage encountered in many vortex-sheet flows and governed by the Kelvin–Helmholtz instability which is independent from the
 $Re$ number. The stage following this core formation shows phenomena that depend upon two different
 $Re$ regimes.
2.2.2. Moderate- to high- $Re$ regime, $5\times 10^3\leqslant Re\leqslant 1.5\times 10^5$


In the moderate- to high- $Re$ regime, we have detected intense mixing events. These events are, in general, associated to phenomena producing filament-like structures and enhancement of vorticity gradients with the growth of the palinstrophy
 $\mathcal {P}=\|\boldsymbol {\nabla } \omega \|^2$, see Ayala & Protas (Reference Ayala and Protas2014) for further characterizations of the mixing events. For a 2D flow with periodic boundary conditions one can write the following equations for the energy
 $\mathcal {E}=||{\boldsymbol {u}}||^2/2$, the enstrophy
 $\varOmega =||\omega ||^2$ and the palinstrophy
 $\mathcal {P}$:
 $$\begin{gather} \frac{\textrm{d}\mathcal{E}}{\textrm{d}t}={-}\frac{1}{Re} \varOmega(t) \end{gather}$$
 $$\begin{gather}\frac{\textrm{d}\varOmega}{\textrm{d}t}={-}\frac{2}{Re} \mathcal{P}(t) \end{gather}$$
 $$\begin{gather}\frac{\textrm{d}\mathcal{P}}{\textrm{d}t}={-}\frac{2}{Re} \|\boldsymbol{\nabla} \boldsymbol{\theta} \|^2-2 \int_{D}\boldsymbol{\theta}\boldsymbol{\cdot}\boldsymbol{\nabla}\,\boldsymbol{\theta} \boldsymbol{\cdot} \boldsymbol{u}\, \textrm{d}\boldsymbol{x}, \end{gather}$$
where  $\boldsymbol {\theta }=\boldsymbol {\nabla }^{\perp }\omega$. These equations imply that
 $\mathcal {E}$ and
 $\varOmega$ are always decreasing in time and bounded by their initial values
 $\mathcal {E}(0)$ and
 $\varOmega (0)$, whereas
 $\mathcal {P}$ can increase, locally in time, depending on the sign of
 $\mathcal {R}=-2\int _{D}\boldsymbol {\theta }\boldsymbol {\cdot }\boldsymbol {\nabla }\, \boldsymbol {\theta } \boldsymbol {\cdot } \boldsymbol {u} \,\textrm {d}\boldsymbol {x}$ and its balance with the
 $\mathcal {P}$-dissipation rate
 ${2}\|\boldsymbol {\nabla } \boldsymbol {\theta } \|^{2}/{Re}$.
During the layer's motion, we recognize the occurrence of intense mixing resulting from the continuous stretching and folding of the vortical structure. Folding relates to the core's spiraling and, therefore, to the rapid movement of the braids’ particles toward the centre. At the same time, one observes a strong stretching of the braids so that their local thickness diminishes, creating the thin vortex filament structure shown in figures 1(a)–1(c). To see how the stretching of the braids relates to the growth of the vorticity gradients (and, therefore, of the palinstrophy), we write the equation for the evolution of  $\boldsymbol {\theta } =\boldsymbol {\nabla }^\perp \omega$:
 \begin{equation} \partial_t \boldsymbol{\theta} +\boldsymbol{u} \boldsymbol{\cdot} \boldsymbol{\nabla} \boldsymbol{\theta} -\boldsymbol{\theta} \boldsymbol{\cdot}\boldsymbol{\nabla} \boldsymbol{u} =\frac{1}{Re}\Delta \boldsymbol{\theta} . \end{equation}
Note how the mathematical structure of the above equation resembles the 3D vorticity equation, with the presence of convective and stretching effects. Only the stretching term  $\boldsymbol {\theta }\boldsymbol {\cdot } \boldsymbol {\nabla } \boldsymbol {u}$ can contribute to the growth of
 $\boldsymbol {\theta }$ along the particle path. One can interpret the stretching term as the derivative of the velocity field along
 $\boldsymbol {\theta }$, that is (given that
 $\boldsymbol {\theta }$ is mostly tangential to the curve), along the direction tangential to the curve. Therefore, the stretching term can lead to the growth of the vorticity gradients only when a significant amount of stretching along the curve is present.
The time evolution of the palinstrophy is shown in figure 3. In figures 1(d)–1(f), we show, for  $Re=2\times 10^4$ and at selected times, the corresponding palinstrophy density. At
 $t=2.4$, when
 $\mathcal {P}(t)$ begins to increase, the maximum palinstrophy density is reached on the braid above the core of the vortex, see figure 1(d). Subsequently, the palinstrophy density rapidly increases on the braid below the core, see figure 1(e,f). At
 $t\approx 2.875$, the flow reaches its maximum palinstrophy density, which is of the order of
 $10^6$; at this time,
 $\mathcal {P}(t)$ also reaches a peak. Later, palinstrophy density weakens, and its maximum value decreases monotonously. Similar behaviour is present in the case
 $Re=10^4$, shown in supplementary movie 1, where the growth of the palinstrophy density occurs in the time range
 $2.75\lessapprox t\lessapprox 3.25$.
The rescaled palinstrophy  $\tilde {\mathcal {P}}(t)=\mathcal {P}(t)Re^{-3/2}$. For
 $Re\geqslant 5\times 10^{3}$, the palinstrophy increases due to the mixing events characterizing the flow evolution: during these events, an intense stretching of the central curve is seen, see figure 12. For
 $Re=10^{3}$, we do not observe this phenomenon.

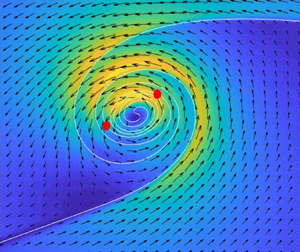
Another striking phenomenon one can observe is the formation of recirculation regions that, when the spiral begins to turn, are strong enough to create reverse flows (on the upper part of the layer to the left of the core, and on the lower part of the layer to the right of the core), see figure 4(a). These reverse flows, which cause the flow above and below the curve to have the same direction, weaken the jump across the curve, so that the vorticity  $\omega _{\mathcal {C}}$ develops two minima. In figures 4(a)–4(c), these minima are marked with red dots; with (
 $\times$) we have marked the stagnation point, where the flow reverses its direction to the left of the core. The stagnation point to the right of the core, not visible in the figures, is close to the upper-right corner of the figures. These stagnation points separate the arms of the spiral from the inner part of the spiral: all the vorticity between these stagnation points is convected toward the core of the spiral. Between the two minima, vorticity reaches, at the centre of the spiral, a peak. This is visible in figure 5(b), where we plot, at different times, the vorticity
 $\omega _{\mathcal {C}}$ in terms of the arc length
 $s$ of
 $\mathcal {C}$.
The kinetic energy density ( $|\boldsymbol {u}|^2/2$) for
 $Re=2\times 10^4$ at various times: (a) at
 $t=2.4$; (b) at
 $t=2.875$; (c) at
 $t=4.2$. The arrows represent the velocity
 $\boldsymbol {u}$, the red points are the points of minimal vorticity on the central curve
 $\mathcal {C}$, the red symbol
 $\times$ signals the point of minimal kinetic energy on the layer outside the core.

The vorticity  $\omega _{\mathcal {C}}(s)$ on the material curve at different times for (a)
 $Re=10^{3}$ and (b)
 $Re=2\times 10^{4}$. The origin of
 $s$ is
 $(0,{\rm \pi} )$, and data are shown only for
 $s\geqslant 0$ (curve are extended by parity for
 $s<0$). For
 $Re=2\times 10^{4}$, at
 $t=2.4$, the transport of vorticity from the layer braid to the main core, leads to high values of the vorticity between the two minima. This phenomenon is also observable for
 $Re\geqslant 5\times 10^{3}$, but not for
 $Re=10^{3}$.

At  $t=2.4$, that is when palinstrophy begins to increase, the peak of vorticity is reached at the centre of the core, delimited by the two local minima.
The above description of the layer motion in terms of palinstrophy growth replicates similar analyses already present in literature for different vorticity configurations (Ayala & Protas Reference Ayala and Protas2014; Kimura & Herring Reference Kimura and Herring2001). In the geophysical literature the study of the palinstrophy has been shown to be a useful tool to understand vorticity evolution during extreme events, see Schubert et al. (Reference Schubert, Montgomery, Taft, Guinn, Fulton, Kossin and Edwards1999) and Abarca & Corbosiero (Reference Abarca and Corbosiero2005).
2.2.3. Low-$Re$ regime

In the low- $Re$ regime, as opposed to the moderate- to high-
 $Re$ regime, we have observed neither mixing events nor palinstrophy growth. In figure 2(e,f), we can see that the roll-up process is also accompanied by the formation of local maxima in the palinstrophy density in the braids in the vicinity of the cores. In this case, compared with the moderate- to high-
 $Re$ regime, the flow evolution is characterized simply by the large-scale motion of the two symmetric cores. Moreover, due to high dissipative effects, the two cores are very weak, and they are not strong enough to produce significant stretching of the braids. Consequently, the palinstrophy density is always low (of the order of
 $10^2$ and
 $10^3$ in the braid), whereas palinstrophy
 $\mathcal {P}(t)$ never increases, see figure 3. For low
 $Re$ one never sees the formation of the minimum of
 $\omega _\mathcal {C}$ on the left of the maximum (see figure 5a), an event that, instead, characterizes the moderate- to high-
 $Re$ regime. The final significant event is the merging of the two cores, visible in figure 2(c).
From the analysis of the previous subsections 2.2.2 and 2.2.3, one can conclude that, in both cases, the linear Kelvin–Helmholtz instability, which causes the roll-up of the layer, rules the initial stages of the dynamics. The subsequent stages are determined by the competition between viscous dissipation and stretching, see (2.14) and (2.15), which is a fully nonlinear phenomenon. For lower  $Re$, dissipation dominates, palinstrophy decreases, and no small-scale phenomena appear. Increasing the
 $Re$, stretching dominates over dissipation and causes the growth of palinstrophy and vorticity gradients: small scales (that, in § 3, we shall interpret in terms of complex singularities) not damped by viscosity appear, ultimately evolving in the concentration of vorticity.
The analysis of the Fourier energy spectra gives further evidence to these phenomena and adds more meaning to them. We define the kinetic energy density  $\mathcal {K}\equiv |\boldsymbol {u}|^2/2$ and, in figure 6(a,b), we show the 1D spectrum obtained from
 $\mathcal {K}$ through shell summation
 \begin{equation} A_K=\sum_{K\leqslant|(k_x,k_y)| < K+1}| \hat{\mathcal{K}}_{k_x,k_y}|,\quad K\geqslant0, \end{equation}
where  $\hat {\mathcal {K}}_{k_x,k_y}$ are the Fourier modes of
 $\mathcal {K}$. In figure 6(a), one can note the appearance of a range of growing modes: these modes are intermediate between the range of small wavenumbers (related to the large-scale feature of the fluid motion) and the range of large wavenumbers (very small scales, within the dissipative range). The growth of the intermediate modes coincides with the palinstrophy growth phase. Therefore, it is not observable for
 $Re<5\times 10^3$, that is, when dissipation dominates, it is barely visible for
 $Re=5\times 10^3$, and clearly noticeable for
 $Re\geqslant 10^4$.
(a) Energy density spectrum for  $Re=2\times 10^4$ at different times. A range of growing uncoupled modes emerge during the palinstrophy growth phase. (b) Energy density spectrum for various
 $Re$ at the time of palinstrophy peak. In the inset the spectrum for
 $Re=10^3$ for which no growing range is observed. (c) The most excited mode
 $K_e$ in the uncoupled range vs the
 $Re^{1/2}$, and the best power-law fitting curve.

The appearance of the above-described range of excited modes is related to the appearance of the  $O(Re^{-1/2})$ structure, that is, the core that forms due to intense stretching and fast rotation. In fact, the most excited wavenumber
 ${K_e}$ in this range, measured at the time of the palinstrophy peak, follows quite well the law
 ${K_e}\approx 0.42Re^{1/2}$, as shown in figure 6(c). The excitation of the intermediate modes, therefore, is another sign of the bifurcation occurring at approximately
 $Re \approx 5\times 10^3$.
The phenomena we have encountered in this section, such as palinstrophy growth and the excitation of the intermediate range of modes, are observed, during transition regimes, in flows ruled by very different mechanisms, such as boundary layers, mixing layers and jet flows. For instance, in boundary layer flows, the palinstrophy grows during the transition to the small-scale regime, which governs the interactions between the boundary layer and the inviscid outer flow for large enough  $Re$ numbers (Gargano, Sammartino & Sciacca Reference Gargano, Sammartino and Sciacca2011; Gargano et al. Reference Gargano, Sammartino, Sciacca and Cassel2014). This transition, as shown in Nguyen Van Yen et al. (Reference Nguyen Van Yen, Waidmann, Klein, Farge and Schneider2018), appears to be related to the instabilities forming in the reversed flow region near the wall; the range of unstable wavenumbers scales as
 $Re^{1/2}$. In mixing layers and jet flows (Catrakis & Dimotakis Reference Catrakis and Dimotakis1996; Dimotakis Reference Dimotakis2000; Cook & Dimotakis Reference Cook and Dimotakis2001; Dimotakis Reference Dimotakis2005), the transition to turbulence is accompanied by the formation of large vorticity gradients, along with a typical energy spectrum behaviour: the mechanism of decoupling of the inner scales (viscously damped) from the outer scales (characterizing the large-scale motion), responsible for the transition to turbulence is the same we have encountered in analysing the energy spectrum of the vortex layers.
No vorticity is generated during the vortex layers’ evolution, contrary to what is quintessential of the boundary layer dynamics. Moreover, vortex layers do not evolve in turbulent flows, as it happens for mixing layers. Nevertheless, we have seen that all these configurations show striking similarities; among them, we also mention the existence of a Reynolds number bifurcation value, in all cases laying between  $5\times 10^3$ and
 $10^4$. All this suggests the existence of a common mechanism of competition between dissipation and vorticity gradients creation that, for high enough
 $Re$, triggers the transition toward states characterized by small scales excitation, mixing and vorticity concentration.
2.3. Vortex layer solution for $Re\rightarrow \infty$: self-similar behaviour

In this section, we shall compare the behaviours of the material curve  $\mathcal {C}=(x(\theta ),y(\theta ))$ at different
 $Re$. In figure 7, the curve
 $\mathcal {C}$ is shown at time
 $t=4$ for increasing
 $Re$, starting from
 $Re=1000$. It is evident that outside the core of the spiral the various curves collapse onto a single curve, whereas inside the core the spirals are strongly dependent on the
 $Re$ number: the roll-up process is more intense for increasing
 $Re$, and, at a fixed time, the spiral contains more windings as
 $Re$ increases. On the other hand, one can see that once rescaled with
 $Re^{1/2}$, the curves inside the core coincide. In fact, we introduce the spatial scaling
 \begin{equation} X_{Re}(\theta)=Re^{1/2}\left(x(\theta)-x_c\right),\quad Y_{Re}(\theta)=Re^{1/2}\left(y(\theta)-y_c\right), \end{equation}
where the point  $(x_c,y_c)$ is the centre of the spiral, that is, the point of
 $\mathcal {C}$ with the highest vorticity. In figures 8(a) and 8(b), the scaled curves are shown when two and three windings have already formed, respectively. The winding of the spirals are defined as follows: we assume that the first winding begins when, for the first time, the tangent at
 $(x_c,y_c)$ is vertical, whereas the
 $(k+1)$th winding begins when the tangent at
 $(x_c,y_c)$ forms an angle of
 ${\rm \pi} /2+k{\rm \pi}$,
 $k\geqslant 0$, with the horizontal direction. For
 $Re\geqslant 5\times 10^3$, the rescaled curves collapse onto a single spiral, especially in the innermost part of the core. The fact that, instead, for
 $Re=10^3$, the scaled curve has an entirely different form, shows once again the separation between the two, low and moderate–high,
 $Re$ regimes.
The central curve  $\mathcal {C}$ at
 $t=4$ for various
 $Re$. Outside the spiral region, all the curves collapse onto a single curve.

Self-similarity of the central curve inside the core. The spirals, rescaled as (2.17a,b), when two (a) and three (b) windings are formed. The times are  $t\approx 6.48,3.74,3.16,2.74$ for (a) and
 $t\approx 7.98,4.25,3.5,2.98$ for (b).

Figure 9(a,b) shows the same comparison of figure 8, at the time in which the derivatives in the  $x$ and
 $y$ direction, respectively, vanish, that is, when the first winding begins to form and when the curve has done half a turn. In figure 9(c), we report the times at which the above events occur, where it is evident that the spatial scaling (2.17a,b) should be complemented with the temporal scaling
 \begin{equation} T=Re^{1/3} (t-t_s), \end{equation}
where  $t_s$ the singularity time for the BR equation.
(a) The rescaled curves at the beginning of the first winding when the  $x$-derivative vanishes. (b) The rescaled curve when the
 $y$-derivative vanishes. (c) Plots in log–log scale of the times
 $t-t_s$ at which the first winding begins (vanishing of the
 $x$-derivative of
 $\mathcal {C}$) and when
 $\mathcal {C}$ does half a turn (vanishing of the
 $y$-derivative of
 $\mathcal {C}$), as function of the
 $Re$. Here
 $t_s=1.507$ is the time in which BR solution develops singularity. Both curves follow the time scaling
 $t-t_s\sim Re^{-1/3}$.

The above scaling suggests that in the limit  $Re\rightarrow \infty$, the layer shrinks to a vortex-sheet curve satisfying, at
 $t\rightarrow t_s^{+}$, the conditions
 $\partial _\theta x,\partial _\theta y\rightarrow 0$ in its centre. This would imply the blow-up of the curvature
 $\kappa _\mathcal {C}(\theta,t)=(x_\theta y_{\theta \theta }- y_\theta x_{\theta \theta })/((x_\theta ^2+y_\theta ^2)^{3/2})$ and of the true vortex sheet strength
 \begin{equation} \hat{\gamma}_\mathcal{C}(\theta,t)\propto|(x_\theta,y_\theta)|^{{-}1}=|\partial_\theta s(\theta)|^{{-}1}, \end{equation}
where  $\hat {\gamma }_\mathcal {C}(\theta,t)$ is classically interpreted as a measure of the circulation density.
In figure 10(a), we show the behaviour of  $\kappa _\mathcal {C}$ for
 $Re=7.5\times 10^4$ at different times; one can observe how, at
 $t=1.9275$, the curvature has dramatically increased its maximum magnitude at two different points. These points are close to the centre of the spiral, and visible as empty black squares in figure 10(c). Figure 11(a), where we report, for different
 $Re$, the time evolution of
 $\textrm {max}_{\theta }|\kappa _\mathcal {C}|$, gives more support to the diverging behaviour at
 $t_s$ for
 $Re\rightarrow \infty$.
Singular-like behaviour of the central curve  $\mathcal {C}$ for
 $Re=1.5\times 10^5$. (a) The behaviour, at different times, of the curvature
 $\kappa _\mathcal {C}$ of the central curve
 $\mathcal {C}$ for
 $Re=1.5\times 10^5$. At
 $t_{1w}=1.845$, the time at which the first winding begins,
 $\kappa _\mathcal {C}$ has dramatically increased its maximum magnitude in two different points, close to the centre of the spiral. (b) The behaviour, at different times, of
 $\hat {\gamma }_{\mathcal {C}}$ for
 $Re=1.5\times 10^5$. At
 $t_{1w}=1.845$,
 $\hat {\gamma }_{\mathcal {C}}$ has a spike in the centre of
 $\mathcal {C}$, and its maximum value significantly increases. (c) The curve
 $\mathcal {C}$ for
 $Re=1.5\times 10^5$ at different times. In the inset, the magnification. Black circles are points of maximum
 $\hat {\gamma }_{\mathcal {C}}$; empty black squares are points of maximum curvature
 $\kappa _\mathcal {C}$ which tend to collapse on the centre of the curve.

The time behaviour of the maxima of the curvature  $\kappa _\mathcal {C}$ and vortex strength
 $\hat {\gamma }_{\mathcal {C}}$. (a) The maximum value of the curvature
 $\kappa _\mathcal {C}$ for various
 $Re$ up to the time in which the first winding forms in the layer. For increasing
 $Re$ this value rapidly increases after
 $t_s=1.507$, with
 $t_s$ being the singularity time for the vortex sheet solution of the BR equation. (b) The maximum value of
 $\hat {\gamma }_{\mathcal {C}}$ for various
 $Re$, up to the time in which the first derivative of the
 $x$-component vanishes. The maximum value is always reached in the centre of the curve, that is, the point having the highest vorticity
 $\omega _{\mathcal {C}}$. The black dotted horizontal line is the maximum value of the true vortex strength
 $\hat {\gamma }_{BR}$ computed from the BR-vortex sheet motion at the singularity time
 $t_s$.

For a vortex-sheet curve, the true vortex strength  $\hat {\gamma }_\mathcal {C}$ is a well-defined quantity. Instead, for a viscous layer, at each point
 $s$ of
 $\mathcal {C}$, we measure the vortex layer strength
 $\hat {\gamma }_{\mathcal {C}}$ as the total vorticity integrated along the normal to the curve at that point. The roll-up of the layer limits the application of this procedure: we have found that we can obtain a reliable measure of
 $\hat {\gamma }_{\mathcal {C}}$ only up to the formation of the first winding. In figure 10(c), we show the behaviour of
 $\hat {\gamma }_{\mathcal {C}}$, for
 $Re=7.5\times 10^4$, at
 $t=1.507,1.75,1.9275$. In figure 11(b) we report, at different
 $Re$, the maximum values attained by
 $\hat {\gamma }_{\mathcal {C}}$, up to the time in which the first winding forms: it is evident that this value rapidly increases both with time and for larger
 $Re$, although the predicted diverging behaviour for
 $t\rightarrow t_s^{+}$ is less evident if compared with the eruptive behaviour of the maximum curvature
 $\textrm {max}_{\theta }\kappa _{\mathcal {C}}$. The point of
 $\mathcal {C}$ having the highest value of
 $\hat {\gamma }_{\mathcal {C}}$ is the centre of the spiral, and visible as a black circle in figure 10(c).
We also note that the net circulation of the core of the layer decreases for increasing  $Re$. To measure the circulation of the core, we have adopted a procedure similar to that used in Baker & Shelley (Reference Baker and Shelley1990). In particular, we consider two material curves
 $\mathcal {C}_{{up}},\mathcal {C}_{{down}}$ consisting on particles initially placed at a distance
 $dRe^{-1/2}$ above and below the curve
 $\mathcal {C}$. The real positive parameter
 $d$ sets how distant
 $\mathcal {C}_{{up}}$ and
 $\mathcal {C}_{{down}}$ are from
 $\mathcal {C}$. The core of the layer at each time is then the region bounded by
 $\mathcal {C}_{{up}},\mathcal {C}_{{down}}$ on the one hand, and by the straight lines starting from the point of maximum curvature in
 $\mathcal {C}_{{up}}$ (or
 $\mathcal {C}_{{down}}$) and reaching the closest point in
 $\mathcal {C}_{{down}}$ (or
 $\mathcal {C}_{{up}}$) on the other. One can, therefore, compute the circulation of the core as the integral of the vorticity over this area. We have checked at several times, and for different values of
 $d$, that the circulation decreases for increasing
 $Re$, meaning that most of the vorticity is concentrated outside the core of the layer.
If the depicted trend continues in the limit  $Re\rightarrow \infty$, the vortex layer tends to a vortex sheet curve with diverging curvature and true vortex strength, and zero circulation increment in its centre. This possible blow up implies also
 $\partial _\theta s(\theta )=0$, so that the flow particles coalesce in the centre of
 $\mathcal {C}$ where the true vortex strength becomes infinite. In that case,
 $\hat {\gamma }_\mathcal {C}$ is the true vortex strength defined on a vortex sheet curve, and goes like
 $|\partial _\theta s(\theta )|^{-1}$. Hence, the collision condition
 $\partial _\theta s(\theta )=0$ is satisfied only when the true vortex strength diverges. This structure is also consistent with the results shown in Baker & Shelley (Reference Baker and Shelley1990), where the authors found the same asymptotic behaviour in the zero-thickness limit of an inviscid vortex layer of uniform vorticity. A similar conclusion has been proposed also in DeVoria & Mohseni (Reference DeVoria and Mohseni2018) where the authors showed that the true vortex strength of an inviscid vortex sheet rapidly increases just after the singularity time of the BR solution.
The diverging behaviour of  $\kappa _\mathcal {C}$ and
 $\hat \gamma _{\mathcal {C}}$ will receive further evidence from the singularity analysis we shall present in § 3.2.
3. Singularity analysis for the vortex layer
In this section, we describe how the dynamics of the vortex layer generates complex singularities in the solution of the NS equations. Tracking of these singularities in the complex plane could shed light on some aspects related to the layer dynamics, in the spirit of similar other analysis performed in fluid dynamics (see Caflisch et al. Reference Caflisch, Gargano, Sammartino and Sciacca2015). Here we briefly recall that if an analytic function  $u(z)$ has a complex singularity at
 $z^*$ and
 $u(z) \approx (z-z^*)^\mu$ as
 $z\rightarrow z^*$, then
 $\mu$ is the character of the singularity. The estimate of
 $\mu$ predicts the singular behaviour of
 $u$ if the singularity
 $z^*$ becomes real.
For the viscous layer the complex singularities never become real (smooth solutions of the 2D NS equations remain smooth, so that loss of regularity is impossible); however, we shall observe that, during the flow evolution, the singularities can get very close to the real axis, and that the minimal distance becomes zero asymptotically when  $Re\rightarrow \infty$. We shall also see how the singularities behave (in terms of character) differently in the two
 $Re$ regimes that we have identified in the previous section, low (
 $Re\leqslant 10^3$) and moderate–high (
 $5\times 10^3\times Re\leqslant 1.5 \times 10^5$).
We shall base our investigation mainly on the analysis of  $\omega _{\mathcal {C}}$, the vorticity on the curve
 $\mathcal {C}$; see § 3.1. In § 3.2, we shall also briefly consider the curvature
 $\kappa _\mathcal {C}$ and the vortex strength
 $\hat {\gamma }_{\mathcal {C}}$.
To perform the singularity analysis, we shall use the Borel–Polya–van der Hoeven (BPH) method, exposed in more detail in Appendix A; initially proposed in Pauls & Frisch (Reference Pauls and Frisch2007), it allows us to retrieve information on the positions and the characters of the algebraic singularities of an analytic function.
All the quantities we shall analyse in the following will be expressed as Fourier series in terms of the Lagrangian variable  $\theta \in [0,2{\rm \pi} ]$, rather than the arc length
 $s(\theta )$.
3.1. Singularity tracking for the vorticity $\omega _{\mathcal {C}}$

We have already seen how the vorticity on the curve,  $\omega _{\mathcal {C}}$, develops two minima (in the moderate- to high-
 $Re$ regime, whereas for low
 $Re$, there is only one minimum), which separate the inner from the outer core. These minima correspond to zones where the formation of sharp vorticity gradients occurs, with associated intense stretching of the curve. See the discussion after (2.15), where we explained how stretching and growth of vorticity gradients are closely related.
In figure 12(a), we show, for  $Re=2\times 10^4$,
 $\omega _\mathcal {C}$ both as a function of
 $\theta$ and the arc length
 $s(\theta )$: the presence of the minima and sharp gradients is evident. The stretching of the curve is apparent in figure 12(b), where one can see that the function
 $s(\theta )$ increases (strongly, after time
 $t=2$) in correspondence with the minima of
 $\omega _\mathcal {C}$. It is also remarkable that, between the two stretching regions, there is a zone where
 $s(\theta )$ is almost flat, which implies that fluid particles that initially were well separated are almost coalescing.
(a) The vorticity  $\omega _\mathcal {C}$ along the material curve
 $\mathcal {C}$ is shown as a function of both
 $\theta$ and
 $s(\theta )$ for
 $Re=2\times 10^4$ at
 $t=3$. In
 $s(\theta )$, high gradients form corresponding to the minima of
 $\omega _\mathcal {C}$, where the stretching of
 $\mathcal {C}$ is present. (b) Arc length of the curve
 $\mathcal {C}$ as a function of the parameter
 $\theta$ for
 $Re=2\times 10^4$ from
 $t=2$ to
 $t=3$ (time steps of
 $0.2$). The curve
 $\mathcal {C}$ is elongated close to the points where vorticity is transported from the layer braid to the core of the layer (see also figure 5b). In the centre of the core, where
 $s(\theta )$ is almost flat, a strong compression (coalescence of fluid particles) along the curve is present.

In this section, we show how the vorticity minima are related to the presence of complex singularities in  $\omega _{\mathcal {C}}$, and how one can characterize the two flow regimes (low and moderate–high
 $Re$) in terms of the behaviour of the trajectory of the complex singularities.
We were able to detect and track in time, for all the  $Re$ considered, two main singularities whose complex locations are denoted with
 $\theta ^{\omega _\mathcal {C}}_1=\theta _1+\textrm {i}\theta _{im_1}$ and
 $\theta ^{\omega _\mathcal {C}}_2=\theta _2+\textrm {i}\theta _{im_2}$ (from the symmetry of the problem there are also singularities at
 $2{\rm \pi} -\theta ^{\omega _\mathcal {C}}_1$ and
 $2{\rm \pi} -\theta ^{\omega _\mathcal {C}}_2$). Hereafter, we label these singularities (and all the singularities we introduce in the sequel) with their locations. These two singularities are indeed related to the minima in
 $\omega _\mathcal {C}$, as they have real components that correspond to the local minima visible, for instance, in figure 12(a) for
 $Re=2\times 10^4$.
To highlight the different behaviour of  $\theta ^{\omega _\mathcal {C}}_1$ and
 $\theta ^{\omega _\mathcal {C}}_2$, we show in figures 13 the path of the singularities in the complex plane
 $(s(\theta ),\theta _{im})$. All the tracking start at
 $t=2$, up to
 $t=5.9$ for
 $Re=10^{3}$, up to
 $t=3.25$ for
 $Re=10^{4}$, and up to
 $t=2.85$ for
 $Re=2\times 10^{4}$: these final times are the time of formation of the third winding for
 $Re=10^{3}$ and the times in which palinstrophy has its local maximum (
 $Re=10^{4},2\times 10^{4}$), respectively. We can observe different behaviours depending on the
 $Re$ number, mainly in the position of
 $\theta ^{\omega _\mathcal {C}}_1$. In fact, for
 $Re=10^{4},2\times 10^{4}$ (and also for
 $Re=5\times 10^{3}$, not shown here), after an initial period in which the singularity moves toward the real plane having almost fixed real part
 $s(\textrm {Re}\{\theta ^{\omega _\mathcal {C}}_1\})$, during the mixing events
 $\theta ^{\omega _\mathcal {C}}_1$ begins to rapidly shift on the right along
 $s$ and to move toward the second singularity
 $\theta ^{\omega _\mathcal {C}}_2$. See also supplementary movie 2 where, for the case
 $Re=10^4$, we report the time evolution of the singularities in the complex plane and the corresponding vorticity evolution: red and black dots in the central curve are the points corresponding to the real parts of the singularities. When
 $\theta ^{\omega _\mathcal {C}}_1$ is sufficiently close to the real domain, the local minimum visible, for instance, in figure 5(b) forms.
Tracking the singularities  $\theta ^{\omega _\mathcal {C}}_1$ (a) and
 $\theta ^{\omega _\mathcal {C}}_2$ (b) for various
 $Re$ in the complex plane
 $(s(\theta ),\theta _{im})$ (see supplementary movie 2 for the case
 $Re=10^4$). The blue dot is for time
 $t=2.4$, red dot is for time
 $t=2.7$, green dot is
 $t=2.85$. All the tracking starts from
 $t=2$, up to
 $t=5.9$ for
 $Re=10^{3}$, to
 $t=3.25$ for
 $Re=10^{4}$, and up to
 $t=2.85$ for
 $Re=2\times 10^{4}$. These final times are, respectively, the time of formation of the third winding for
 $Re=10^{3}$, and the times at which palinstrophy has its local maximum for
 $Re=10^{4},2\times 10^{4}$.

On the other hand, in the case  $Re=10^{3}$,
 $\theta ^{\omega _\mathcal {C}}_1$ always moves leftward along
 $s$. At
 $t\approx 5.9$, that is when the third winding forms in
 $\mathcal {C}$,
 $\theta ^{\omega _\mathcal {C}}_1$ collapses to
 $s(0)=0$ with the symmetric singularity
 $2{\rm \pi} -\theta ^{\omega _\mathcal {C}}_1$. As already stated in the previous section, no mixing events are observed for
 $Re=10^{3}$, no new local minimum for
 $\omega _\mathcal {C}$ on the left of the maximum and, from the point of view of the complex singularity
 $\theta ^{\omega _\mathcal {C}}_1$ always moves toward the origin
 $s=0$ and never moves toward the second singularity
 $\theta ^{\omega _\mathcal {C}}_2$.
In the qualitative behaviour of  $\theta ^{\omega _{\mathcal {C}}}_2$, we observe no difference related to
 $Re$: in all
 $Re$ regimes, initially,
 $\theta ^{\omega _\mathcal {C}}_2$ moves toward the real domain slightly shifting leftward along
 $s$, then goes rightward, still approaching the real axis, see figure 13(b).
Therefore,  $\theta ^{\omega _\mathcal {C}}_1$ plays the key role in the formation of the intense mixing and the concentration phenomena occurring for higher
 $Re$:
 $\theta ^{\omega _\mathcal {C}}_1$ is responsible for the extreme stretching of the curve and, ultimately, for the palinstrophy growth; moreover, the collision of
 $\theta ^{\omega _\mathcal {C}}_1$ with the other singularity
 $\theta ^{\omega _\mathcal {C}}_2$ causes, in the limit
 $Re\rightarrow \infty$, the blow-up of
 $\hat {\gamma }_\mathcal {C}$, a phenomenon which is absent in the BR dynamics.
Using the BPH method, we have determined the algebraic characters of the singularities. Usually, it is more difficult to determine the algebraic character of a singularity rather than its position (see, e.g., Caflisch et al. Reference Caflisch, Gargano, Sammartino and Sciacca2015). However, after time  $t\geqslant 1.3$, the characters
 $\mu _{\theta ^{\omega _\mathcal {C}}_1}$ and
 $\mu _{\theta ^{\omega _\mathcal {C}}_2}$ of
 $\theta ^{\omega _\mathcal {C}}_1$ and
 $\theta ^{\omega _\mathcal {C}}_2$ have been reliably determined. For all
 $Re>10^3$,
 $\mu _{\theta ^{\omega _\mathcal {C}}_1}$ and
 $\mu _{\theta ^{\omega _\mathcal {C}}_1}$ are approximately equal to
 $1/2$, whereas, for
 $Re=10^3$, they have higher values, close to
 $0.9$, see table 1. The values
 $\mu _{\theta ^{\omega _\mathcal {C}}_1}$ and
 $\mu _{\theta ^{\omega _\mathcal {C}}_2}$ reveal that
 $\theta ^{\omega _\mathcal {C}}_1$ and
 $\theta ^{\omega _\mathcal {C}}_2$ are two branch points, consistent with the rapid variation of the first derivative of
 $\omega _{\mathcal {C}}$ close to its two local minima, see figure 12(b).
Characters of the singularities at  $t_s=1.507$. For each
 $Re$ we show the characters of the singularities: the vorticity
 $\omega _{\mathcal {C}}$,
 $\theta ^{\omega _\mathcal {C}}_{1,2}$;
 $(X_\mathcal {C},Y_\mathcal {C})$ in (4.7),
 $\theta _{1,2}^{X_\mathcal {C}}$ and
 $\theta _{1,2}^{Y_\mathcal {C}}$; the curvature
 $\kappa _{\mathcal {C}}$ of
 $\mathcal {C}$,
 $\theta _{1,2}^{\kappa _\mathcal {C}}$; and the vortex strength
 $\hat {\gamma }_{\mathcal {C}}$,
 $\theta ^{\hat {\gamma }_{\mathcal {C}}}$. Error bars are, in general, less than
 $15\,\%$ of the estimated parameters, except for the case
 $Re=10^3$, for which
 $\mu _{\theta ^{\hat {\gamma }_{\mathcal {C}}}},\mu _{\theta _{1,2}^{\kappa _\mathcal {C}}}$ have errors are up to the order of
 $80\,\%$ of the estimated parameters.

3.2. Singularity tracking for $\kappa _{\mathcal {C}}$ and $\hat {\gamma }_{\mathcal {C}}$


In § 2, we have seen that the final structure of the layer in the limit  $Re\rightarrow \infty$ could be represented by a curve having, at
 $t_s=1.507$, the singularity time of the BR solution, infinite curvature and infinite true vortex strength. We show that the possible diverging nature of both
 $\kappa _{\mathcal {C}}$ and
 $\hat {\gamma }_{\mathcal {C}}$ is confirmed by the presence of complex singularities having negative character.
The explicit expression of the curvature of the material curve  $\mathcal {C}$ is
 $\kappa _{\mathcal {C}}(\theta,t)=(x_\theta y_{\theta \theta }- y_\theta x_{\theta \theta })/((x_\theta ^2+y_\theta ^2)^{3/2})$. For all the
 $Re$ numbers considered, we have detected the presence of two complex singularities,
 $\theta _1^{\kappa _{\mathcal {C}}}$ and
 $\theta _2^{\kappa _\mathcal {C}}$. In figure 14(a), we represent the singularities in the complex plane
 $(\theta,\theta _{im})$, for different
 $Re$, at
 $t_s=1.507$ and at
 $t_{1w}$ the time when the first winding forms in
 $\mathcal {C}$.
(a) Tracking in the complex plane  $(\theta,\theta _{im})$ of the two main singularities
 $\theta _{1,2}^{\kappa _\mathcal {C}}$ of the curvature
 $\kappa _\mathcal {C}$ of
 $\mathcal {C}$. Singularities are tracked at
 $t_s=1.507$ and at the time
 $t_{1w}$ in which the first winding forms (times reported in the text and in figure 10(a) for
 $Re=5\times 10^3, 10^4, 2\times 10^4, 7.5\times 10^4$ and
 $1.5\times 10^5$). The size of the markers decreases for larger
 $Re$. The value
 $\theta =1.287$, where the BR singularity forms, is also shown as a straight line. (b) Tracking in the complex plane
 $(\theta,\theta _{im})$ of the main singularity
 $\theta ^{\hat {\gamma }_{\mathcal {C}}}$ of the vortex strength
 $\hat {\gamma }_{\mathcal {C}}$. The singularity is tracked at
 $t_s=1.507$ and at the time
 $t_{1w}$ in which the first winding forms for
 $Re=5\times 10^3, 10^4, 2\times 10^4, 7.5\times 10^4$ and
 $1.5\times 10^5$. The size of the markers decreases for larger
 $Re$. (c,d) Imaginary parts of the singularities shown in (a,b) versus the
 $Re$ number and best power-law fitting (log–log scale).

The singularities  $\theta _1^{\kappa _\mathcal {C}}$ and
 $\theta _2^{\kappa _\mathcal {C}}$ have different positions than those of
 $\omega _\mathcal {C}$, although some similarities are evident. They are closer to the real domain for increasing
 $Re$, and they tend to coalesce. In figure 14(c) we show a consistent power-law scaling
 $\theta _{im}\propto Re^{c}$, with
 $c=-0.17$ and
 $-0.16$ for the first and second singularities, respectively. This suggests that the singularities approach the real axis as
 $Re\rightarrow \infty$. (We have obtained a slightly more consistent fitting with a curve of the kind
 $\propto \log ^d(Re) Re^{c}$, although
 $d$ is a very small parameter of order
 $10^{-3}$). One can see the effects owing to the presence of these singularities in figure 10(b), where the two maximum curvature points (positive and negative) are located close to
 $s(\textrm {Re}\{{\theta _1^{\kappa _\mathcal {C}}}\})\approx 1.048$ and
 $s(\textrm {Re}\{{\theta _2^{\kappa _\mathcal {C}}}\})\approx 1.065$. Concerning the evaluation of the algebraic characters
 $\mu _{\theta _1^{\kappa _{\mathcal {C}}}}$ and
 $\mu _{\theta _2^{\kappa _\mathcal {C}}}$, we have found that both singularities have negative character at
 $t_s=1.507$ (see table 1) and
 $t_{1w}=1.9275$. The above analysis confirms that the limiting
 $Re\rightarrow \infty$ behaviour of
 $\mathcal {C}$, as far as the curvature is concerned, is entirely consistent with the behaviour observed in the BR solution. We note that the BPH method can find other complex singularities that are due to subsequent maximum points of curvature forming during the roll-up process. However, these secondary singularities are, in general, more distant from the real axis, and do not play a significant role in our analysis.
The singularity analysis of the vortex strength  $\hat {\gamma }_{\mathcal {C}}$ reveals the presence of one main singularity, denoted by
 $\theta ^{\widehat {\gamma _{\mathcal {C}}}}$, and reported in figure 14(b), for different
 $Re$, and at times
 $t_s$ and
 $t_{1w}$. The presence of
 $\theta ^{\widehat {\gamma _{\mathcal {C}}}}$ can be related to the peak in
 $\hat {\gamma }_{\mathcal {C}}$ visible, for instance, in figure 10(b) in the centre of the spiral. At
 $t_s=1.507$, the singularity is quite far from the real axis (
 $\theta ^{\hat {\gamma }_{\mathcal {C}}}\approx 1.222+\textrm {i}0.41$), and the peak has a moderate magnitude. At
 $t_{1w}=1.937$, the singularity is closer to the real axis (
 $\theta ^{\hat {\gamma }_{\mathcal {C}}}\approx 1.233+\textrm {i}0.104$), and the peak in
 $\hat {\gamma }_{\mathcal {C}}$ is more pronounced in
 $s(1.233)\approx 1.12$; see figure 10(b). Similarly to the other singularities we have analysed,
 $\theta ^{\hat {\gamma }_{\mathcal {C}}}$ gets closer to the real axis for increasing
 $Re$. The distance from the real axis of the singularities versus the
 $Re$ is shown in figure 14(d) along with the best power-law fitting curve of the kind
 $\theta _{im}\propto Re^{c}$, with
 $c\approx -0.15$. The character
 $\mu _{\theta ^{\hat {\gamma }_{\mathcal {C}}}}$ of
 $\theta ^{\hat {\gamma }_{\mathcal {C}}}$ is negative (of order
 $\approx -0.4$) for the times we have considered, and for the moderate- to high-
 $Re$ regime; see table 1 at
 $t_s$. Given that our simulation indicate that
 $\textrm {Im}\{\theta ^{\hat {\gamma }_{\mathcal {C}}}\}\rightarrow 0$ when
 $Re\rightarrow \infty$, the above singularity analysis gives further evidence for the diverging behaviour of
 $\hat {\gamma }_{\mathcal {C}}$ for
 $t\rightarrow t_s^+$, as conjectured in § 2.3.
As reported in Appendix A, one recovers the characteristics of the singularities discussed previously through fitting procedures of the solution spectra. These procedures, unavoidably, are prone to errors. Concerning the character of the singularities, which is the most delicate quantity to be estimated, for  $R\geqslant 5\times 10^3$, the amplitude of the confidence interval is
 $15\,\%$ for
 $95\,\%$ confidence level. Moreover, the goodness of the fitting model is attested by values of the
 $R^2$ coefficient very close to 1, typically between
 $0.98$ and
 $0.99$. For
 $Re=10^3$, we have obtained larger errors, especially for the characters: this is likely due to the large distance of the singularities from the real domain, making the noise-free part of the solution spectrum smaller as compared with the other cases, and governed mainly by the exponential decay, see (A1). For instance, for
 $Re=10^3$, we have obtained
 $\theta ^{\hat {\gamma }_{\mathcal {C}}}\approx 0.1\pm 0.09$; whereas, for
 $Re=10^4$,
 $\theta ^{\hat {\gamma }_{\mathcal {C}}}\approx -0.34\pm 0.025$. Moreover, the relative error decreases for increasing
 $Re$. Therefore, these errors do not affect the main conclusion of the present section, that is,
 $\hat {\gamma }_{\mathcal {C}}\rightarrow \infty$ for
 $Re\rightarrow \infty$.
4. Vortex layers versus vortex sheet motion
In this section, we describe the vortex sheet motion governed by the BR equation, we perform the singularity analysis of this solution and compare it with the results obtained for the vortex layer. To continue the BR motion after the singularity time, we use the regularization of the BR kernel resulting in the vortex-blob method.
4.1. The BR model
The initial vortex sheet corresponding to the vortex layer configuration that we have studied in previous sections consists of a vorticity distribution concentrated, as a delta function, on the curve
 \begin{equation} \boldsymbol{x}_{BR}(\theta)=(\theta,{L_y}\sin({2{\rm \pi}\theta}/{L_x})/{4{\rm \pi}}), \quad \theta\in[{-}L_x/2,L_x/2], \end{equation}
with intensity
 \begin{equation} \gamma(\theta)=1. \end{equation}
The vorticity distribution has to be considered in the box  $D=[-L_x/2,L_x/2]\times [-L_y/2,L_y/2]$ and extended by periodicity both in the
 $x$ and in the
 $y$ directions. Being
 $\gamma (\theta )=1$, the parameter
 $\theta$ identifies with the circulation
 $\varGamma =\int _0^{\theta }\gamma (\tilde \theta )\,\textrm {d}\tilde \theta$. Therefore, to compute the dynamics of the sheet, we use
 $\theta$ as a Lagrangian parameter, whereas the true vortex strength along the sheet is given by
 $\hat {\gamma }(\theta,t)=\gamma (\theta )|\partial _{\theta }\boldsymbol {x}_{BR}|^{-1}$. The choice of the Lagrangian parameter
 $\theta$ allows the evolution of the curve to be written without involving the equation for the true vortex strength
 $\hat {\gamma }(\theta,t)$ (see the interesting discussion in Lopes Filho, Nussenzveig Lopes & Shochet (Reference Lopes Filho, Nussenzveig Lopes and Shochet2007)). The BR equation hence reads as
 \begin{equation} \frac{\partial \boldsymbol{x}_{BR}(\theta,t)}{\partial t}=\int_{{-}L_x/2}^{L_x/2}{\boldsymbol{K}}_{L_x,L_y}(\boldsymbol{x}_{BR}(\theta,t)-\boldsymbol{x}_{BR}(\tilde{\theta},t)))\,\textrm{d}\tilde \theta, \end{equation}
where the components of the singular kernel are
 \begin{align} \boldsymbol{K}_{L_x,L_y}(\boldsymbol{x})&= \left(\frac{y}{L_xL_y}-\frac{1}{2L_x}\sum_{h={-}\infty}^{h=\infty}\frac{\sinh(2{\rm \pi} (y-hL_y)/L_x)}{\cosh(2{\rm \pi} (y-hL_y)/L_x)-\cos(2{\rm \pi} x/L_x)},\right.\nonumber\\ &\qquad \left.\frac{1}{2L_x}\sum_{h={-}\infty}^{h=\infty}\frac{\sin(2{\rm \pi} x/L_x)}{\cosh(2{\rm \pi} (y-hL_y)/L_x)-\cos(2{\rm \pi} x/L_x)}\right). \end{align}
One can obtain the above expression taking the orthogonal gradient of the fundamental solution of the 2D periodic Poisson equation, derived in Bailey et al. (Reference Bailey, Borwein, Crandall and Zucker2013).
To continue the solution after the singularity time, one can regularize the kernel with the classical vortex-blob method: see Krasny (Reference Krasny1986a), Cowley et al. (Reference Cowley, Baker and Tanveer1999) and Baker & Pham (Reference Baker and Pham2006). We have accomplished this by using the regularization reported in Baker & Pham (Reference Baker and Pham2006); see, in particular, their (2.8a) and (2.8b). In our case the regularized  $\delta$–BR equation reads as
 \begin{equation} \frac{\partial \boldsymbol{x}_{BR}^{\delta}(\theta,t)}{\partial t}=\int_{{-}L_x/2}^{L_x/2}\boldsymbol{K}^{\delta}_{L_x,L_y}(\boldsymbol{x}_{BR}^{\delta}( \theta,t)-\boldsymbol{x}_{BR}^{\delta}(\tilde{\theta},t)))\,\textrm{d}\tilde{\theta}, \end{equation}
where the regularized kernel is
 \begin{align} &\boldsymbol{K}^{\delta}_{L_x,L_y}(\boldsymbol{x})\nonumber\\ &\quad =\left(\frac{y}{L_xL_y}-\frac{1}{2L_x}\sum_{h={-}\infty}^{h=\infty} \frac{y-hL_y}{\sqrt{(y-hL_y)^2+\delta^2}}\frac{\sinh(2{\rm \pi} \sqrt{(y-hL_y)^2+\delta^2}/L_x)}{\cosh(2{\rm \pi} \sqrt{(y-hL_y)^2+\delta^2}/L_x)-\cos(2{\rm \pi} x/L_x)},\right.\nonumber\\ &\qquad \left. \frac{1}{2L_x}\sum_{h={-}\infty}^{h=\infty}\frac{\sin(2{\rm \pi} x/L_x)}{\cosh(2{\rm \pi} \sqrt{(y-hL_y)^2+\delta^2}/L_x)-\cos(2{\rm \pi} x/L_x)}\right), \end{align}
and  $\delta >0$ is the regularizing parameter. To solve the BR equation, we have used a fourth-order Runge–Kutta scheme; in (4.3) and (4.5), we have performed the integration by using the alternating points quadrature formula (see Krasny Reference Krasny1986a). Close to the singularity time, we had to use 65 536 discretization points. To avoid the growth of the round-off disturbances due to the Kelvin–Helmholtz instability, we apply the Fourier filtering technique (Krasny Reference Krasny1986b; Ely & Baker Reference Ely and Baker1993; Baker & Xie Reference Baker and Xie2011): performing computations with 32-digit precision, at each time step, we set to zero the Fourier modes with amplitude smaller than the threshold value
 $10^{-29}$. In the regularized case, filtering was necessary only for the case
 $\delta =10^{-3}$; a larger regularization is able to damp round-off. Finally, we need to evaluate only a finite number of terms in the infinite sums of (4.4) and (4.6), as they rapidly decay to zero with
 $h$; the choice
 $h=50$ was enough to ensure an error below the machine precision. In all the numerical simulations, we set
 $L_x=L_y=2{\rm \pi}$.
4.1.1. Comparison between the BR vortex sheet and the NS vortex layer singularities
In this section, we compare the outcomes of the singularity analysis for  $\mathcal {C}$ (the centre of the layer), presented in § 3.2, with those coming from the BR solution's singularity analysis. In particular, we compare the singularities of the components of the
 $BR$ solution and
 $\mathcal {C}$, of the curvatures
 $\kappa _{BR}$ and
 $\kappa _\mathcal {C}$, and of the true vortex strengths
 $\hat {\gamma }_{BR}$ and
 $\hat {\gamma }_{\mathcal {C}}$. This comparison can be made only up to the time
 $t_s$ when the BR solution becomes singular.
In Caflisch et al. (Reference Caflisch, Gargano, Sammartino and Sciacca2017), the singularity analysis of  $(X_{BR}(\theta,t), Y_{BR}(\theta,t))$, revealed that a singularity forms in a finite time. In particular, the two functions
 $X_{BR}(\theta,t), Y_{BR}(\theta,t)$ become singular at
 $t_s\approx 1.507$ and
 $\theta ^*\approx 1.287$. The singularities of
 $X_{BR}$ and
 $Y_{BR}$ always have the same positions in the complex plane, although they have different characterizations,
 $\mu _{X_{BR}}\approx 1.61$ and
 $\mu _{Y_{BR}}\approx 1.72$, respectively. Therefore, both components experience a blow-up in their second derivative, and the
 $X$-component is more singular than the
 $Y$-component. In figure 15, we show the trajectories of these singularities in the complexified
 $\theta$-plane. At
 $t=t_s$, the trajectory terminates, hitting the real axis and producing the blow-up of the solution. At
 $t=t_s$, also the curvature
 $\kappa _{BR}$ and the true vortex strength
 $\hat {\gamma }_{BR}$ become singular, with characterizations
 $\mu _{\kappa _{BR}}\approx -0.44$ and
 $\mu _{\hat \gamma _{BR}}\approx 0.55$, respectively. Therefore, at
 $\theta =\theta ^*$, the curvature diverges, whereas
 $\hat \gamma _{BR}$ has a cusp behaviour: at
 $t=t_s$,
 $\hat \gamma _{BR}$ is singular but finite. The above results are in full agreement with those predicted in Moore (Reference Moore1979), and later observed by other authors investigating numerically the singularities generated by vortex-sheet motion with several initial configurations (see, e.g. Krasny Reference Krasny1986b; Shelley Reference Shelley1992).
Trajectories of the two complex singularities  $\theta _1^{X_\mathcal {C}}$ and
 $\theta _2^{X_\mathcal {C}}$ of the component
 $X_{\mathcal {C}}$ of the material curve
 $\mathcal {C}$. The tracking goes from
 $t=0.8$ up to
 $t_s=1.507$. The singularities of
 $Y_{\mathcal {C}}$ have similar trajectories. The dashed line is the tracking of the BR singularity. At
 $t_s$, the BR singularity, with character
 $3/2$, hits the real axis. At
 $t_s$, the characters of
 $\theta _1^{X_\mathcal {C}}$ and
 $\theta _2^{X_\mathcal {C}}$ are compatible with the character of the BR solution; see table 1.

In figure 16, we show the vortex sheet curve and its curvature, and compare them with the  $\mathcal {C}$ curve (the centre of the vortex layer) and its curvature. The time is
 $t=1.505$, just before the singularity formation. The
 $\mathcal {C}$ curve approximates the vortex sheet curve well; the effect of the regularization is evident in the smooth behaviour of the curvature of
 $\mathcal {C}$.
(a) The vortex sheet curve obtained solving the BR equation, at  $t=1.505$, and the curve
 $\mathcal {C}$, for various
 $Re$, at the same time. (b) The curvatures
 $\kappa _{BR}$ and
 $\kappa _{\mathcal {C}}$, at
 $t=1.505$.

Given the parametrization  $\mathcal {C}=(x(\theta,t),y(\theta,t))$, we apply the BPH method to find the singularities of the components
 \begin{equation} (X_{\mathcal{C}}(\theta,t),Y_{\mathcal{C}}(\theta,t))=(x(\theta,t)-\theta,y(\theta,t)), \quad \theta \in [-{\rm \pi},{\rm \pi}].\end{equation}
We label these singularities  $\theta _1^{X_\mathcal {C}},\theta _2^{X_\mathcal {C}}$ and
 $\theta _1^{Y_\mathcal {C}},\theta _2^{Y_\mathcal {C}}$. As one could expect, the positions of the singularities of
 $X_{\mathcal {C}}$ and
 $Y_{\mathcal {C}}$ in the complex plane coincide with those of
 $\omega _\mathcal {C}$ and are shown, for instance, in figures 13. In figure 15 we show the paths in the complex plane of
 $\theta _1^{X_\mathcal {C}}$ and
 $\theta _2^{X_\mathcal {C}}$ (
 $\theta _1^{Y_\mathcal {C}},\theta _2^{Y_\mathcal {C}}$ have the same positions) for various
 $Re$. The paths are represented up to the singularity time of the BR solution
 $t_s=1.507$. As
 $Re$ increases, the singularities are closer to the real axis, and the distance between
 $\theta _1^{X_\mathcal {C}}$ and
 $\theta _2^{X_\mathcal {C}}$ diminishes; moreover, they seem to converge toward the BR singularity. We have found that, at time
 $t_s=1.507$, both singularities have characters
 $\mu _{\theta _{1,2}^{X_\mathcal {C}}}$ and
 $\mu _{\theta _{1,2}^{Y_\mathcal {C}}}$ in the range (1.0–1.5), compatible with the predicted characterization of the BR singularity (see table 1) and with the blow-up in their second derivatives. At subsequent times, for instance at
 $t_{1w}$, these characters remain in the same range.
A similar behaviour is observed for the singularities of the curvature: the curvature of  $\mathcal {C}$ admits two singularities (see § 3.2) that, in the limit
 $Re\rightarrow \infty$, seem to converge toward the BR curvature singularity. The algebraic characters of these singularities appear to be the same; see the last three columns of table 1.
The crucial difference between the vortex sheet and  $\mathcal {C}$ lies in the singularity of the true vortex strengths
 $\hat {\gamma }_{BR}$ and
 $\hat {\gamma }_{\mathcal {C}}$ (the differences between the characters of the singularities are reported in table 3). In the BR case, at
 $t_s$, a cusp forms in
 $\hat {\gamma }_{BR}$ and
 $\partial _\theta s(\theta )$ is small but not vanishing. In contrast, in the analysis we have performed in § 3.2, we found that
 $\hat {\gamma }_{\mathcal {C}}$ has a singularity with negative algebraic character
 $\mu _{\theta ^{\hat {\gamma }_{\mathcal {C}}}}$ (of order
 $\approx -1/3$, see table 1). This means that, in the limit
 $Re\rightarrow \infty$ and at
 $t_s$,
 $\hat {\gamma }_{\mathcal {C}}$ blows up. One of the consequences is that
 $\partial _\theta s(\theta )=0$ and, therefore, an infinite particle compression occurs at the centre of the spiral, with the two vorticity minima colliding. The difference between the behaviour of the BR solution at
 $t=t_s$, and the infinite Reynolds number of the vortex layer solution, suggests that BR, close to the singularity, is not the zero-viscosity limit of the NS vortex layer solutions.
4.2. Vortex blob regularization
In this section, we shall compare the solutions of the  $\delta$–BR equation with the NS vortex layer solution.
In figure 17(a), we show the comparison between the curves  $\mathcal {C}$, the centre of the NS layer, and
 $\boldsymbol {x}^\delta _{BR}$, the solution of the
 $\delta$–BR equation; the solutions are computed taking
 $Re=10^4$ and
 $\delta =10^{-2}$, respectively. The two curves overlap in the outer part of the spiral while one can appreciate significant qualitative differences in the innermost part of the spiral, as the curve
 $\boldsymbol {x}^\delta _ {BR}$ develops more turns.
(a) Plot of  $\mathcal {C}$, the NS (with
 $Re=10^4$) layer's central curve, and the vortex sheet obtained from the
 $\delta$-vortex blob regularization (with
 $\delta =10^{-2}$). The times are
 $t=2$,
 $t=3.0$ and
 $t=3.6$ (upper plots): the outer part of the spirals seems to be independent of the regularization used, whereas the innermost part depends on it. In the inset, the magnification of the spirals at
 $t=3.6$. (b) We show the spirals after the scaling (4.8) for
 $\delta =10^{-1},10^{-2},10^{-3}$.
 $(c)$ We compare the spiral given by the
 $\delta$–BR solution (scaled by (4.8)) with the material curve
 $\mathcal {C}$ (in the NS and Euler cases). The regularizing parameters are
 $\delta =10^{-3}$ for the
 $\delta$ model,
 $Re=2\times 10^{4}$ for the viscous layer and
 $\delta =0.0141$ for the inviscid layer.

We have seen that the inner part of the spiral formed by  $\mathcal {C}$ obeys a self-similarity law given by (2.17a,b). It is also known that a similar scaling exists for the vortex blob regularization; Baker & Pham (Reference Baker and Pham2006) and Sohn (Reference Sohn2014) showed that the inner core region of the spirals is invariant under the transformation
 \begin{equation} \textbf{X}_{\delta}=\left(\boldsymbol{x}_{BR}^\delta-(x_c,y_c)\right)/\delta. \end{equation}
The self-similarity law is illustrated in figure 17(b). Formally (4.8) is the same as the  $Re^{-1/2}$-scaling (2.17a,b) for the curve
 $\mathcal {C}$.
In figure 17(c), we compare the rescaled  $\mathcal {C}$ and the rescaled
 $\delta$–BR curves when they have completed the same number of turns. The figure shows an almost perfect matching in the very vicinity of the centre. This comparison shows that both the regularizations predict a qualitatively similar structure represented by the spiral. However, the differences obtained from the scaled curves highlight some quantitative differences, which does not rule out the possibility that, in the limits
 $\delta \rightarrow 0,Re\rightarrow \infty$, the two regularizations provide different weak solutions of the Euler equations. We have analysed the outcomes of the singularity analysis for the components
 \begin{equation} (X^{\delta}_{BR}(\theta,t),Y^{\delta}_{BR}(\theta,t))=(x_{BR}^\delta(\theta,t)-\theta,{y}_{BR}^\delta(\theta,t)), \quad \theta \in [-{\rm \pi},{\rm \pi}].\end{equation}
and compared with the  $\mathcal {C}$ case. Similarly to
 $\mathcal {C}$, both components have two main singularities
 $\theta _{1,2}^{X_{BR}^\delta }$ and
 $\theta _{1,2}^{Y^\delta _{BR}}$. Figure 18 reports the paths of
 $\theta _{1,2}^{X_{BR}^\delta }$ in the complex plane. For
 $\delta =10^{-3}$, the singularities are very close to each other, and the BPH method does not discern the positions of the two singularities. Compared with the tracking of the singularities of
 $\mathcal {C}$ in figure 15, the
 $\theta _{1,2}^{X^\delta _{BR}}$ are, in general closer to the singularity of the BR solution and closer to the real domain: for instance, one can check this from the tracking in the case when
 $\delta =Re^{-1/2}=10^{-2}$. The characterization of the vorticity intensity singularity
 $\theta ^{\hat {\gamma }_{\delta }}$ is the most relevant quantity. From table 2 one can see that the algebraic character of
 $\theta ^{\hat {\gamma }_{\delta }}$ is
 $\mu _{\theta ^{\hat \gamma _\delta }}\approx -0.43$, which makes the vorticity concentration for the BR-
 $\delta$ stronger than for the NS-layer case, see table 1. The error bound in the fitting procedure is even smaller than in the viscous case, being, in general, of magnitude less than
 $10\,\%$ of the estimated values.
Tracking the complex singularities  $\theta _1^{X^\delta _{BR}}$ and
 $\theta _2^{X^\delta _{BR}}$ of the component
 $X^\delta _{BR}$ of the regularized
 $\delta$–BR solution in the complex plane from
 $t=0.8$ up to
 $t_s=1.507$ . The singularities
 $\theta _1^{Y^\delta _{BR}}$ and
 $\theta _2^{Y^\delta _{BR}}$ of the
 $Y_{BR}^\delta$ components have the same tracking. The dashed line is the tracking of the BR singularity. For
 $\delta =10^{-3}$ the two singularities are very close to each other,
 $\theta _1^{X^\delta _{BR}}\approx \theta _2^{X^\delta _{BR}}$, so only one singularity is tracked. At
 $t = t_s$ the singularities have characters compatible with the singularity character of the BR solution (see table 2).

Characters of the singularities of the  $\delta$–BR solution at
 $t_s=1.507$. For each
 $\delta$ we show the characters of the singularities: of
 $(X^\delta _{BR},Y^\delta _{BR})$ in (4.9),
 $\mu _{\theta _{1,2}^{X_{BR}^\delta }}$ and
 $\mu _{\theta _{1,2}^{Y_{BR}^\delta }}$; of the curvature
 $\kappa _\delta$,
 $\mu _{\theta _{1,2}^{\kappa _\delta }}$ and
 $\mu _{\theta ^{\hat {\gamma }_{\delta }}}$; of the true vortex strength
 $\hat {\gamma }_{\delta }$,
 $\theta ^{\hat {\gamma }_{\delta }}$. Error bars are in general less than
 $10\,\%$ of the estimated values.

In table 3 we report the differences between the characters of the singularities developed by the BR solution and the regularized versions. For example,
 \begin{equation} \overline{\mu_{\theta_1}^{\kappa_\delta}}=\mu_{\theta_1}^{\kappa_\delta}- \mu_{\theta}^{\kappa_{BR}}. \end{equation}
The table shows, first, that the regularized versions display concentration phenomena in the form of the divergent behaviour of the vorticity intensity and, second, that the  $\delta$–BR model presents stronger singularities than those coming from other regularizations. This could be a strong indication that the different regularizations represent different weak solutions of the Euler equations.
Differences between the character of the singularities appearing in the regularized dynamics (vortex-blob regularization, finite-thickness NS regularization and finite-thickness Euler regularization) and in the BR dynamics. In all cases we compare, at the singularity time  $t_s=1.507$, curvature and vortex strength singularities. The differences are significant in the characters of vortex strength: for all the regularizations the vortex strength has a divergent behaviour, whereas for BR it is regular.

4.3. Comparison with the inviscid vortex layer
Our configuration introduces two regularizing agents: layer thickness and viscosity. In this paper, we have linked these two factors choosing the thickness to be  $O(Re^{-1/2})$; in the introduction, we have given the mathematical and physical motivations for this choice, which we believe to be natural. Here we want to briefly discuss the limiting behaviour of the vortex layer sending to zero separately the thickness (that in the present subsection we shall denote by
 $\delta$,
 $\delta$ being the standard deviation of the Gaussian) and the viscosity. Such analysis will also highlight the different roles played by the two regularizations. First, we notice that keeping the thickness fixed and sending the viscosity to zero does not lead to any new interesting effect: the datum is regular, and a classical result ensures, in the zero-viscosity limit, the convergence to the Euler solution, which, given that we are in two dimensions, remains smooth for all times. More interesting is the opposite case when, keeping the viscosity fixed, one considers the zero-thickness limit. We have performed several numerical explorations keeping the viscosity zero. This situation is quite challenging from the computational point of view also; we have seen that the absence of the regularizing effect of the viscosity makes it difficult to compute the evolution of layers whose initial thickness
 $\delta$ is smaller than
 $0.0141$, which corresponds in the viscous case to a
 $Re=5000$ (in the viscous case, we have been able to compute up to
 $Re=1.5\times 10^5$ flows).
The first evident effect of the lack of dissipation is the considerable acceleration of the roll-up process compared with the viscous counterpart. This effect is observable in figure 19(a), where we show the central curves for the viscous and inviscid cases at two different times starting from the same initial thickness  $\delta =0.0141$ (corresponding to
 $Re=5\times 10^3$). The second effect is the monotonous growth of palinstrophy as opposed to the behaviour observed in the viscous case, see figure 3. One can understand this as an outcome of the lack of dissipation in the palinstrophy balance equation (2.14); the absence of the dissipative term leaves the stretching term to dominate, causing the palinstrophy to grow independently from layer thicknesses. Therefore, the dichotomy we have observed in the viscous case (low
 $Re$, where the dominance of the viscous effects leads to the monotonous decrease of palinstrophy, versus moderate–high
 $Re$, where one sees a temporary palinstrophy growth, see figure 3), is not present in the inviscid case. In figure 19(b), one can see how the stretching of the layer is particularly intense in the braids in the vicinity of the core, where palinstrophy distribution reaches very high values, and the local thickness of the layer has significantly decreased due to the intense stretching.
(a) The central material curves for the inviscid and viscous cases computed at the same times and for the same initial thickness . The lack of dissipation in the inviscid case makes the rolling of the inviscid curve more intense. (b) Vorticity distribution at  $t=2.85$ for the inviscid Euler case with initial thickness
 $\delta =0.0141$. The black curve is the central curve
 $\boldsymbol {x}^\delta _{{EU}}$. In the inset the palinstrophy distribution. In the inviscid case the vorticity along
 $\boldsymbol {x}^\delta _{{EU}}$ is constant (
 ${\approx }28.2$) for all the times. Peaks of palinstrophy are reached in the braids where the local thickness is significantly small.

We have performed the singularity analysis for the vortex strength  $\hat {\gamma }_{EU}$, and the curvature
 $\kappa _{EU}$ of the central curve
 $\boldsymbol {x}_{\textrm {EU}}^\delta$. The vortex strength
 $\hat {\gamma }_{EU}$ is shown in figure 20(a) at different times for the initial thickness
 $\delta =0.0141$ and compared with the same quantity of the viscous case with the same initial thickness. In figure 20(b), we show the path of the main singularity and the best power-law fitting for the imaginary part
 $\theta _{im}$ in its dependence from the initial thickness. We have obtained
 $\theta _{im}\propto \delta ^{0.5}$, which, compared with the power-law scaling
 $\theta _{im}\propto Re^{-0.16}$ for the viscous case, expresses that singularities tend to approach the real domain faster as
 $\delta \rightarrow 0$ than the viscous case for
 $Re\rightarrow \infty$. Concerning the character of the singularity of
 $\hat {\gamma }_{EU}$, we have obtained that it is close to the value
 $\mu _{\theta ^{\hat {\gamma }_{EU}}}\approx 2/5$ (differences with the BR singularity reported in table 3): this value is different from the values found in the viscous case and the vortex-blob case, but similar to them it is compatible with the diverging behaviour of the vortex strength as
 $t\rightarrow t_s^+$. We conclude mentioning that the layers governed by the Euler equations show the same scale invariance (4.8), see figure 17(c).
(a) The vortex strength computed for the inviscid case ( $\hat {\gamma }_{EU}$) and the viscous case (
 $\hat {\gamma }_{\mathcal {C}}$), for the same initial thickness
 $\delta =0.0141$ (corresponding to
 $Re=5\times 10^3$). Plots are shown at the times
 $t_s=1.507$ of singularity formation for the BR equation, and the time
 $t_{1w}$ in which the
 $x$ derivative of the central curves vanish, that is,
 $t\approx 2.2$ for the inviscid case and
 $t\approx 2.4$ for the viscous case. (b) Tracking in the complex plane
 $(\theta,\theta _{im})$ of the main singularity of the vortex strength
 $\hat {\gamma }_{EU}$ for the inviscid case. The singularity is tracked at
 $t_s=1.507$ and at the time
 $t_{1w}$ for various initial thickness: the size of the markers decreases for smaller
 $\delta$. In the inset, the imaginary parts of the singularities shown vs the initial thickness
 $\delta$, and best power-law fitting (log–log scale).

The typical role of the viscosity, as always, is to dampen higher modes, making less sharp the solutions gradients; more specifically, in our case, viscous terms counteract the stretching coming from the roll-up of the layer, also leading to milder complex singularities compared with the inviscid case. However, in addition to numerical difficulties, there are no obstacles in computing the vortex layer solutions in the zero-viscosity limit. The regularizing agent playing a crucial role in allowing the computations to go beyond the BR singularity time is the finite thickness.
Most of this paper is devoted to analysing the solutions when the layer thickness  $\delta$ and the viscosity
 $\nu$ relate as
 $\nu \sim \delta ^2$. In this subsection, we have briefly considered the case when
 $\nu =0$. The more general case when
 $\nu \sim \delta ^\alpha$ is certainly of interest, but this is outside the scope of this paper.
5. Conclusion
The flow configuration in which vorticity concentrates around a curve is one of the most relevant and studied in fluid dynamics. The interest in these configurations was initially motivated by their practical importance, being vorticity layers originated by fluid–structure interactions. Later it was clear how these configurations were also of great relevance from a theoretical point of view, being the possible source of more singular behaviour, concentration and non-uniqueness. The BR equation is the leading-order approximation of the layer's motion that neglects viscosity and the layer thickness. One of the major problems is to understand how the BR solution's behaviour is related to a vortex layer's dynamics. In particular, whether the BR singularity is related to the core formation and vorticity concentration shown by a vortex layer.
In this paper, we have analysed the evolution of a viscous vortex layer, whose initial thickness is  $O(Re^{-1/2})$, governed by the 2D NS equations. We have also compared the layer's dynamics with its inviscid counterpart, the BR vortex sheet, and, beyond the singularity time, with its regularized versions.
First, we have focused our analysis on describing the most important physical phenomena characterizing the evolution of the layer. These phenomena led us to distinguish between two  $Re$ regimes. For low
 $Re$, in our case
 $Re\leqslant O(10^{3})$, the flow is characterized by the formation of two symmetric cores and by their large-scale spiraling, which finally induces their merging (see figure 2). Conversely, we have observed no merging of the two cores for the higher
 $Re$ we have been able to simulate, that is,
 $5\times 10^3\leqslant Re\leqslant 1.5\times 10^5$. In these cases, instead, the final stage of the evolution is characterized by a concentration phenomenon occurring in each core (see figure 1), that becomes more intense for higher
 $Re$.
The stages leading to concentration can be summarized as follows. During the first stage, the layer or, to be more precise, the central curve  $\mathcal {C}$, closely follows the dynamics predicted by the BR equation. Up to the BR singularity time, therefore, our computations show excellent agreement between the BR equation and the vortex layer dynamics. These results, therefore, provide a numerical extension of the rigorous short-time theorems, obtained in Caflisch, Lombardo & Sammartino (Reference Caflisch, Lombardo and Sammartino2020), concerning the convergence of vortex layers ruled by Euler equations: because, here, we show that a small viscosity does not disrupt the agreement between NS and BR solutions; and because, here, we have observed that the agreement is not limited to short times but persists almost up to the BR singularity time.
A second stage begins after the BR singularity time. Although the BR curve terminates its evolution developing an infinite curvature, we see the layer bending (see, e.g., figure 10c). When the bending becomes more pronounced (see figure 4a), this causes an interaction between different sections of the layer in the form of a cascade that creates stagnation points and reverse flow. This reverse flow weakens the velocity jump between the flow above and below the layer, creating two vorticity minima, the red dots in figure 4(a–c). These vorticity minima separate the inner part of the core from the outer part of the core, and play a crucial role in the third stage of the flow evolution.
During the third stage, the vorticity minima become sharper, and strong vorticity gradients appear (see figure 12a). These sharp gradients are related to the intense stretching of the curve, which is evident in figure 12(b). We have seen, discussing (2.15), how stretching is the mechanism leading to the growth of vorticity gradients, and how this leads to the growth of palinstrophy (see figure 3). Stretching, combined with intense rotation and folding, leads to mixing, through a mechanism similar to the classical horseshoe map (see figure 1 and supplementary movie 1).
The intense tangential stretching of the curve occurs where the vorticity minima are. On the other hand, the core centre is a zone where the opposite event occurs: intense tangential compression. Compression is visible in figure 12(b) where  $\partial _\theta s \approx 0$, as this means that different Lagrangian particles occupy the same spatial position. Our computations suggest that the compression increases with the
 $Re$, that is, that
 $\partial _\theta s(\theta )\searrow 0$ when
 $Re\rightarrow \infty$. The counterpart of the coalescence condition is that the vorticity intensity
 $\hat {\gamma }_\mathcal {C}$ should grow without bound at the centre of the layer, when
 $Re$ increases (see figures 10c and 11b). These results would suggest that the vortex layer, in the limit, shows a vorticity concentration compatible with the 2D weak solution of the Euler equations as supposed by the Di Perna and Majda theory (DiPerna & Majda Reference DiPerna and Majda1987a,Reference DiPerna and Majdab). Moreover, the blow-up of the vorticity concentration
 $\gamma _\mathcal {C}$ would imply non-convergence, for
 $t\rightarrow t_s^+$, of the NS solution to the BR solution, as it is well known that
 $\gamma _{BR}$ remains finite up to the singularity time. The complex singularity analysis we have performed in § 3 confirms the fact that NS-layer solutions, at the singularity time, have a different structure than the BR solution. In particular, singularity analysis has validated that
 $\gamma _\mathcal {C}$, which has complex singularities with negative algebraic character, is more singular than
 $\gamma _{BR}$, which instead has a cusp-type singularity, whose algebraic character is
 $1/2$.
We have already noticed that the two minima of  $\omega _\mathcal {C}$, are the sources of the intense stretching of the curve (see supplementary movie 2). Two complex singularities, traveling toward the real axis and getting closer for increasing
 $Re$, correspond to these minima. In the limit
 $Re\rightarrow \infty$, we expect that these two singularities coalesce into a single real singularity, as
 $t\rightarrow t_s^+$.
Another result we have obtained is strong evidence of the self-similar character of the vorticity core. We have seen, at least for the  $Re$ we have been able to analyse, that this core is invariant under the spatial scaling
 $(x',y')\rightarrow Re^{-1/2}(x,y)$ (see figure 7). Moreover, the first stages of the layer evolution after the BR singularity time obey the time scaling
 $t'=(t-t_s)Re^{-1/3}$ (see figure 9). These results confirm once again the concentration occurring at the core of the spiral, leading, at
 $t\rightarrow t_s^+$, to the blow-up of the vorticity intensity when
 $Re\rightarrow \infty$. We observe that the self-similar character of the dynamics had already been noticed for different vortex sheet configurations (see Sohn Reference Sohn2016) and for the inviscid vortex layer (see Hoepffner, Blumenthal & Zaleski Reference Hoepffner, Blumenthal and Zaleski2011). It would be an essential achievement to give a rigorous proof of the self-similar character of the spiraling and concentration of the vortex layer configuration analysed in the present paper.
One could regard the initial configurations we have considered (layers or sheets of sinusoidal shape) as low-wavenumber mode perturbations of the flat layer or sheet. These configurations are relevant, for example, because they are representative of layers emerging from the interaction of high- $Re$ flows with
 $O(1)$ structures; in fact, extensive scientific literature concerning these configurations has developed, as detailed in the Introduction. As pointed out by one of the referees, it would be interesting to consider the effects of high-wavenumber
 $Re$-dependent perturbations as these would grow faster and, asymptotically, in zero time. Analogously, one could consider forcing the initial configuration by placing complex singularities at finite distances from the real axis, in the same spirit of Gargano, Sammartino & Sciacca (Reference Gargano, Sammartino and Sciacca2009), where dipole complex singularities forced a boundary layer to became singular in zero time. These topics are outside the scope of the present paper and will be the object of future work.
Another point deserving further attention concerns the non-uniqueness of the weak solutions of the 2D Euler equations for an initial vortex sheet configuration. It is known that 2D Euler equations may have infinitely many admissible weak solutions (see, e.g., Székelyhidi (Reference Székelyhidi2011), and the recent Mengual & Székelyhidi (Reference Mengual and Székelyhidi2020)). The lack of uniqueness could reflect on the fact that different regularizations might converge to different Euler solutions. Some authors have already highlighted the differences between the solutions arising from the various regularization procedures. For example, the typical irregular features of the vortex-blob flow due to the onset of chaos analysed in Krasny & Nitsche (Reference Krasny and Nitsche2002), were not observed in viscous layers (Nitsche et al. Reference Nitsche, Taylor and Krasny2003). A comparison with the Euler- $\alpha$ regularizations is given in Holm et al. (Reference Holm, Nitsche and Putkaradze2006); the authors showed that, for small regularizing parameters
 $\delta$ and
 $\alpha$, the two regularizations induce different behaviours in the core vicinity region. In this work, through singularity analysis, we have given further evidence of the fact that different regularizations can, in the limit, give rise to different behaviours. In fact, we have considered the BR solution coming from the vortex-blob regularization, and we have seen that the singularities of the
 $\delta$–BR solution have lower characters than the singularities developed by the centre of the viscous layer, the curve
 $\mathcal {C}$. How the presence of a complex singularity, and its character, manifest themselves in the statistical properties of the measure-valued solutions (see Fjordholm, Mishra & Tadmor Reference Fjordholm, Mishra and Tadmor2016) is unclear, though, and merits further analysis.
Finally, we would like to mention that the 3D version of the problem we have considered here is of great fundamental interest. In fact, it is well known how, in three dimensions, the existence of regular solutions is ensured for a short time only; in the case of a vortex layer, the existence time could, in principle, shrink to zero in the limit of zero viscosity and/or zero thickness. We believe that analyticity could avoid this, but no rigorous proof is available at the present moment, nor has an analysis of the singularity behaviour been performed.
Supplementary movies
Supplementary movies are available at https://doi.org/10.1017/jfm.2021.966.
Acknowledgements
The authors gratefully thank three anonymous referees for their valuable comments, suggestions, and criticism, which helped significantly improve the paper.
Funding
The work of F.G. and M.S. has been partially supported by the PRIN 2017 grant: ‘Multiscale phenomena in continuum mechanics: singular limits, off-equilibrium and transitions’. The work of V.S. has been partially supported by the INdAM-GNFM.
Declaration of interests
The authors report no conflict of interest.
Appendix A. Singularity tracking
The singularity tracking method is widely used to characterize the complex singularity of an analytic function  $u(z)$, and the scientific literature is rich of papers in which singularity analysis is applied to solution of both ordinary differential equations (ODEs) and partial differential equations (PDEs) arising in fluid dynamics, see Sulem, Sulem & Frisch (Reference Sulem, Sulem and Frisch1983), Shelley (Reference Shelley1992), Caflisch (Reference Caflisch1993), Ely & Baker (Reference Ely and Baker1993), Cowley et al. (Reference Cowley, Baker and Tanveer1999), Frisch, Matsumoto & Bec (Reference Frisch, Matsumoto and Bec2003), Siegel & Caflisch (Reference Siegel and Caflisch2009), Pauls et al. (Reference Pauls, Matsumoto, Frisch and Bec2006), Pauls & Frisch (Reference Pauls and Frisch2007), Gargano et al. (Reference Gargano, Sammartino and Sciacca2009), van der Hoeven (Reference van der Hoeven2009), Malakuti et al. (Reference Malakuti, Caflisch, Siegel and Virodov2013), Gargano et al. (Reference Gargano, Sammartino, Sciacca and Cassel2014), Caflisch et al. (Reference Caflisch, Gargano, Sammartino and Sciacca2015) and Caflisch et al. (Reference Caflisch, Gargano, Sammartino and Sciacca2017).
The singularity tracking is based on the asymptotic analysis of the Fourier transform of a function and gives information on the width of its analyticity strip. Suppose that the function  $u(z)$ has a complex singularity at
 $z^* = x^* + \textrm {i}y^*$ and that
 $u(z) \approx (z-z^*)^\mu$ as
 $z\rightarrow z^*$, where
 $\mu$ is the character of the singularity. Then, if
 $u(z)=\sum _{k=-K/2}^{k=K/2}u_k\textrm {e}^{\textrm {i}kz}$ is the discrete Fourier expansion of
 $u$, then the asymptotic behaviour of its spectrum is governed by Laplace's formula (Carrier, Krook & Pearson Reference Carrier, Krook and Pearson1966):
 \begin{equation} u_k\sim |k|^{-(1+\mu)}\exp{(- y^* |k|)}\exp{(\textrm{i}x^*k)} \quad k \rightarrow \infty. \end{equation}
If one can estimate the rate of the exponential decay  $y^*$ of the spectrum, one obtains the distance of the complex singularity from the real axis; the estimate of the period of the oscillations of the spectrum gives the real location
 $x^*$ of the singularity. Estimating the rate of algebraic decay
 $1+\mu$, one can classify the singularity type. If
 $u(z)$ is the solution of an evolutionary PDE, all the previous quantities,
 $x^*,\mu$ and
 $y^*$, are time dependent and if, at a given time
 $t_s$,
 $y^*(t_s)$ is zero, then the solution shows a real singularity at time
 $t_s$, located in
 $x^*(t_s)$ with character
 $\mu (t_s)$.
However, this method gives information on the singularity nearest to the real axis. To retrieve more information about the possible singularities outside the width of the analyticity strip, the BPH method proposed in Pauls & Frisch (Reference Pauls and Frisch2007) can be used. In particular, given the inverse Taylor series expansion of a function  $u(z)$,
 \begin{equation} u(z) = \sum_{k=0}^N u_k/z^{k+1}, \end{equation}
that has  $n$ complex singularities
 $c_j= |c_j|\textrm {e}^{-\textrm {i}\rho _j}$ for
 $j=1,2,\ldots, n$, one can define its Borel transform by
 $U_B(\zeta )=\sum _{k=0}^N u_k\zeta ^{k}/k!$. Evaluating the modulus of the Borel series
 $G(r)=|U_B(r\textrm {e}^{\textrm {i}\phi })|$ along the rays
 $r\textrm {e}^{\textrm {i}\phi }$, one obtains, through a steepest descent argument, the following asymptotic behaviour
 \begin{equation} G(r)\approx C(\phi)r^{-(\mu(\phi)+1)}\textrm{e}^{h(\phi)r} \quad \textrm{for}\ r \rightarrow \infty. \end{equation}
The indicatrix function  $h(\phi )$, or equivalently the supporting function
 $k(\phi )=h(-\phi )$, is the relevant function to analyse.
In the case of isolated singularities (Pauls & Frisch Reference Pauls and Frisch2007),  $h(\phi )$ is a piecewise cosine function
 \begin{equation} h(\phi)=|c_j|\cos(\phi-\rho_j) \quad \textrm{for} \ \phi_{j-1}<\phi<\phi_j,\end{equation}
and the set of angular directions  $\phi _j$,
 $j=1,2,\ldots,n$, is determined by the angle
 $\phi$ for which the supporting line normal to
 $\phi$ touches the smallest convex polygon containing all the singularities in
 $c_j$ (see figure 21).
The convex hull of a discrete set of complex singularities is the smallest convex polygon containing all the singularities  $c_i$. The supporting function
 $k(\phi )$ is the distance from the origin of the supporting line, normal to the direction
 $\phi$, touching a singularity.

The BPH method can be easily applied to discrete Fourier series  $u(z)=\sum _{k=-K/2}^{k=K/2}u_k\textrm {e}^{\textrm {i}kz}$ by writing
 $u$ as an inverse Taylor series. This is accomplished by introducing the complex variables
 $Z_+=\textrm {e}^{\textrm {i}z},Z_-=\textrm {e}^{-\textrm {i}z}$ so that
 \begin{equation} u(z)=\sum_{k=0}^{K/2}u_k\textrm{e}^{\textrm{i}kz}+\sum_{k=1}^{K/2}u_k\textrm{e}^{-\textrm{i}kz}=\sum_{k=0}^{K/2} u_k/Z_-^k+\sum_{k=1}^{K/2}u_k/Z_+^k. \end{equation}
With the BPH method it is possible to capture information on all the singularities located in the convex hull outside the radius of convergence of a Taylor series (or the strip of analyticity of a Fourier series).



