1 Introduction
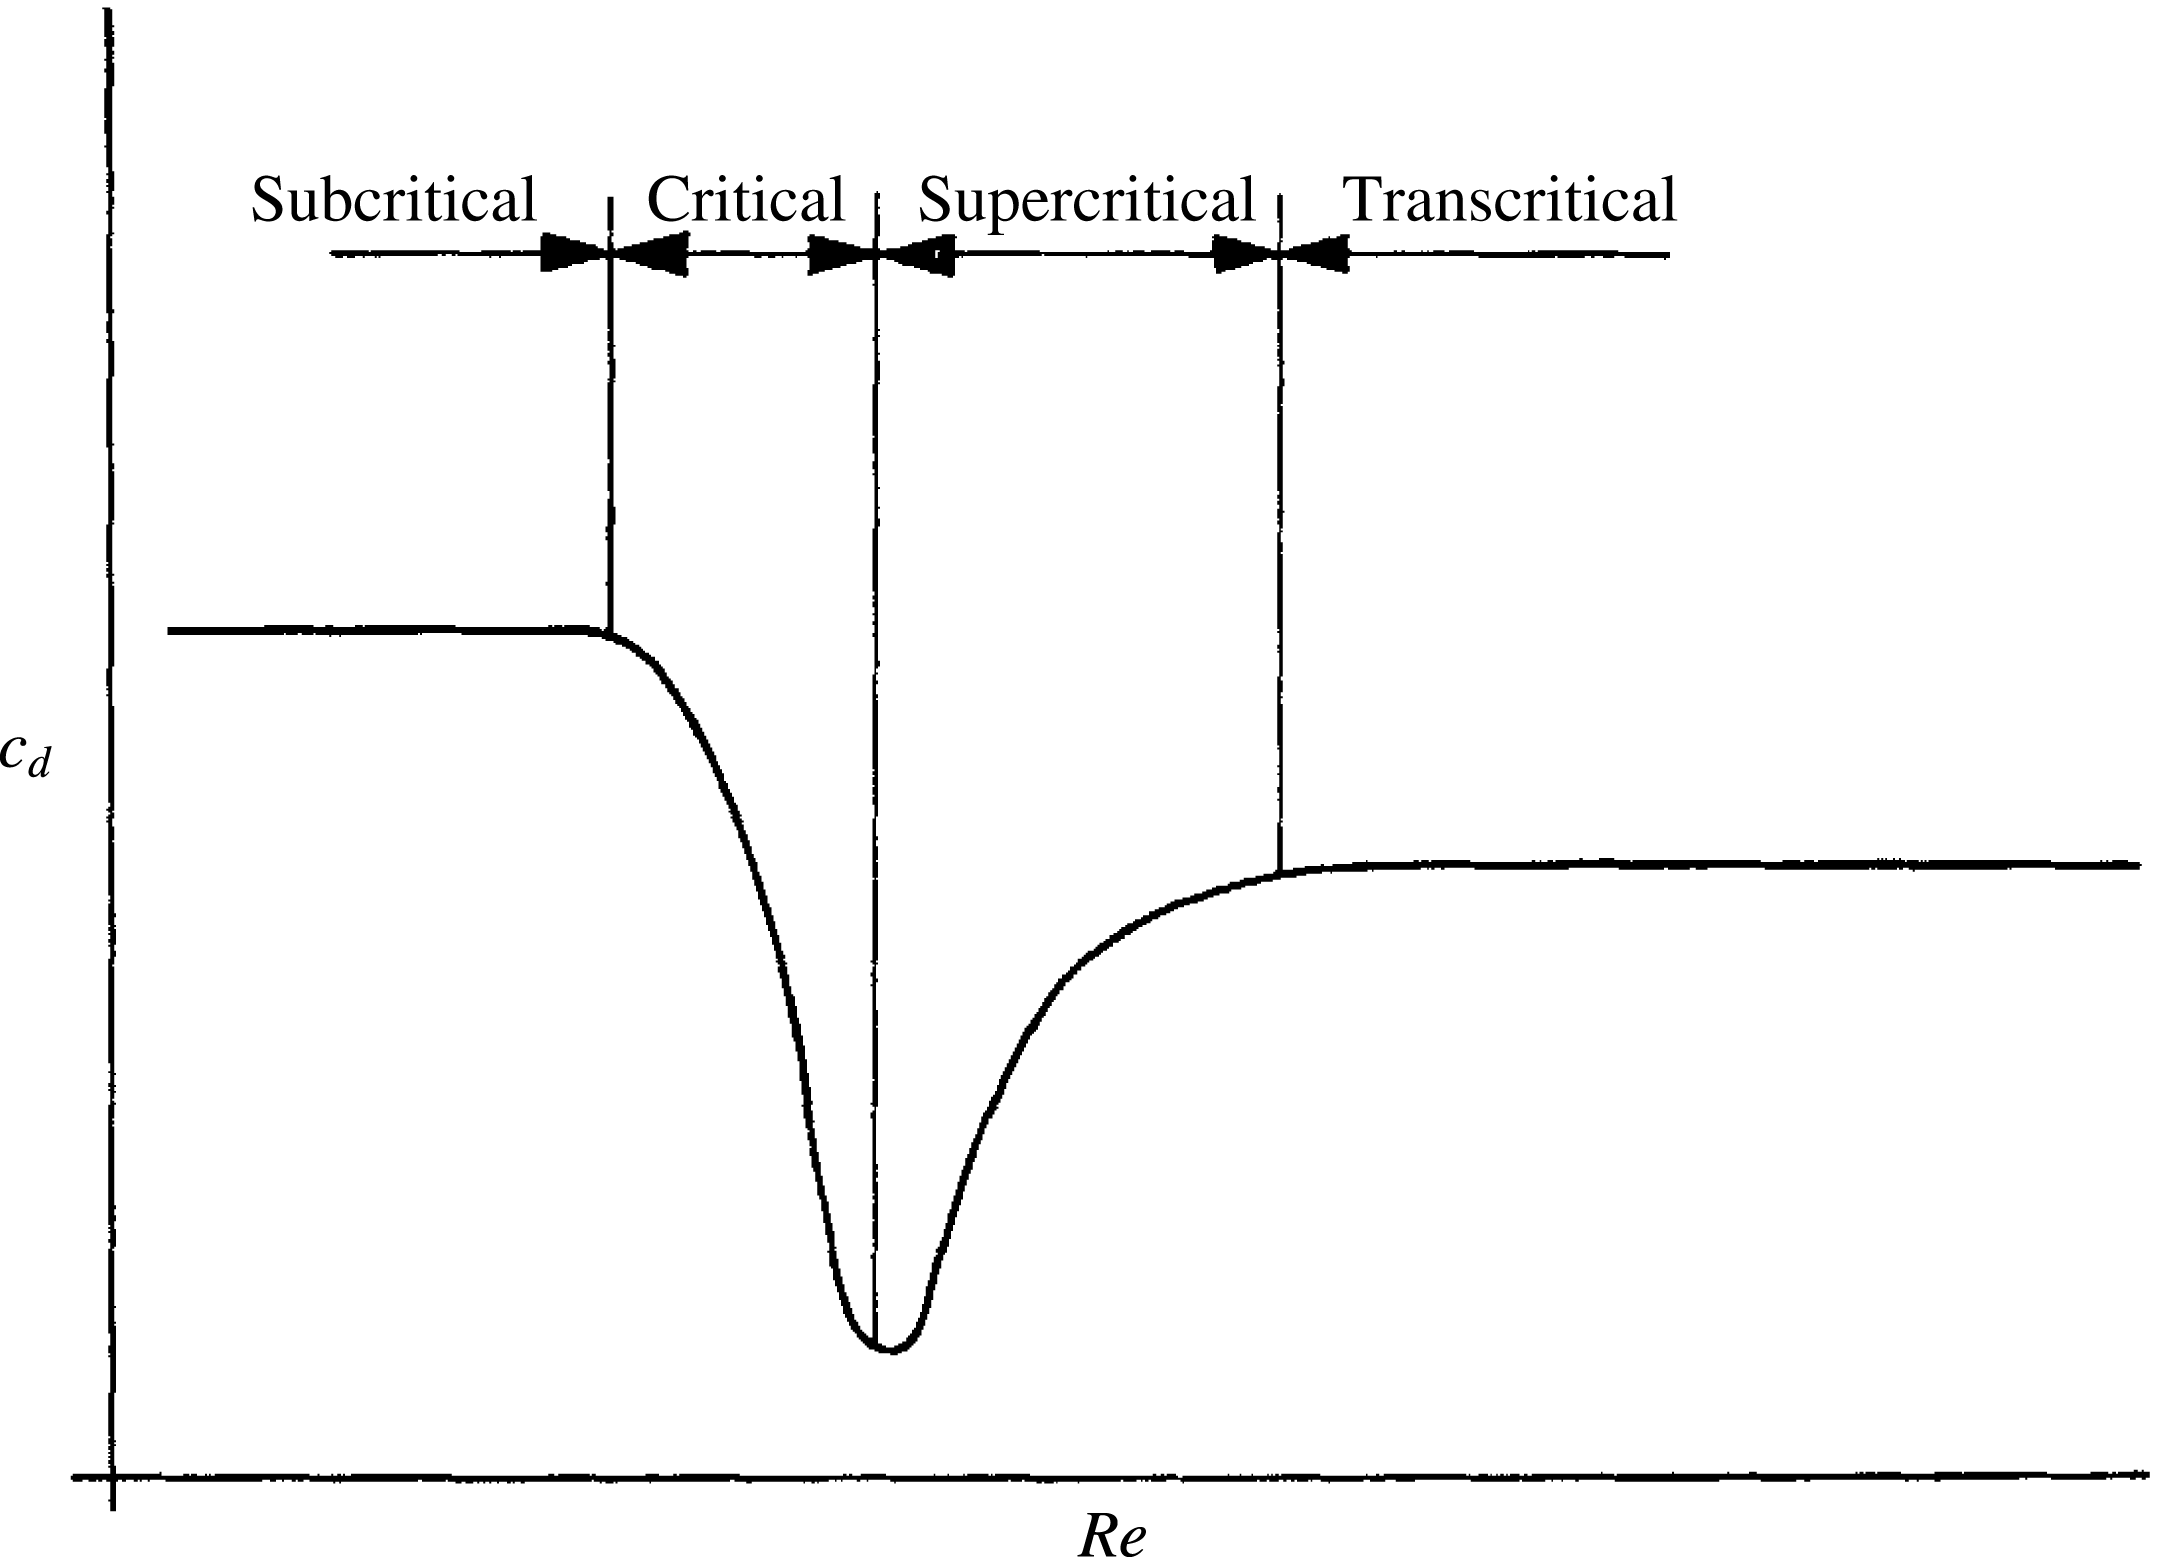
The circular cylinder is a common structural form, appearing in numerous branches of engineering, and has undisputed importance in the development of fluid mechanics. Morkovin (Reference Morkovin1964) famously described the circular cylinder as a ‘kaleidoscope of challenging fluid phenomena’. In this paper we study the management of transition on a circular cylinder using passive control and investigate the resulting effects on flow separation and drag. Note that we will refer to a circular cylinder as a cylinder, purely for the sake of brevity. The flow regimes of interest in this paper are neatly summed up in the simple diagram for a smooth cylinder shown in figure 1 and reproduced from Achenbach (Reference Achenbach1971). The figure shows a sketch of the variation of drag coefficient,
 $C_{D}$
, versus Reynolds number,
 $Re_{D}$
, where both quantities are based on cylinder diameter,
 $D$
. The names of the regimes shown in figure 1 are the ones we will use throughout the paper. A detailed description of all the regimes encountered in going from low to high Reynolds numbers can be found in Zdravkovich (Reference Zdravkovich1997). The rapid fall in
 $C_{D}$
through the critical range is the result of transition from a laminar to a turbulent boundary layer, occurring initially through the formation of a separation bubble on each side of the cylinder. As Reynolds number is increased, the separation bubbles break down and the flow over the cylinder becomes increasingly three-dimensional, resulting in a rise in
 $C_{D}$
in the supercritical regime. With further increases in Reynolds number, any remnants of separation bubbles disappear and transition occurs in the attached boundary layer. This regime, which Roshko (Reference Roshko1961) named transcritical, is characterised by a return to a two-dimensional mean flow, regular and strong von Kármán vortex shedding and, compared to the subcritical regime, later boundary layer separation and a lower
 $C_{D}$
.
Diagram outlining the main flow states, with respect to the variation in
 $C_{D}$
with Reynolds number, for a smooth circular cylinder (Achenbach Reference Achenbach1971).

The minimum value of
 $C_{D}$
for a smooth cylinder in a flow with a low free-stream turbulence level occurs at a Reynolds number close to the boundary between the critical and supercritical regimes, as depicted in figure 1. For the conditions described, this Reynolds number is approximately
 $5\times 10^{5}$
. According to Roshko (Reference Roshko1961), the plateau in
 $C_{D}$
marking the transcritical regime begins at a Reynolds number approximately an order of magnitude greater. So as to cause the lower
 $C_{D}$
values found in the transcritical regime for a smooth cylinder to occur at a lower Reynolds numbers, various passive flow control techniques have been employed to force transition, including the use of surface roughness (Achenbach Reference Achenbach1971), trip wires (Igarashi Reference Igarashi1986) and dimples (Bearman & Harvey Reference Bearman and Harvey1993). By forcing transition of the attached boundary layer, the change of the flow regime from subcritical to transcritical is modified and separation bubbles no longer play a dominant role in the process. Also the time-mean flow remains closely two-dimensional and vortex shedding is not disrupted. Here we explore an alternative way to induce transition using disturbances caused by an array of miniature jets emerging normally from the surface of a cylinder and investigate the effects this has on the resulting flow field. As will be described later, the jet flows were driven by pressure differences occurring naturally around the cylinder. The Reynolds numbers of the experimental study ranged from
 $Re_{D}=3\times 10^{4}$
to
 $2.8\times 10^{5}$
.
When bluff-body
 $C_{D}$
reduction is the objective, the question arises: What is the most effective way to force transition of the boundary layer? This question is of importance in competitive cycle racing, for example, where, as discussed by Crouch et al. (Reference Crouch, Burton, Brown, Thompson and Sheridan2014), the majority of the aerodynamic resistance is generated by the rider. Typical Reynolds numbers based on the diameters of arms and legs fall within the subcritical regime for a cylinder, and the torso of a rider reaches into the critical regime. Hence there is scope for reducing drag by manipulating transition, and considerable effort has gone into the design of cycling clothing to help achieve this aim. However, the research to be described here is not directly related to the development of increasingly aerodynamically efficient clothing but addresses the transition question from a more fundamental perspective.
2 Experimental arrangement
Experiments were conducted in the Donald Campbell closed-return wind tunnel in the Department of Aeronautics at Imperial College. The maximum speed of the tunnel is
 $44~\text{m}~\text{s}^{-1}$
and it has a working section 1.37 m wide, 1.22 m high and 2.98 m long. The flow in the test section is of good quality; at
 $30~\text{m}~\text{s}^{-1}$
, more than
 $93\,\%$
of the cross-sectional area at the model test position maintains uniform time-mean velocity to within
 $\pm 0.375\,\%$
and the maximum turbulence intensity is
 $0.15\,\%$
. The tunnel is equipped with an external three-component force balance measuring lift, drag and pitching moment, and a three-axis traverse gear for accurate positioning of measurement sensors, such as hot-wire probes, within the test section. In the experiments the wind speed was measured using a Pitot-static tube placed upstream of the models and positioned such that its wake did not interfere with the cylinder flow.
The cylinder models used in the investigation were machined from aluminium tubing and had a diameter,
 $D$
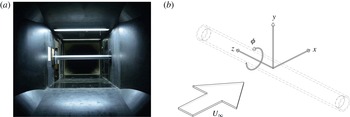
, of 99.5 mm, a wall thickness of 12 mm and a length of 1220 mm. They were connected by rods to struts outside the tunnel that were attached in turn to the overhead force balance. To avoid any corrections for tare forces, the supporting rods were kept out of the air stream by passing through dummy cylinder sections attached to the tunnel walls. Following the recommendations of Stansby (Reference Stansby1974), end effects were minimised by using end plates 500 mm long, 300 mm high and 1.7 mm thick. The resulting active cylinder length-to-diameter ratio was 12.26. A view of the cylinder in the tunnel, taken from inside the contraction, is shown alongside a schematic of the axis system used in figure 2(a). A left-handed coordinate system is used where the free-stream flow direction is assigned to the
 $x$
-direction (positive downstream), the vertical component is the
 $y$
-axis (positive upwards) and the cylinder spanwise component is the
 $z$
-axis (positive to the left when looking from upstream). The angle about the
 $z$
-axis of the cylinder,
 $\unicode[STIX]{x1D719}$
, is given as shown, where
 $\unicode[STIX]{x1D719}=0^{\circ }$
is taken to be the foremost upstream point of the cylinder circumference (the mean position of the frontal stagnation point of the cylinder). Angle
 $\unicode[STIX]{x1D719}$
is given as positive in an anticlockwise direction when viewing in the (
 $x,y$
)-plane with flow from left to right. The force balance was used to measure the time-mean lift as well as drag, since in the critical regime Bearman (Reference Bearman1969) had shown that there can be differences in the time-mean separation positions resulting in the generation of a transverse force. The forces on the cylinder could be measured to an accuracy of approximately 3 % at the lowest Reynolds number tested, with the uncertainty falling to approximately 0.7 % at the highest Reynolds number.
Photograph and schematic of test cylinder: (a) one of the cylinders mounted in the working section, and (b) schematic definition of axes coordinate system.

The arrangement for mounting cylinders in the tunnel was the same as that used earlier by Bearman & Harvey (Reference Bearman and Harvey1993) to investigate the effect of a dimpled surface on the drag coefficient of a cylinder. As part of the present study, we were able to make further measurements employing the cylinder they used. The geometric blockage of the cylinder models was 8.16 % and corrections to Reynolds number and force coefficients were made using the method of Allen & Vincenti (Reference Allen and Vincenti1944). The formulae required can also be found in Roshko (Reference Roshko1961), where the method was used to correct for 13.6 % blockage of a cylinder.
The main objective of the experiments was to investigate the effectiveness of transverse jets in triggering transition and reducing
 $C_{D}$
. The jets will be referred to as passive jets, as they are driven by the pressure difference developed between flow entry points along the front stagnation line and exit points at
 $\pm 65^{\circ }$
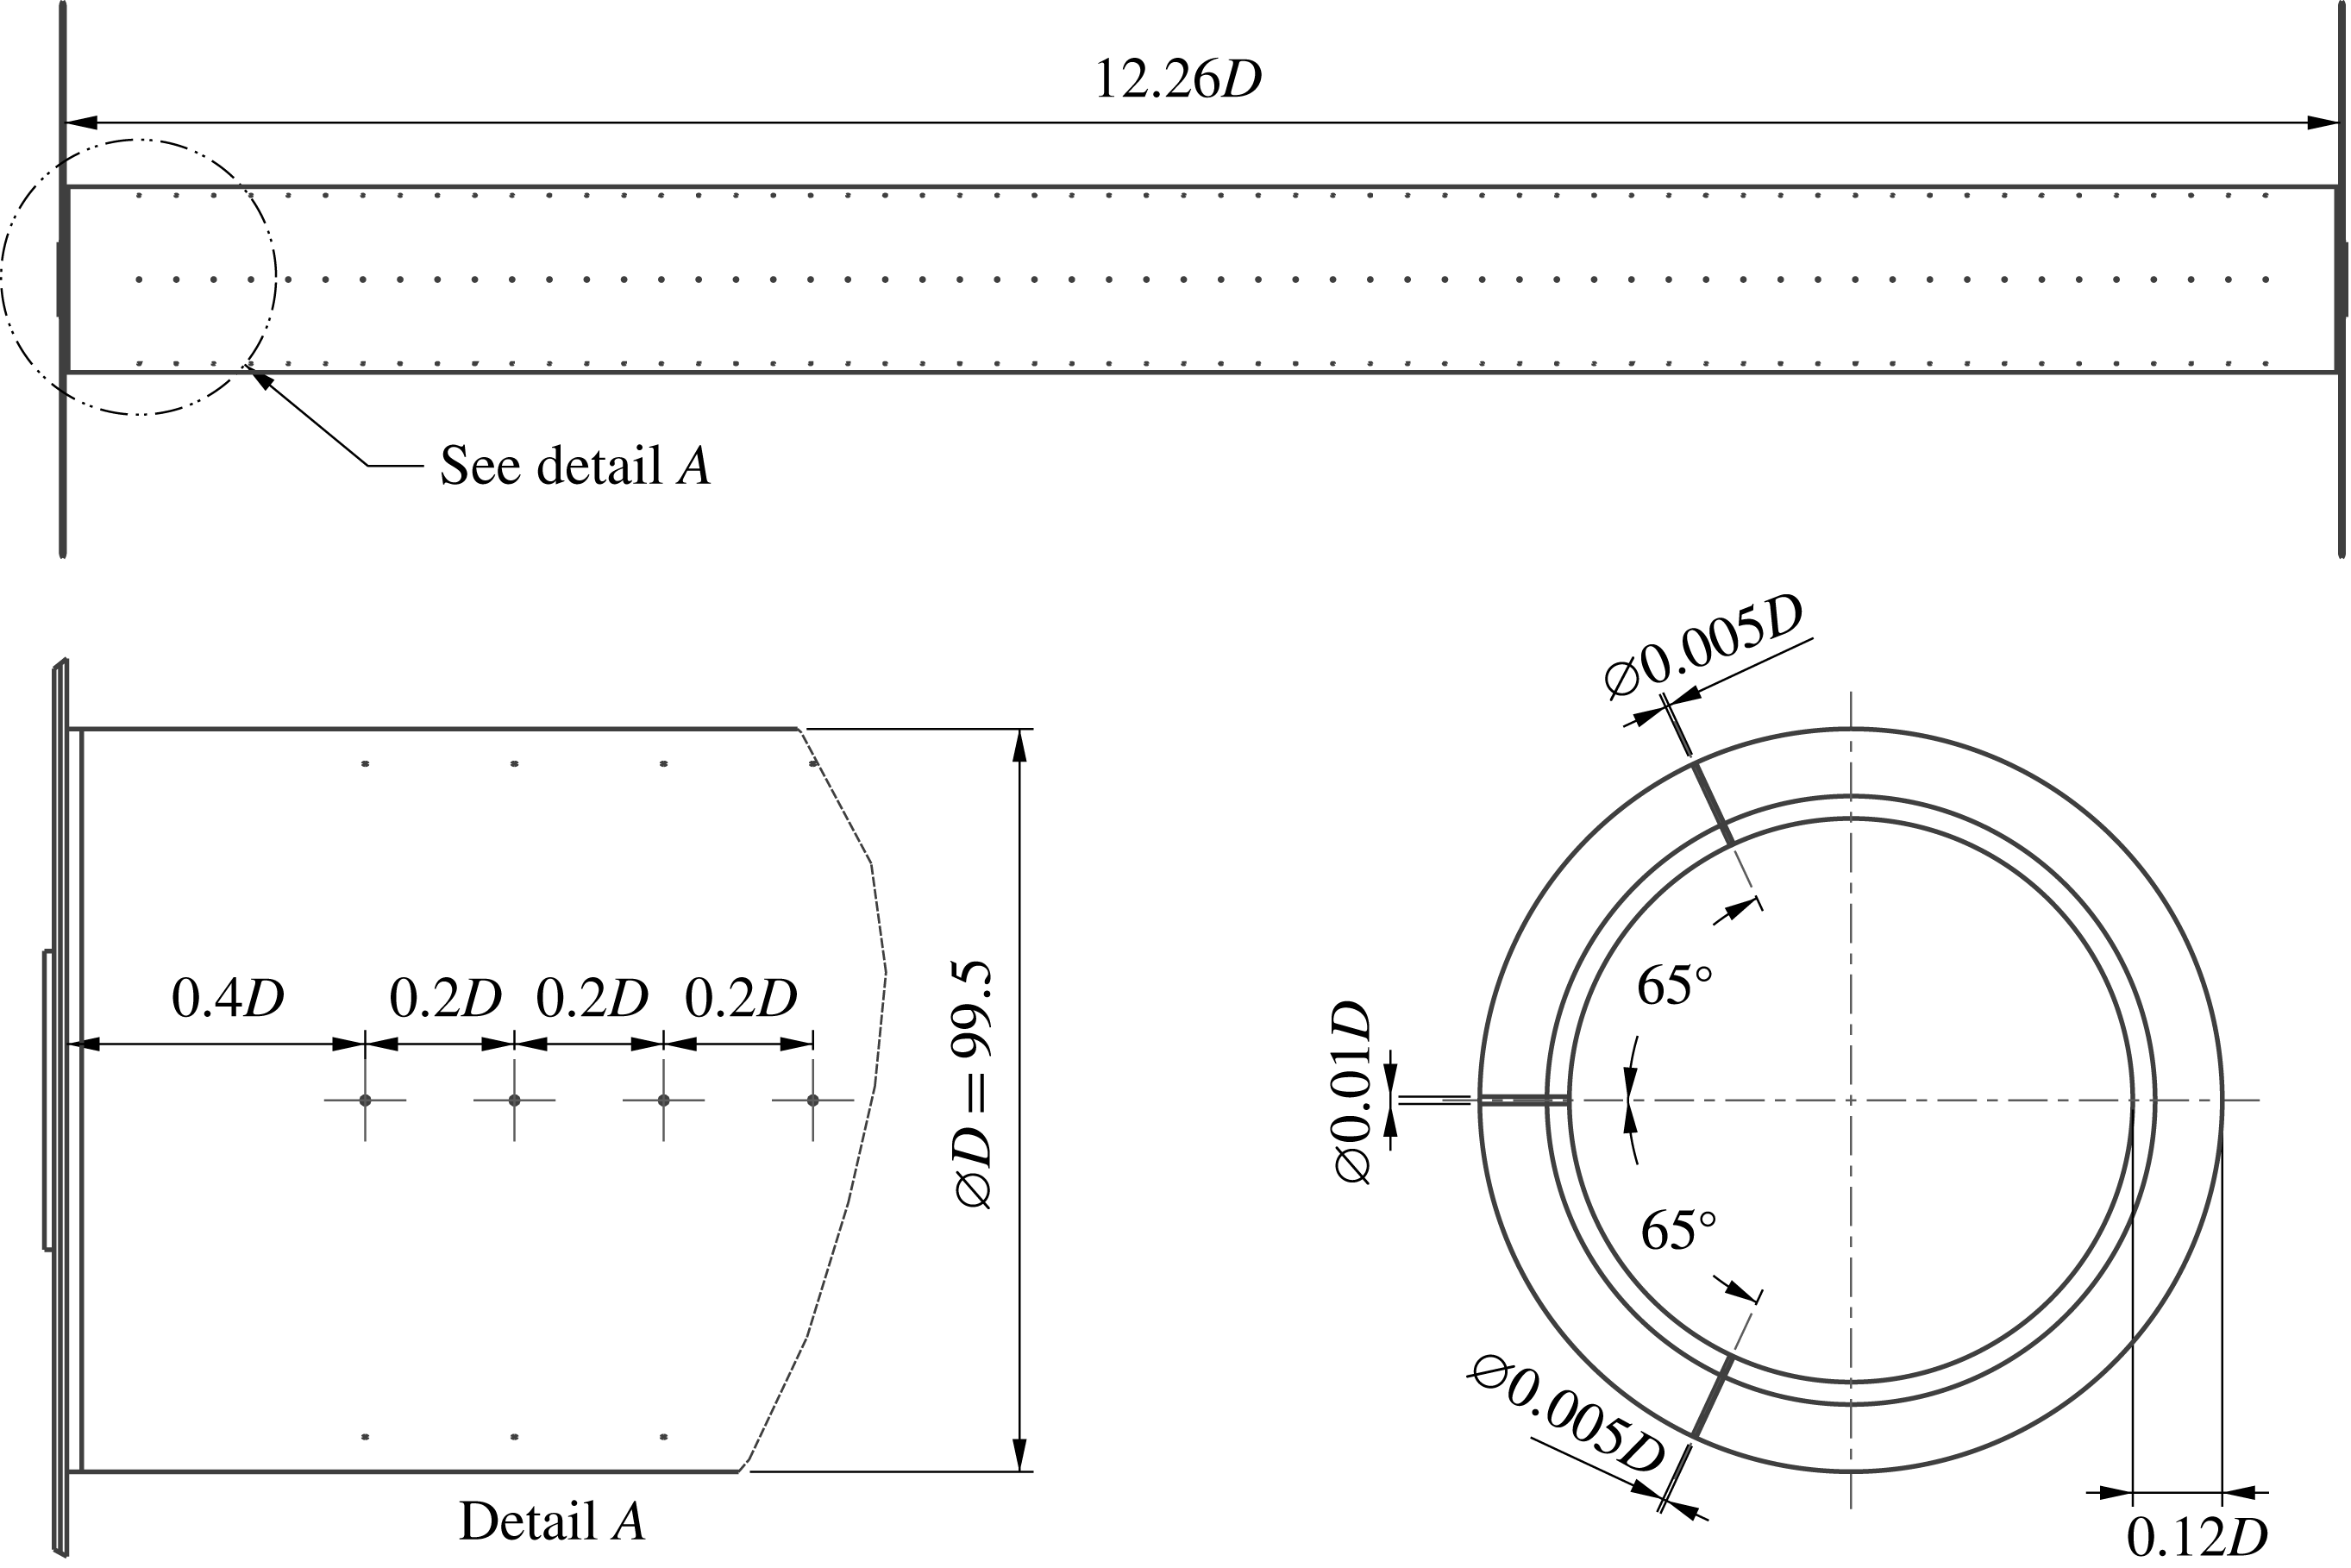
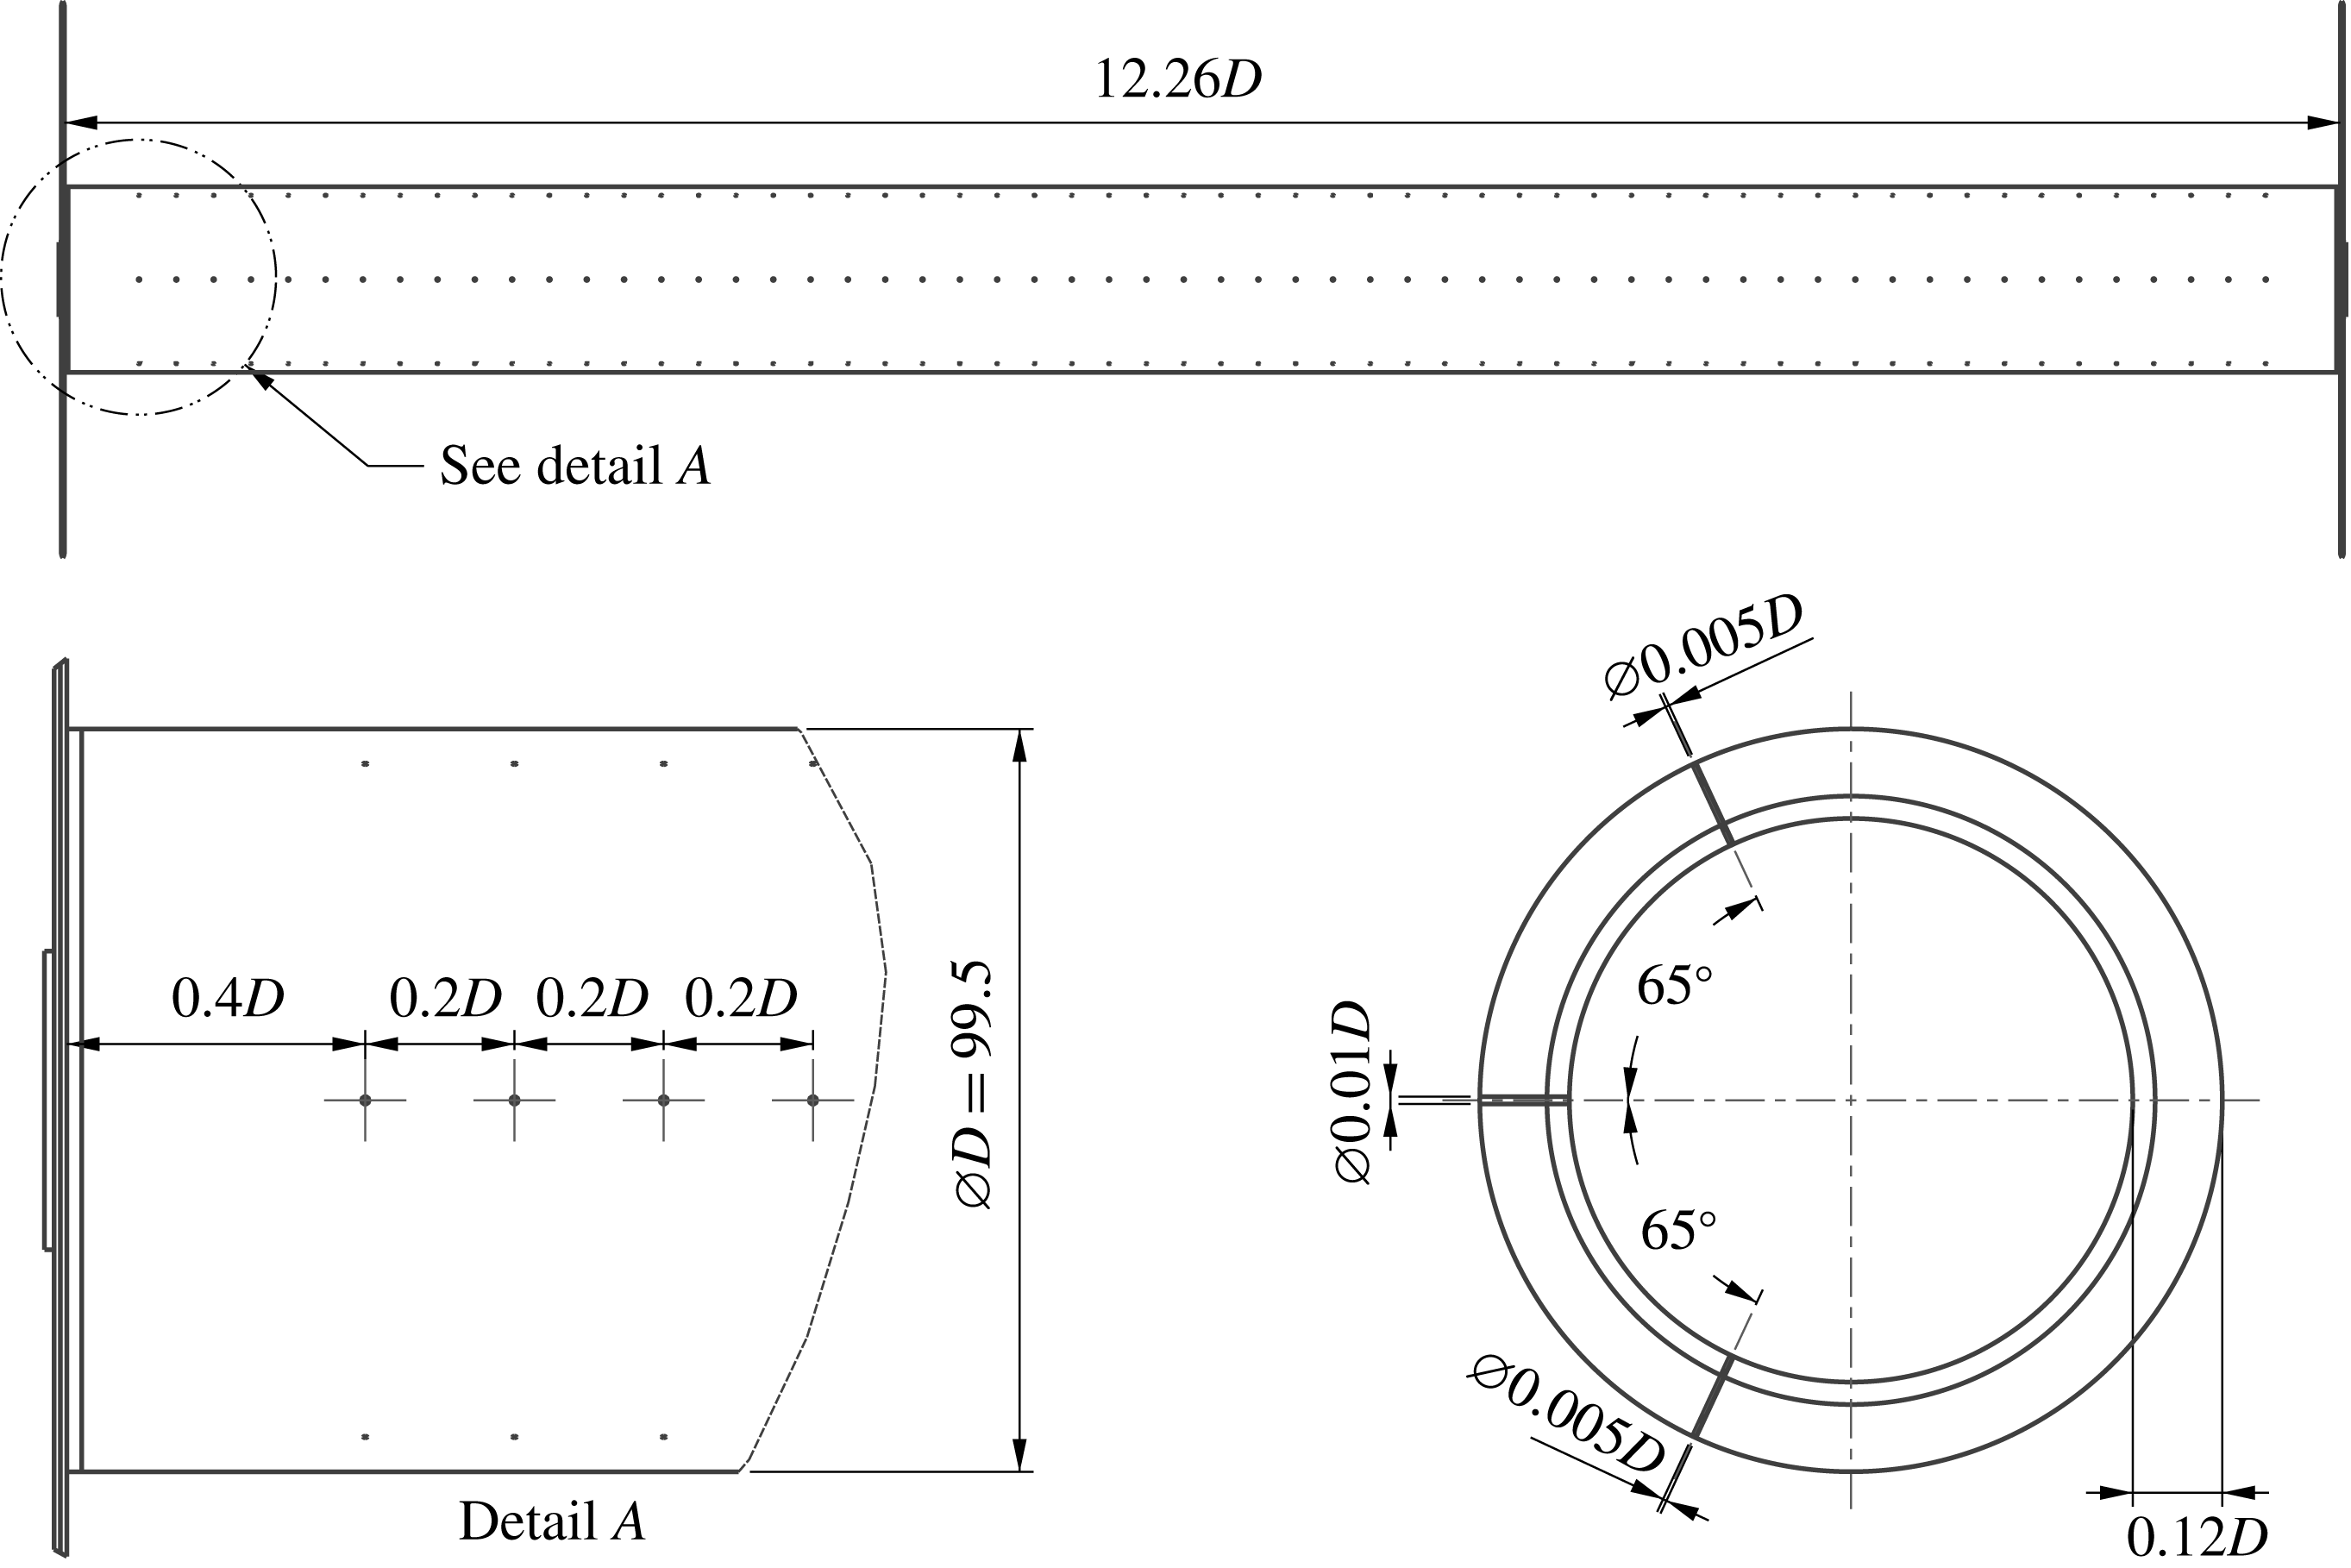
around the circumference. The circumferential positions of the exit holes were chosen based on a finding of James & Truong (Reference James and Truong1972) that these were the most favourable positions for trip wires with diameters less than the local laminar boundary thickness. Also they are close to positions that generate the maximum pressure difference to the stagnation pressure at subcritical Reynolds numbers. The flow entry and exit holes for one of the arrangements investigated are shown in figure 3. Three spanwise rows of 58 holes were drilled through the cylinder wall such that each hole connected with the internal cylinder volume which acted as a plenum chamber. The diameters of the rows of holes at
 $\pm 65^{\circ }$
were 0.5 mm, or 0.005 when non-dimensionalised by the cylinder diameter. The holes along the front stagnation line were twice the diameter, so given that there were twice the number of flow exit holes, the total flow entry area was twice the total flow exit area. The holes in each row were spaced
 $20~\text{mm}$
apart (
 $z_{J}/D=0.2$
), but at each end of the cylinder the distance from the last holes to the end plates was 40 mm. Measurements were also made for a second case where the hole spacing was reduced to 10 mm (
 $z_{J}/D=0.1$
). It was important that air could only pass into and out of the cylinder via the drilled holes and hence airtight end caps were fitted to the cylinder. A pressure tapping was inserted in each end cap so the pressure inside the cylinder could be monitored.
To obtain the average velocity across the jets as the flow emerged from the holes in the cylinder surface, a separate set of measurements was made with the holes on the stagnation line sealed. In these experiments, air from an external air supply entered the cylinder through flexible tubes attached to connections in the end caps. For this set of measurements, care was taken to make sure the presence of the tubes did not affect force measurements. The flow rate was adjusted until the internal pressure, obtained from the pressure tappings in the end caps, matched that recorded with the passive jets at the same cylinder Reynolds number. When the internal pressures were matched, there was found to be good agreement between the drag coefficients measured in the two cases. Flow meters were used to measure the flow entering each end of the cylinder and the average jet velocity could then be calculated. In order to obtain a reliable estimate, this method was preferred to attempting to measure the velocity profile across a 0.5 mm diameter jet directly using particle image velocimetry (PIV) or hot-wire anemometry. This was necessary in particular as in a cross-flow it could not be assumed that the emerging jet flow would be axisymmetric.
Cylinder schematic showing the arrangement of flow entry and exit holes for the passive jets with 20 mm spacing. All dimensions are in millimetres.
Details of the flow close to the surface of a cylinder were obtained using the surface oil flow visualisation (SOFV) method. The mixture applied to the cylinder was one part talcum powder, five parts paraffin and one part Tonna 68 oil and, to avoid clogging the holes, it was only applied to the cylinder surface downstream of the arrays of holes. Depending on the observation being made, images were captured in two ways: either by still photographs after the wind tunnel run was complete and the oil flow pattern had stabilised, or by making video recordings during a run. The video recordings were particularly useful for providing information on the direction of rotation of vortical structures close to the surface and the development of the skin friction lines as the tunnel speed increased to its required setting. It was also possible to obtain the angular locations of flow separation relative to the front stagnation line along the cylinder, denoted by the circumferential angle,
 $\unicode[STIX]{x1D719}$
. The SOFV method, although far from being novel, produced some very useful and surprising results.
Hot-wire anemometry was used to detect preferred frequencies in the flow, the most obvious being the one associated with von Kármán vortex shedding. For measurements of the shedding frequency, a Dantec Dynamics 55P16 (single-sensor, miniature, straight) hot-wire probe was used. The hot-wire probe was positioned at
 $x/D=1.5$
and
 $y/D=0.5$
, where
 $x$
is the distance downstream from the cylinder axis and
 $y$
is the transverse distance. The probe was traversed along part of the span, either side of the centreline, so as to capture signals both behind a jet and between jets. In order to obtain the flow velocity at the edge of the boundary layer above the jet exit holes, referred to as the cross-flow velocity, PIV was used. A two-dimensional set-up was employed to obtain velocity vectors close to the cylinder surface in the
 $(x,y)$
-plane. A full description of the PIV apparatus used for these measurements can be found in Clapperton Surfleet (Reference Clapperton Surfleet2017).
3 Experimental results
3.1 Drag coefficients for circular cylinder fitted with passive transition devices
Before embarking on a study of the effectiveness of passive jets in triggering the transcritical regime at a reduced Reynolds number, it was decided to carry out a series of measurements for comparison purposes using a plain cylinder, a plain cylinder fitted with trip wires and a cylinder with a dimpled surface. The experimental arrangement for each one was as described in § 2. For the cylinder with trip wires, the wires were fixed to the plain cylinder surface at
 $\pm 65^{\circ }$
from the front stagnation line. The wire used had a diameter of 0.47 mm, and was fixed to the cylinder with tape 0.02 mm thick. This gave a ratio of trip wire to cylinder diameter,
 $d/D$
, of 0.0049. The dimpled cylinder was the one used by Bearman & Harvey (Reference Bearman and Harvey1993) where the ratio of dimple depth to cylinder diameter was 0.0091. A full description of the geometric details is given in their paper.
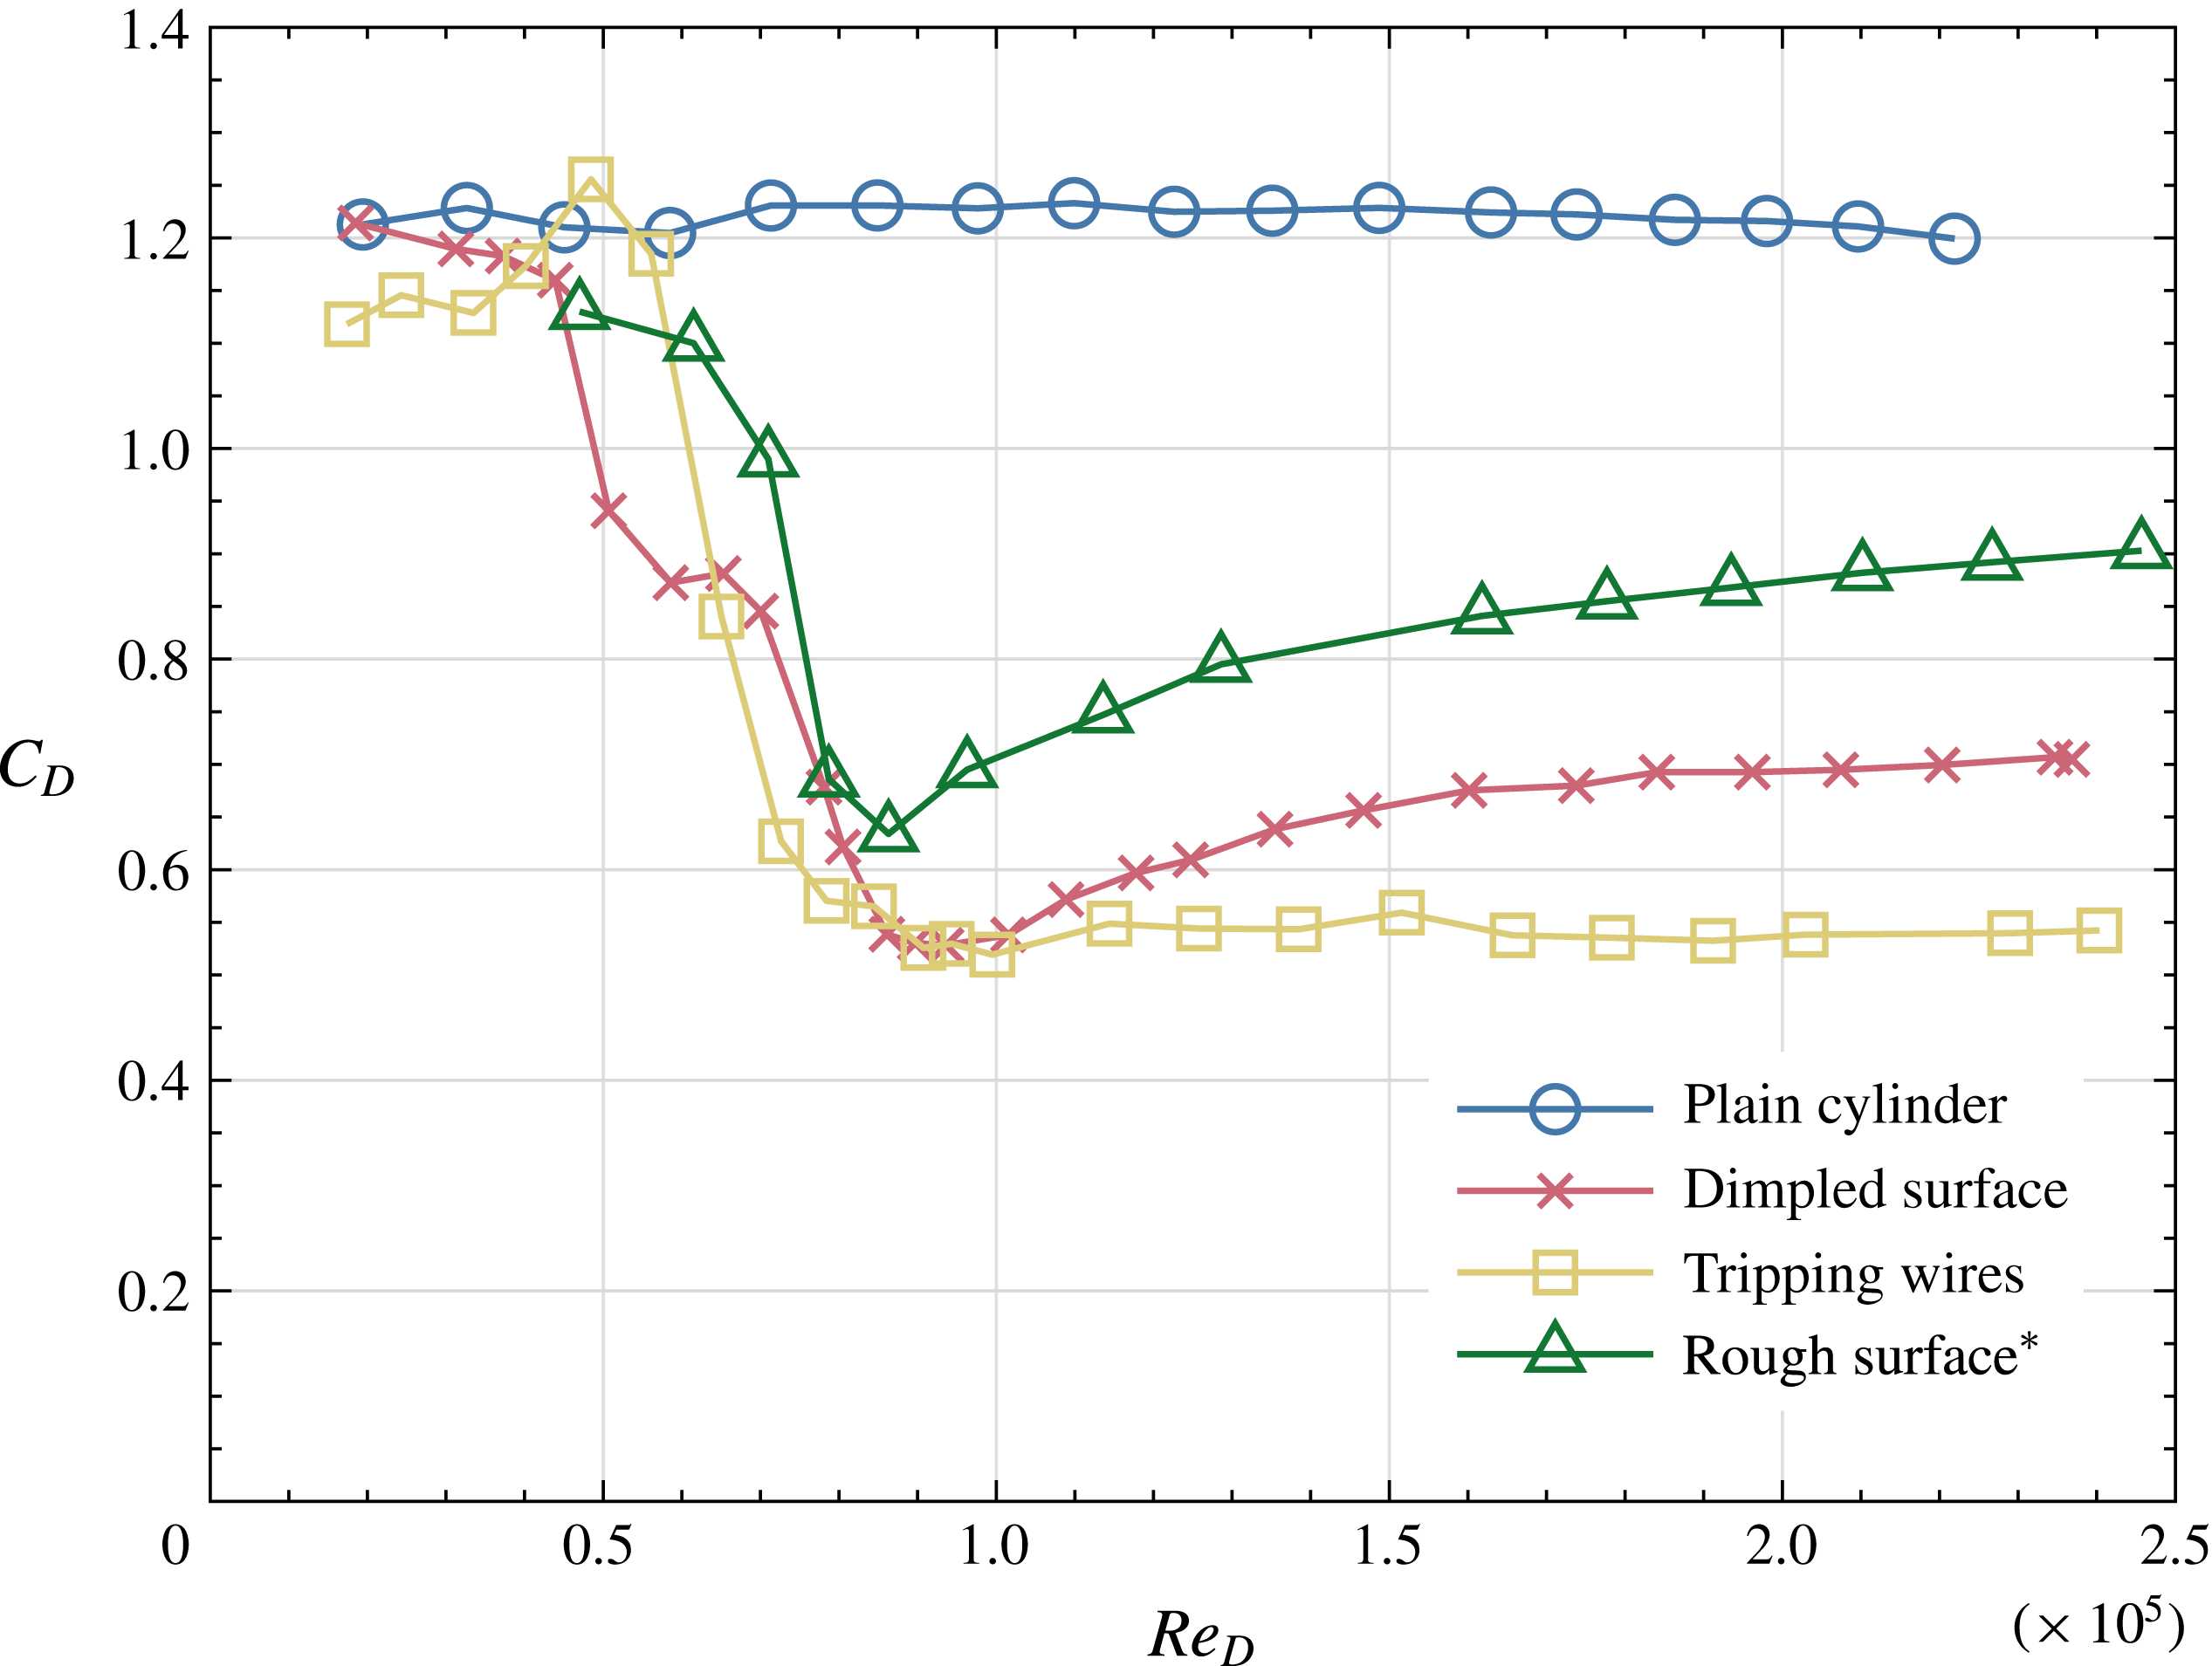
Figure 4 displays plots of the time-mean drag coefficient,
 $C_{D}$
, versus
 $Re_{D}$
for each of the three cylinder arrangements. Also included are results from Fage & Warsap (Reference Fage and Warsap1930) for a cylinder with the surface covered with glass paper. The results for the plain cylinder are consistent with those found in the literature, with a relatively constant
 $C_{D}$
value of just over 1.2, demonstrating that the cylinder flow was in the subcritical flow regime up to at least
 $Re_{D}=2.2\times 10^{5}$
. Measurements could not be made above this Reynolds number because the drag load exceeded the limit for the force balance. For a circular cylinder, the
 $Re_{D}$
value for the onset of the critical regime can be influenced by the free-stream turbulence level, the smoothness of the surface, the aspect ratio, end effects, etc. Hence it was important to establish that, over the majority of the range of
 $Re_{D}$
to be studied, the plain cylinder remained in the subcritical regime. As anticipated, the
 $C_{D}$
values obtained for the dimpled cylinder match closely those of Bearman & Harvey (Reference Bearman and Harvey1993) for their ‘dimple on the flow axis’ case. It can be seen that the
 $C_{D}$
for the dimpled cylinder falls to a minimum value of 0.53 at approximately
 $Re_{D}=9.4\times 10^{4}$
. The drag coefficient rises from its minimum value with increasing
 $Re_{D}$
and looks to reach a fairly constant value beyond
 $Re_{D}=1.8\times 10^{5}$
with a drag coefficient of
 $C_{D}=0.7$
.
Variation of drag coefficient with Reynolds number for a plain cylinder, a cylinder with a dimpled surface, a cylinder with tripping wires positioned at
 $\pm 65^{\circ }$
and a cylinder with a rough surface (
 $^{\ast }$
measurements of Fage & Warsap (Reference Fage and Warsap1930)).

In the case of the plain cylinder fitted with trip wires, the variation of
 $C_{D}$
with
 $Re_{D}$
matches closely the dimpled cylinder up to the minimum value of
 $C_{D}$
. Beyond this point, the drag coefficient remains relatively constant at approximately 0.54 for the remainder of the
 $Re_{D}$
range investigated. For both cases the cylinder boundary layer at the separation points will be turbulent, but it appears that the smooth surface downstream of the trip wires maintains a thinner turbulent boundary layer when compared with the dimpled cylinder, and this causes the flow to remain attached a little further around the cylinder. A similar effect occurs when small-scale roughness is added to the cylinder, as illustrated by the data from Fage & Warsap (Reference Fage and Warsap1930). We observe a variation of
 $C_{D}$
with
 $Re_{D}$
similar to that of the dimpled cylinder, but beyond the minimum
 $C_{D}$
value the rise in
 $C_{D}$
is greater, indicating earlier separation.
Considering the results plotted in figure 4, trip wires are the most successful device for reducing
 $C_{D}$
in the range of Reynolds number investigated. However, distributed fine-scale roughness has the advantage that it is effective regardless of the flow direction, but it does not perform as well as covering the cylinder surface in dimples. In this paper we explore the use of passive jets to trigger earlier transition and investigate how
 $C_{D}$
values compare with those plotted in figure 4.
3.2 Experiments with passive jets
3.2.1 Feasibility of the concept
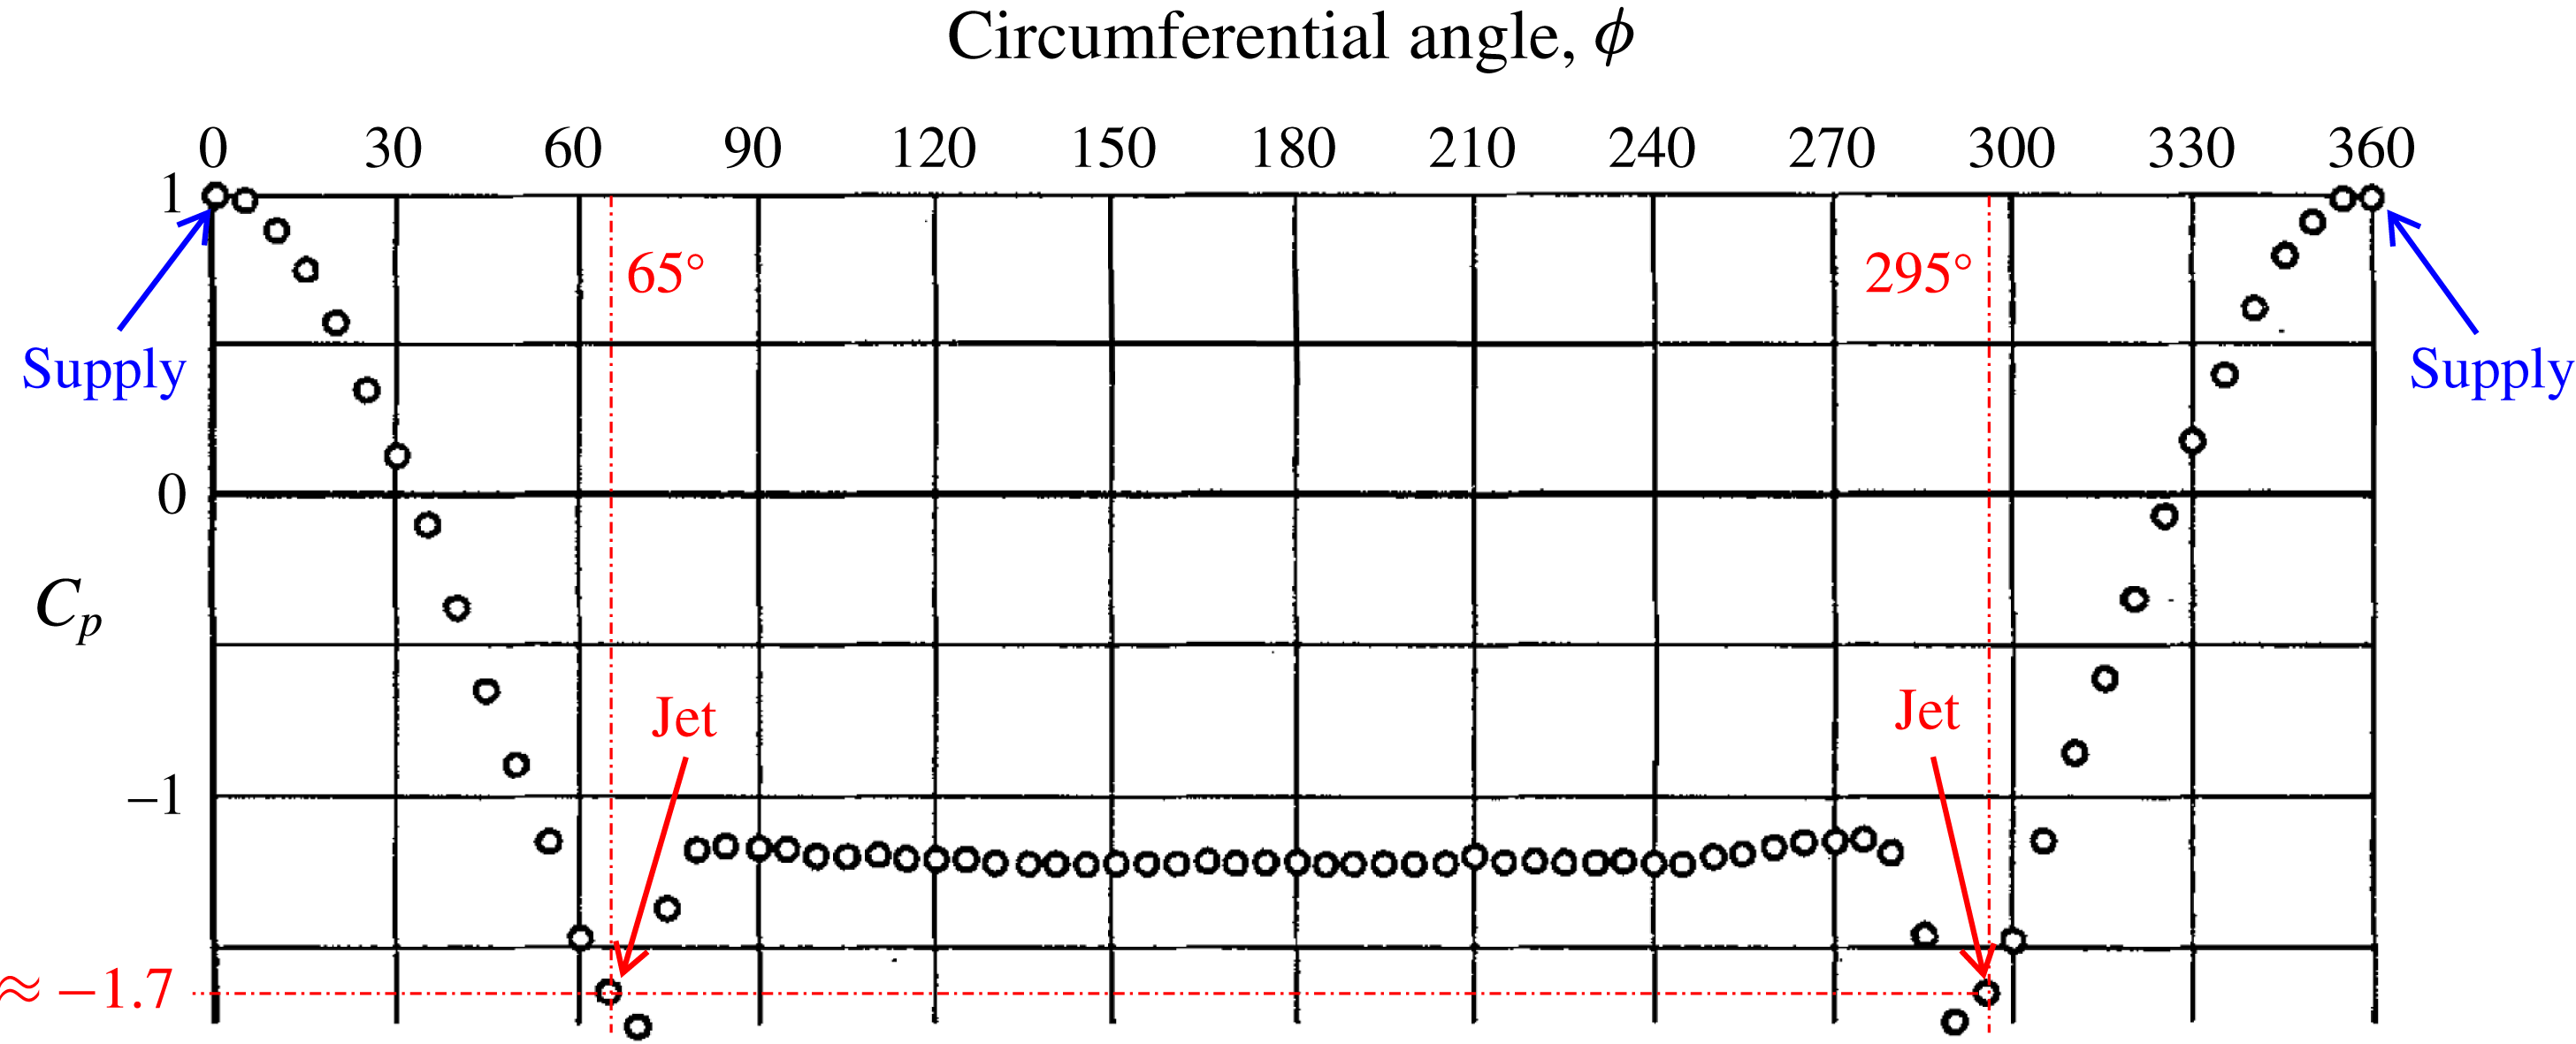
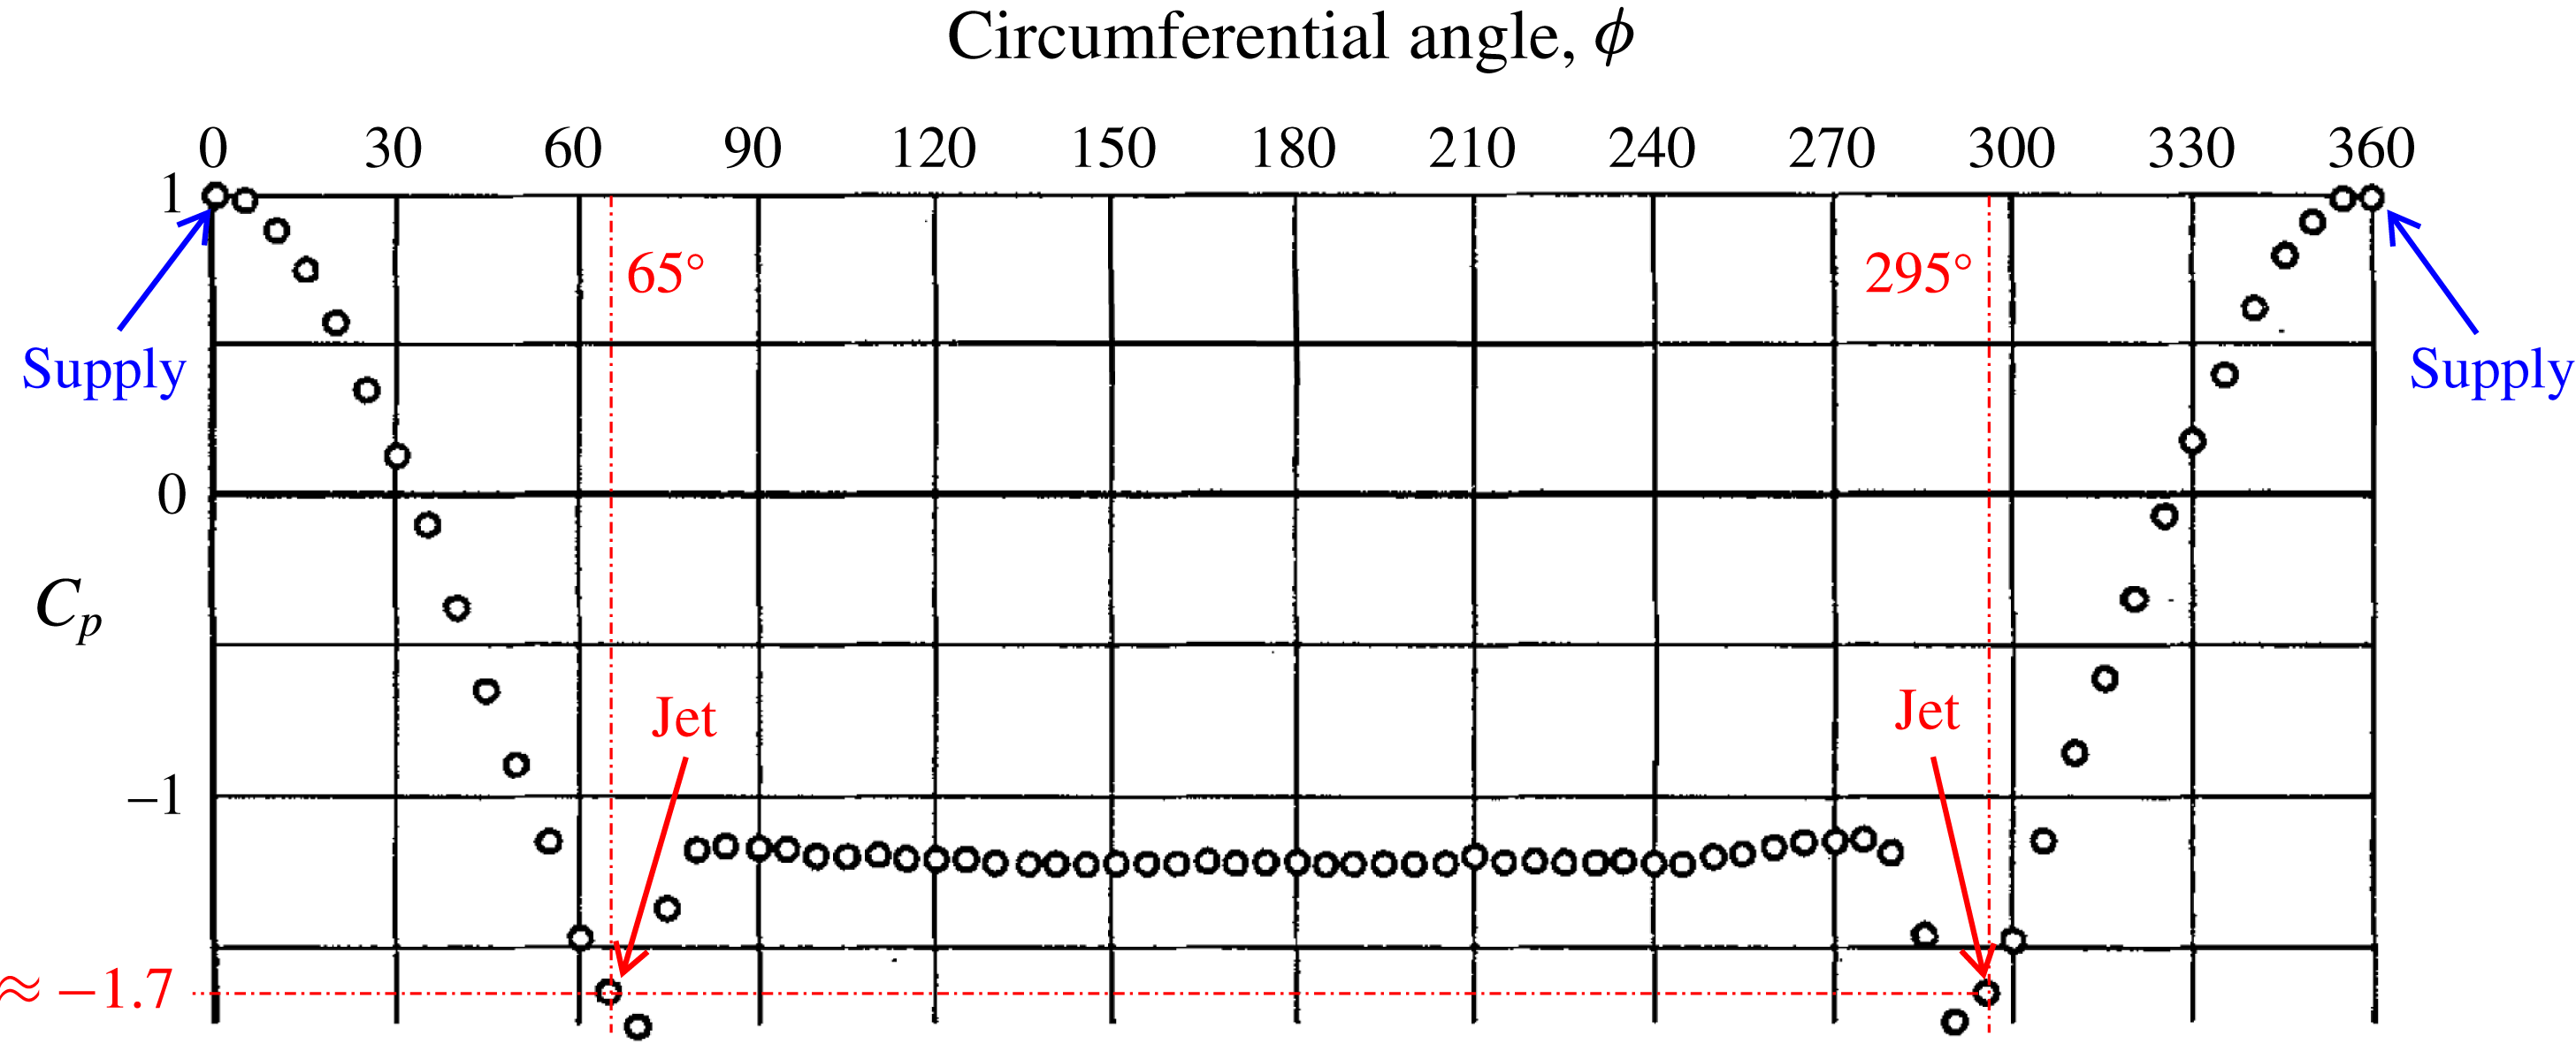
The proposition is that the pressure difference, which naturally forms around a circular cylinder in the subcritical regime, can be used to drive jets normal to the surface that will force boundary layer transition, resulting in delayed separation and reduced drag. One of the difficulties in predicting the outcome is that the action of the jets will modify the pressure distribution. The pressure distribution shown in figure 5 for
 $Re_{D}=1\times 10^{5}$
, published by Achenbach (Reference Achenbach1968), has the positions of the proposed flow intake and exit holes marked. At this Reynolds number the pressure coefficient at
 $\unicode[STIX]{x1D719}=\pm 65^{\circ }$
has a time-mean value of
 $-1.7$
indicating a possible value of
 $\unicode[STIX]{x0394}C_{p}$
between
 $\unicode[STIX]{x1D719}=0^{\circ }$
and
 $\pm 65^{\circ }$
of 2.7. Further results from Achenbach (Reference Achenbach1968) indicate that at
 $Re_{D}=2.6\times 10^{5}$
the value of
 $\unicode[STIX]{x0394}C_{p}$
rises to 3.3.
Plain cylinder mean pressure coefficient,
 $C_{p}$
, plotted against circumferential angle,
 $\unicode[STIX]{x1D719}$
, for
 $Re_{D}=1\times 10^{5}$
, from Achenbach (Reference Achenbach1968).
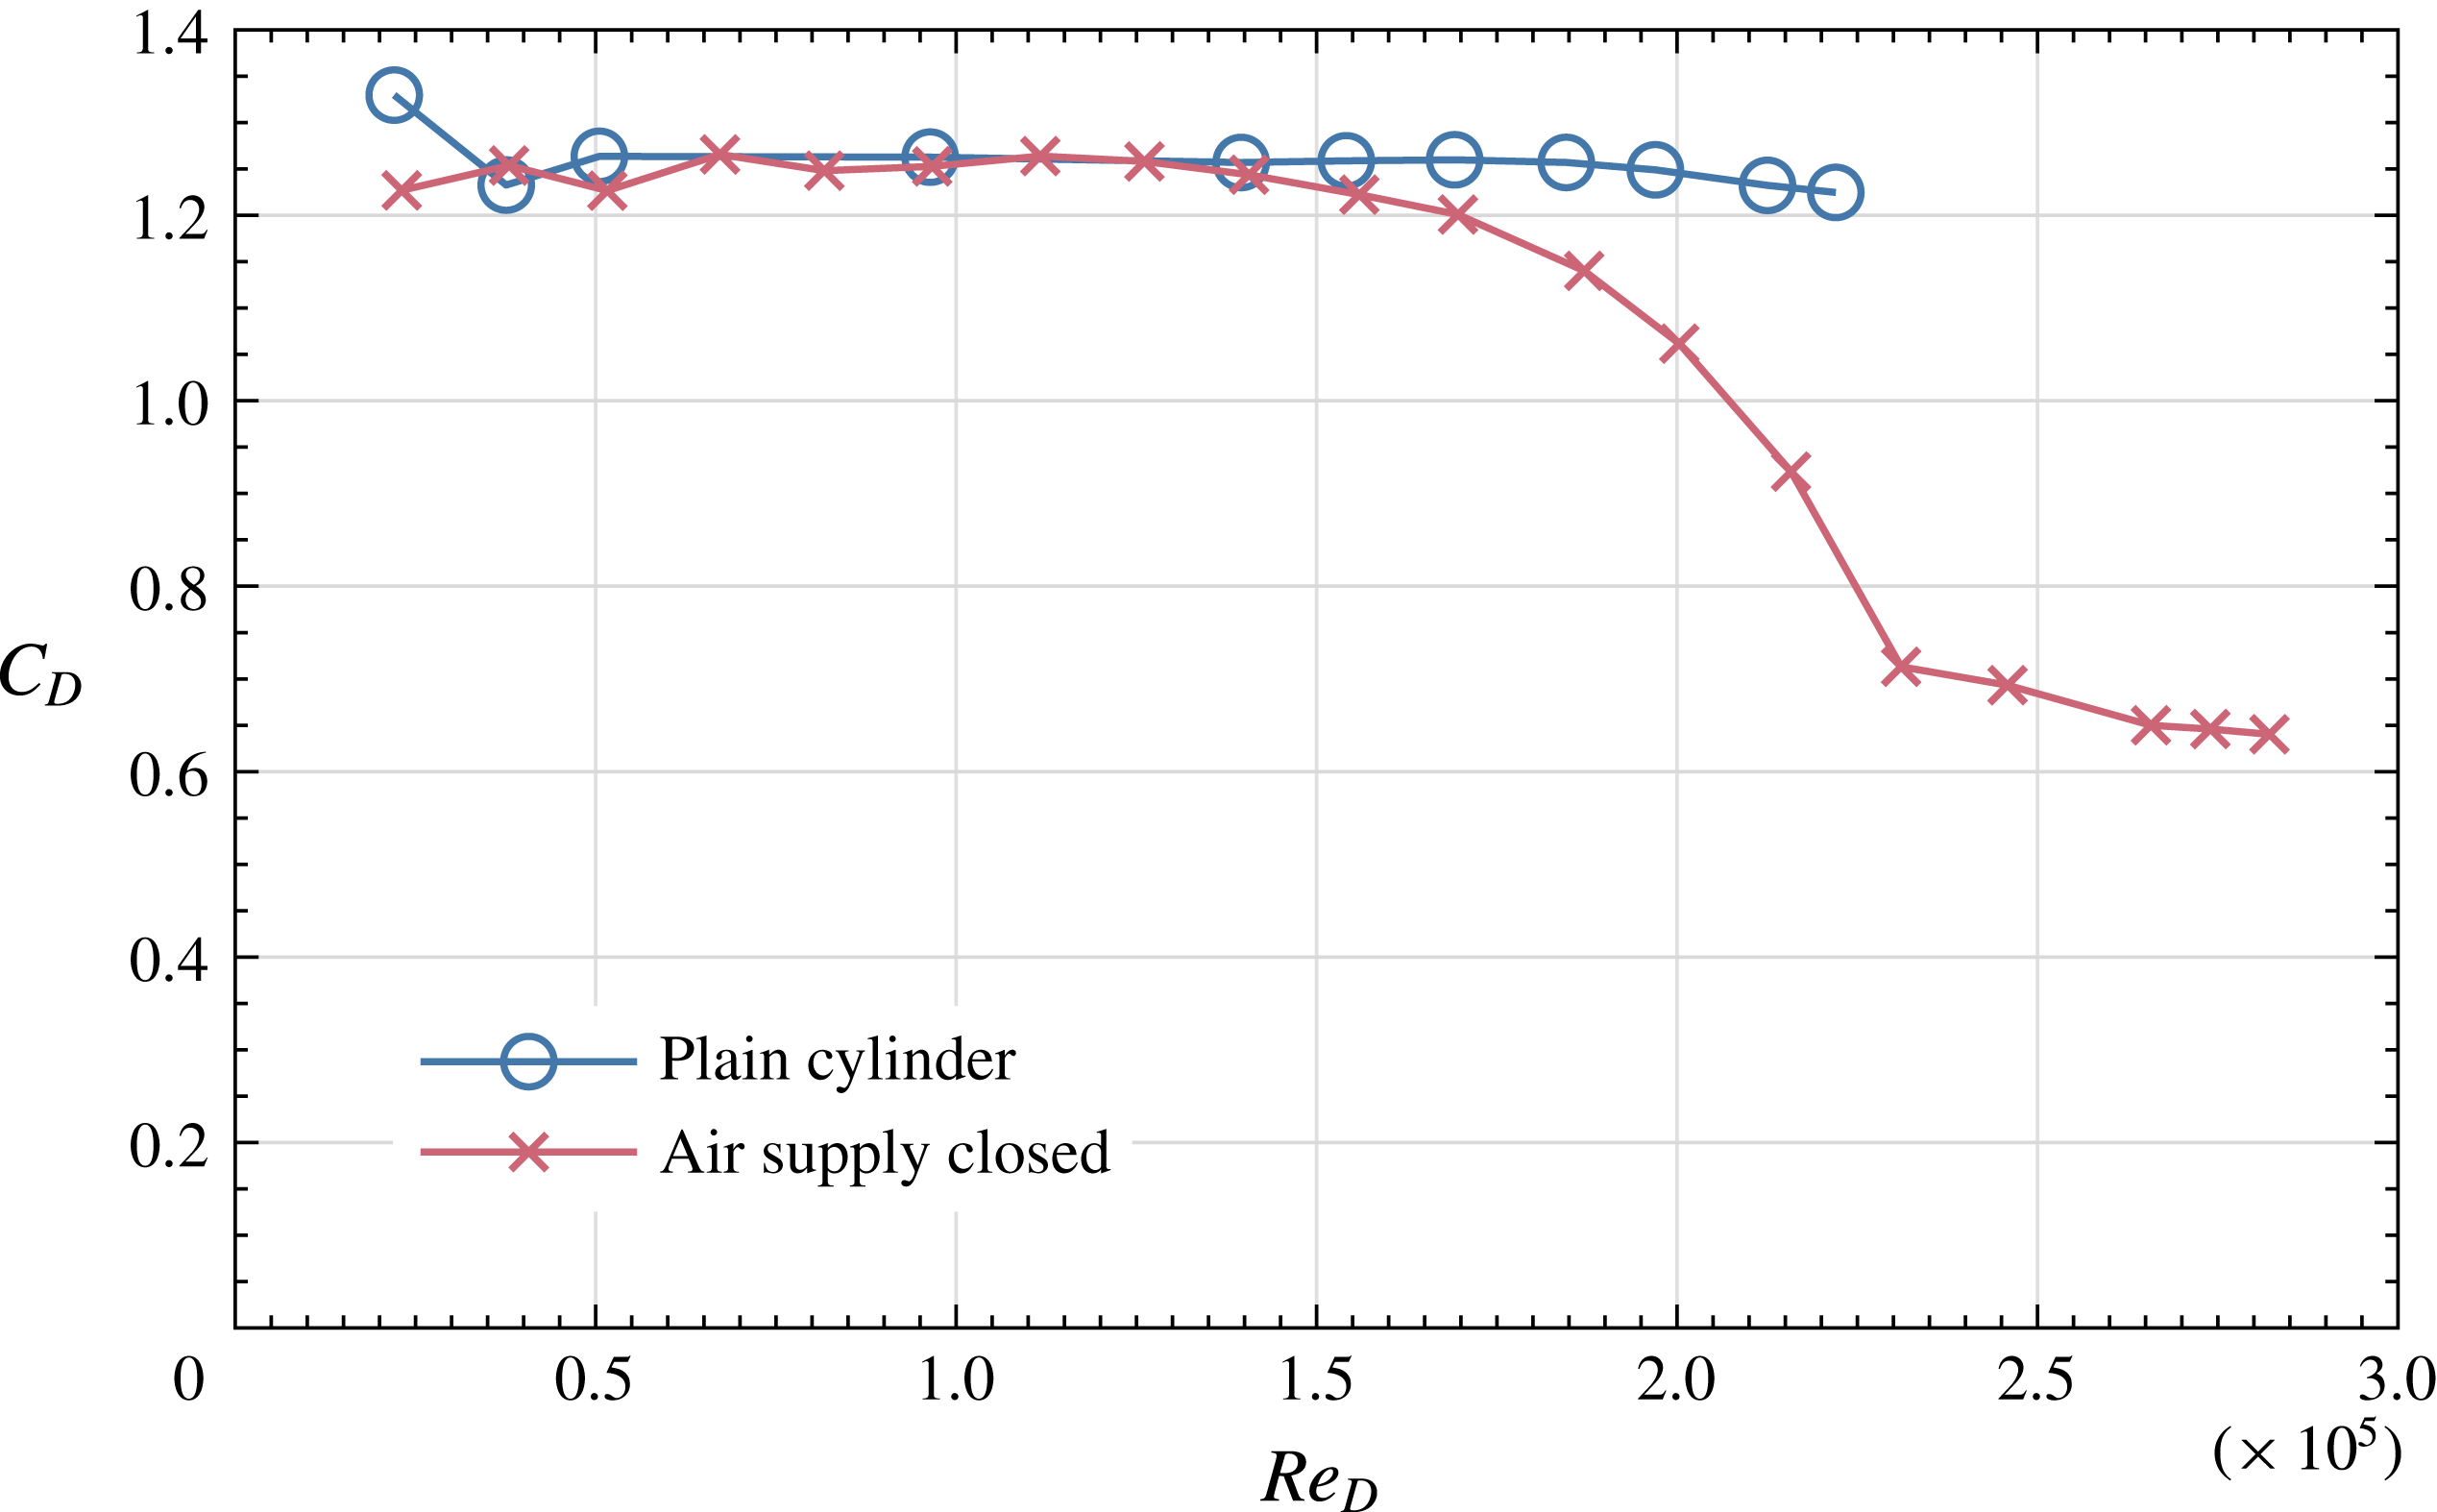
Before embarking on experiments to investigate the effectiveness of passive jets, there is a question that needs to be answered: Would the mere presence of the 0.5 mm diameter jet exit holes trip the boundary layer and mask any effects of the jets? Hence, force measurements were made with the cylinder entry holes blocked and the exit holes open. Figure 6 shows
 $C_{D}$
measurements versus
 $Re_{D}$
for the plain cylinder and the cylinder with just the exit holes open. For the cylinder with open exit holes, its
 $C_{D}$
begins to drop below that of the plain cylinder at
 $Re_{D}=1.4\times 10^{5}$
and reaches a value of 0.65 at
 $Re_{D}=2.8\times 10^{5}$
. Vortex shedding creates a fluctuating pressure difference between the two sides of a cylinder, which in the case of the cylinder with open exit holes can be communicated between the holes. Hence the effect due to the holes may not necessarily be due just to the creation of disturbances to the surface geometry but may also be due to a fluctuating flow into and out of the holes.
Mean drag coefficient versus Reynolds number for a plain cylinder and the cylinder with only the jet exit holes open.

A further observation for the cylinder with exit holes open was that, at a Reynolds number of approximately
 $2.1\times 10^{5}$
, it suddenly developed a lift coefficient with a maximum value of 0.7. The sign of the lift could be changed by slightly changing the angle of the cylinder to the free stream. It appears that the lift was due to an instability whereby transition occurred on just one side of the cylinder. The resulting asymmetric pressure distribution causes a mean weak flow through the cylinder from one exit hole to the other that sustains the lift to higher values of
 $Re_{D}$
.
3.2.2 Drag and lift coefficients with passive jets
Measurements of time-mean lift and drag coefficients were made for two cylinders with open inlet and exit holes: one had a spanwise hole spacing of
 $z_{J}=0.2D$
and the other had a closer spacing of
 $z_{J}=0.1D$
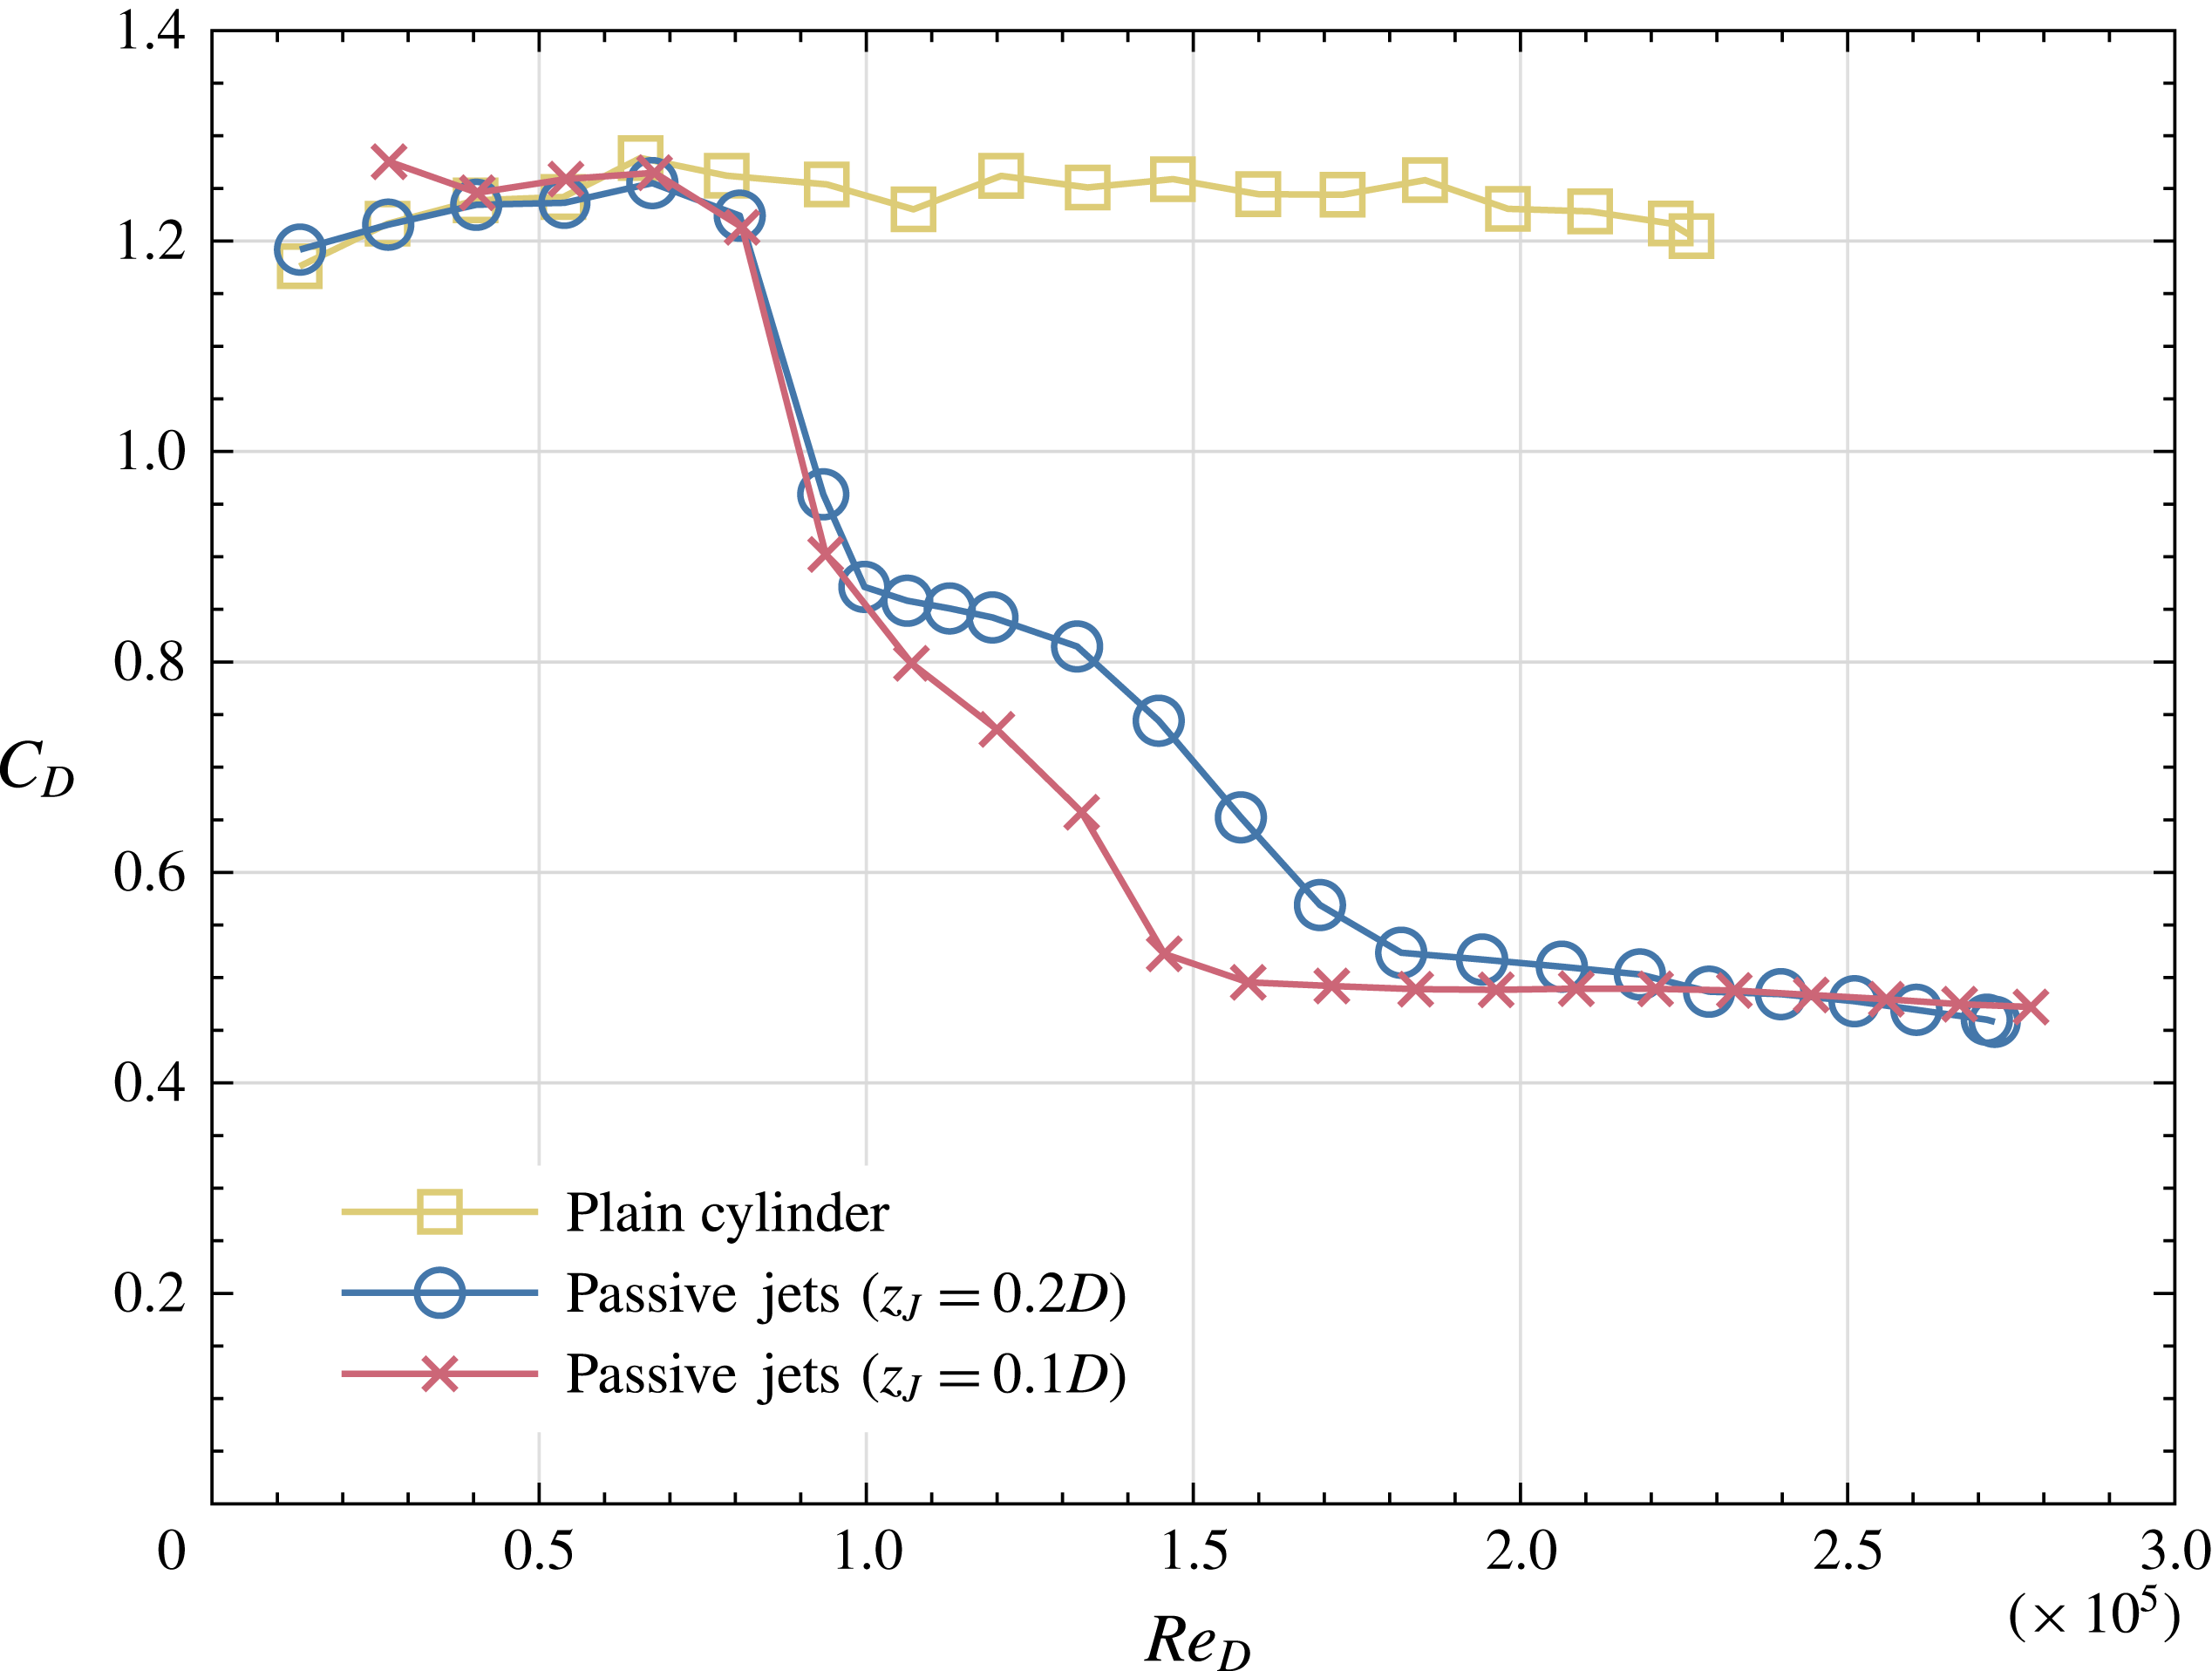
. Figure 7 shows the variation of
 $C_{D}$
with
 $Re_{D}$
for both cylinders with passive jets, together with corresponding data for a plain cylinder.
Variation of mean drag coefficient with Reynolds number for cylinders with passive jets spaced at intervals
 $z_{J}=0.1D$
and
 $z_{J}=0.2D$
together with results for a plain cylinder.

It is seen that the fall in
 $C_{D}$
, characteristic of the critical regime, is initiated at a Reynolds number close to
 $8\times 10^{4}$
for both jet spacings. Between Reynolds numbers of
 $1\times 10^{5}$
and
 $2.2\times 10^{5}$
the drag coefficient is lower for the cylinder with the smaller spacing, while for larger Reynolds numbers there is little difference between the values for the two spacings. At
 $Re=2.5\times 10^{5}$
the
 $C_{D}$
for the cylinders with jets dropped to 0.47 while for the trip-wire data shown in figure 7 the
 $C_{D}$
at a similar Reynolds number is 0.55, a reduction with the jets of 14.5 %.
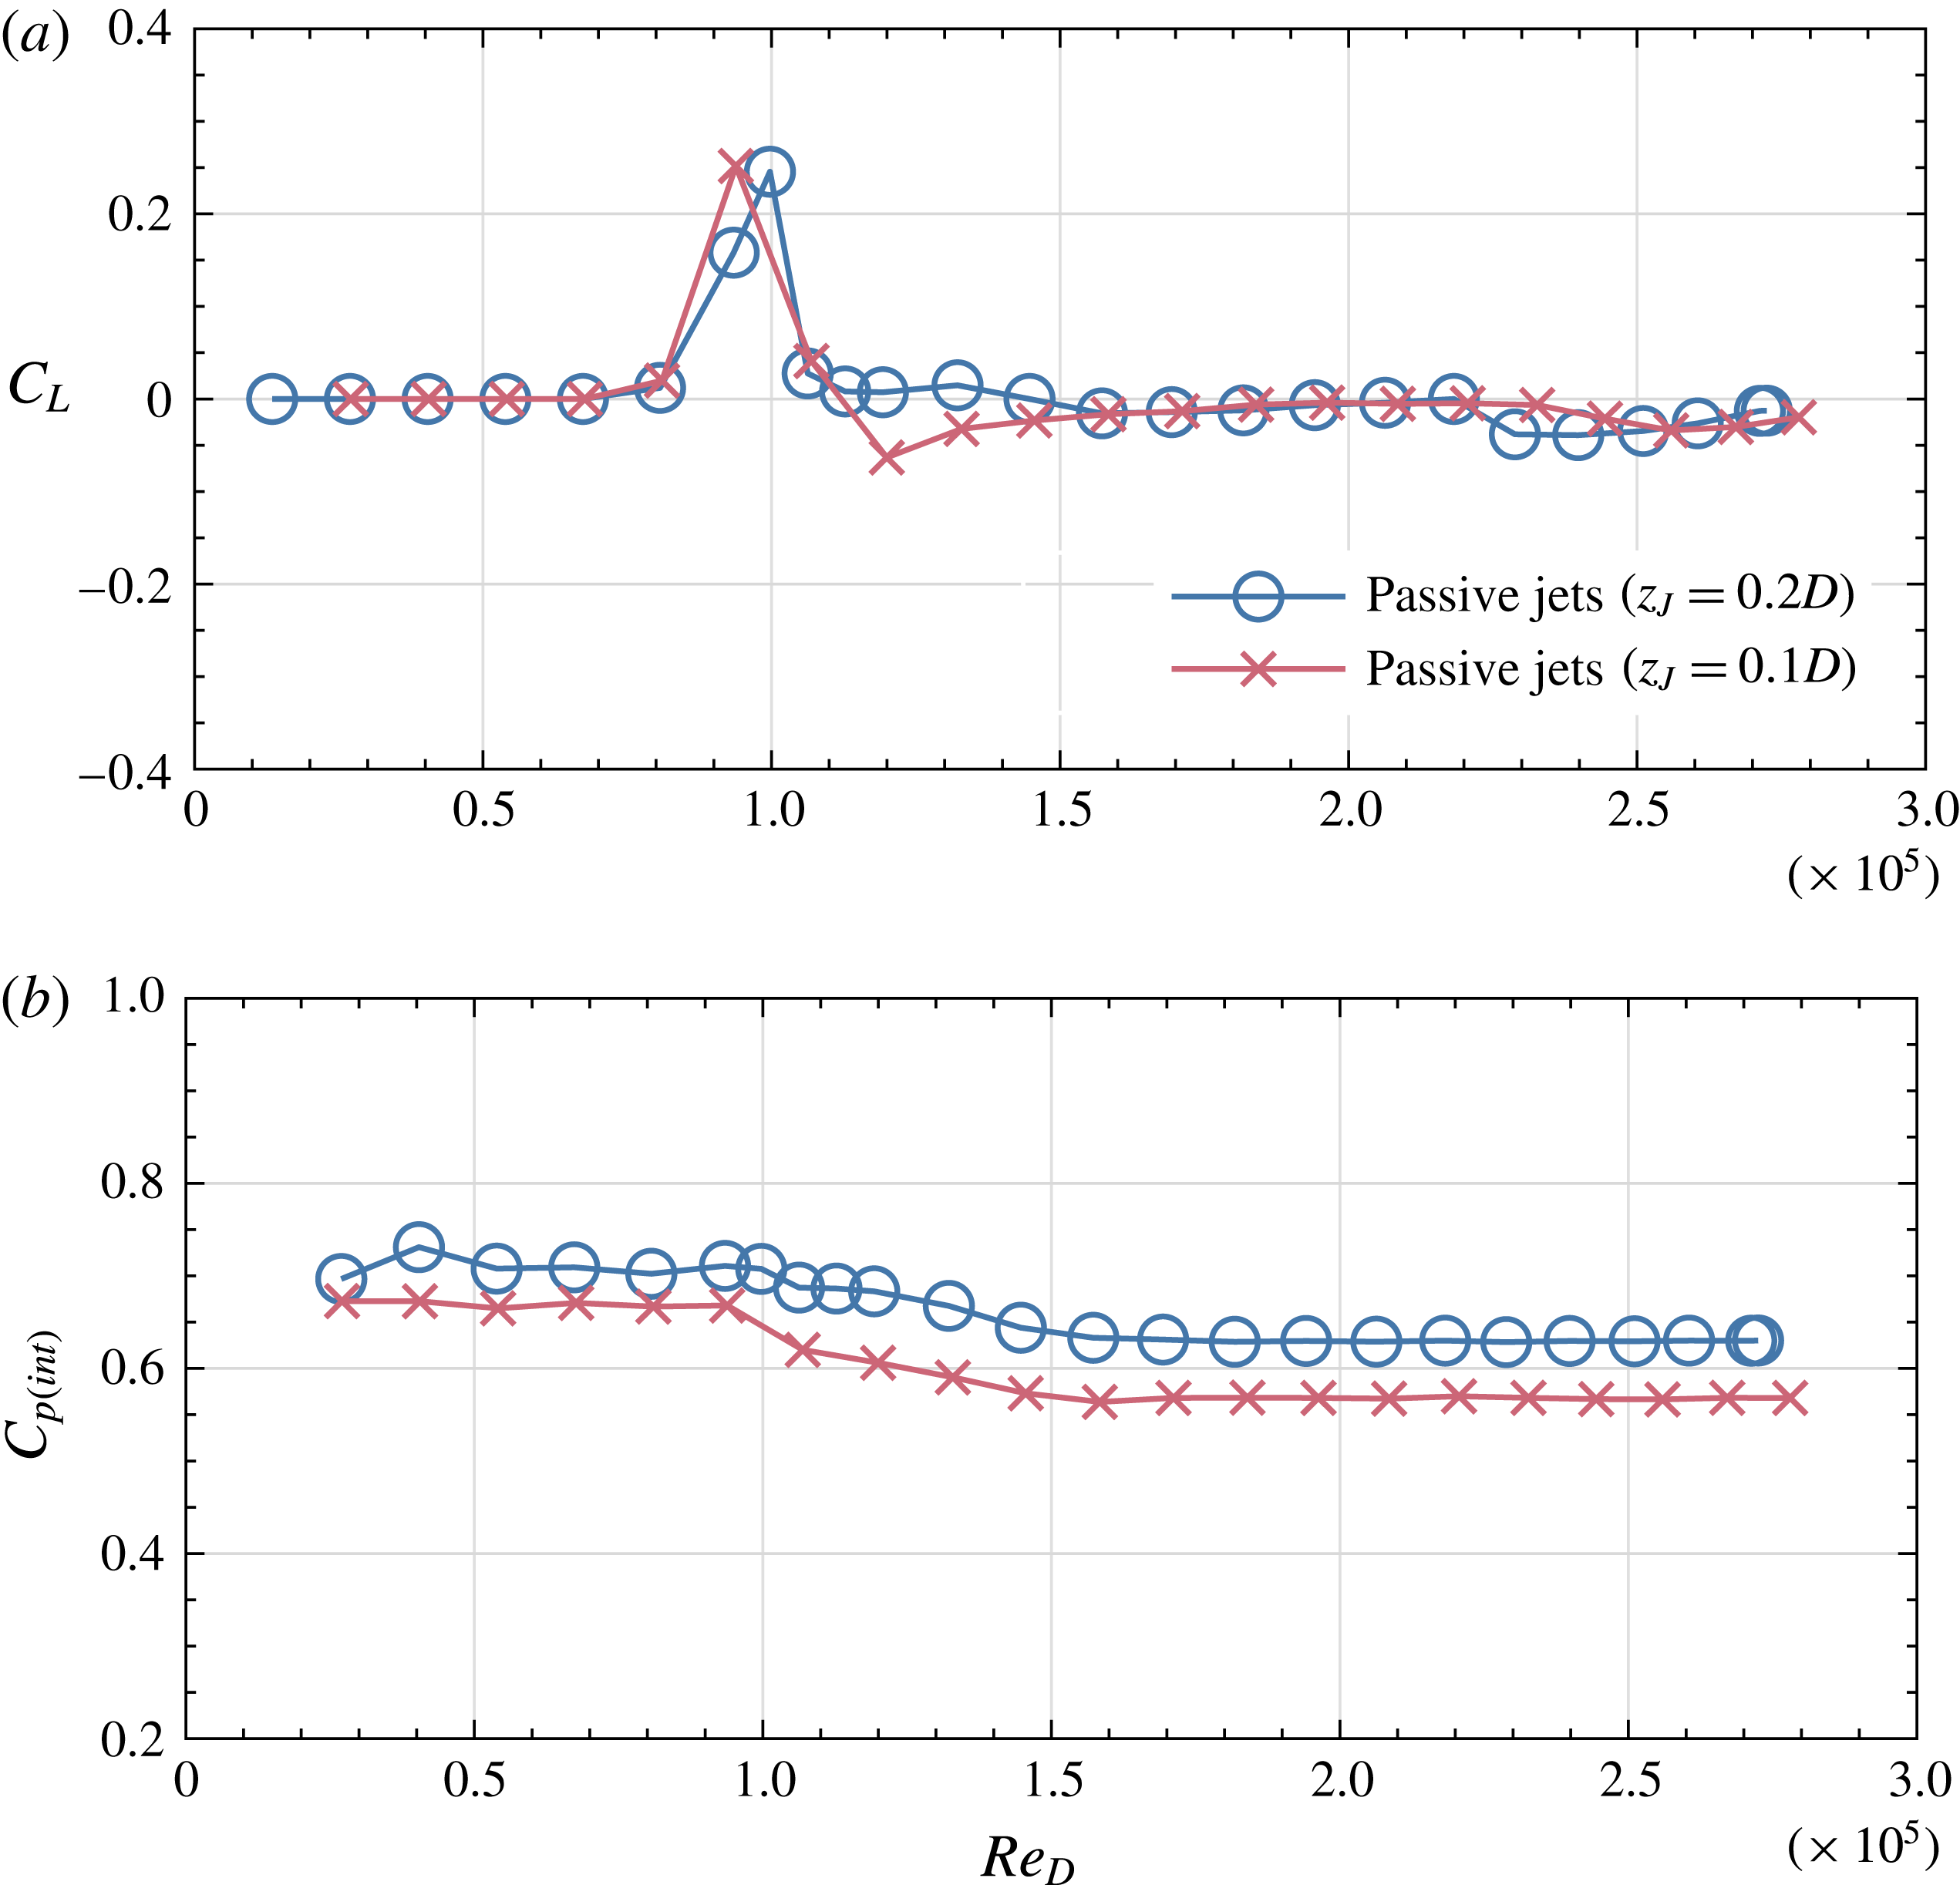
Measurements of lift, or transverse force, coefficient,
 $C_{L}$
, for the cylinders with passive jets are shown in figure 8(a). The only significant feature is the presence of a region of positive
 $C_{L}$
in the vicinity of
 $Re_{D}=1\times 10^{5}$
with
 $C_{L}$
rising to 0.25. The sign of the lift force could be changed by a slight rotational adjustment of the cylinder position. Returning to the drag coefficient data in figure 8(a), it can be seen that the onset of lift is associated with a change of slope in the variation of
 $C_{D}$
with
 $Re_{D}$
. As Reynolds number increases, the occurrence of lift is assumed to be due to an instability whereby boundary layer transition develops on one side of the cylinders before the other. A similar biased behaviour was observed by Bearman (Reference Bearman1969) during the development of separation bubbles on a circular cylinder.
Cylinders with passive jets spaced at intervals of
 $z_{J}=0.1D$
and
 $z_{J}=0.2D$
. Variation of (a) mean lift coefficient,
 $C_{L}$
, with
 $Re_{D}$
, and (b) mean cylinder internal pressure coefficient,
 $C_{p(int)}$
, with
 $Re_{D}$
.

The mean pressure measured inside the cylinders is expressed as a pressure coefficient,
 $C_{p(int)}$
, referred to the free-stream velocity and static pressure. Values of
 $C_{p(int)}$
are plotted in figure 8(b) versus
 $Re_{D}$
for cylinders with
 $z_{J}=0.1D$
and
 $z_{J}=0.2D$
. Up to a Reynolds number approximately
 $1\times 10^{5}$
, the pressure coefficient remains approximately constant at 0.71 and 0.67 for
 $z_{J}=0.2D$
and
 $z_{J}=0.1D$
, respectively, before gradually dropping to remain constant once more from
 $Re_{D}=1.5\times 10^{5}$
at a value of 0.63 for the wider spacing and 0.57 for the narrower spacing. The initiation of this drop in pressure coefficient coincides with the development of a lift force and the range of Reynolds number over which the drop in
 $C_{p(int)}$
occurs largely coincides with a steep drop in drag coefficient.
3.2.3 Measurements of vortex shedding frequency
Surveys, using a hot-wire probe, were carried out in the wake of the cylinder with passive jets to measure the von Kármán vortex shedding frequency. The probe was positioned at
 $x/D=1.5$
and
 $y/D=-0.5$
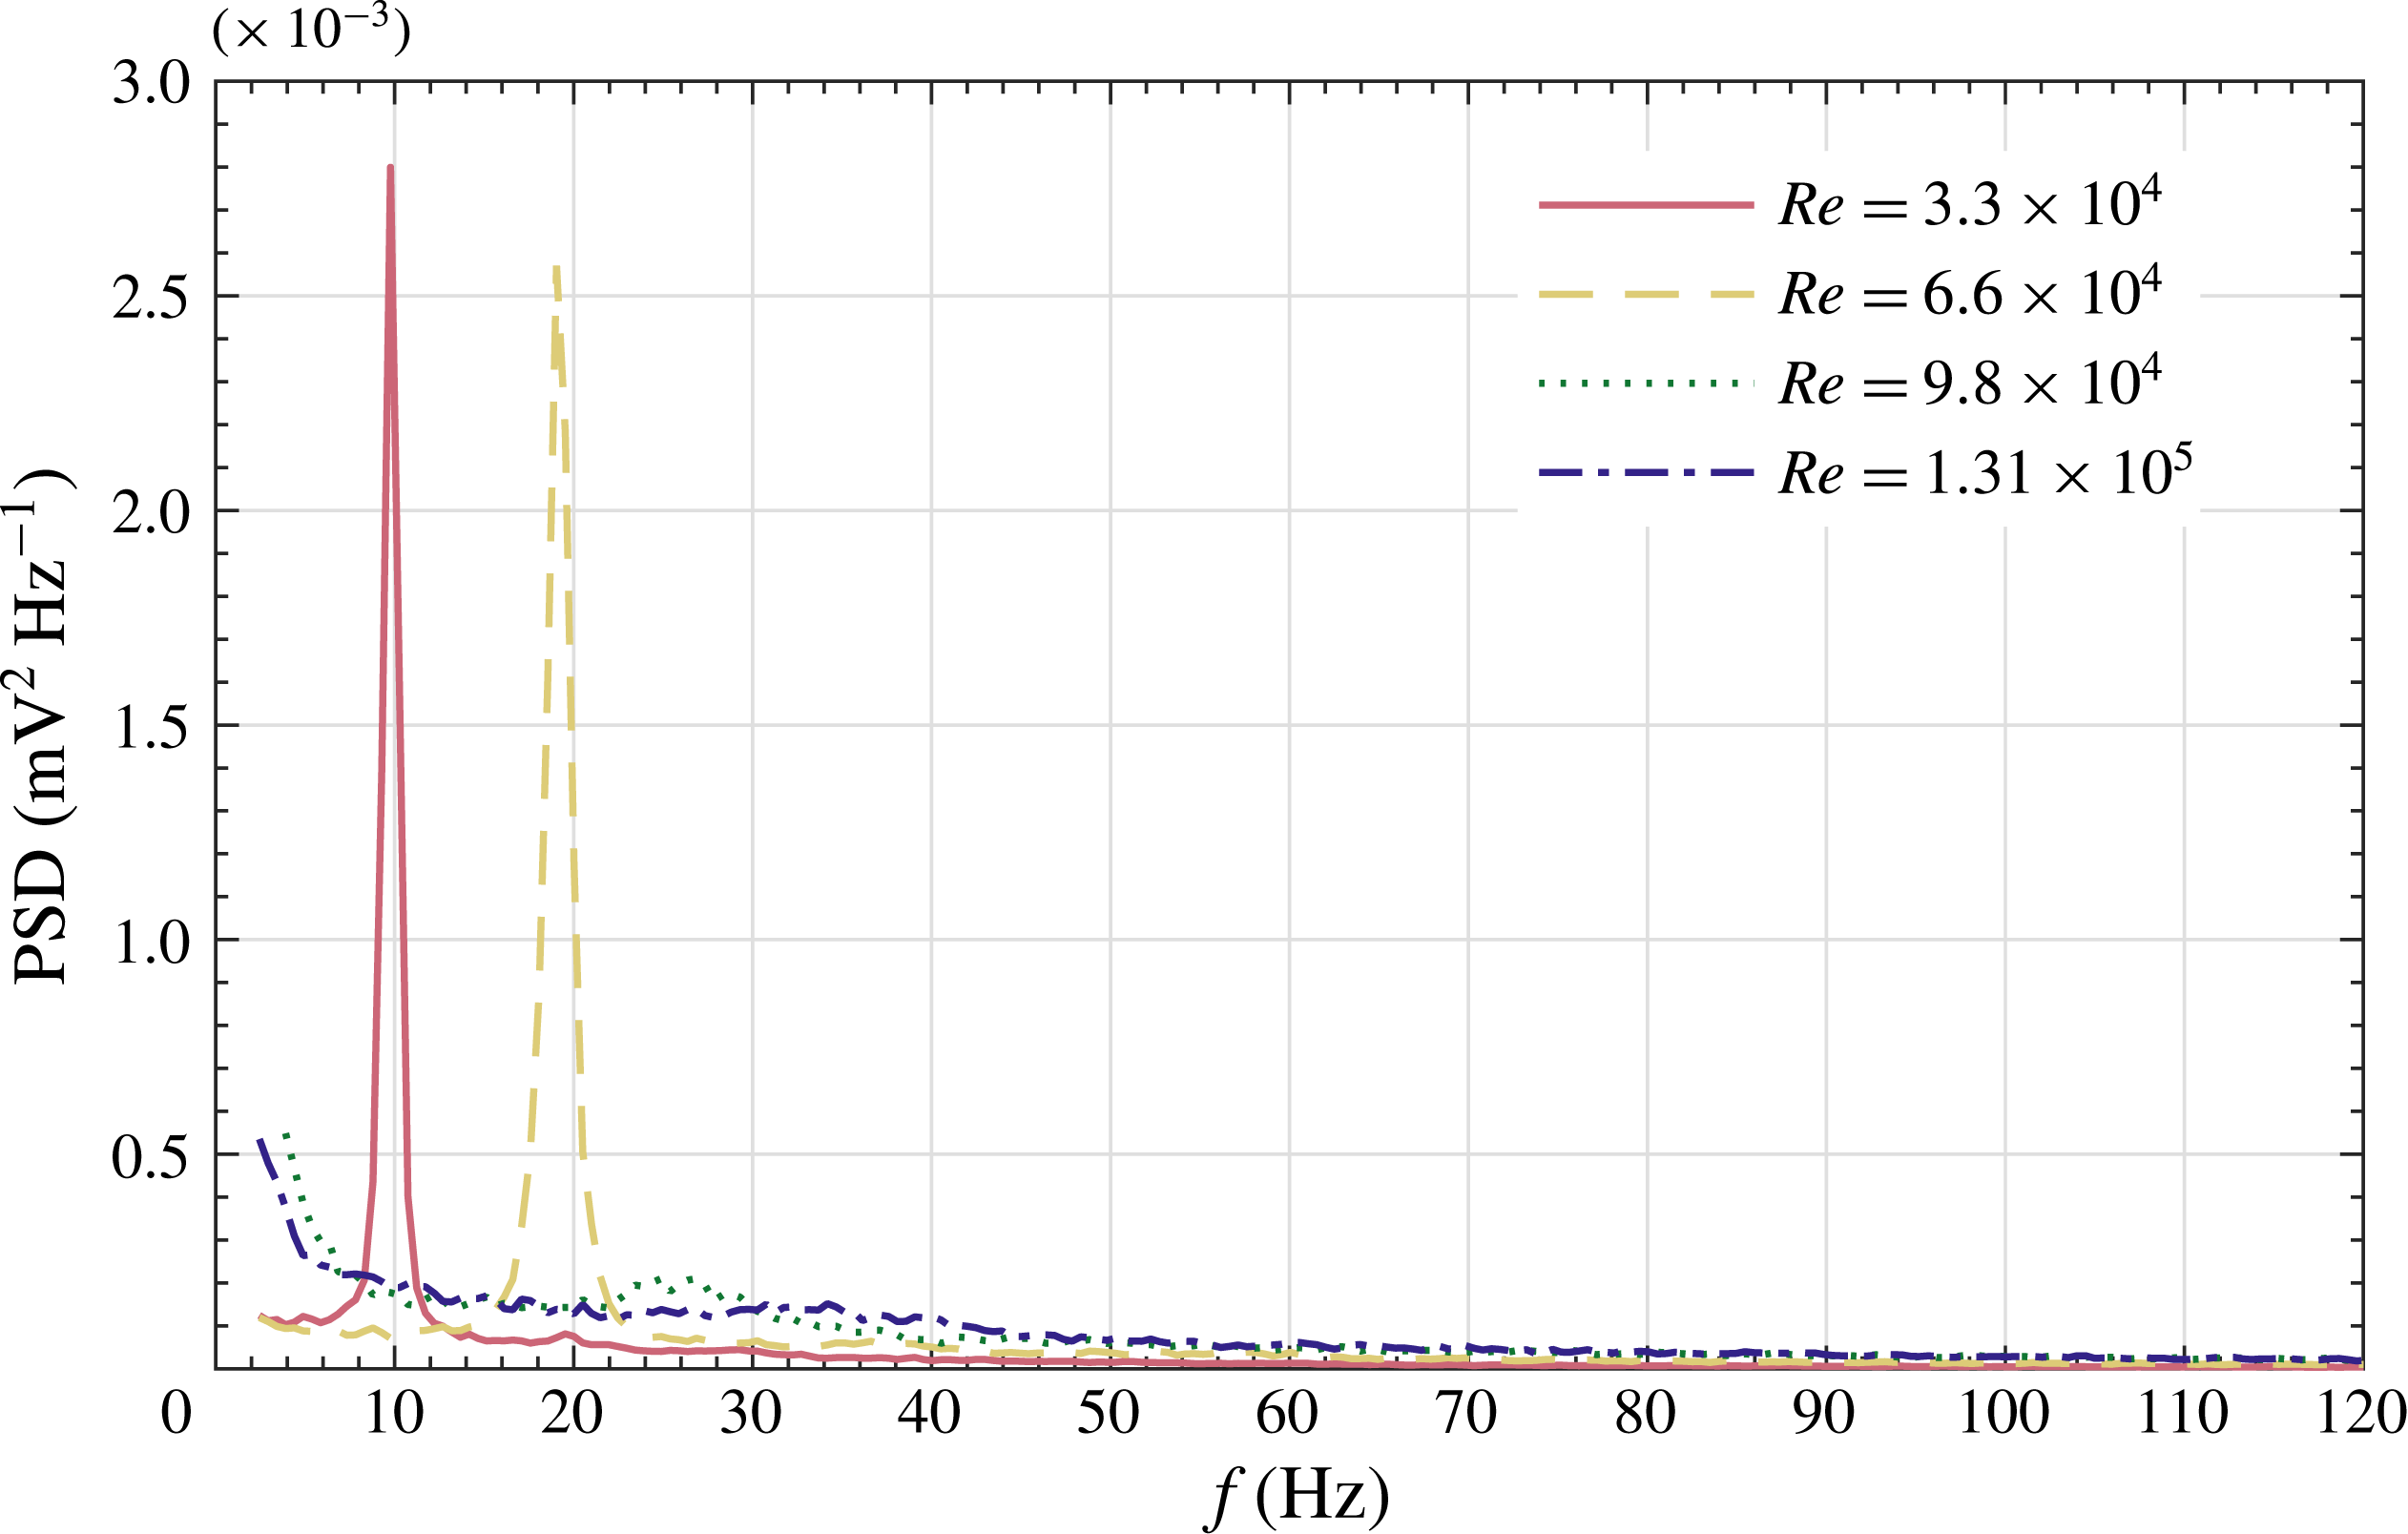
and traversed along a section of the cylinder near wake both sides of mid-span so as to capture velocity signals directly behind and between jet exit holes. Sample power spectral densities of hot-wire signals are shown in figure 9 for four values of Reynolds number. Narrow-band peaks, indicating regular vortex shedding, dominate the spectra for Reynolds numbers of
 $3.3\times 10^{4}$
and
 $6.6\times 10^{4}$
. The peaks correspond to Strouhal numbers of 0.194 and 0.190, respectively, and are similar to the values for a plain cylinder in this Reynolds-number range. Unexpectedly, for spectra above
 $Re=6.6\times 10^{4}$
, a vortex shedding peak could not be detected. It should be noted that the forms of the spectra were unaffected by changing the spanwise position, but only by a change of Reynolds number.
Plot of power spectral density (PSD) versus frequency for signals from a hot-wire probe positioned in the near wake of a cylinder with passive jets with
 $z_{J}=0.2$
. Note the absence of a prominent peak, normally associated with von Kármán vortex shedding, at
 $Re_{D}=9.8\times 10^{4}$
and above.

It can be seen by referring to the variation of
 $C_{D}$
with
 $Re_{D}$
shown in figure 7 that the suppression of regular vortex shedding begins at around the same Reynolds number as the fall in
 $C_{D}$
below values for a plain cylinder. As will be discussed later, it appears that an important effect of the presence of a spanwise array of jets is to cause the separation line to deviate from being straight.
3.2.4 Average velocity across the jets as they exit the cylinder
As discussed in § 2, the average velocity of the jets as they emerge into the cylinder boundary layer was found indirectly in a separate set of experiments. This was achieved by sealing the front holes and adjusting the flow rate of an external air supply until the internal pressure at a given Reynolds number matched that obtained with passive jets. Knowing the total exit area of the jets and measuring the flow rate of the external supply, the average velocity of the jets could be estimated. With the jets being only 0.5 mm in diameter, it was not possible in these experiments to obtain information about the velocity profile across the jets. However, it could be deduced that the Reynolds number for the flow through the passages in the cylinder wall was low enough to ensure laminar flow but their length was too small to produce fully developed pipe flow.
In the literature a substantial amount of the research into the interaction between a boundary layer and a normal jet has been carried out in a nominally zero pressure gradient (see e.g. Foss Reference Foss1980; Andreopoulos & Rodi Reference Andreopoulos and Rodi1984; Fric & Roshko Reference Fric and Roshko1994; Kelso & Smits Reference Kelso and Smits1995; Bagheri et al.
Reference Bagheri, Schlatter, Schmid and Henningson2009). One of the key parameters is the ratio of the jet velocity,
 $V_{J}$
, to the cross-flow velocity at the edge of the boundary layer,
 $U_{cf}$
, which is denoted here by
 $R$
. In the present investigation, the jets emerge into a favourable pressure gradient, and finding the value of
 $U_{cf}$
is less straightforward. To avoid introducing additional disturbances, the cylinder surface was not pressure-tapped but the internal pressure was known and at the flow entry points the pressure coefficient is assumed to be unity.
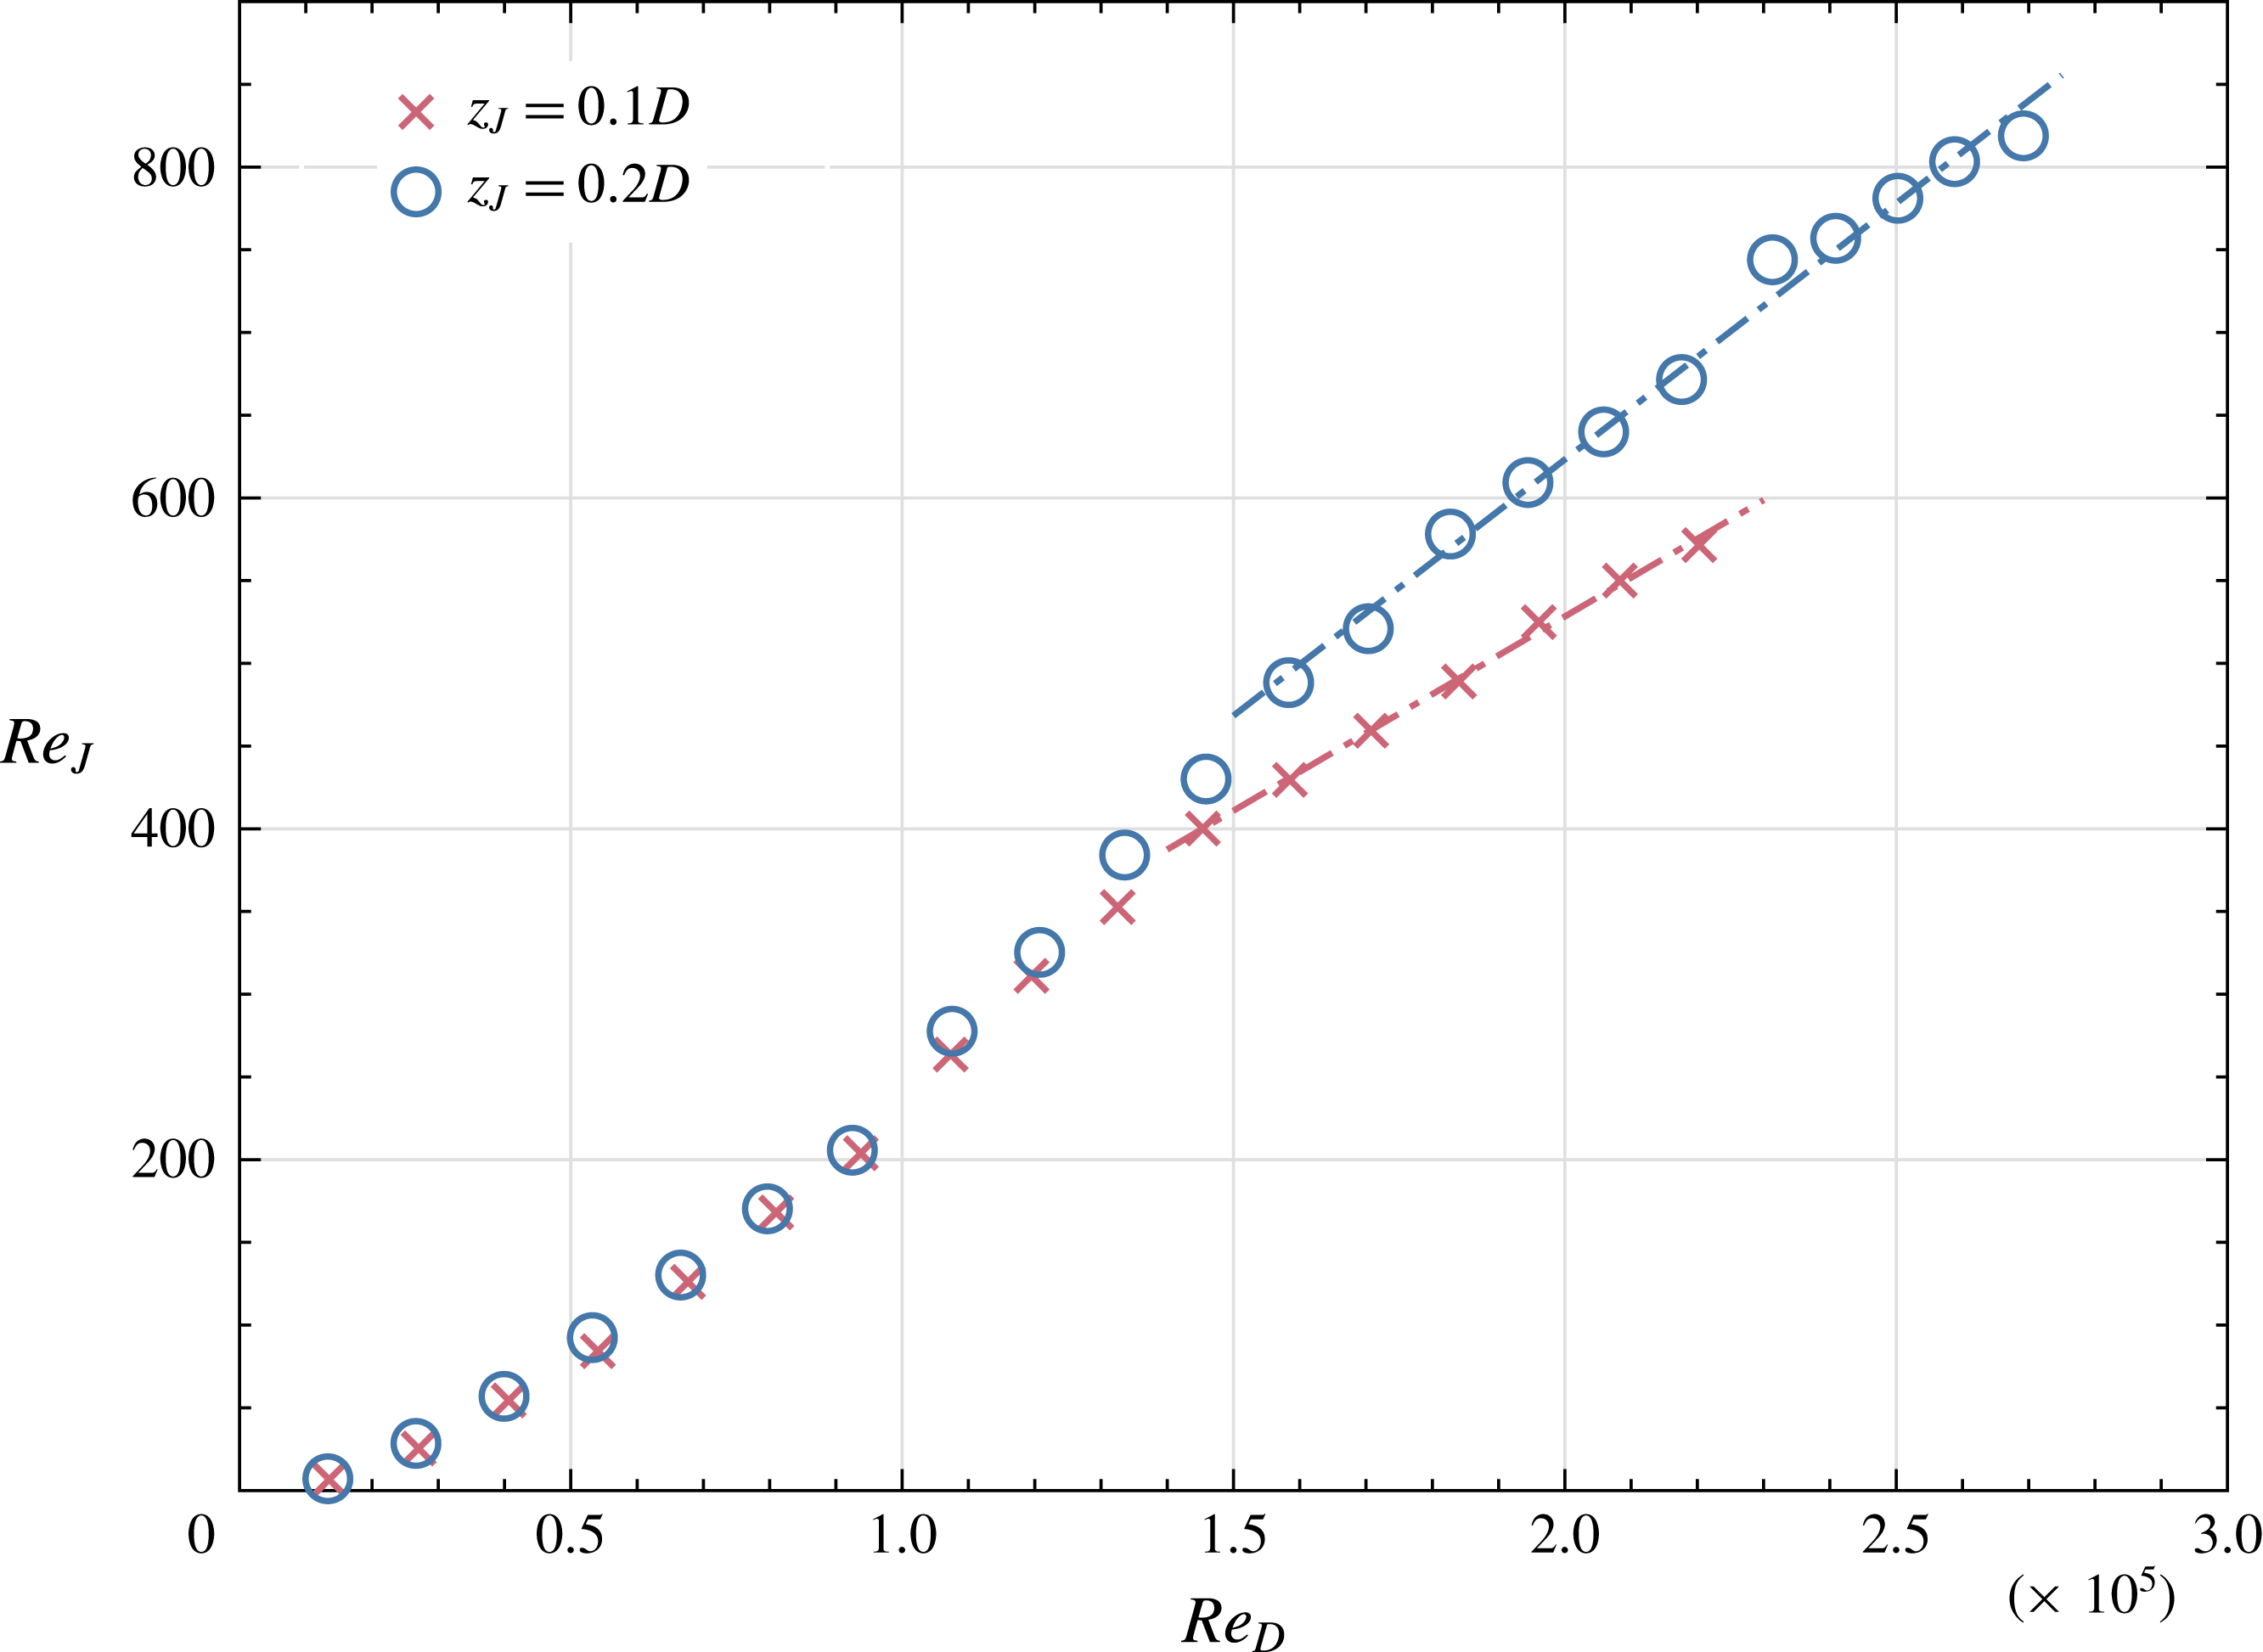
Variation of jet Reynolds number,
 $Re_{J}$
, with cylinder Reynolds number,
 $Re_{D}$
, for passive jets with spanwise jet spacing of
 $z_{J}=0.1D$
and
 $z_{J}=0.2$
.

At a Reynolds number of
 $1.5\times 10^{5}$
, PIV was employed to measure
 $U_{cf}$
directly in order to obtain an estimate of the value of
 $R$
. The method used to obtain the jet exit velocity has been described earlier. Figure 10 shows a plot of the jet Reynolds number, based on jet velocity and jet diameter, versus cylinder Reynolds number for jet spacings of
 $z_{J}=0.1D$
and
 $0.2D$
. It can be seen that, above a cylinder Reynolds number of
 $1\times 10^{5}$
, the jet velocity for the
 $z_{J}=0.2D$
spacing is higher. An interesting feature of figure 10 is that from approximately
 $Re_{D}=1.5\times 10^{5}$
, for both jet spacings, the jet exit velocity varies approximately linearly with the free-stream velocity. For the wider jet spacing, a linear fit to the data for
 $Re>1.5\times 10^{5}$
indicates that
 $V_{J}\approx 0.62U_{\infty }$
and this shows that
 $R$
will be less than unity, since, at the angular position of the jets, the velocity at the edge of the boundary layer is expected to be greater than the free-stream velocity. This is confirmed by the direct measurement of
 $R$
at a cylinder Reynolds number of
 $1.5\times 10^{5}$
, which gives
 $R=0.38$
. Since figure 8 shows relatively little variation of the internal pressure coefficient with
 $Re_{D}$
, it is expected that any variation in the value of
 $R$
will be small throughout the Reynolds-number range studied.
According to Mahesh (Reference Mahesh2013), a value of
 $R$
less than 1 is considered to be low in the study of jets in cross-flow. A further important parameter for jets in cross-flow is the ratio of the local boundary layer thickness,
 $\unicode[STIX]{x1D6FF}$
, to jet diameter,
 $d_{J}$
. Using values of the laminar boundary layer thickness on a plain cylinder at the angular position of the jets, reproduced in Zdravkovich (Reference Zdravkovich1997), it is estimated that the ratio
 $\unicode[STIX]{x1D6FF}/d_{J}$
varies from approximately 5 down to 3 over the cylinder Reynolds-number range from
 $4\times 10^{4}$
to
 $2.8\times 10^{5}$
. Cambonie, Gautier & Aider (Reference Cambonie, Gautier and Aider2013) plotted trajectories of jets in cross-flow with low values of
 $R$
and showed that for
 $R\leqslant 0.54$
and with
 $1.78\leqslant \unicode[STIX]{x1D6FF}/d_{J}\leqslant 1.83$
the path of the jet remained within the height of the boundary layer. While in the present study the jets emerge into a favourable pressure gradient, it is expected, due to the low values of
 $R$
and the relatively high values of
 $\unicode[STIX]{x1D6FF}/d_{J}$
, that their trajectories will remain within the cylinder boundary layer.
3.3 Surface oil flow patterns
To help to understand how distributed passive jets can have such a marked effect on circular cylinder flow, the surface oil flow technique was employed to provide insight into the way jets change the near-surface flow topology. The mixture of oils and tracer particles described in § 2 was applied to the surface of the test cylinder a small angular distance downstream of the jet exit holes. A time-averaged pattern of the near-surface flow is formed by revealing the surface skin friction lines, which are tangent to the local skin friction vector (JSME Reference Nakayama, Woods and Clark1988; Delery Reference Delery2011). From these patterns, the mean flow direction, vortex structures and lines of separation and reattachment can be revealed by applying critical-point theory, as described for example by Perry & Chong (Reference Perry and Chong1986). Critical-point theory provides a powerful means of identifying three-dimensional separation and attachment. Skin friction patterns were analysed in the present study by following the topological rules set out in the review papers by Tobak & Peake (Reference Tobak and Peake1982), Perry & Chong (Reference Perry and Chong1987) and Delery (Reference Delery2001). These papers provide a thorough treatment of both the theoretical and mathematical principles.
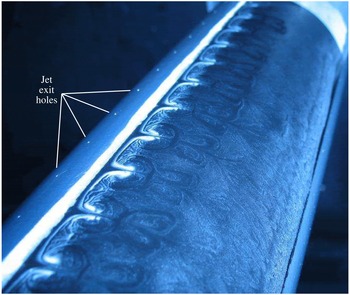
A photograph of the resulting oil flow pattern on the cylinder surface for a passive jet spacing of
 $z_{J}=0.2D$
and a Reynolds number of
 $2.7\times 10^{5}$
is shown in figure 11. The flow direction is from left to right and the jet exit holes on the upper portion of the cylinder surface are clearly visible on the upstream side. The white spanwise narrow band downstream of the jet holes does not indicate separation and should be ignored; it appears as a result of the oil mixture being applied to a small area of the cylinder surface which had not been sprayed matt black. Here the cylinder’s aluminium surface had a much higher reflectivity compared to the treated viewing area immediately downstream. The most surprising feature of the oil flow pattern is how organised the flow appears downstream of the line of jet exit holes, with the emergence of a regular array of counter-rotating vortex structures. In each cell between adjacent jets two vortex pairs can be identified. Immediately downstream of the primary, strongly defined vortex pairs are a secondary set of repeating vortex pairs which appear fainter but are an important characteristic feature of the flow.
The furthest upstream boundary layer separation occurs just downstream of the white band and is indicated by well-defined and gently sweeping white lines. Although it is not obvious from the photograph, the downstream indentations in the white lines align directly with the positions of the jet exit holes. At the midpoint between two jet exits, the separation angle is similar to that observed for laminar separation from a plain cylinder investigated at the same Reynolds number. Flow separation downstream of the jet holes is significantly delayed, and close inspection of figure 11 shows a weaker trace of reverse flow between the vortices of the secondary counter-rotating vortex pair.
Photograph of surface oil flow visualisation showing a pattern of repeating counter-rotating vortex pairs. The jet spacing is
 $z_{J}=0.2D$
, and
 $Re_{D}=2.7\times 10^{5}$
. Flow direction is approximately left to right.

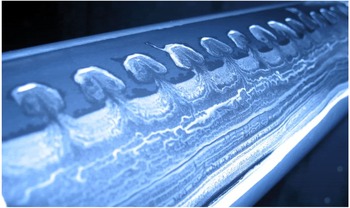
Figure 12 provides a clearer picture of the secondary vortex pair and the associated reversed flow region. This photograph shows the result of applying the oil mixture only on the downstream part of the viewing area; apart from this the conditions are identical to those present in figure 11. It can be seen how the oil mixture is drawn forward into the region occupied by the secondary vortex pair to resemble a mushroom shape. Downstream of the ‘mushroom’ heads, the spanwise lines linking the ‘mushroom’ stalks mark the boundary of the area where the oil mixture was applied prior to starting the wind tunnel. Once fluid from the base region is drawn into the secondary vortex pair, it is limited from any further movement upstream. In figure 12 one can identify an accumulation of tracer particles along the upstream edge of the ‘mushroom’ heads indicating a region of flow separation. As illustrated in figures 13 and 14 in the following section, the centres of these ‘mushroom’ head features align with the jet exit holes. Less clear from this photograph is that the semicircular patches of tracer particle accumulation linking the ends of the ‘mushroom’ stalks also signify areas of flow separation. The ways in which these topological features connect will be discussed in the next section.
Surface oil flow pattern obtained by applying oil mixture to the rear side of the cylinder. The jet spacing and Reynolds number are identical to those used for figure 11.

It should be explained that the vortex structures clearly visible from the surface oil flow patterns in figures 11 and 12 became better defined as the Reynolds number, and hence the ratio of jet flow velocity to local cross-flow velocity, increased. At the low end of the Reynolds-number range investigated, the surface flow pattern showed hardly any effect of the presence of passive jets. Another important point to note is that closely related surface oil patterns were observed for the smaller jet spacing,
 $z_{J}=0.1D$
. The main difference is that the cells, since they are directly related to the jet spacing, were compressed in the spanwise direction. Further discussion of the results for the smaller spacing can be found in Clapperton Surfleet (Reference Clapperton Surfleet2017).
4 Discussion of results
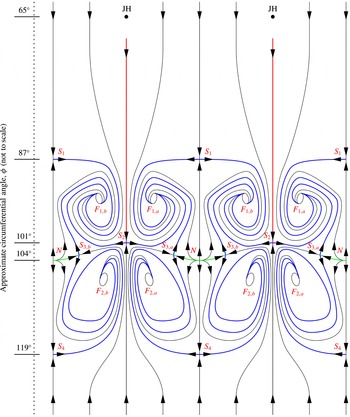
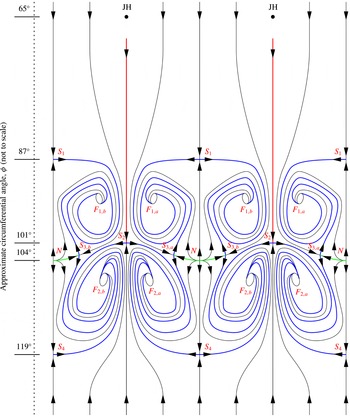
This investigation has shown that passive jets, driven by differences in surface pressure around a circular cylinder, can be employed to reduce the drag coefficient at the upper end of the subcritical range. Surface oil flow patterns have indicated that the resulting flow topology close to the surface is organised into a regular array of vortex pairs and is quite different from that found using methods that reduce drag by simply initiating boundary layer transition. Critical-point theory and the associated rules relating to flow topology have been applied to obtain a clearer understanding of the way jets interact with the flow close to the cylinder surface. In addition to studying photographs of surface oil flow patterns, use was also made of video recordings taken as the patterns developed in order to determine the sense of rotation of vortex structures. The schematics presented in figures 13 and 14 show two arrangements of time-averaged skin friction line patterns for the separated region of the cylinder surface downstream of passive jets spaced at
 $z_{J}=0.2D$
intervals.
Arrangement A: skin friction line schematic for
 $z_{J}=0.2D$
and
 $Re_{D}=2.7\times 10^{5}$
, where JH denotes a jet exit;
 $S$
, a saddle point;
 $N$
, a node;
 $F$
, a focus.

The diagrams are drawn as spanwise repeatable patterns on a two-dimensional plane which represents the unwrapped cylinder surface. The free-stream direction is from the top to the bottom of the page. The skin friction lines which enter from the top of the schematic originate from the attachment line on the front of the cylinder. Similarly the reverse flow skin friction lines which appear from the bottom of the schematics emanate from the attachment of fluid drawn from the recirculation zone at the rear of the cylinder. On these figures, red lines represent skin friction lines behind the jets that are assumed to be below a turbulent boundary layer flow triggered by disturbances introduced by the jets.
Arrangement B: skin friction line schematic for
 $z_{J}=0.2D$
and
 $Re_{D}=2.7\times 10^{5}$
, where JH denotes a jet exit;
 $S$
, a saddle point;
 $N$
, a node;
 $F$
, a focus.

The separatrices (separation lines) which emanate from the saddle points, labelled
 $S$
, are coloured blue to identify clearly the time-averaged lines of separation; each of these terminates at a focus, labelled
 $F$
. This connection serves to illustrate that the fluid drawn into the vortex structures flows away from the cylinder surface (i.e. in a direction out of the page) and into the wake in the form of streamwise vortices. Attachment lines (emerging from the nodes of attachment, labelled
 $N$
, located directly downstream from the foremost saddle points,
 $S_{1}$
, between the jet holes) are coloured green, marking the boundary from which the flow close to the wall diverges in a direction approximately upstream or downstream after reattachment.
The difference between the two arrangements A and B, in figures 13 and 14, respectively, depends on whether the connection of the separatrix emerging from saddle point
 $S_{2}$
bounds the primary vortex pair (arrangement A) or the secondary vortex pair (arrangement B). As a consequence, the connection to the dividing line of saddle point
 $S_{3}$
also alternates between skin friction lines derived from the nodal attachment of the recirculated base flow or the oncoming free-stream flow. From observations of video recordings of the surface oil flow pattern development, it is noticeable from the behaviour of the primary vortex pair that the flow is unsteady. The centres of the primary vortex pair foci appear to wander continuously, with irregular small deviations around their immediately local vicinity, and this movement is connected with changes to other topological features. Unfortunately, the frame rate and image quality of the video recordings do not readily allow the resolution of any periodicity in the unsteadiness of these movements. Observations have led to the postulation that the skin friction line patterns alternate between these two arrangements, with arrangement A appearing for the majority of the time. Both arrangements A and B appear to be topologically consistent; however, the unsteady nature of the flow forces changes on the patterns of the skin friction lines at the surface.
A further interesting finding from the oil flow visualisation was the presence of an attachment node
 $N$
downstream of the foremost separation line emanating from saddle point
 $S_{1}$
. Points
 $S_{1}$
and
 $N$
are located on a streamwise line downstream of the mid-span point between adjacent jet exit holes. These features indicate the presence of a separation bubble followed by a region of attached flow and a secondary separation along a line containing the downstream saddle point
 $S_{4}$
. The downstream extent of the region of reattached flow suggests that transition has occurred within the separation bubble, as observed in two-dimensional laminar separation bubbles. Hence the flow topology includes a spanwise row of discrete separation bubbles, with each one centred downstream of a point mid-way between the jets. A similar array of three-dimensional separation bubbles has been found on an unswept wing with a wavy leading edge and their presence has been shown to improve aerodynamic performance.
The schematics presented in figures 13 and 14 indicate that, while directly behind the jets separation is delayed, i.e compared to the plain cylinder case, final separation is delayed even further in the spanwise regions downstream of the separation bubbles. Hence between saddle points
 $S_{2}$
and
 $S_{4}$
there is a highly contorted time-mean separation line. As shown by Bearman & Owen (Reference Bearman and Owen1998), the introduction of wavy separation lines on nominally two-dimensional bluff-body geometries weakens and even suppresses regular von Kármán vortex shedding. This is put forward as the reason why vortex shedding could not be detected in the present experiments with passive jets above a cylinder Reynolds number of approximately
 $1\times 10^{5}$
.
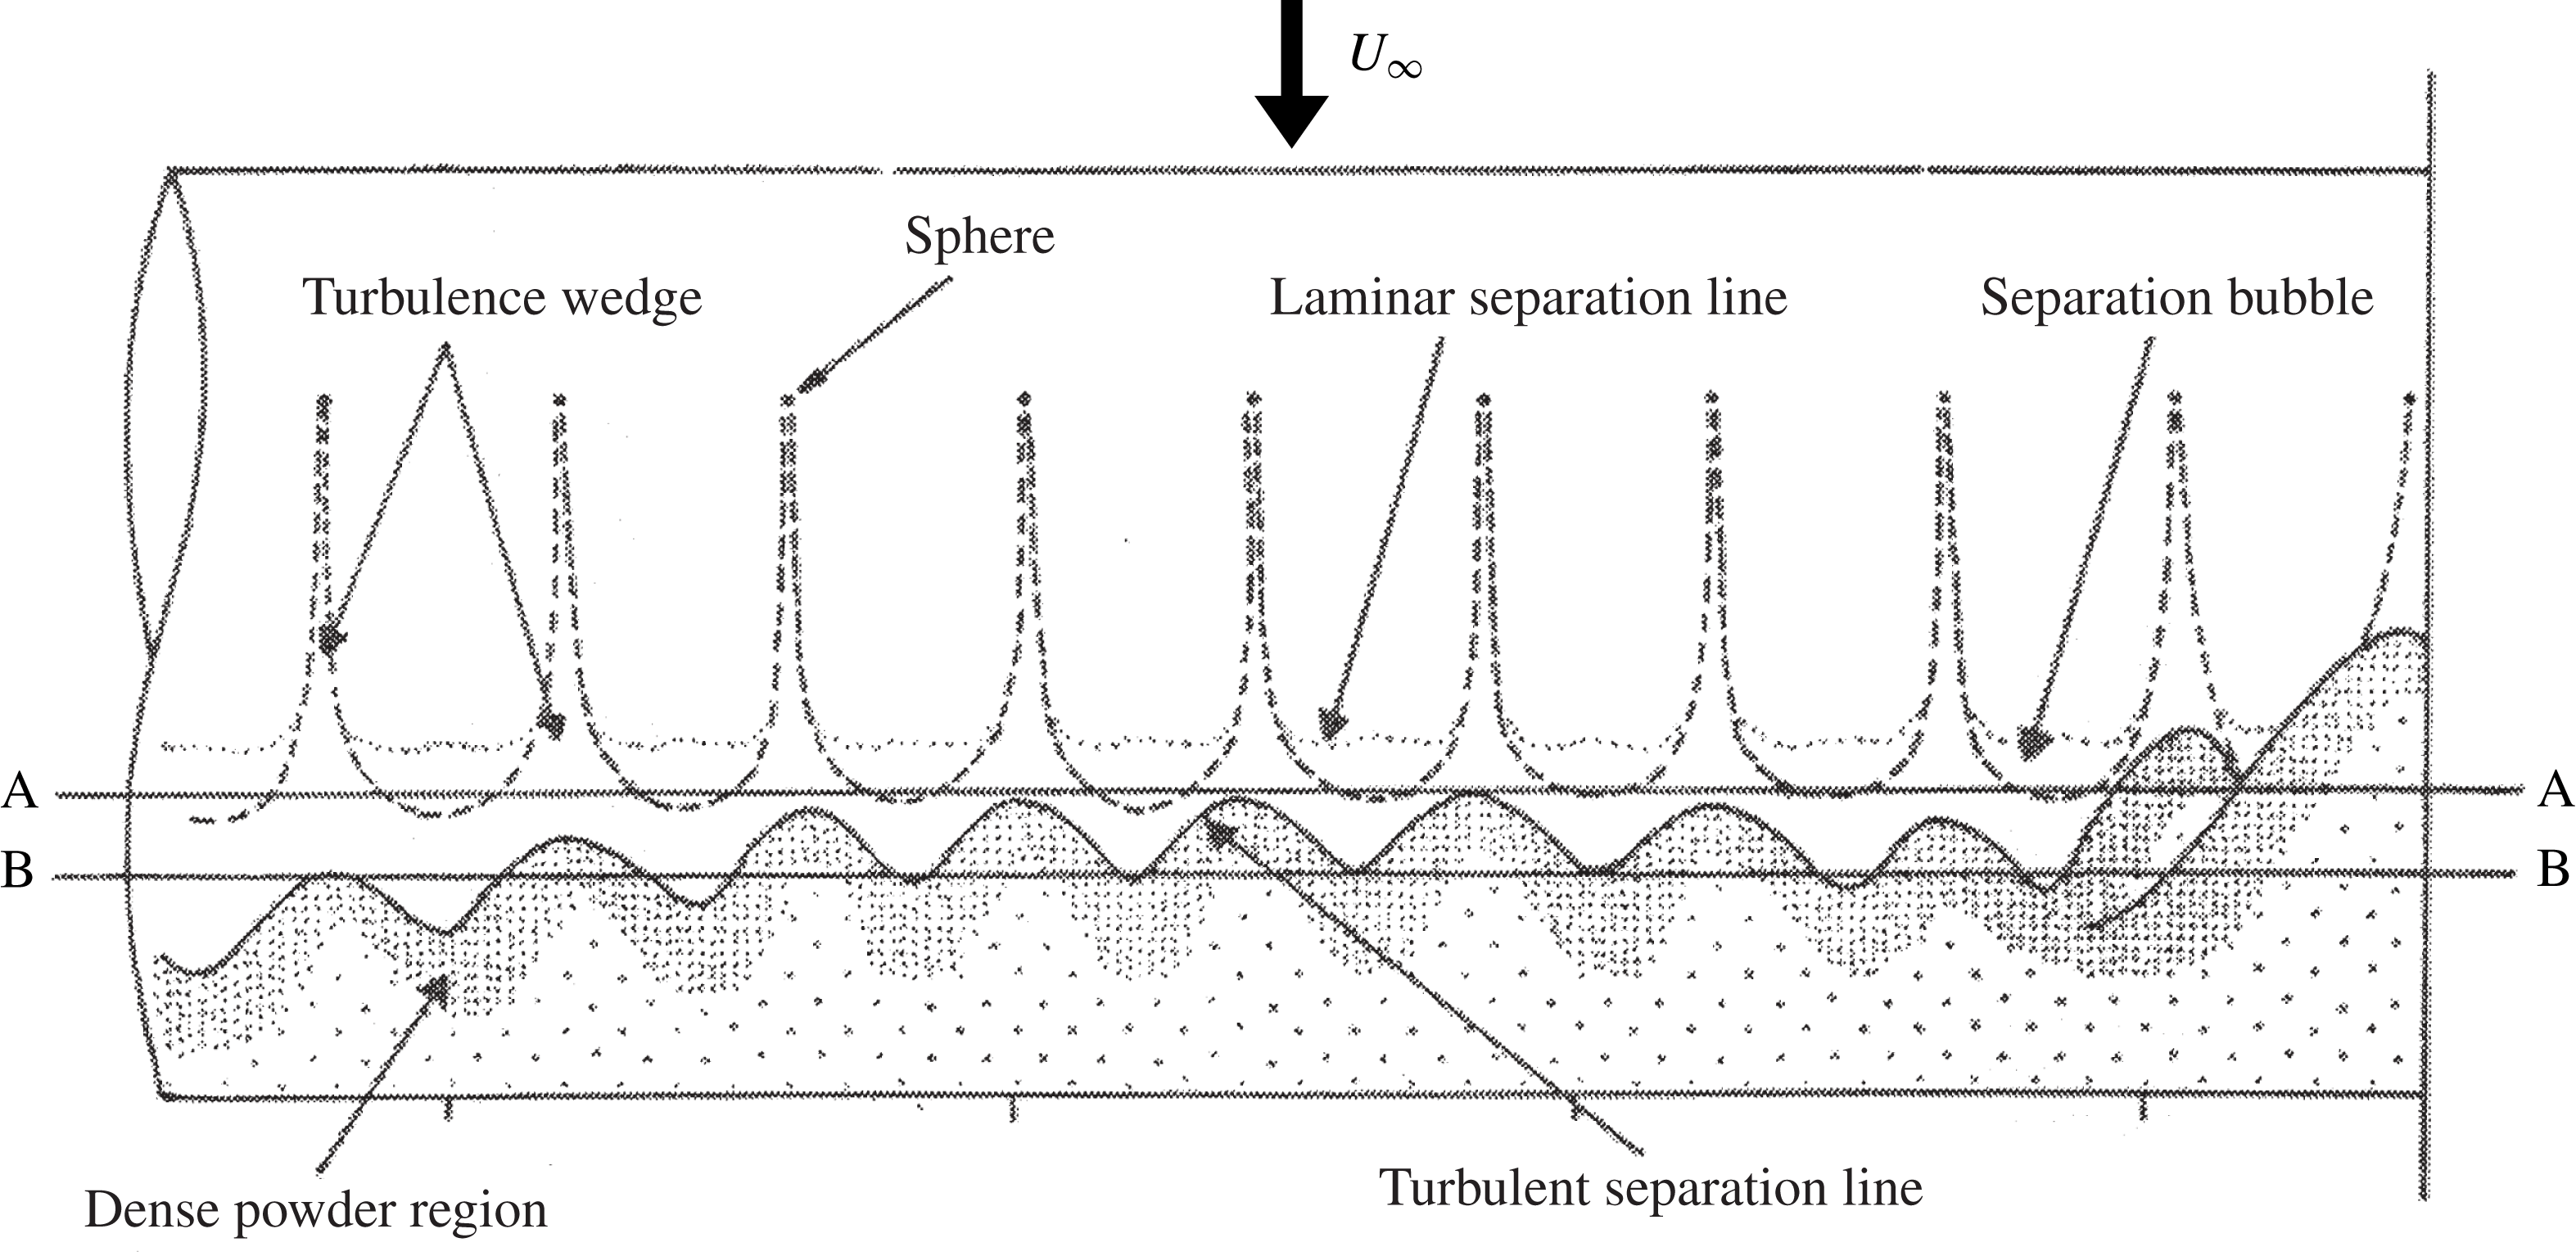
At a late stage in our study, we discovered a paper by Mizuno (Reference Mizuno1970) that describes experiments where a regular spanwise distribution of small spheres was attached to a cylinder surface at
 $\unicode[STIX]{x1D719}=\pm 60^{\circ }$
. A schematic produced by Mizuno is shown in figure 15 and illustrates the features he found using a surface flow visualisation technique. While he was not able to identify separation bubbles and the vortex pair structures, other features such a wavy separation line and the positional relationship between the wave peaks and troughs and the spheres agree closely with our surface flow observations. Further, he reports that he was unable to detect vortex shedding above a cylinder Reynolds number of
 $8\times 10^{4}$
.
Drawing of the surface flow pattern on a circular cylinder with discrete protuberances placed at
 $\unicode[STIX]{x1D719}=\pm 60^{\circ }$
, from Mizuno (Reference Mizuno1970). The descriptive labels are reproduced from the original paper.

The discussion so far has been based primarily on the results for the passive jet spacing of
 $z_{J}=0.2D$
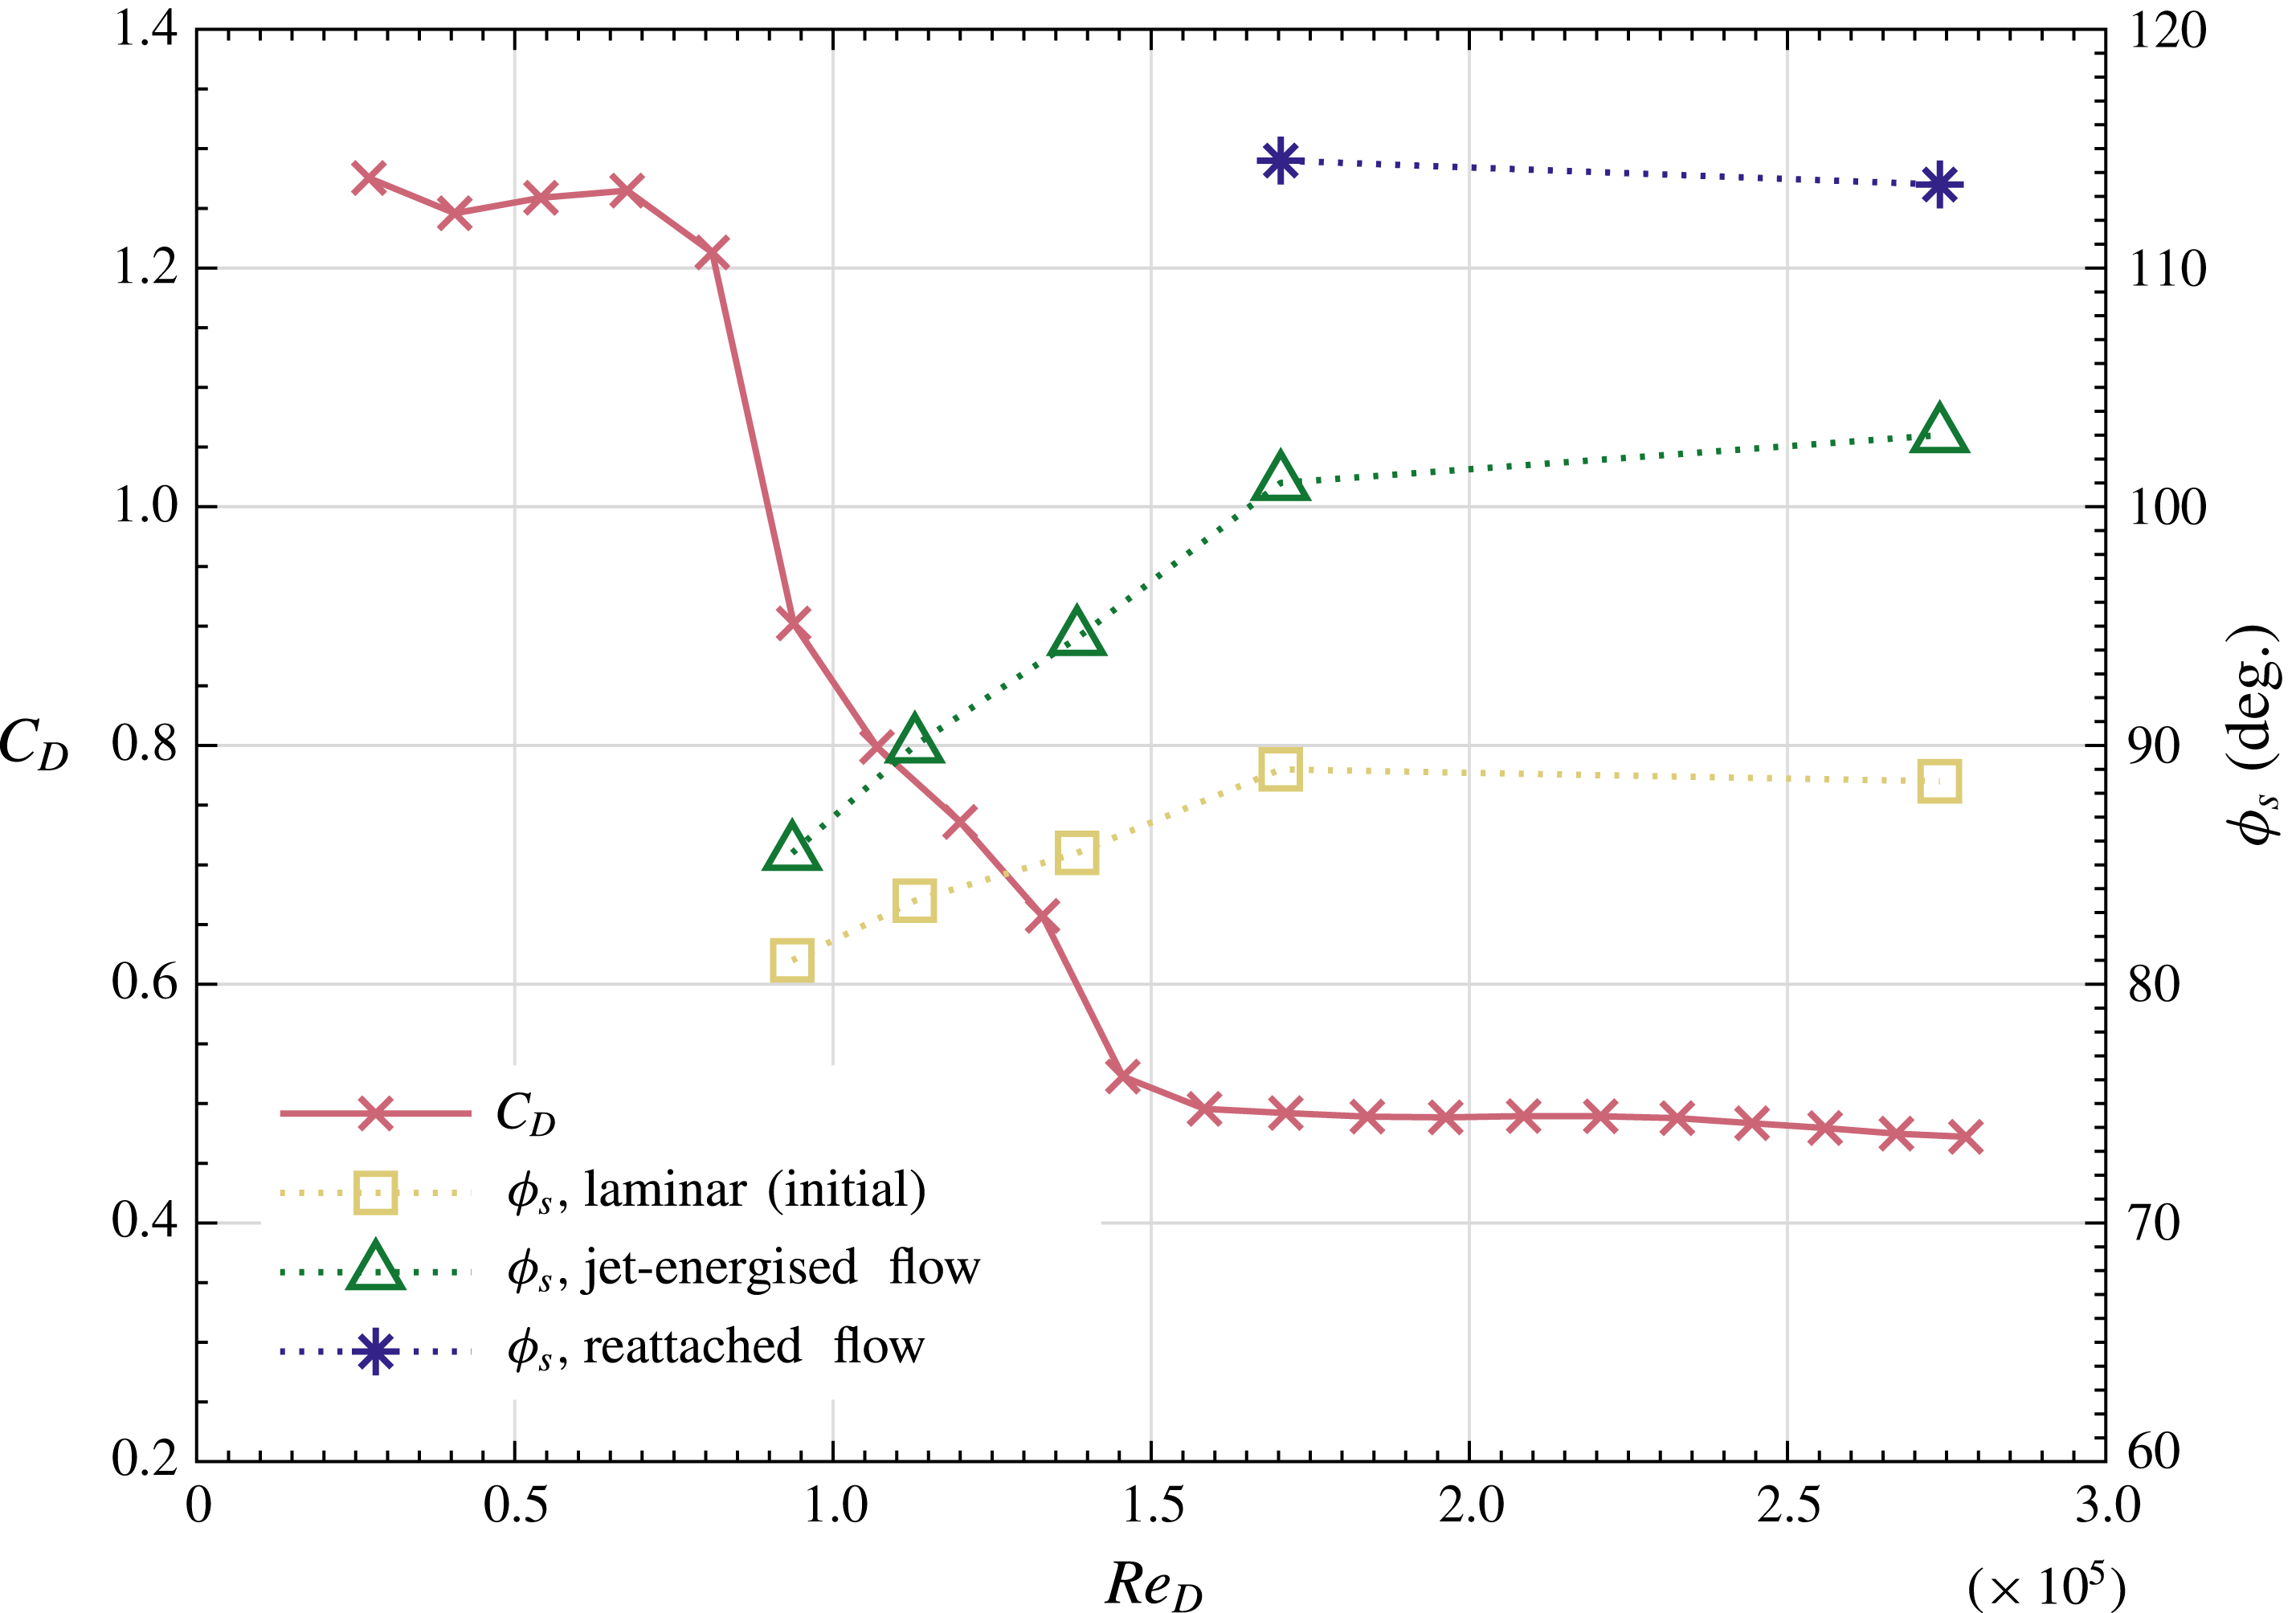
. For much of the Reynolds-number range investigated, the results for the smaller spacing showed only minor differences. The most obvious variation was found in the surface flow patterns where the flow features for the smaller spacing were compressed into half the spanwise distance without significant changes to the overall distribution of flow attachment and separation locations. In figure 16 the angular locations of three classes of flow separation, measured with a jet spacing of
 $z_{J}=0.1D$
, are plotted against Reynolds number. The results showing the lowest values of
 $\unicode[STIX]{x1D719}_{s}$
relate to the laminar separation mid-way between the jet exit holes. The middle set of angles are for separation directly behind the jets where the boundary layer flow was expected to be turbulent due to disturbances emanating from the jets. The highest values of
 $\unicode[STIX]{x1D719}_{s}$
were once again measured mid-way between the jets after the separation bubble and where the reattached flow separated.
Also shown in figure 16 is the variation of
 $C_{D}$
with Reynolds number, and it is seen that there is little change in the separation positions in the high-Reynolds-number range where
 $C_{D}$
is close to being constant. Above a Reynolds number of
 $1.5\times 10^{5}$
the value of
 $C_{D}$
for a cylinder with passive jets is 14.5 % lower than values presented in figure 4 for the plain cylinder fitted with trip wires. Both devices act to delay separation but the jets have the added advantage of suppressing vortex shedding. It should be added that suppressing vortex shedding from a fixed cylinder does not guarantee that vortex-induced vibration will not occur if the same cylinder is flexibly mounted.
Passive jets,
 $z_{J}=0.1D$
: plot of
 $C_{D}$
versus
 $Re_{D}$
overlaid with the variation in time-averaged angles of separation,
 $\unicode[STIX]{x1D719}_{s}$
, of selected flow streams identified on the cylinder surface from skin friction line patterns.

5 Conclusions
It has been shown that the drag of a circular cylinder can be reduced in the Reynolds-number range from
 $7.5\times 10^{4}$
to
 $2.8\times 10^{5}$
by the action of passive jets distributed along the cylinder span at
 $\pm 65^{\circ }$
from the front stagnation line. The jets are driven by pressure differences developed around the cylinder with inlets distributed along the front stagnation line and with the internal volume of the cylinder acting as a plenum chamber. The diameter of the jet exit holes was equal to 0.5 % of the cylinder diameter and experiments were carried out with jet spacings of 10 % and 20 % of the cylinder diameter. At a Reynolds number of
 $1.5\times 10^{5}$
, the ratio,
 $R$
, of the average velocity across the jet at exit to the local velocity at the edge of the cylinder boundary layer was found to be close to 0.4 and is not expected to show a large variation across the range of Reynolds number studied. According to work on jets in cross-flow, this suggests that the jet flow remained within the boundary layer and did not penetrate into the outer flow. At the highest Reynolds number studied, the reduction in drag coefficient was 14.5 % greater than that obtained by attaching trip wires across the span at
 $\pm 65^{\circ }$
.
Surface oil flow visualisation, coupled with critical-point theory, was used to gain insight into the resulting flow topology close to the surface of the cylinder. The effect of the jets was to generate a highly organised three-dimensional flow pattern between adjacent jets which was repeated across the span of the cylinder, the main feature being two pairs of counter-rotating vortices with one pair directly behind the other. The sense of rotation of the apparently weaker downstream pair is opposite to that of the upstream pair. Flow separation was observed to appear earliest at a downstream position midway between the jets. This was followed by reattachment, creating a separation bubble in each of the cells across the span. The result was that the reattached flow separated at a larger angular position around the cylinder than the flow directly behind a jet, hence generating a wavy separation line. This finding explained why regular vortex shedding could not be detected above a Reynolds number of approximately
 $8\times 10^{4}$
. Further, this helps to explain why the drag reduction using a spanwise array of jets is greater than that obtained using two-dimensional trip wires where vortex shedding is not suppressed.
Acknowledgements
The first author, B.L.C., wishes to thank UK Sport, and latterly the English Institute of Sport (EIS), for sponsoring this research in collaboration with the Engineering and Physical Sciences Research Council (EPSRC) through a Co-operative Award in Science and Engineering (CASE Award). He is also very grateful for the Centennial Scholarship Award from the Royal Aeronautical Society and additional financial assistance from the Department of Aeronautics at Imperial College, London.