1 Introduction
A vortex is a special form of fluid motion featured as the rotation of fluid elements and is ubiquitous in nature. A vortex can be observed in many organized flow structures ranging from hurricanes to tornadoes, from airplane trailing vortices to swirling flows in turbines and from vortex rings at the exit of a pipe to coherent structures in turbulent boundary layer flow. Although intuitively a vortex can be easily recognized, it is surprisingly difficult to find an unambiguous definition for vortex (Wu, Yan & Zhou Reference Wu, Yan and Zhou2006). As early as in 1858, Helmholtz (Reference Helmholtz1867) proposed the concepts of vortex lines and vortex filaments to investigate the simplest vortex motion. However, the mathematical definition of a vortex remains an open issue in modern fluid dynamics (Chong, Perry & Cantwell Reference Chong, Perry and Cantwell1990; Wu et al. Reference Wu, Yan and Zhou2006). This lack of a consensus on the vortex definition has caused considerable confusion in visualizing and understanding vortical structures, their evolution and interaction in complex vortical flows, especially in turbulence (Saffman Reference Saffman1992; Chashechkin Reference Chashechkin, Bonnet and Glauser1993; Wu, Xiong & Yang Reference Wu, Xiong and Yang2005; Haller et al. Reference Haller, Hadjighasem, Farazmand and Huhn2016).
As one of the most important physical quantities in fluid dynamics, vorticity is mathematically defined as the curl of the velocity vector and is always interpreted as twice the angular velocity of the instantaneous principal axes of the strain-rate tensor of a fluid element. If
 $\unicode[STIX]{x1D735}\times \boldsymbol{v}=0$
at every point in a flow, the flow is called irrotational, or otherwise called rotational, which implies that the fluid elements have a finite angular velocity. Hence, many researchers qualitatively identify a vortex as a connected fluid region with relatively high concentration of vorticity and treat a vortex as vorticity lines or vorticity tubes. This may be reasonable for large scale vortical structures, such as tornadoes, smoke rings, wing tip vortices, and in the early era, this assumed flow was thought to be inviscid, but in three-dimensional (3-D) and viscous flows, a vortex cannot generally be represented by vorticity tubes. An immediate counter-example is a 2-D Blasius laminar boundary layer, where vorticity is very large near the wall surface, but no flow rotation or vortex is found (Haller Reference Haller2005). In addition, vortices are not necessarily the concentration of vorticity in turbulent flow. Robinson, Kline & Spalart (Reference Robinson, Kline and Spalart1989) and Robinson (Reference Robinson1990) pointed out that the association between regions of strong vorticity and actual vortices can be rather weak in the turbulent boundary layer, especially in the near wall region. Based on the direct numerical simulation (DNS) results for late flow transition, Wang et al. (Reference Wang, Yang, Yang and Liu2017) obtained similar conclusions that vorticity will be reduced when the vorticity lines enter the vortex region and the vorticity magnitude inside the vortex is much smaller than the surrounding area, especially near the solid wall. In complex vortical flows, especially in turbulence, the vortical structures cannot be represented by vorticity lines or tubes and the direction of the vortex axis is almost always different from the direction of the vorticity lines or tubes. On the other hand, the existence of a vortex tube does not mean the existence of a vortex. For example, a self-closed ring-like ‘vorticity tube’ exists before the hairpin vortices, but no vortex can be identified by any vortex identification criteria (Wang et al.
Reference Wang, Yang, Yang and Liu2017). With this, we can assume vorticity does not imply the rotation of fluid elements and it is not adequate to reveal all types of vortical structures. While a vortex is a physical phenomenon in nature, vorticity is a mathematical definition of velocity curl and there is no reason to assume a vortex can be represented by or is equivalent to vorticity tubes or vorticity surfaces.
Researchers have recognized that vortical structures play an important role in turbulence, which has been found to be dominated by spatially coherent and temporally evolving vortical motions, popularly defined as coherent structures. A famous comment is given by Küchemann & Weber (Reference Küchemann and Weber1965): ‘Vortices are the sinews and muscles of turbulence’. Although in previous studies of classic vortex dynamics, many qualitative definitions for a vortex are developed, a rigorous quantitative mathematical definition is still missing. Without a rigorous mathematical definition for a vortex, many difficulties can arise in understanding vortex structures, and their evolution and interactions in turbulence. In recent decades, many vortex identification methods were proposed, such the Eulerian method and Lagrangian methods (Huang & Green Reference Huang and Green2015; Epps Reference Epps2017; Zhang et al.
Reference Zhang, Liu, Xian and Du2018). As Jeong & Hussain (Reference Jeong and Hussain1995) stressed, when defining the vortex, the quantitative criteria should satisfy Galilean invariance. The
 $\unicode[STIX]{x1D6E5}$
-criterion (Vollmers, Kreplin & Meier Reference Vollmers, Kreplin and Meier1983; Dallmann Reference Dallmann1983; Chong et al.
Reference Chong, Perry and Cantwell1990),
 $Q$
-criterion (Hunt, Wray & Moin Reference Hunt, Wray and Moin1988),
 $\unicode[STIX]{x1D706}_{ci}$
-criterion (Berdahl & Thompson Reference Berdahl and Thompson1993; Zhou et al.
Reference Zhou, Adrian, Balachandar and Kendall1999),
 $\unicode[STIX]{x1D706}_{2}$
-criterion (Jeong & Hussain Reference Jeong and Hussain1995),
 $\unicode[STIX]{x1D706}_{cr}/\unicode[STIX]{x1D706}_{ci}$
-criterion (Chakraborty, Balachandar & Adrian Reference Chakraborty, Balachandar and Adrian2005),
 $\unicode[STIX]{x1D6FA}$
-criterion (Liu et al.
Reference Liu, Wang, Yang and Duan2016) and the most recent
 $\unicode[STIX]{x1D706}_{\unicode[STIX]{x1D714}}$
-criterion (Elsas & Moriconi Reference Elsas and Moriconi2017) are representative among many of the popular Eulerian local vortex identification methods which are based on the local pointwise analysis of the velocity gradient tensor (Chakraborty et al.
Reference Chakraborty, Balachandar and Adrian2005) and they meet the requirement of Galilean invariance. To objectively study the vortex structures in the rotating reference frame, objective Eulerian criteria are also proposed (Haller Reference Haller2005; Haller & Beron-Vera Reference Haller and Beron-Vera2013; Karrasch, Huhn & Haller Reference Karrasch, Huhn and Haller2014; Haller Reference Haller2015; Haller et al.
Reference Haller, Hadjighasem, Farazmand and Huhn2016; Haller Reference Haller2016). Based on these methods, a vortex can be identified in the connected region where the criterion is met. Epps (Reference Epps2017) gave a very detailed review on the vortex identification methods and it is shown that despite the vast number of criteria that have been proposed, the field seems to lack an impartial way to determine which criterion is the best. Although it is difficult to anoint the superior method among many, it can be found that all these criteria are described by a scalar variable, but lack clarity in the direction and strength of the vortex, where both direction and strength exist. Therefore, a precise mathematical definition for a vortex is still open for research.
Since the intuitive observation of the vortex shows that it has a rotational axis, a natural idea for developing a possible vortex definition is to find a vector from the decomposition of the velocity gradient tensor. As a vector, the vorticity, which is the curl of velocity, seems to be the most promising candidate to be used for the purpose of identifying a vortex, but, as mentioned above, it cannot distinguish a vortical region from a shear layer. In order to remove shear from the velocity gradient tensor, Kolář (Reference Kolář2007) proposed a triple decomposition method from which a residual vorticity can be found to represent the pure rigid-body rotation of a fluid element. However, the triple decomposition is not unique and a so-called basic reference frame has to be used to solve this problem. Searching for the Euler angles that define the basic reference frame is an expensive optimization problem. In the following works, Kolář et al. (Reference Kolář, Šístek, Cirak and Moses2013) introduced the concept of an average co-rotation of the material line segments near a point and applied the average co-rotation as a tool for vortex identification. Numerical results (Kolář et al. Reference Kolář, Šístek, Cirak and Moses2013; Kolář & Šístek Reference Kolář, Šístek, Chowdhury and Alam2014) showed that the method can accurately identify the complex vortical structure, such as hairpin vortices in a transitional boundary layer. However, the averaged co-rotation vector is evaluated by an integral equation and thus will be difficult to use to study the transport property of a vortex in turbulent flow quantitatively.
Though vorticity does not always represent the rotation of the fluid at a point, it is related to the rotation of the fluid. Therefore, Liu et al. (Reference Liu, Wang, Yang and Duan2016) pointed out that vorticity
 $\unicode[STIX]{x1D743}=\unicode[STIX]{x1D735}\times \boldsymbol{v}$
should be further decomposed into two parts: one is the rotational part
 $\boldsymbol{R}$
contributed to rotation and the other one is non-rotational part (shear)
 $\boldsymbol{S}$
which looks like the vorticity without rotation in a laminar boundary layer. However, they did not show how to decompose the vorticity and did not give formulas of
 $\boldsymbol{R}$
and
 $\boldsymbol{S}$
. In this paper, based on the understanding of the physical meaning of vortex, several new concepts such as fluid rotation at a point, the direction of the fluid rotation axis and the strength of the fluid rotation are proposed by investigating the kinematics of fluid elements in two- and three-dimensional (3-D) flows. The mathematical definition of the rotational part of the vorticity, vortex vector
 $\boldsymbol{R}$
including the direction and magnitude, is presented to describe the fluid rotation in the current paper. The direction of a vortex vector
 $\boldsymbol{R}$
is defined as the direction of a local fluid rotation axis which is determined by the character that the velocity components in the plane orthogonal to the direction of the vortex vector do not vary along the direction of the local fluid rotation axis, or in other words, these velocity components orthogonal to the vortex vector have zero derivatives along the vortex vector direction. This leads to the definition of the vortex vector direction. The magnitude of the vortex vector
 $\boldsymbol{R}$
is measured by the rotational part of the vorticity in the direction of the vortex vector. According to the mathematical definition of the vortex vector, a vortex is defined as a connected fluid region where the magnitude of the vortex vector at each point is larger than zero.
The paper is organized as follows. The physical meaning of vortex, the method determining the direction of the local rotation axis and the strength of the fluid rotation are given by analysis of the motion of the 2-D/3-D fluid elements in § 2 and the mathematical definitions of the vortex vector
 $\boldsymbol{R}$
and vortex are given in § 3. The application of the new mathematical definitions on a number of computational results obtained from DNS and large eddy simulation (LES) are presented in § 4 and the conclusion remarks are given in the last section.
2 Rotation analysis of fluid elements
Intuitively, people recognize a vortex as a rotational region. For instance, Lugt (Reference Lugt, Roesner, Müller and Schmidt1979) stated that a vortex is a multitude of material particles rotating around a common centre and then proposed the adoption of closed or spiral streamlines to detect vortices. Although a streamline obviously fails to satisfy the requirement of Galilean invariance, it has given the idea that we can define vortex as a connected region where a pseudo-closed streamline around every point can be created by picking this point as the centre point to observe the relative motion. The relative velocity can be obtained by the local velocity with the speed of the centre point subtracted. Therefore, the concept of the single-direction rotation of fluid and the pseudo-closed streamline become key to defining a vortex. However, rotation is a motion around an axis, and, therefore, how to determine the direction of the rotation axis becomes an import factor for defining a vortex. Different from the rotation of a rigid body, in which every point has the same angular velocity, fluid at different points in the same vortex may have different rotational directions and strengths. The only possible method to describe the rotation of a vortex is by using the local variable to represent the local rotation of the fluid. In this section, we will study how to find the direction of the rotation axis of the local rotation by analysing the 3-D fluid element and we will define the strength of fluid rotation in the plane orthogonal to the rotation axis by analysing the 2-D fluid element.
2.1 Direction of the rotation axis for a 3-D fluid element
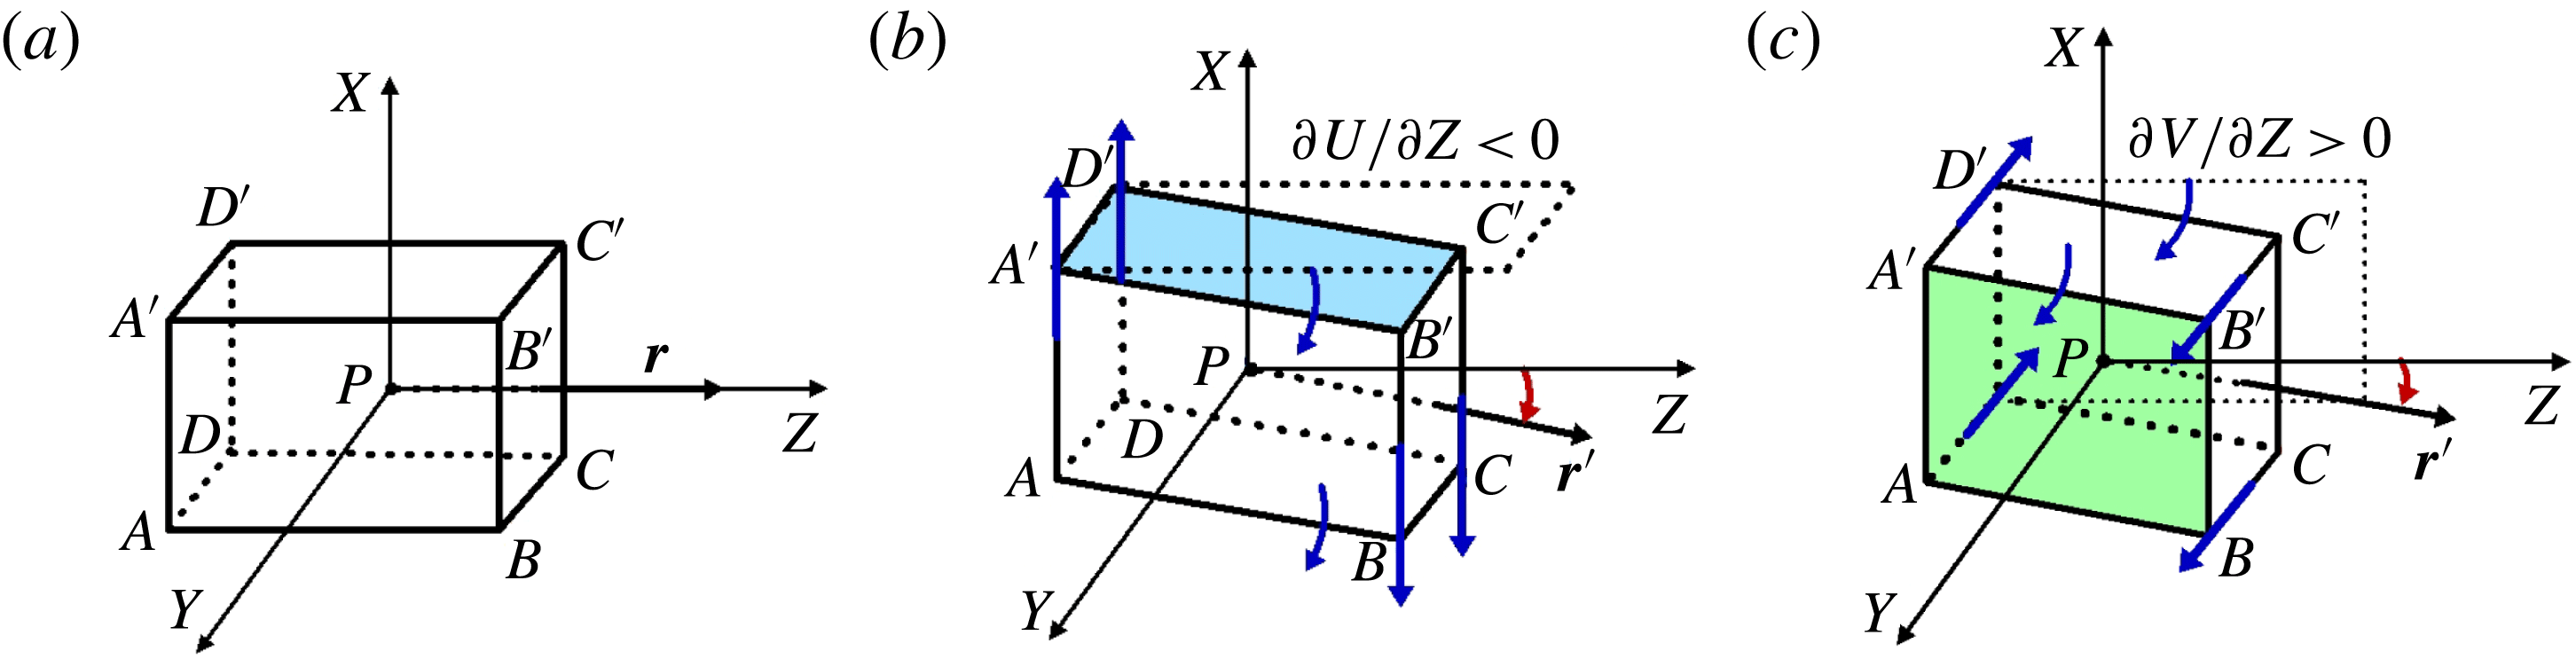
The methods to determine the local rotational axis will be studied in this section. Assume that there is an orthogonal coordinate system
 $XYZ$
with the origin at point
 $P$
(see figure 1
a), the following definitions and theorems can be given.
Definition 1. A local rotation axis
 $Z$
at point
 $P$
is defined as a local axis relative to which fluid has rotational motion only in the plane orthogonal to axis
 $Z$
and its direction does change with the motion of the fluid in the small neighbourhood of point
 $P$
.
Definition 2. A local rotational plane
 $XY$
is defined as a unique plane that is orthogonal to the local rotation axis
 $Z$
, passing through point
 $P$
. The fluid has rotational motion only in the local rotational plane
 $XY$
.
Theorem 1. There is no local rotation axis inside the local rotational plane
 $XY$
.
Proof. If there is another local rotation axis
 $T$
inside the local rotational plane
 $XY$
, there must be fluid rotation in the plane which is orthogonal to axis
 $T$
but not plane
 $XY$
. This would oppose definitions 1 and 2 that the fluid has rotational motion only in the local plane
 $XY$
.☐
Theorem 2. Assume
 $U$
,
 $V$
and
 $W$
are the velocity components in the directions of
 $X$
,
 $Y$
and
 $Z$
respectively, there must be
 $\unicode[STIX]{x2202}U/\unicode[STIX]{x2202}Z=0$
and
 $\unicode[STIX]{x2202}V/\unicode[STIX]{x2202}Z=0$
if the plane
 $XY$
is a the local rotational plane or the
 $Z$
axis is a local rotational axis.
Proof. If
 $\unicode[STIX]{x2202}U/\unicode[STIX]{x2202}Z\neq 0$
, there must be a rotation axis inside the plane
 $XY$
. For example, assume
 $\unicode[STIX]{x2202}U/\unicode[STIX]{x2202}Z<0$
without loss of generality, the surfaces
 $ABCD$
and
 $A^{\prime }B^{\prime }C^{\prime }D^{\prime }$
of the fluid element centred at
 $P$
must have a clockwise rotation around the
 $Y$
axis and the local rotation axis
 $Z$
will also rotate around the
 $Y$
axis to
 $\boldsymbol{r}^{\prime }$
, which is a contradiction to Theorem 1, as shown in figure 1(b). There must be
 $\unicode[STIX]{x2202}V/\unicode[STIX]{x2202}Z=0$
for the same reason, see figure 1(c).☐
Rotation of a 3-D fluid element centred at point
 $P$
in the reference frame
 $XYZ$
: (a) the fluid element at the initial time; (b) the surfaces
 $ABCD$
,
 $A^{\prime }B^{\prime }C^{\prime }D^{\prime }$
and the vector
 $\boldsymbol{r}$
will rotate around the
 $Y$
axis if
 $\unicode[STIX]{x2202}U/\unicode[STIX]{x2202}Z\neq 0$
; (c) the surfaces
 $ABB^{\prime }A^{\prime }$
,
 $DCC^{\prime }D^{\prime }$
and vector
 $\boldsymbol{r}$
will rotate around the
 $X$
axis if
 $\unicode[STIX]{x2202}V/\unicode[STIX]{x2202}Z\neq 0$
.

From the above definitions and theorems, it can be concluded that if
 $Z$
is a local rotation axis at point
 $P$
, there must be
 $\unicode[STIX]{x2202}U/\unicode[STIX]{x2202}Z=0$
and
 $\unicode[STIX]{x2202}V/\unicode[STIX]{x2202}Z=0$
at point
 $P$
. However, the local rotation axis of a point in a general reference frame is not always parallel to the
 $Z$
axis. It can be determined by the transformation of the reference frame. Let us consider a point
 $P$
in a reference frame
 $xyz$
and assume that the local rotation axis of the point
 $P$
is a vector of
 $\boldsymbol{r}=r_{x}\boldsymbol{i}+r_{y}\,\boldsymbol{j}+r_{z}\boldsymbol{k}$
passing through the point
 $P$
. We transform the reference frame
 $xyz$
to a new reference frame
 $XYZ$
in which the fluid-rotational axis vector
 $\boldsymbol{r}$
is parallel to the axis
 $Z$
. The velocity gradient tensor
 $\unicode[STIX]{x1D735}\boldsymbol{v}$
and
 $\unicode[STIX]{x1D735}\boldsymbol{V}$
in reference frames
 $xyz$
and
 $XYZ$
can be written respectively as follows,
 $$\begin{eqnarray}\displaystyle \unicode[STIX]{x1D735}\boldsymbol{v}=\left[\begin{array}{@{}ccc@{}}\unicode[STIX]{x2202}u/\unicode[STIX]{x2202}x & \unicode[STIX]{x2202}u/\unicode[STIX]{x2202}y & \unicode[STIX]{x2202}u/\unicode[STIX]{x2202}z\\ \unicode[STIX]{x2202}v/\unicode[STIX]{x2202}x & \unicode[STIX]{x2202}v/\unicode[STIX]{x2202}y & \unicode[STIX]{x2202}v/\unicode[STIX]{x2202}z\\ \unicode[STIX]{x2202}w/\unicode[STIX]{x2202}x & \unicode[STIX]{x2202}w/\unicode[STIX]{x2202}y & \unicode[STIX]{x2202}w/\unicode[STIX]{x2202}z\end{array}\right] & & \displaystyle\end{eqnarray}$$
 $$\begin{eqnarray}\displaystyle \unicode[STIX]{x1D735}\boldsymbol{V}=\left[\begin{array}{@{}ccc@{}}\unicode[STIX]{x2202}U/\unicode[STIX]{x2202}X & \unicode[STIX]{x2202}U/\unicode[STIX]{x2202}Y & \unicode[STIX]{x2202}U/\unicode[STIX]{x2202}Z\\ \unicode[STIX]{x2202}V/\unicode[STIX]{x2202}X & \unicode[STIX]{x2202}V/\unicode[STIX]{x2202}Y & \unicode[STIX]{x2202}V/\unicode[STIX]{x2202}Z\\ \unicode[STIX]{x2202}W/\unicode[STIX]{x2202}X & \unicode[STIX]{x2202}W/\unicode[STIX]{x2202}Y & \unicode[STIX]{x2202}W/\unicode[STIX]{x2202}Z\end{array}\right]. & & \displaystyle\end{eqnarray}$$
The relation between the velocity gradient tensor in two reference frames can be written as
 $$\begin{eqnarray}\displaystyle \unicode[STIX]{x1D735}\boldsymbol{V}=\unicode[STIX]{x1D64C}\unicode[STIX]{x1D735}\boldsymbol{v}\unicode[STIX]{x1D64C}^{-1}, & & \displaystyle\end{eqnarray}$$
where
 $\unicode[STIX]{x1D64C}$
is the transformation matrix from frame
 $xyz$
to frame
 $XYZ$
, and by using the quaternions method (Katz Reference Katz1996), we can obtain
 $$\begin{eqnarray}\displaystyle \unicode[STIX]{x1D64C}=\left[\begin{array}{@{}ccc@{}}\displaystyle {\displaystyle \frac{r_{y}^{2}+r_{z}^{2}+r_{z}}{1+r_{z}}} & \displaystyle -{\displaystyle \frac{r_{x}r_{y}}{1+r_{z}}} & -r_{x}\\ \displaystyle -{\displaystyle \frac{r_{x}r_{y}}{1+r_{z}}} & \displaystyle \frac{r_{x}^{2}+r_{z}^{2}+r_{z}}{1+r_{z}} & -r_{y}\\ r_{x} & r_{y} & r_{z}\end{array}\right] & & \displaystyle\end{eqnarray}$$
and
 $$\begin{eqnarray}\displaystyle \unicode[STIX]{x1D64C}^{-1}=\unicode[STIX]{x1D64C}^{\text{T}}=\left[\begin{array}{@{}ccc@{}}\displaystyle \frac{r_{y}^{2}+r_{z}^{2}+r_{z}}{1+r_{z}} & \displaystyle -\frac{r_{x}r_{y}}{1+r_{z}} & r_{x}\\ \displaystyle -\frac{r_{x}r_{y}}{1+r_{z}} & \displaystyle \frac{r_{x}^{2}+r_{z}^{2}+r_{z}}{1+r_{z}} & r_{y}\\ -r_{x} & -r_{y} & r_{z}\end{array}\right], & & \displaystyle\end{eqnarray}$$
where
 $\boldsymbol{r}=r_{x}\boldsymbol{i}+r_{y}\,\boldsymbol{j}+r_{z}\boldsymbol{k}$
. The detailed derivation of the transformation matrix above is given in appendix A.
Base on the above conclusion, there must be
 $\unicode[STIX]{x2202}U/\unicode[STIX]{x2202}Z=0$
and
 $\unicode[STIX]{x2202}V/\unicode[STIX]{x2202}Z=0$
in the reference frame
 $XYZ$
if
 $\boldsymbol{r}=r_{x}\boldsymbol{i}+r_{y}\,\boldsymbol{j}+r_{z}\boldsymbol{k}$
in the frame
 $xyz$
is the direction of the local rotational axis. We can find vector
 $\boldsymbol{r}$
by solving the following equations,
 $$\begin{eqnarray}\displaystyle & \displaystyle {r_{x}}^{2}+{r_{y}}^{2}+{r_{z}}^{2}=1, & \displaystyle\end{eqnarray}$$
 $$\begin{eqnarray}\displaystyle & \displaystyle {\displaystyle \frac{\unicode[STIX]{x2202}U}{\unicode[STIX]{x2202}Z}}=0, & \displaystyle\end{eqnarray}$$
 $$\begin{eqnarray}\displaystyle & \displaystyle {\displaystyle \frac{\unicode[STIX]{x2202}V}{\unicode[STIX]{x2202}Z}}=0, & \displaystyle\end{eqnarray}$$
where
 $\unicode[STIX]{x2202}U/\unicode[STIX]{x2202}Z$
and
 $\unicode[STIX]{x2202}V/\unicode[STIX]{x2202}Z$
are determined by (2.3) in which
 $\unicode[STIX]{x1D735}\boldsymbol{v}$
is a known tensor. Therefore,
 $\unicode[STIX]{x2202}U/\unicode[STIX]{x2202}Z$
and
 $\unicode[STIX]{x2202}V/\unicode[STIX]{x2202}Z$
are the functions of the unite vector
 $\boldsymbol{r}$
. Based on the Schur decomposition theory (Gentle Reference Gentle1998), there must be an orthogonal matrix
 $\unicode[STIX]{x1D64C}$
which can make
 $\unicode[STIX]{x1D735}\boldsymbol{V}$
be a blocks-triangular matrix. Therefore, the solution of the set of equations (2.6)–(2.8) must exist. The formulas of (2.7) and (2.8) in terms of vector
 $\boldsymbol{r}$
are given in appendix B. The system of (2.6)–(2.8) is a set of nonlinear algebraic equations with the unknown vector
 $\boldsymbol{r}$
and it can be solved by using the Newton iterative method. As is well known, the efficiency of the Newton iterative method is dependent on the initial guess. If the initial guess is sufficiently close to the solution, the Newton iterative method will converge rather fast. We use the vorticity direction as the initial guess. The application example in § 4.3 will show that it works efficiently.
However, the condition that
 $\unicode[STIX]{x2202}U/\unicode[STIX]{x2202}Z=0$
and
 $\unicode[STIX]{x2202}V/\unicode[STIX]{x2202}Z=0$
in a reference frame by no means implies that there is a rotation around
 $Z$
axis. It only shows that the fluid has no rotation around the
 $X$
and
 $Y$
axes, or, in other words, that the fluid only has shear or/and deformation in the
 $X$
and
 $Y$
directions. Therefore, after we find the rotation axis which is a unit vector
 $\boldsymbol{r}$
, we should further determine if there is fluid rotation around the axis aligned with
 $\boldsymbol{r}$
at point
 $P$
, which can be distinguished by analysing the distributions of velocity derivatives in the normal plane
 $XY$
of vector
 $\boldsymbol{r}$
.
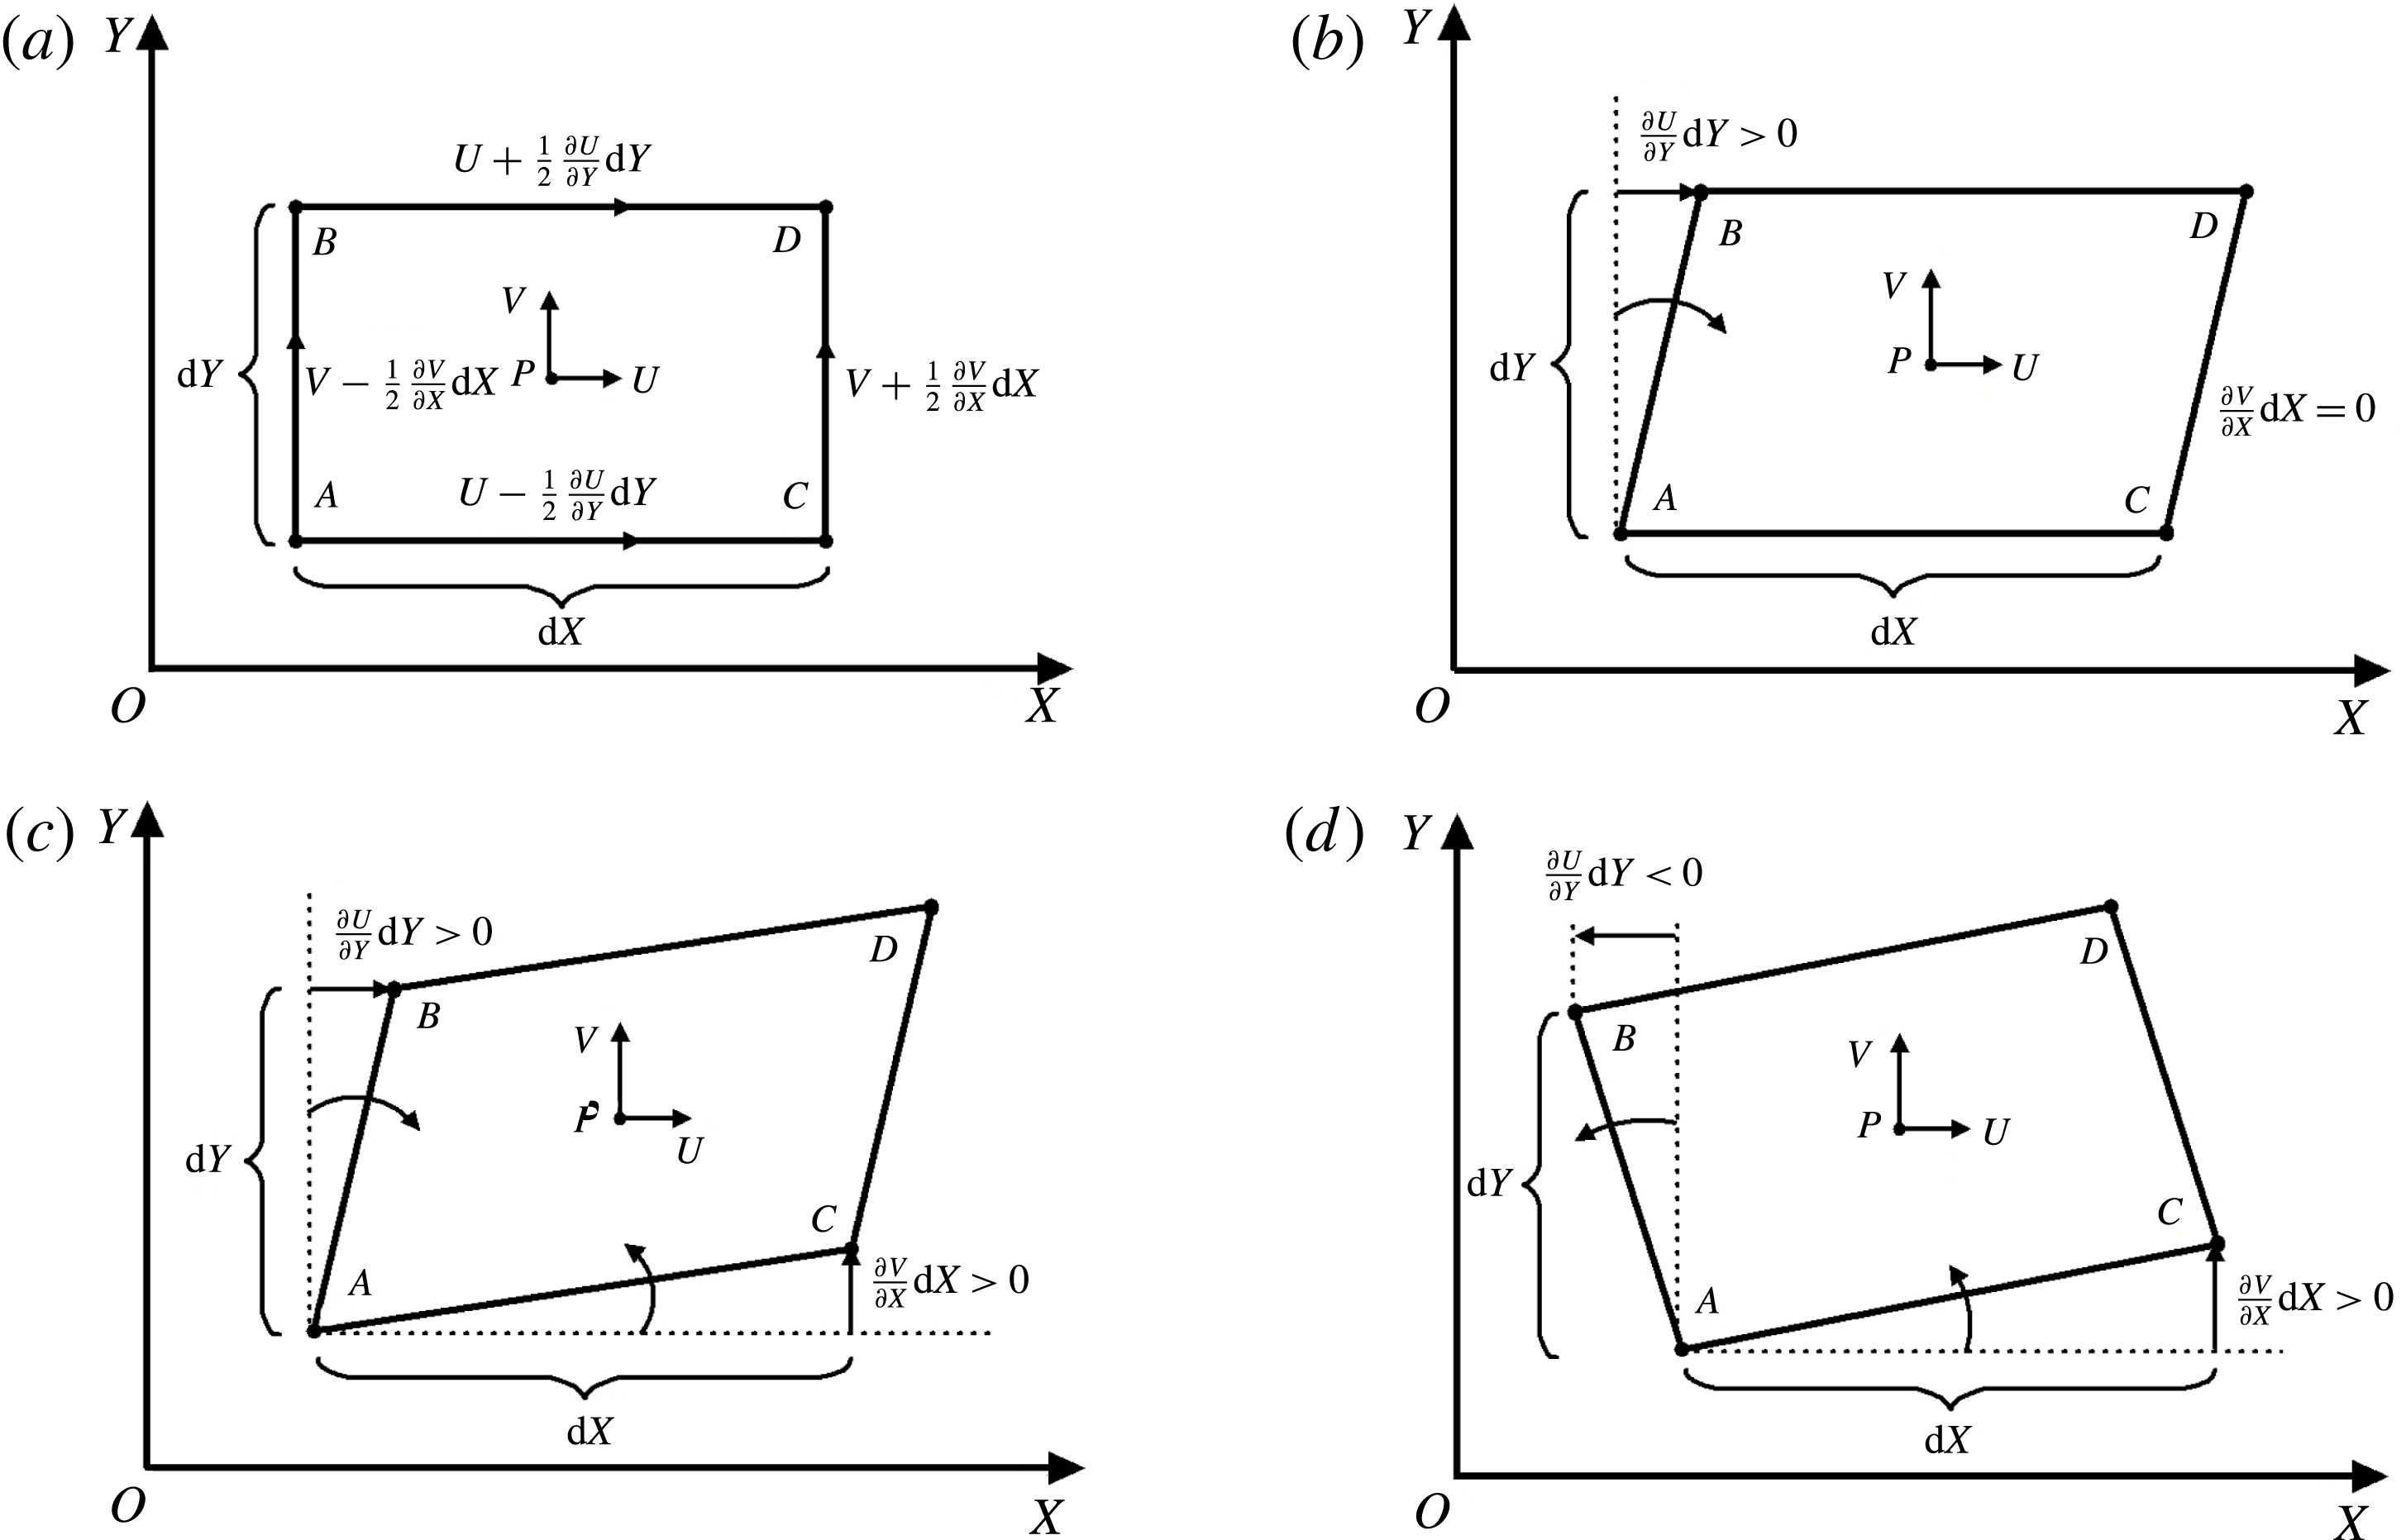
Rotation and distortion of a fluid element in 2-D plane. (a) Fluid element at time
 $t$
. (b) Pure shearing deformation. (c) Irrotational deformation. (d) Rotational deformation.

2.2 Rotation strength in the 2-D plane perpendicular to the local rotation axis
Let us first consider an infinitesimal fluid element moving in a two-dimensional flow of the
 $XY$
plane. At time
 $t$
, the shape of this fluid element centred at position
 $P$
is rectangular and we can assume, without losing generality, that the fluid element is moving upward and from the left to right, as shown in figure 2(a). After a time increment
 $\unicode[STIX]{x0394}t$
, its position and shape may change, which is determined by the distribution of velocity and its gradient tensor. In the following analysis, we will ignore the translation of the fluid element. Hence, in the
 $XY$
plane of reference frame
 $XYZ$
, side
 $AB$
of the rectangular fluid element will have a clockwise rotation if
 $\unicode[STIX]{x2202}U/\unicode[STIX]{x2202}Y>0$
, or have a counter-clockwise rotation if
 $\unicode[STIX]{x2202}U/\unicode[STIX]{x2202}Y<0$
and have no rotation if
 $\unicode[STIX]{x2202}U/\unicode[STIX]{x2202}Y=0$
. Side
 $AC$
will have a counter-clockwise rotation if
 $\unicode[STIX]{x2202}V/\unicode[STIX]{x2202}X>0$
, have a clockwise rotation if
 $\unicode[STIX]{x2202}V/\unicode[STIX]{x2202}X<0$
and have no rotation if
 $\unicode[STIX]{x2202}V/\unicode[STIX]{x2202}X=0$
. In classic fluid dynamics, the angular velocity of fluid element is defined as half of the vorticity, which is
 $\unicode[STIX]{x2202}V/\unicode[STIX]{x2202}X-\unicode[STIX]{x2202}U/\unicode[STIX]{x2202}Y$
in 2-D flow. It is easily found that there is a non-zero angular velocity or vorticity when
 $\unicode[STIX]{x2202}V/\unicode[STIX]{x2202}X\neq \unicode[STIX]{x2202}U/\unicode[STIX]{x2202}Y$
, but this does not mean that the fluid always has a rotation. For instance, it only has a pure shearing in the case of figure 2(b) with
 $\unicode[STIX]{x2202}V/\unicode[STIX]{x2202}X=0$
and irrotational deformation in the case of figure 2(c) when
 $\unicode[STIX]{x2202}V/\unicode[STIX]{x2202}X>0$
and
 $\unicode[STIX]{x2202}U/\unicode[STIX]{x2202}Y>0$
. In this paper, we think the element in the reference frame
 $XY$
has a rotational motion only when the two sides of
 $AB$
and
 $AC$
have a same rotational direction, as shown in figure 2(d) with
 $\unicode[STIX]{x2202}V/\unicode[STIX]{x2202}X>0$
and
 $\unicode[STIX]{x2202}U/\unicode[STIX]{x2202}Y<0$
. Generally, we can judge the motion of a fluid element in a reference frame by the following criterion,
 $$\begin{eqnarray}\displaystyle & \displaystyle g_{Z}=-{\displaystyle \frac{\unicode[STIX]{x2202}V}{\unicode[STIX]{x2202}X}}\frac{\unicode[STIX]{x2202}U}{\unicode[STIX]{x2202}Y} & \displaystyle\end{eqnarray}$$
(i) pure shearing or no deformation if
 $g_{Z}=0$
;
(ii) irrotational deformation if
 $g_{Z}<0$
;
(iii) rotational deformation if
 $g_{Z}>0$
.
As is known, vorticity
 $\unicode[STIX]{x1D709}_{Z}=\unicode[STIX]{x2202}V/\unicode[STIX]{x2202}X-\unicode[STIX]{x2202}U/\unicode[STIX]{x2202}Y$
in a 2-D flow is a invariant quantity, which means that
 $\unicode[STIX]{x1D709}_{Z}$
does not change with the rotation of the plane
 $XY$
around the
 $Z$
axis. However,
 $\unicode[STIX]{x2202}V/\unicode[STIX]{x2202}X$
or
 $\unicode[STIX]{x2202}U/\unicode[STIX]{x2202}Y$
is not invariant and will change with the rotation of the reference frame. When frame
 $XYZ$
is rotated around the
 $Z$
axis by an angle
 $\unicode[STIX]{x1D703}$
, the new velocity gradient tensor is
 $$\begin{eqnarray}\displaystyle \unicode[STIX]{x1D735}\boldsymbol{V}_{\unicode[STIX]{x1D703}}=\unicode[STIX]{x1D64B}\unicode[STIX]{x1D735}\boldsymbol{V}\unicode[STIX]{x1D64B}^{-1}, & & \displaystyle\end{eqnarray}$$
where
 $\unicode[STIX]{x1D64B}$
is the transformation matrix around axis
 $Z$
and there are
 $$\begin{eqnarray}\displaystyle \unicode[STIX]{x1D64B}=\left[\begin{array}{@{}ccc@{}}\cos \unicode[STIX]{x1D703} & \sin \unicode[STIX]{x1D703} & 0\\ -\text{sin}\,\unicode[STIX]{x1D703} & \cos \unicode[STIX]{x1D703} & 0\\ 0 & 0 & 1\end{array}\right] & & \displaystyle\end{eqnarray}$$
and
 $$\begin{eqnarray}\displaystyle \unicode[STIX]{x1D64B}^{-1}=\unicode[STIX]{x1D64B}^{\text{T}}=\left[\begin{array}{@{}ccc@{}}\cos \unicode[STIX]{x1D703} & -\text{sin}\,\unicode[STIX]{x1D703} & 0\\ \sin \unicode[STIX]{x1D703} & \cos \unicode[STIX]{x1D703} & 0\\ 0 & 0 & 1\end{array}\right]. & & \displaystyle\end{eqnarray}$$
So, we can obtain
 $$\begin{eqnarray}\displaystyle & \displaystyle \left.{\displaystyle \frac{\unicode[STIX]{x2202}V}{\unicode[STIX]{x2202}X}}\right|_{\unicode[STIX]{x1D703}}=\unicode[STIX]{x1D6FC}\sin (2\unicode[STIX]{x1D703}+\unicode[STIX]{x1D719})+\unicode[STIX]{x1D6FD}, & \displaystyle\end{eqnarray}$$
 $$\begin{eqnarray}\displaystyle & \displaystyle \left.{\displaystyle \frac{\unicode[STIX]{x2202}U}{\unicode[STIX]{x2202}Y}}\right|_{\unicode[STIX]{x1D703}}=\unicode[STIX]{x1D6FC}\sin (2\unicode[STIX]{x1D703}+\unicode[STIX]{x1D719})-\unicode[STIX]{x1D6FD}, & \displaystyle\end{eqnarray}$$
where
 $$\begin{eqnarray}\displaystyle & \displaystyle \unicode[STIX]{x1D6FC}={\displaystyle \frac{1}{2}}\sqrt{\left({\displaystyle \frac{\unicode[STIX]{x2202}U}{\unicode[STIX]{x2202}X}}-{\displaystyle \frac{\unicode[STIX]{x2202}V}{\unicode[STIX]{x2202}Y}}\right)^{2}+\left({\displaystyle \frac{\unicode[STIX]{x2202}V}{\unicode[STIX]{x2202}X}}+{\displaystyle \frac{\unicode[STIX]{x2202}U}{\unicode[STIX]{x2202}Y}}\right)^{2}}, & \displaystyle\end{eqnarray}$$
 $$\begin{eqnarray}\displaystyle & \displaystyle \unicode[STIX]{x1D6FD}={\displaystyle \frac{1}{2}}\left({\displaystyle \frac{\unicode[STIX]{x2202}V}{\unicode[STIX]{x2202}X}}-{\displaystyle \frac{\unicode[STIX]{x2202}U}{\unicode[STIX]{x2202}Y}}\right) & \displaystyle\end{eqnarray}$$
and
 $$\begin{eqnarray}\displaystyle & \displaystyle \unicode[STIX]{x1D719}=\displaystyle {\displaystyle \frac{\displaystyle \frac{\unicode[STIX]{x2202}V}{\unicode[STIX]{x2202}X}+\displaystyle \frac{\unicode[STIX]{x2202}U}{\unicode[STIX]{x2202}Y}}{\displaystyle \frac{\unicode[STIX]{x2202}V}{\unicode[STIX]{x2202}Y}-\displaystyle \frac{\unicode[STIX]{x2202}U}{\unicode[STIX]{x2202}X}}}. & \displaystyle\end{eqnarray}$$
Based on (2.13) and (2.14), the criterion of rotation of a fluid element in (2.9) becomes
 $$\begin{eqnarray}\displaystyle & \displaystyle g_{Z\unicode[STIX]{x1D703}}=\left.-{\displaystyle \frac{\unicode[STIX]{x2202}V}{\unicode[STIX]{x2202}X}}\right|_{\unicode[STIX]{x1D703}}\left.{\displaystyle \frac{\unicode[STIX]{x2202}U}{\unicode[STIX]{x2202}Y}}\right|_{\unicode[STIX]{x1D703}}=\unicode[STIX]{x1D6FD}^{2}-\unicode[STIX]{x1D6FC}^{2}\sin ^{2}(2\unicode[STIX]{x1D703}+\unicode[STIX]{x1D719}). & \displaystyle\end{eqnarray}$$
It can be seen that the sign of
 $g_{Z\unicode[STIX]{x1D703}}$
will change with the azimuthal angle
 $\unicode[STIX]{x1D703}$
if
 $\unicode[STIX]{x1D6FC}^{2}>\unicode[STIX]{x1D6FD}^{2}$
. This implies that at the same point
 $P$
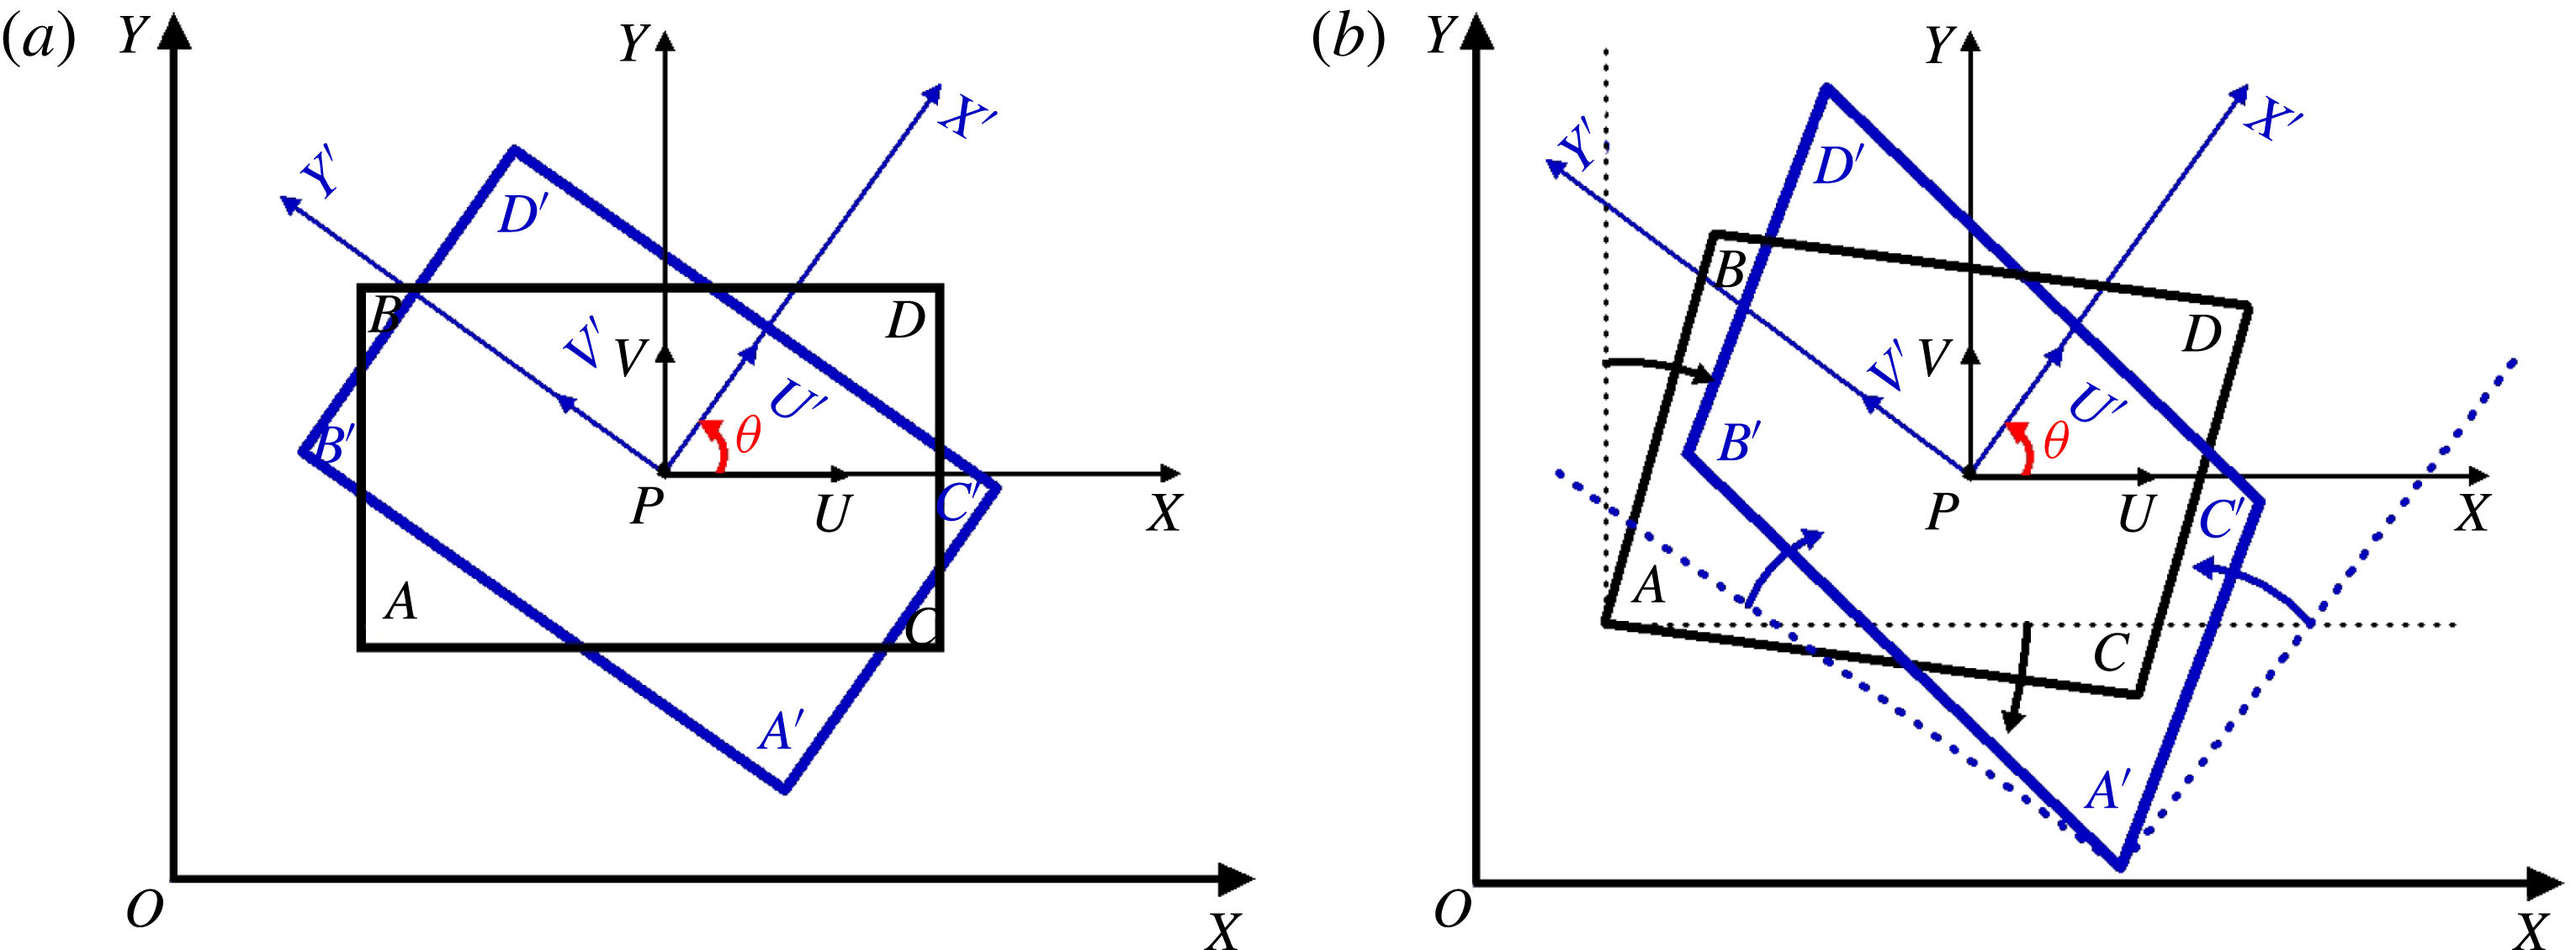
, the fluid elements at different azimuthal angles may have different types of motion as we look at the fluid motion in different reference frames, which means that the rotation type (clockwise or counter-clockwise) is not invariant. For example, as shown in figure 3(a), for the same point
 $P$
, we can consider two different fluid elements in two different frames. After a time increment
 $\unicode[STIX]{x0394}t$
, the fluid element in
 $XY$
has a rotational deformation
 $g_{Z}>0$
, see black element in figure 3(b). However, the fluid element, centred at the same point
 $P$
but in a frame rotated by an angle
 $\unicode[STIX]{x1D703}$
, has an irrotational deformation as
 $g_{Z}<0$
, see blue element in figure 3(b). This reveals that the motion character of the fluid element centred at a point is related to the azimuthal angle
 $\unicode[STIX]{x1D703}$
, or, in other words, the motion is not invariant when looking in different reference frames when
 $\unicode[STIX]{x1D6FC}^{2}>\unicode[STIX]{x1D6FD}^{2}$
. However, if
 $\unicode[STIX]{x1D6FC}^{2}<\unicode[STIX]{x1D6FD}^{2}$
,
 $g_{Z\unicode[STIX]{x1D703}}>0$
for any
 $\unicode[STIX]{x1D703}\in [0,2\unicode[STIX]{x03C0})$
, which means that the fluid element at any reference frame has the same rotation direction. In this paper, we consider that a point is fluid rotational if the rotation direction is invariant in any reference frame. Therefore, based on the distribution of the criterion
 $g_{Z\unicode[STIX]{x1D703}}$
, we propose a definition to identify if a point is fluid rotational or non-rotational in a 2-D plane as follows,
Rotation character of a fluid element in two different reference frames. (a) Rectangular fluid element at time
 $t$
. (b) Rotation and distortion after a time increment
 $\unicode[STIX]{x0394}t$
.

Definition 3. A point is local fluid rotational if the velocity gradient tensor at the point meets
 $$\begin{eqnarray}\displaystyle & \displaystyle g_{Zmin}=g_{Z\unicode[STIX]{x1D703}min}=\unicode[STIX]{x1D6FD}^{2}-\unicode[STIX]{x1D6FC}^{2}>0, & \displaystyle\end{eqnarray}$$
where
 $\unicode[STIX]{x1D6FC}$
and
 $\unicode[STIX]{x1D6FD}$
are defined in (2.15) and (2.16).
This definition implies that if a point is fluid rotational, in any 2-D reference frames, the fluid element has a rotational motion and the rotational direction is invariant. In other words, the fluid at any azimuthal angle
 $\unicode[STIX]{x1D703}$
around the point has the same rotation direction relative to the point. From the (2.13),
 $\unicode[STIX]{x2202}V/\unicode[STIX]{x2202}X$
can be regarded as the angular velocity of the fluid at azimuthal angle
 $\unicode[STIX]{x1D703}$
relative to the point, so we have
 $$\begin{eqnarray}\displaystyle & \displaystyle \unicode[STIX]{x1D714}_{\unicode[STIX]{x1D703}}=\left.{\displaystyle \frac{\unicode[STIX]{x2202}V}{\unicode[STIX]{x2202}X}}\right|_{\unicode[STIX]{x1D703}}=\unicode[STIX]{x1D6FC}\sin (2\unicode[STIX]{x1D703}+\unicode[STIX]{x1D719})+\unicode[STIX]{x1D6FD}. & \displaystyle\end{eqnarray}$$
It can be easily obtained from (2.20) that the direction of angular velocity is invariant for the fluid-rotational point, but it is not for the non-fluid-rotational point. Different from the rotation of rigid body which has the same angular velocity for every point, the angular velocity of a fluid, even if at the same point, changes with the azimuthal angle. The fluid-rotational angular velocity for a fluid-rotational point in the 2-D plane is defined as the minimum angular velocity of (2.20). However, the fluid-rotational angular velocity of a point is 0 if it is not fluid rotational. Without loss of generality, assume
 $\unicode[STIX]{x1D6FD}>0$
(if
 $\unicode[STIX]{x1D6FD}<0$
, we can change the direction of the local rotation axis to make sure
 $\unicode[STIX]{x1D6FD}>0$
) and the fluid-rotational angular velocity at a point can be determined as
 $$\begin{eqnarray}\displaystyle \unicode[STIX]{x1D714}_{rot}=\unicode[STIX]{x1D714}_{\unicode[STIX]{x1D703}min}\left\{\begin{array}{@{}ll@{}}\unicode[STIX]{x1D6FD}-\unicode[STIX]{x1D6FC}, & g_{Zmin}>0,\\[12.0pt] 0, & g_{Zmin}\leqslant 0.\end{array}\right. & & \displaystyle\end{eqnarray}$$
Similar to the definition of vorticity, which is twice the average angular velocity of the rectangle element, in a 2-D plane, we define the vortex vector which is the rotational part as twice the fluid-rotational angular velocity,
 $$\begin{eqnarray}\displaystyle R_{Z}=2\unicode[STIX]{x1D714}_{rot}. & & \displaystyle\end{eqnarray}$$
In fact, it can be seen from (2.16) that
 $\unicode[STIX]{x1D6FD}$
is the average angular velocity of the fluid element or half of the vorticity in the
 $Z$
direction. Therefore, based on (2.15), (2.16), (2.21) and (2.22), we can obtain
 $$\begin{eqnarray}\displaystyle \unicode[STIX]{x1D709}_{Z}=R_{Z}+S_{Z}, & & \displaystyle\end{eqnarray}$$
where
 $\unicode[STIX]{x1D709}_{Z}=2\unicode[STIX]{x1D6FD}=(\unicode[STIX]{x2202}V/\unicode[STIX]{x2202}X)-(\unicode[STIX]{x2202}U/\unicode[STIX]{x2202}Y)$
is the vorticity and
 $S_{Z}=2\unicode[STIX]{x1D6FC}=$
 $\sqrt{\left((\unicode[STIX]{x2202}U/\unicode[STIX]{x2202}X)-(\unicode[STIX]{x2202}V/\unicode[STIX]{x2202}Y)\right)^{2}+\left((\unicode[STIX]{x2202}V/\unicode[STIX]{x2202}X)+(\unicode[STIX]{x2202}U/\unicode[STIX]{x2202}Y)\right)^{2}}$
is the non-rotational part of the vorticity which is the shear or/and deformation in the
 $Z$
direction.
3 Definition of vortex vector and vortex
3.1 Definition of vortex vector
In § 2, by analysing the physical meaning of the motion of the fluid element in 3-D and 2-D flows, we present several concepts, such as the local rotation axis, the local rotation plane and the local fluid rotation. By these concepts and definitions, we will propose a definition of a new vector quantity which is called the vortex vector. In this paper, the new vector quantity will be used to definite the vortex.
Definition 4. A vortex vector
 $\boldsymbol{R}$
at a point is a vector quantity which represents the local fluid rotation and is defined as
 $$\begin{eqnarray}\displaystyle \boldsymbol{R}=R_{Z}\boldsymbol{r}. & & \displaystyle\end{eqnarray}$$
Theorem 3. The vortex vector defined by (3.1) is unique at any point in the flow field.
Proof. Assume that a point is a fluid-rotational point with a vortex vector
 $\boldsymbol{R}_{1}\neq 0$
, which is defined by (3.1). If there is another vortex vector
 $\boldsymbol{R}_{2}$
defined at a same point by (3.1) and it is not parallel to
 $\boldsymbol{R}_{1}$
, there must exist a component of the vortex vector
 $\boldsymbol{R}_{1}$
in the local rotational plane of the local rotation axis
 $\boldsymbol{R}_{2}$
, which means that there is a local rotation axis in a local rotational plane. This is a contradiction to Theorem 1. Therefore, the vortex vector at a fluid-rotational point must be unique. For the same reason, the vortex vector at the non-fluid-rotational point must be zero. So the vortex vector defined by (3.1) must be unique.
By the definition above, we can find the newly defined vortex vector at a point by the following steps:
(i) solve the system of (2.1) and (2.6)–(2.8) to determine the direction of the local fluid-rotation axis
 $\boldsymbol{r}$
;
(ii) in the 2-D plane perpendicular to the vector
 $\boldsymbol{r}$
through the point, identify the point if it is fluid rotational by (2.19) and compute the rotational part of vorticity by (2.22);
(iii) determine the vortex vector by (3.1).
After finding the vertex vector at every point in the flow field, we can obtain the field of the vortex vector.☐
3.2 Decomposition of vorticity
As Liu et al. (Reference Liu, Wang, Yang and Duan2016) addressed, the vorticity can be further decomposed into a rotational part and a non-rotational part. As shown in § 2, there is only shear and deformation in the direction perpendicular to
 $\boldsymbol{R}$
and the vortex vector is the rotational part of the vorticity in the
 $\boldsymbol{R}$
direction. So, after finding the rotational part of vorticity, we can easily obtain the non-rotational part of the vorticity
 $\boldsymbol{S}$
which is a pure shear and deformation of fluid by
 $$\begin{eqnarray}\displaystyle \boldsymbol{S}=\unicode[STIX]{x1D735}\times \boldsymbol{v}-\boldsymbol{R}. & & \displaystyle\end{eqnarray}$$
The vortex vector
 $\boldsymbol{R}$
represents the rotation of the fluid and the non-rotational part of the vorticity
 $\boldsymbol{S}$
represents the shear or/and deformation of the fluid.
3.3 Definition of a vortex
In the above subsection, we give a new vector quantity, the vortex vector, whose direction is that of the fluid-rotation axis and whose magnitude is the strength of the fluid rotation. The vortex vector can be used to define a vortex, which is the building block of the turbulence coherent structure, as follows
Definition 5. A vortex is a connected region where
 $\boldsymbol{R}\neq 0$
.
After defining a vortex, visualizing the vertical structure in the flow field is still a problem. Similar to the vorticity line and vorticity tube, the vortex line and vortex tube can be developed to display the vortical structures. A vortex line is a curve whose tangent at any point is in the direction of the vortex vector at that point. The concept of the vortex tube is related to the vortex line. Consider an arbitrary closed curve in three-dimensional space, the vortex lines which pass through all points on the curve form a tube in space and such a tube is called a vortex tube.
Since we have defined the vortex vector, we have two different ways to describe the vortex structure in a flow field: using vortex lines and tubes or using the iso-surface of the magnitude of the vortex vector which represents the strength of fluid rotation. In the next section we will demonstrate the capability of the vortex vector in describing the complex vortex structure in different flow fields. Mainly, we will use the iso-surface of the vortex strength while leaving the vortex lines and tubes for future applications. It must be pointed out that one of the main differences between the current vortex vector definition and all other vortex identification methods is that the current vortex vector definition is a vector but the others are scalars. Therefore, this definition can use both iso-surface and vortex line/tube/surface to discover the vertical structure, while others can only use a criterion or threshold to display iso-surfaces.
4 Verification and applications of the definition of the vortex vector
As a vector quantity, the vortex vector represents the local rotation of the fluid. Like most vortex identification methods, the iso-surface of the magnitude of the vortex vector can show the core of the vortex. In this section, the definition of the vortex vector presented in §§ 2 and 3 will be evaluated and compared by using simple motion examples and DNS/LES databases which have been tested in Liu’s previous works using different vortex identification methods (Liu, Yan & Lu Reference Liu, Yan and Lu2014; Liu et al. Reference Liu, Wang, Yang and Duan2016).
4.1 Verification of the simple motion models
To verify the definitions presented in §§ 2 and 3, two examples are used: (i) rigid-body rotation; (ii) Blasius solution of a laminar boundary layer.
4.1.1 Rigid-body rotation
The motion of a rigid body can be described by a translation of the centre of mass and a rotation around the centre of mass. By choosing a reference frame moving with the centre of mass, all elements of the rigid body are rotating around the centre of mass with the same angular speed. Without loss of generality, the velocity of a rigid body in the moving reference frame whose axis
 $Z$
coincides with the rotation axis can be written as
 $$\begin{eqnarray}\displaystyle u=\unicode[STIX]{x1D714}y,\quad v=-\unicode[STIX]{x1D714}x,\quad w=0. & & \displaystyle\end{eqnarray}$$
As there are
 $\unicode[STIX]{x2202}u/\unicode[STIX]{x2202}z=0$
and
 $\unicode[STIX]{x2202}v/\unicode[STIX]{x2202}z=0$
at every point in this velocity field, based on the Theorem 2, the local rotation axis is parallel to the axis
 $z$
. The vortex vector can be obtained as
 $$\begin{eqnarray}\displaystyle & \displaystyle \boldsymbol{R}=2\left(\unicode[STIX]{x1D6FD}-\unicode[STIX]{x1D6FC}\right)\boldsymbol{k}=\left[\left({\displaystyle \frac{\unicode[STIX]{x2202}v}{\unicode[STIX]{x2202}x}}-{\displaystyle \frac{\unicode[STIX]{x2202}u}{\unicode[STIX]{x2202}y}}\right)-\sqrt{\left({\displaystyle \frac{\unicode[STIX]{x2202}u}{\unicode[STIX]{x2202}x}}-\frac{\unicode[STIX]{x2202}v}{\unicode[STIX]{x2202}y}\right)^{2}+\left({\displaystyle \frac{\unicode[STIX]{x2202}v}{\unicode[STIX]{x2202}x}}+{\displaystyle \frac{\unicode[STIX]{x2202}u}{\unicode[STIX]{x2202}y}}\right)^{2}}\right]\boldsymbol{k}=2\unicode[STIX]{x1D714}\boldsymbol{k}.\qquad & \displaystyle\end{eqnarray}$$
This means that the vortex vector is twice the angular speed of rigid body rotation. The vorticity at every point can be given as
 $$\begin{eqnarray}\displaystyle \unicode[STIX]{x1D743}=\unicode[STIX]{x1D735}\times \boldsymbol{v}=2\unicode[STIX]{x1D714}\boldsymbol{k}. & & \displaystyle\end{eqnarray}$$
Therefore, for the rotation of the rigid body,
 $\boldsymbol{R}=\unicode[STIX]{x1D735}\times \boldsymbol{v}$
and
 $\boldsymbol{S}=\unicode[STIX]{x1D735}\times \boldsymbol{v}-\boldsymbol{R}=0$
. There is no shear and deformation in the rigid-body rotation and this is the physical character of the rigid-body motion.
4.1.2 Blasius solution of laminar boundary layer
The 2-D laminar boundary layer can be described as the Blasius solution and the velocity can be written as
 $$\begin{eqnarray}\displaystyle u=U(y),\quad v=0,\quad w=0. & & \displaystyle\end{eqnarray}$$
By Theorem 2 and (2.6)–(2.7), there are two possible local rotation axis, e.g. the
 $x$
axis and
 $z$
axis, as
 $\unicode[STIX]{x2202}v/\unicode[STIX]{x2202}x=0$
,
 $\unicode[STIX]{x2202}w/\unicode[STIX]{x2202}x=0$
and
 $\unicode[STIX]{x2202}u/\unicode[STIX]{x2202}z=0$
,
 $\unicode[STIX]{x2202}v/\unicode[STIX]{x2202}z=0$
. Based on the Definitions 3 and 4, the vortex vector can be valued as
 $$\begin{eqnarray}\displaystyle & \displaystyle \boldsymbol{R}=2\left(\unicode[STIX]{x1D6FD}-\unicode[STIX]{x1D6FC}\right)\boldsymbol{i}=\left[\left({\displaystyle \frac{\unicode[STIX]{x2202}w}{\unicode[STIX]{x2202}y}}-{\displaystyle \frac{\unicode[STIX]{x2202}v}{\unicode[STIX]{x2202}z}}\right)-\sqrt{\left({\displaystyle \frac{\unicode[STIX]{x2202}v}{\unicode[STIX]{x2202}y}}-{\displaystyle \frac{\unicode[STIX]{x2202}w}{\unicode[STIX]{x2202}z}}\right)^{2}+\left({\displaystyle \frac{\unicode[STIX]{x2202}w}{\unicode[STIX]{x2202}y}}+{\displaystyle \frac{\unicode[STIX]{x2202}v}{\unicode[STIX]{x2202}z}}\right)^{2}}\,\right]\boldsymbol{i}=0\qquad & \displaystyle\end{eqnarray}$$
or
 $$\begin{eqnarray}\displaystyle & \displaystyle \boldsymbol{R}=2\left(\unicode[STIX]{x1D6FD}-\unicode[STIX]{x1D6FC}\right)\boldsymbol{k}=\left[\left({\displaystyle \frac{\unicode[STIX]{x2202}v}{\unicode[STIX]{x2202}x}}-\frac{\unicode[STIX]{x2202}u}{\unicode[STIX]{x2202}y}\right)-\sqrt{\left({\displaystyle \frac{\unicode[STIX]{x2202}u}{\unicode[STIX]{x2202}x}}-{\displaystyle \frac{\unicode[STIX]{x2202}v}{\unicode[STIX]{x2202}y}}\right)^{2}+\left({\displaystyle \frac{\unicode[STIX]{x2202}v}{\unicode[STIX]{x2202}x}}+{\displaystyle \frac{\unicode[STIX]{x2202}u}{\unicode[STIX]{x2202}y}}\right)^{2}}\,\right]\boldsymbol{k}=0.\qquad & \displaystyle\end{eqnarray}$$
The vortex vector is 0 in the laminar boundary layer flow, which means that there is no rotation or vortex in the flow field. However, the distribution of vorticity in the velocity field is
 $$\begin{eqnarray}\displaystyle & \displaystyle \unicode[STIX]{x1D743}=\unicode[STIX]{x1D735}\times \boldsymbol{v}=-{\displaystyle \frac{\unicode[STIX]{x2202}U}{\unicode[STIX]{x2202}y}}\boldsymbol{k}. & \displaystyle\end{eqnarray}$$
Therefore, in the laminar boundary layer, there are
 $\boldsymbol{R}=0$
and
 $\boldsymbol{S}=\unicode[STIX]{x1D735}\times \boldsymbol{v}$
and there is only pure shear. The conclusion is the same as the current understanding of laminar flow.
From the examples above, it is clear that vorticity cannot really represent the rotation of the fluid, so it cannot fully describe the vortex. It should be further quantitatively decomposed into a rotational part (vortex vector) and non-rotational part (shear or/and deformation). Therefore, only the vortex vector can represent the rotation of the fluid. We will further investigate the vortex vector on describing the complex vortical structures of the DNS/LES databases.
4.2 Two-dimensional Blasius-profile temporal mixing layer flow
As the first DNS example, we consider a 2-D mirrored Blasius-profile shear layer excited with a perturbation to induce the rollup of the shear layer and the formation of vortices. The
 $Re$
, which is based on the displacement thickness, is 1000 and the inflow
 $Ma$
is
 $0.5$
. The unsteady 2-D flow field is numerically simulated by the code ‘DNSUTA’ in which the Navier–Stokes (NS) equations are solved using a sixth-order compact scheme in the spatial discretization and a third-order total variation diminishing (TVD) Runge–Kutta scheme in the temporal discretization. A local refined grid is generated with dimensions
 $256\times 512$
in the streamwise and normal directions respectively.
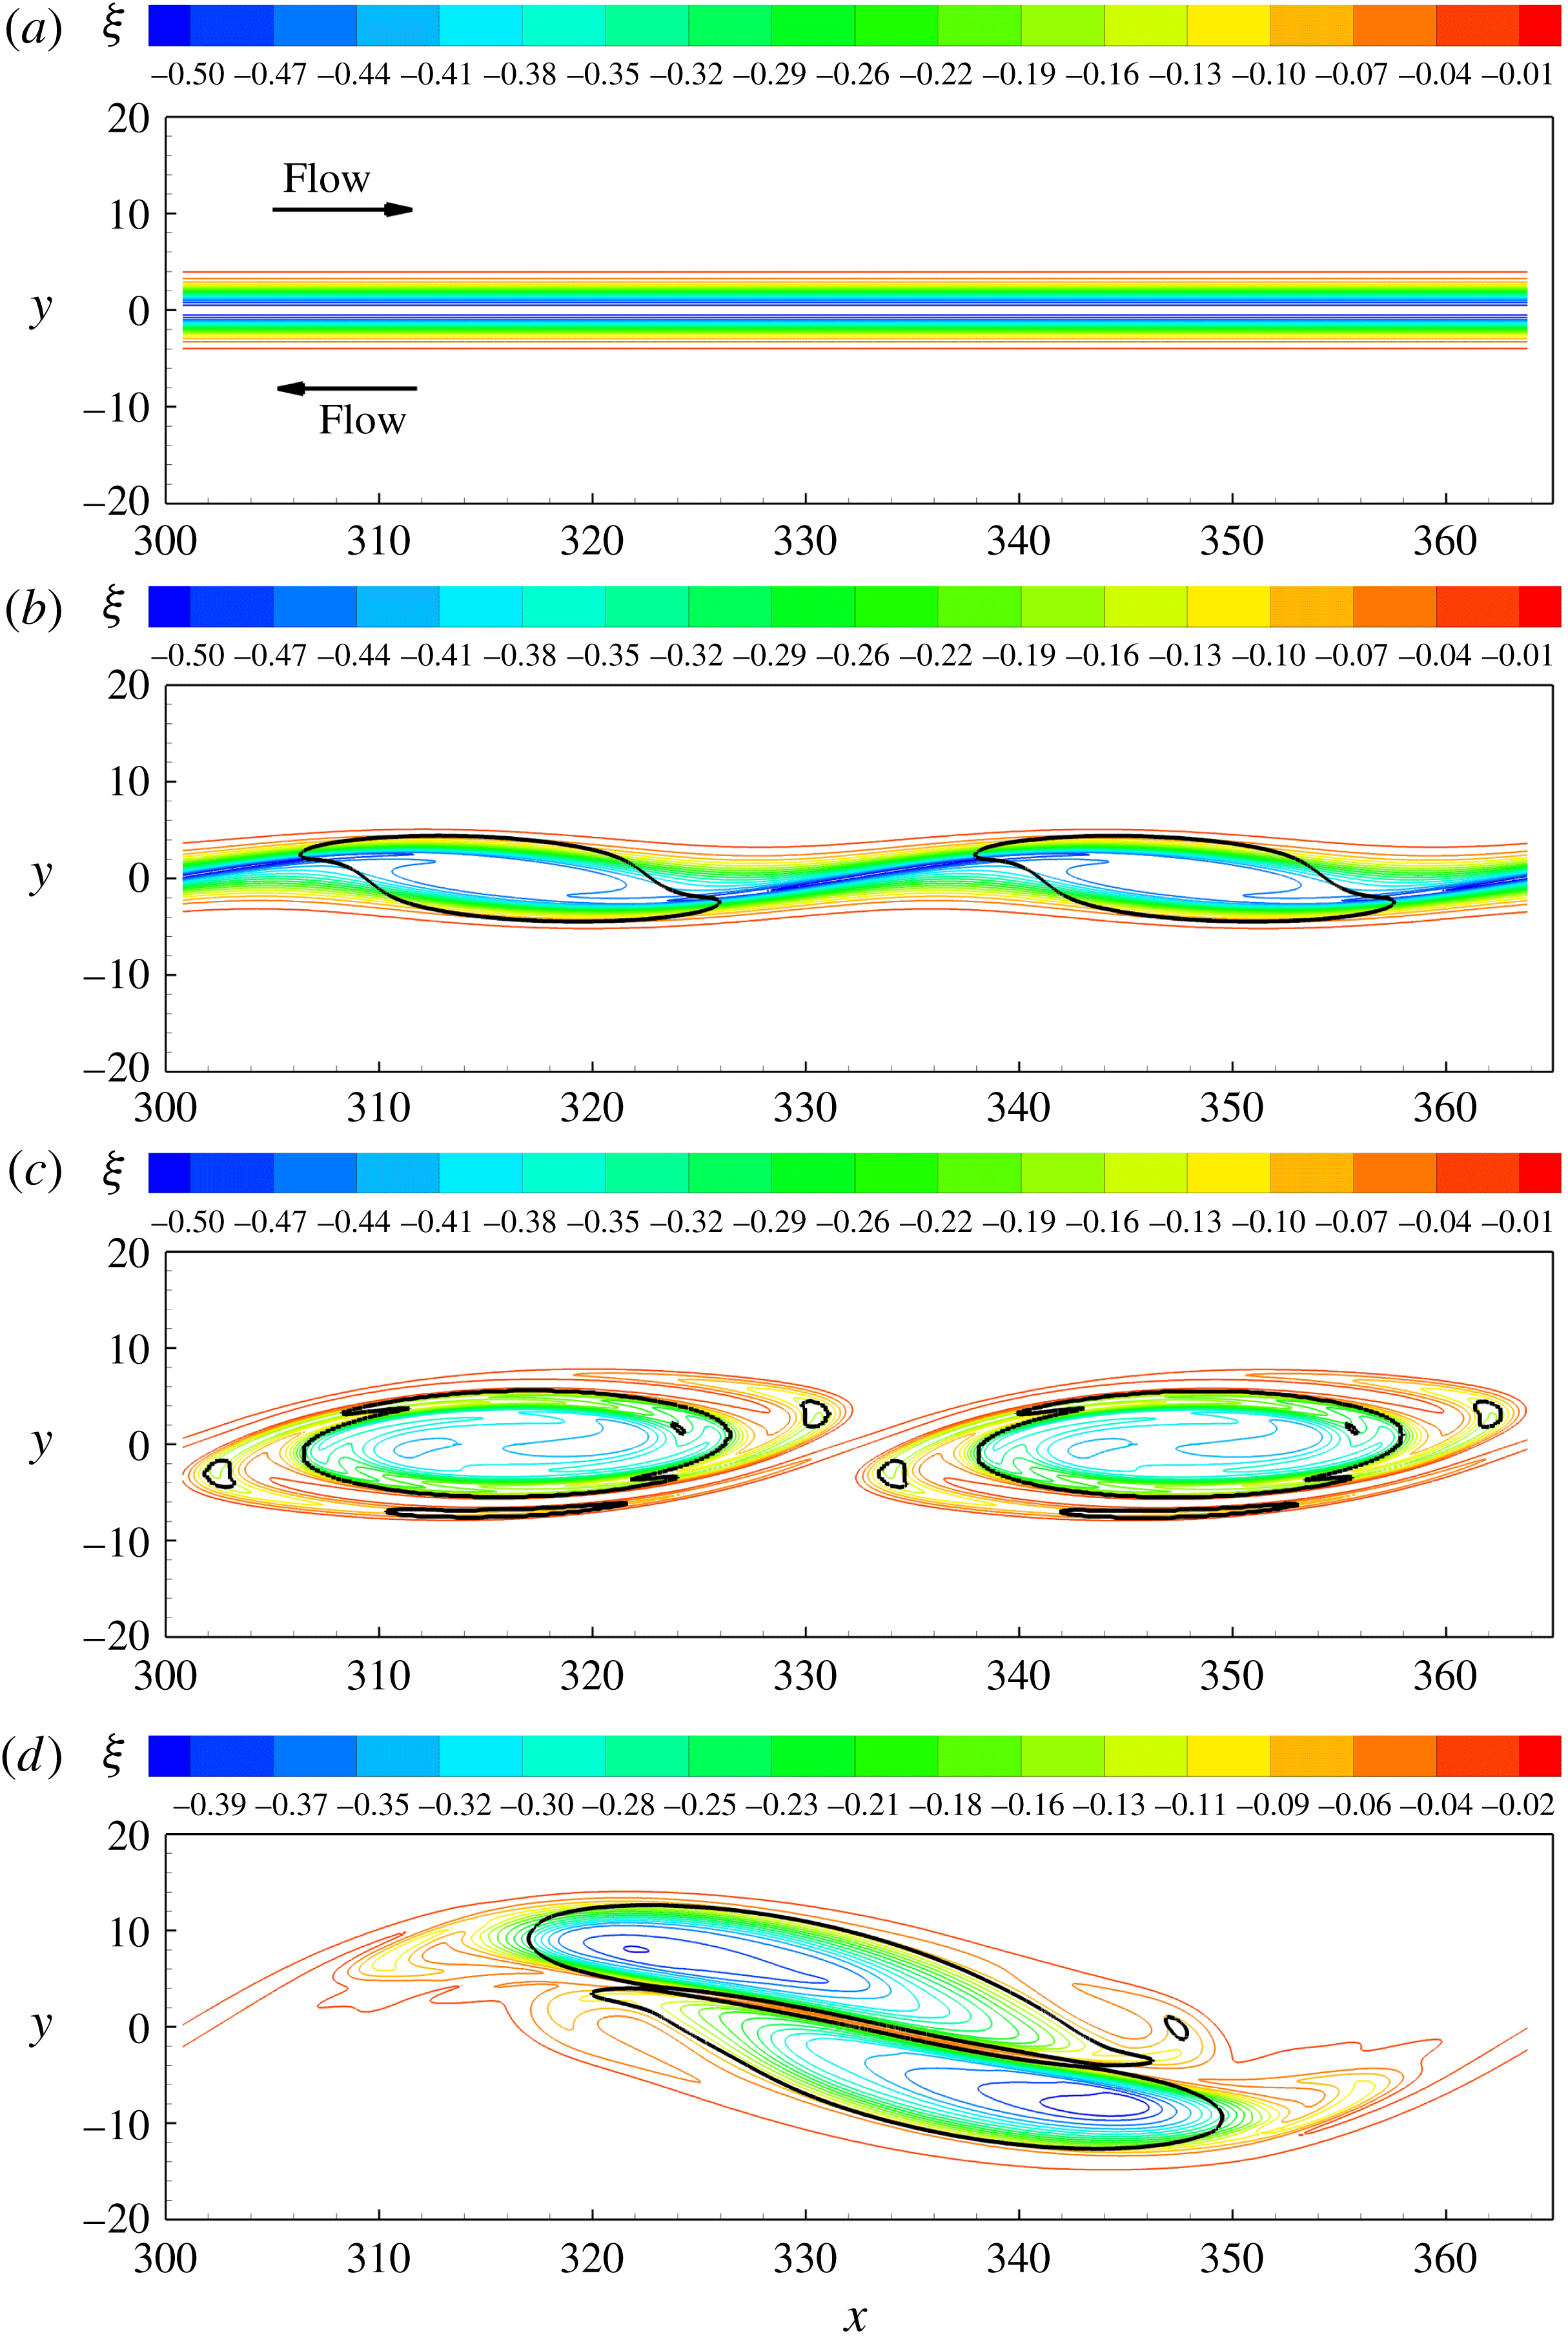
The evolution of the flow visualized by vorticity contours is shown in figure 4 for four time instants. At the initial stage, there is a large vortcity distribution in the shear layer, but the vortex vector
 $\boldsymbol{R}$
does not show up anywhere in the shear layer (see figure 4
a). This clearly implies that the existence of vorticity does not mean the existence of fluid rotation or vortex and the vorticity is not able to fully describe the vortex structure of the flow. In the following instants, two clockwise vortices appeared, which are shown as the black iso-line of the vortex vector
 $|\boldsymbol{R}|=0$
in figure 4(b–d) and the strength of the vortices become stronger as time advances.
The temporal evolution of the shear layer. (a) The distributions of vorticity at the initial stage. (b) Vorticity distribution with weak vortex generated during shear layer rolling up. (c) Contours of vorticity with a pair of vortices generated. (d) Contours of vorticity in the paring of the two vortices.

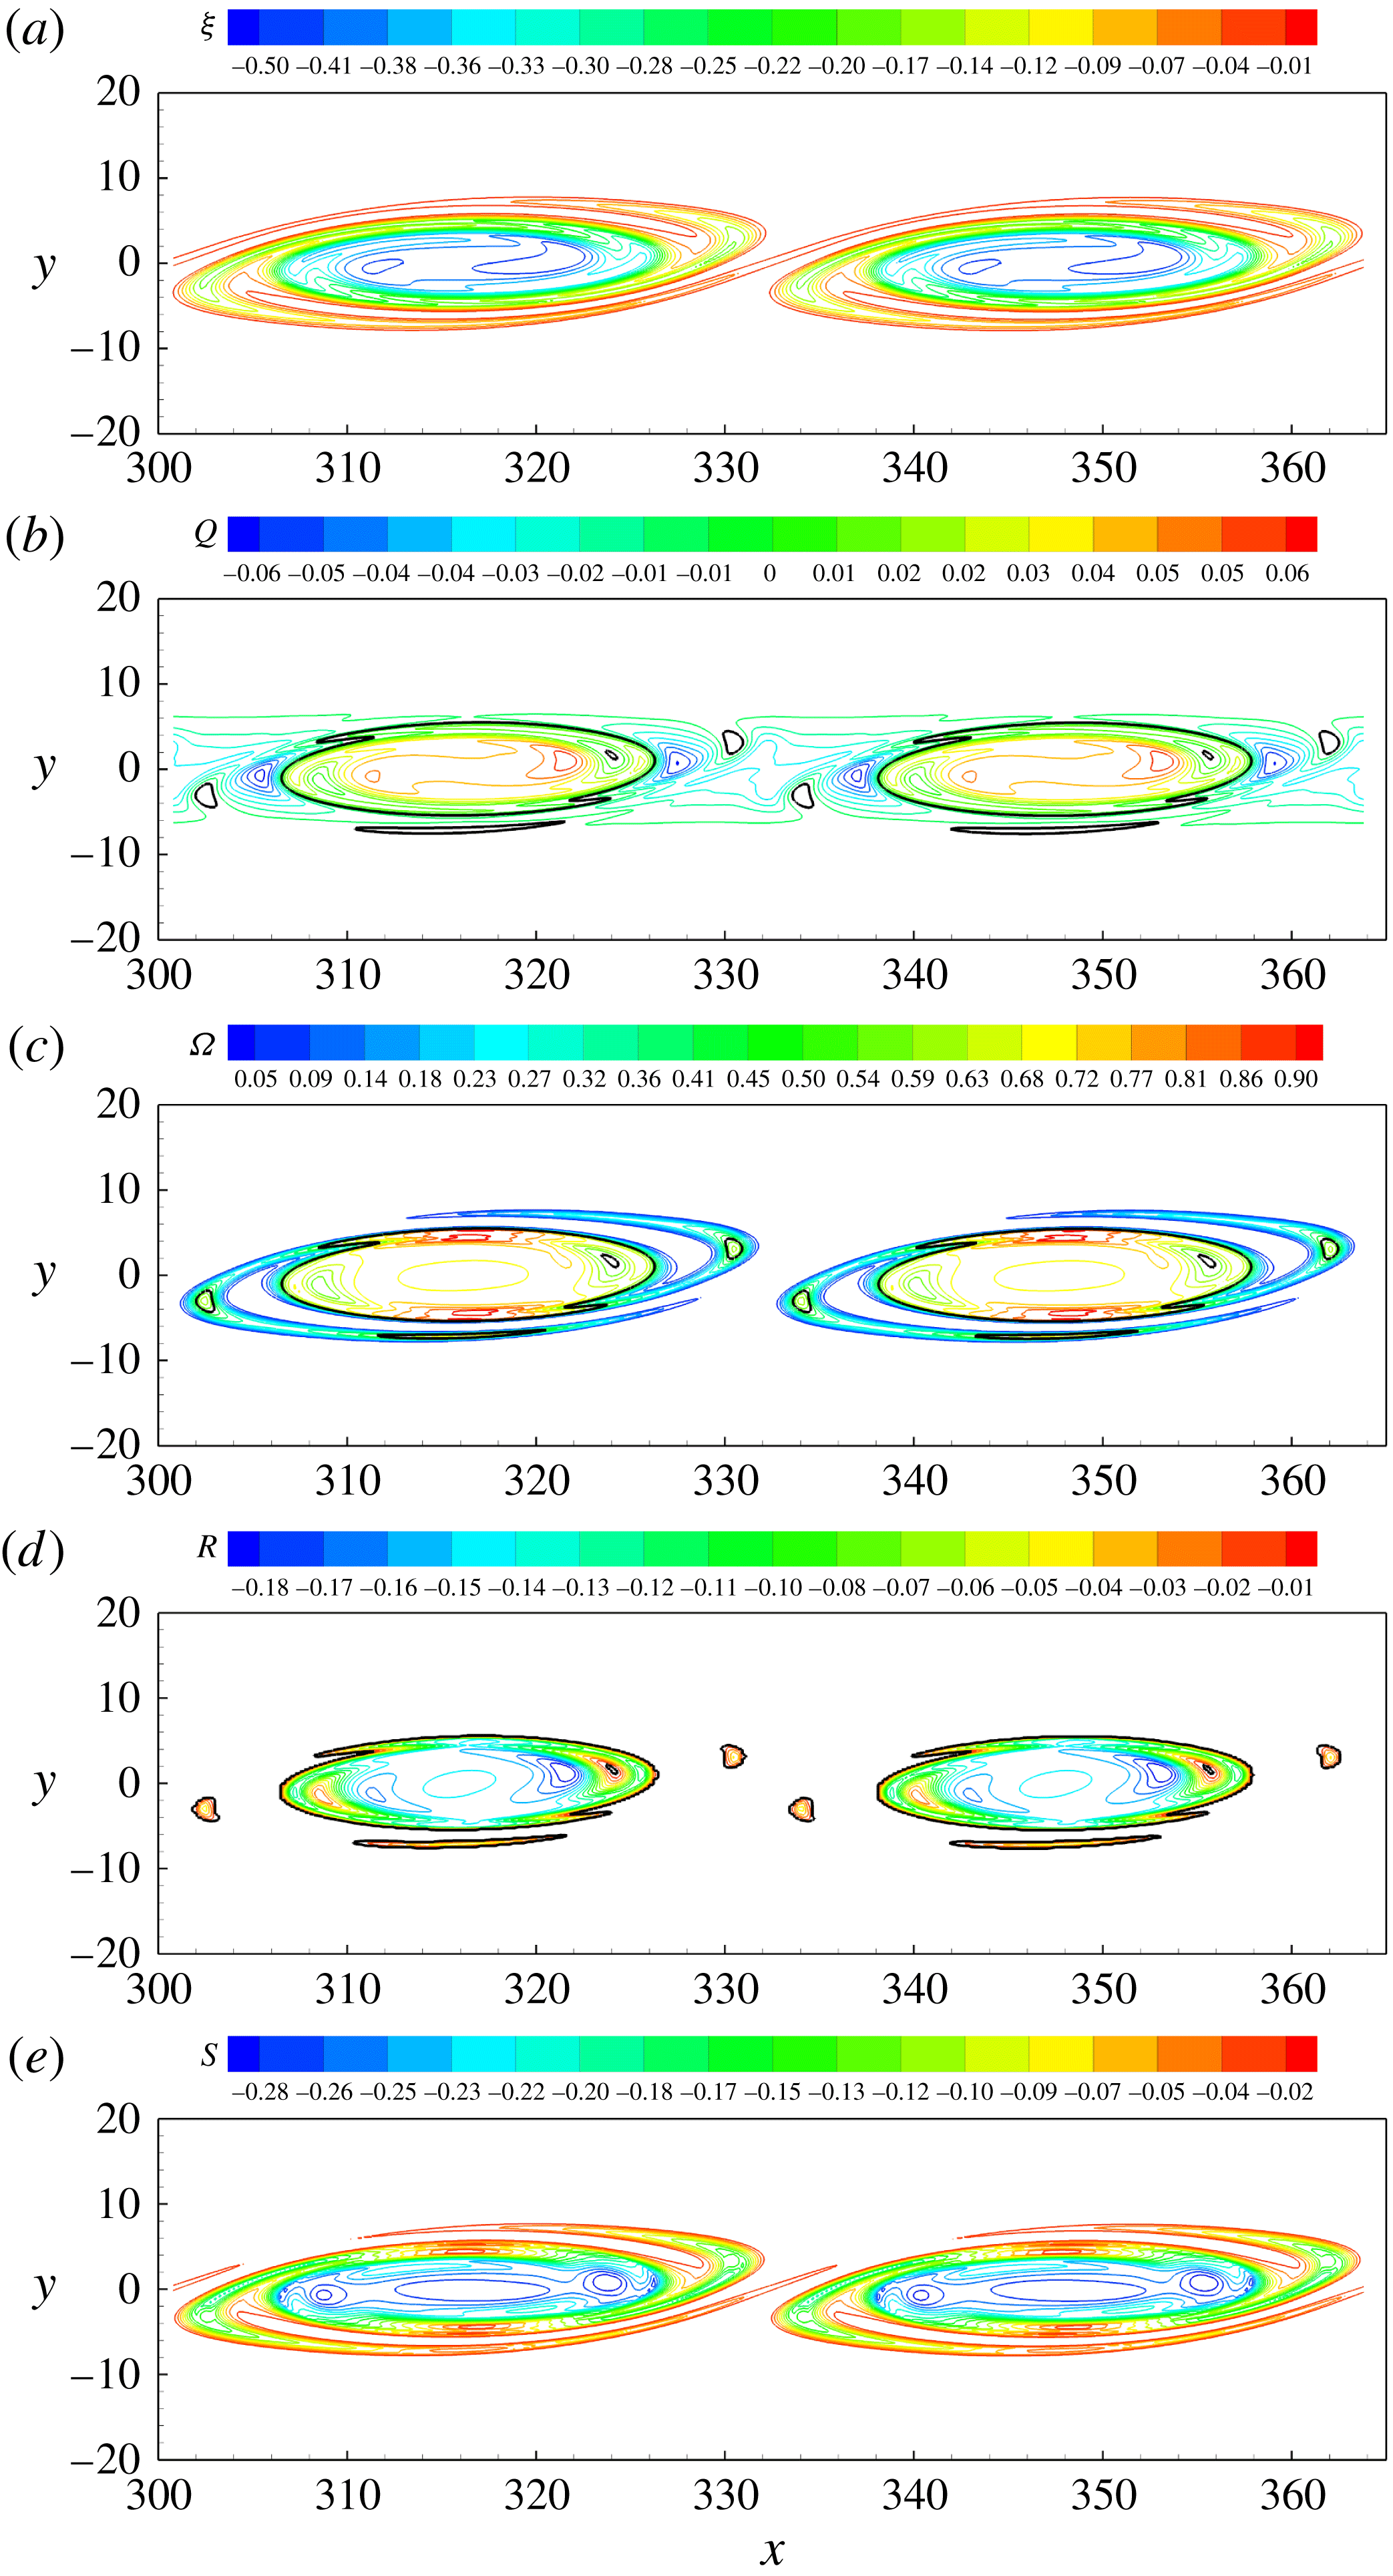
Distributions of a pair of vortices: (a) contours of vorticity for which it is not able to tell where the vortices are; (b) contours of
 $Q$
-criterion with the boundary of the vortex as the black lines which are the iso-lines of
 $Q=0.0$
; (c) contours of
 $\unicode[STIX]{x1D6FA}$
-criterion with the boundary of the vortex as the black lines which are the iso-lines of
 $\unicode[STIX]{x1D6FA}=0.5$
; (d) contours of the vortex vector with natural vortex boundaries which are the iso-lines of
 $|\boldsymbol{R}|=0$
; (e) contours of the non-rotational part of the vorticity.

The vortices of the instantaneous flow field shown in figure 4(c) are identified by the
 $Q$
-criterion,
 $\unicode[STIX]{x1D6FA}$
-criterion and vortex vector
 $\boldsymbol{R}$
, respectively. The iso-lines of
 $Q$
,
 $\unicode[STIX]{x1D6FA}$
and
 $\boldsymbol{R}$
are shown in figure 5. In figure 5(a–c), the black lines are the boundaries of the vortices identified by
 $Q=0.0$
,
 $\unicode[STIX]{x1D6FA}=0.5$
and
 $|\boldsymbol{R}|=0$
, respectively. It can be seen that all those methods can give the same vortical structures in the 2-D low speed flow. In fact, we can obtain the same equation by substituting the continuity equation for 2-D incompressible flow into (2.19) which will become the
 $Q$
-criterion. Note that
 $|\boldsymbol{R}|$
and
 $Q$
are not same for 3-D flow or compressible flow. Figure 5(d) shows the distribution of the non-rotational part of the vorticity which describes the shearing of the flow. It can be seen that the distribution of the non-rotational part of the vorticity is very similar to that of the vorticity. This reveals that the fluid rotation is different from the rotation of the rigid body and there is a strong shearing conjugated with the rotation of fluids in the vortex.
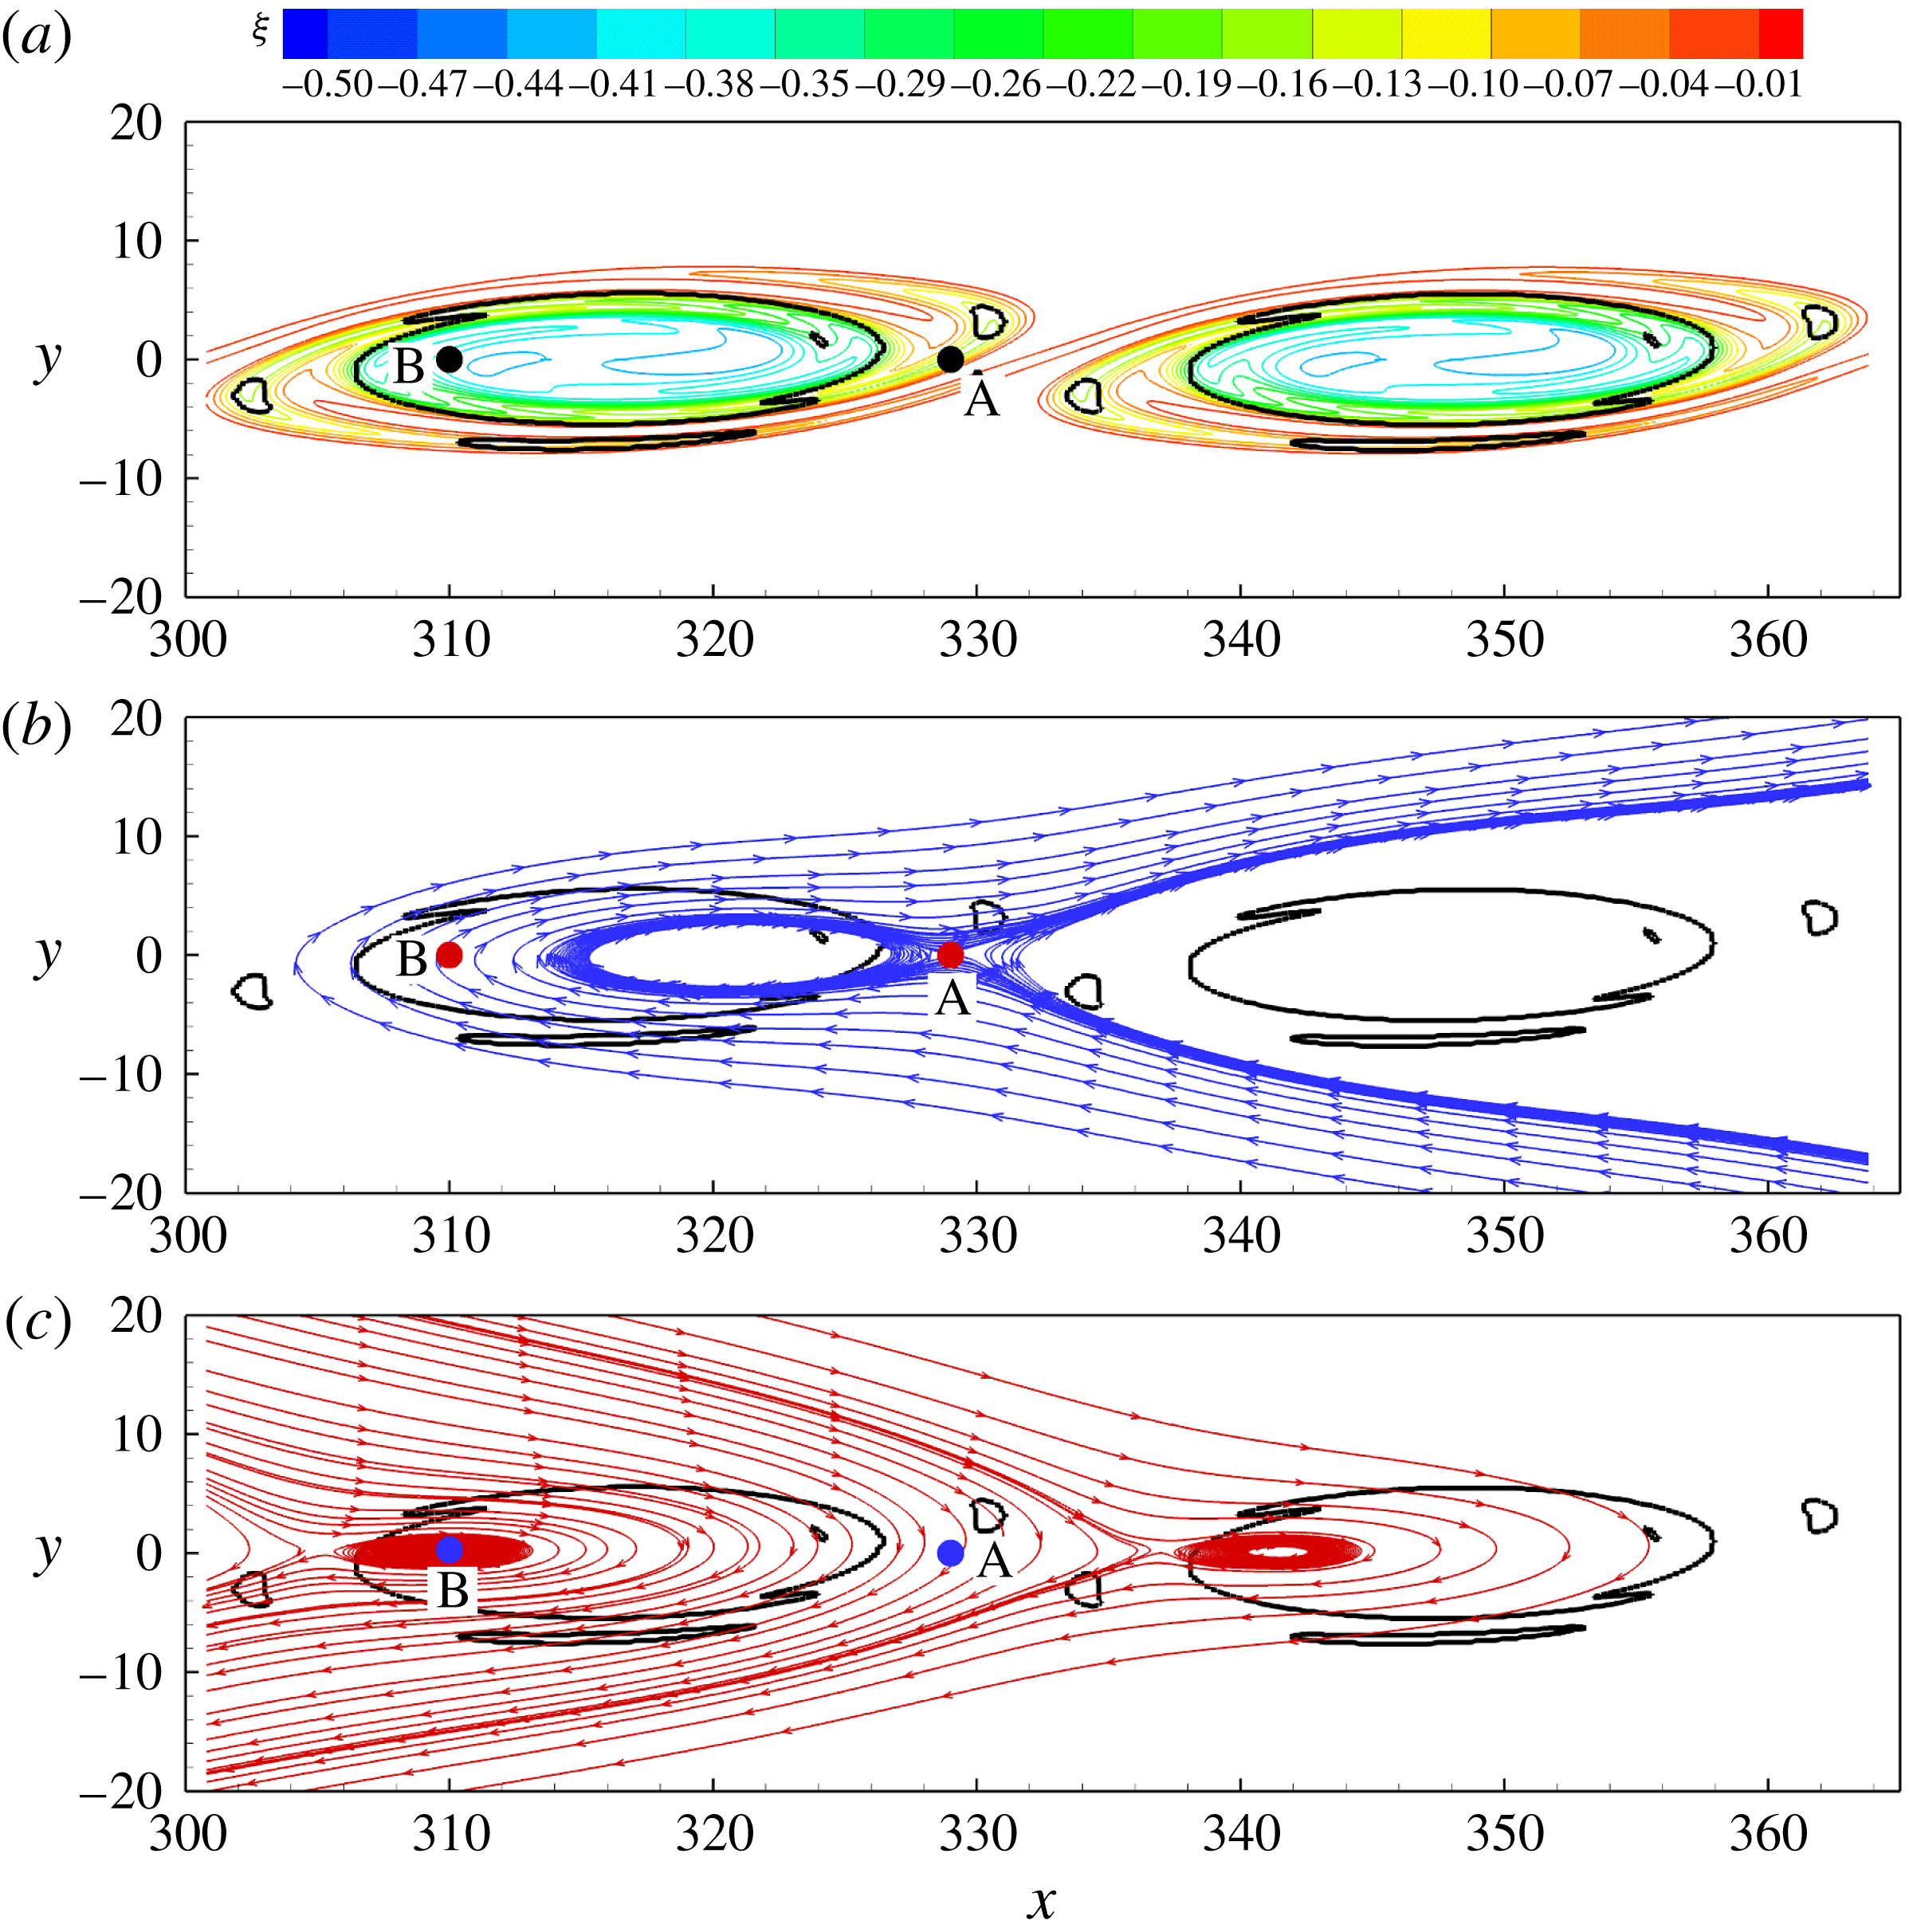
As we present in § 2, if a point in a flow field is fluid rotational, the fluid in the small neighbourhood of the point has the same tendency moving around it and pseudo-closed streamlines based on the velocity relative to the point can be created. At the instant shown in figure 4(c), we consider two points
 $A$
and
 $B$
, as shown in figure 6. Point
 $A$
is outside of the regions of the vortices and point
 $B$
lies in the left vortex, see figure 6(a). Using the velocity relative to each point respectively, the streamlines are created near point
 $A$
(see figure 6
b) and point
 $B$
(see figure 6
c). As we can see, there is no pseudo-closed streamline around point
 $A$
, but a pseudo-closed streamline can be formed around point
 $B$
, which shows that point
 $B$
is fluid rotational and point
 $A$
is not.
Pseudo-streamlines based on the relative velocity. (a) The positions of point
 $A$
, which is out of the vortex, and point
 $B$
, which is inside the vortex. (b) No closed pseudo-streamline around non-fluid-rotational point
 $A$
. (c) Closed pseudo-streamline around the fluid-rotational point
 $B$
.

From this example, it can be seen that the definition of the vortex vector can precisely describe the vortex and its magnitude represents the strength of the vortex. In the vortex, each point is fluid rotational, which means that the fluid in the neighbourhood of that point has the same direction of tangential velocity relative to that point. As a newly defined vector quantity, the vortex vector can be used to quantitatively study vortices.
4.3 Vortices in late boundary layer flow transition
For 2-D vortical structures, the direction of the vortex vector is predetermined, which is vortical to the flow plane. However, in the 3-D flow, the directions of vortex cores are unknown and they may change in time and space. By the definition of the vortex vector, how to determine the vortex direction is a key issue. As another example, we consider the vortices in late boundary layer transition, which is a process of vortex ‘build-up’. In the process of boundary layer transition, a
 $\unicode[STIX]{x1D6EC}$
-shaped vortex and hairpin vortex can be commonly observed not only in the experiment but also in the DNS simulation and they will be used to show the ability of the newly defined vortex vector in representing the complex vortical structure. In the following, the DNS data (Liu et al.
Reference Liu, Yan and Lu2014) of a late boundary layer flow transition obtained by DNSUTA are applied to capture the structures of the vortices.
As one of the most popular vortex identification methods, the
 $Q$
-criterion is selected to compare the ability of capturing the vortical structures in turbulence with our newly defined vortex vector. In fluid dynamics, the iso-surface of
 $Q$
is always used to illustrate the cores of the vortex. The typical structure of a
 $\unicode[STIX]{x1D6EC}$
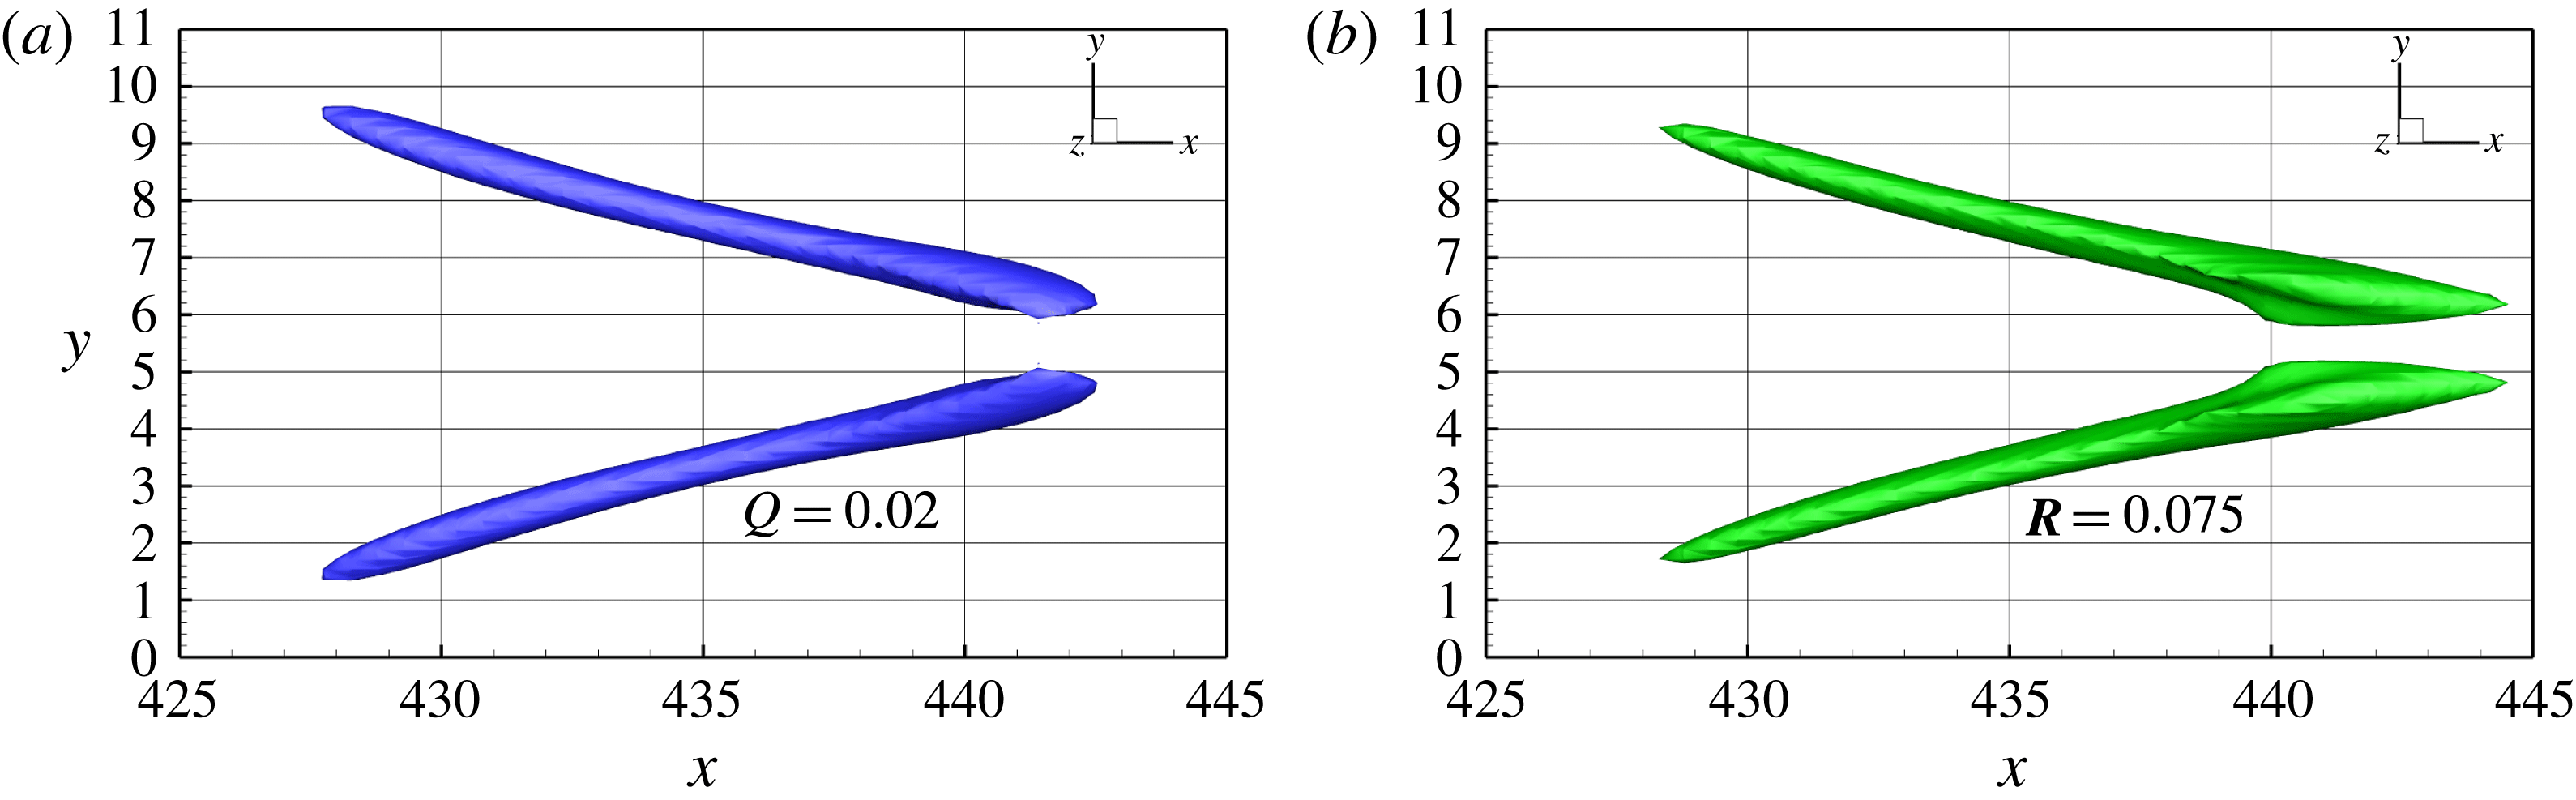
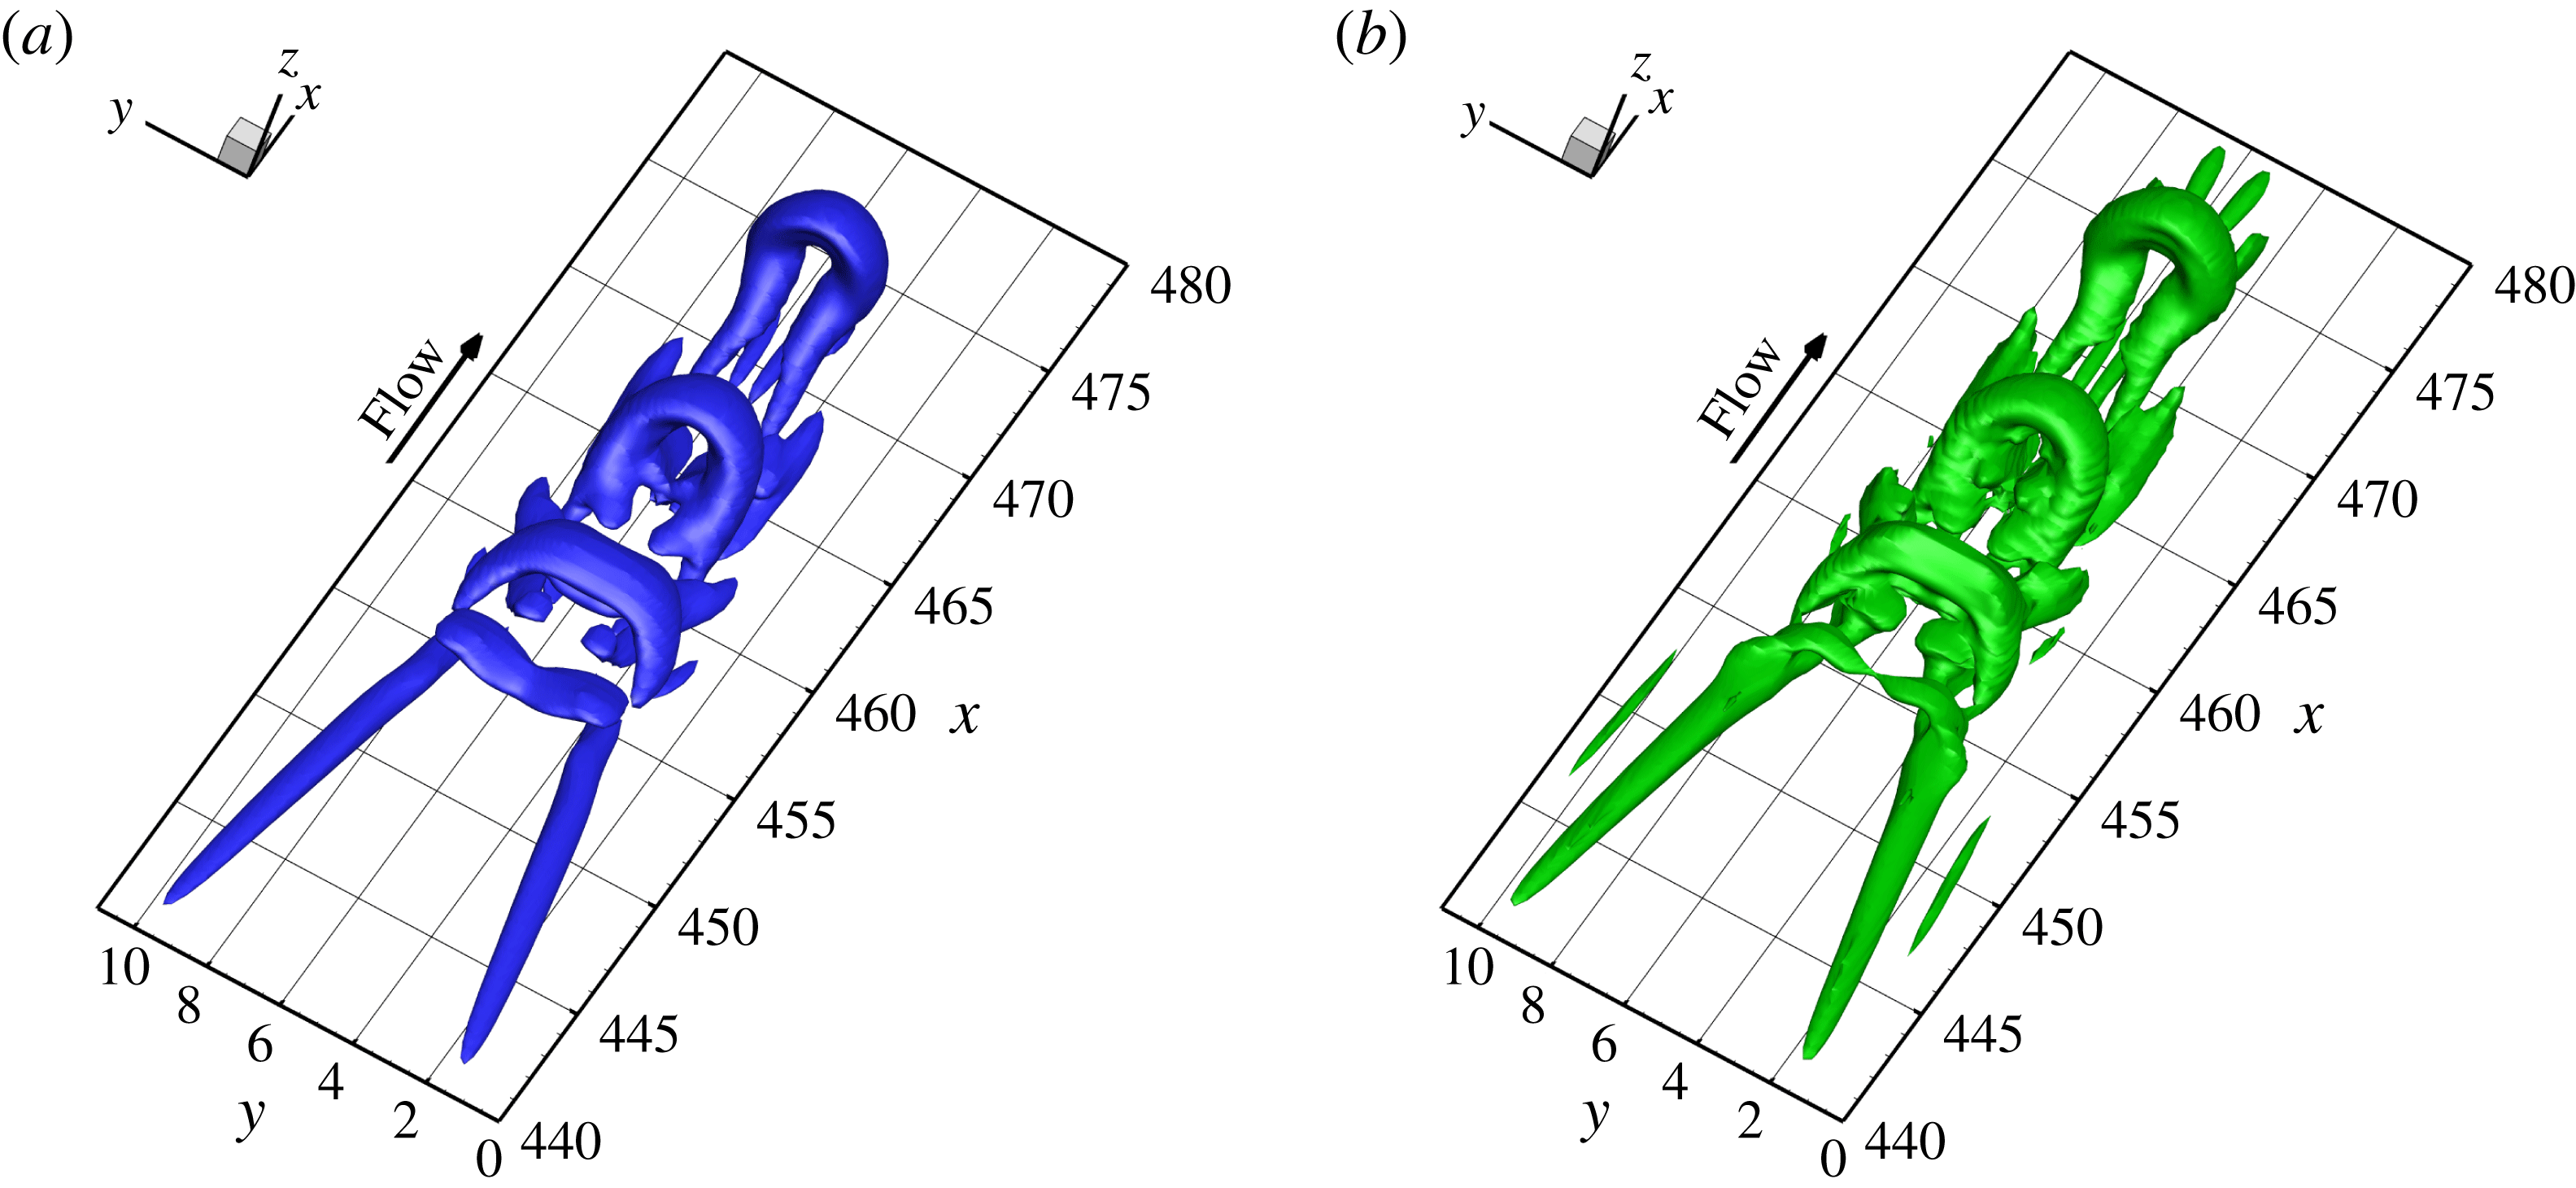
vortex is illustrated in figure 7 where the left blue surface is the iso-surface of
 $Q=0.02$
and the right green surface is the iso-surface of the magnitude of the vortex vector
 $|\boldsymbol{R}|=0.075$
. Both of them can illustrate the similar structure of the vortex cores. However, being different from the
 $Q$
-criterion vortex identification method, the magnitude of the vortex vector represents the strength of fluid rotation and the strength is the same on the iso-surface of
 $|\boldsymbol{R}|$
. The larger head of the vortex vector iso-surface reveals that there is a stronger rotation than in the tail, which the traditional vortex identification method cannot capture.
Typical structure of
 $\unicode[STIX]{x1D6EC}$
vortex visualized by (a) iso-surface of
 $Q=0.02$
; (b) iso-surface of the magnitude of the vortex vector
 $|\boldsymbol{R}|=0.075$
.

In classic vorticity dynamics, the vortices are always regarded as vorticity lines or tubes. However, they cannot fully describe the real vortex structures, even for a case as simple as a
 $\unicode[STIX]{x1D6EC}$
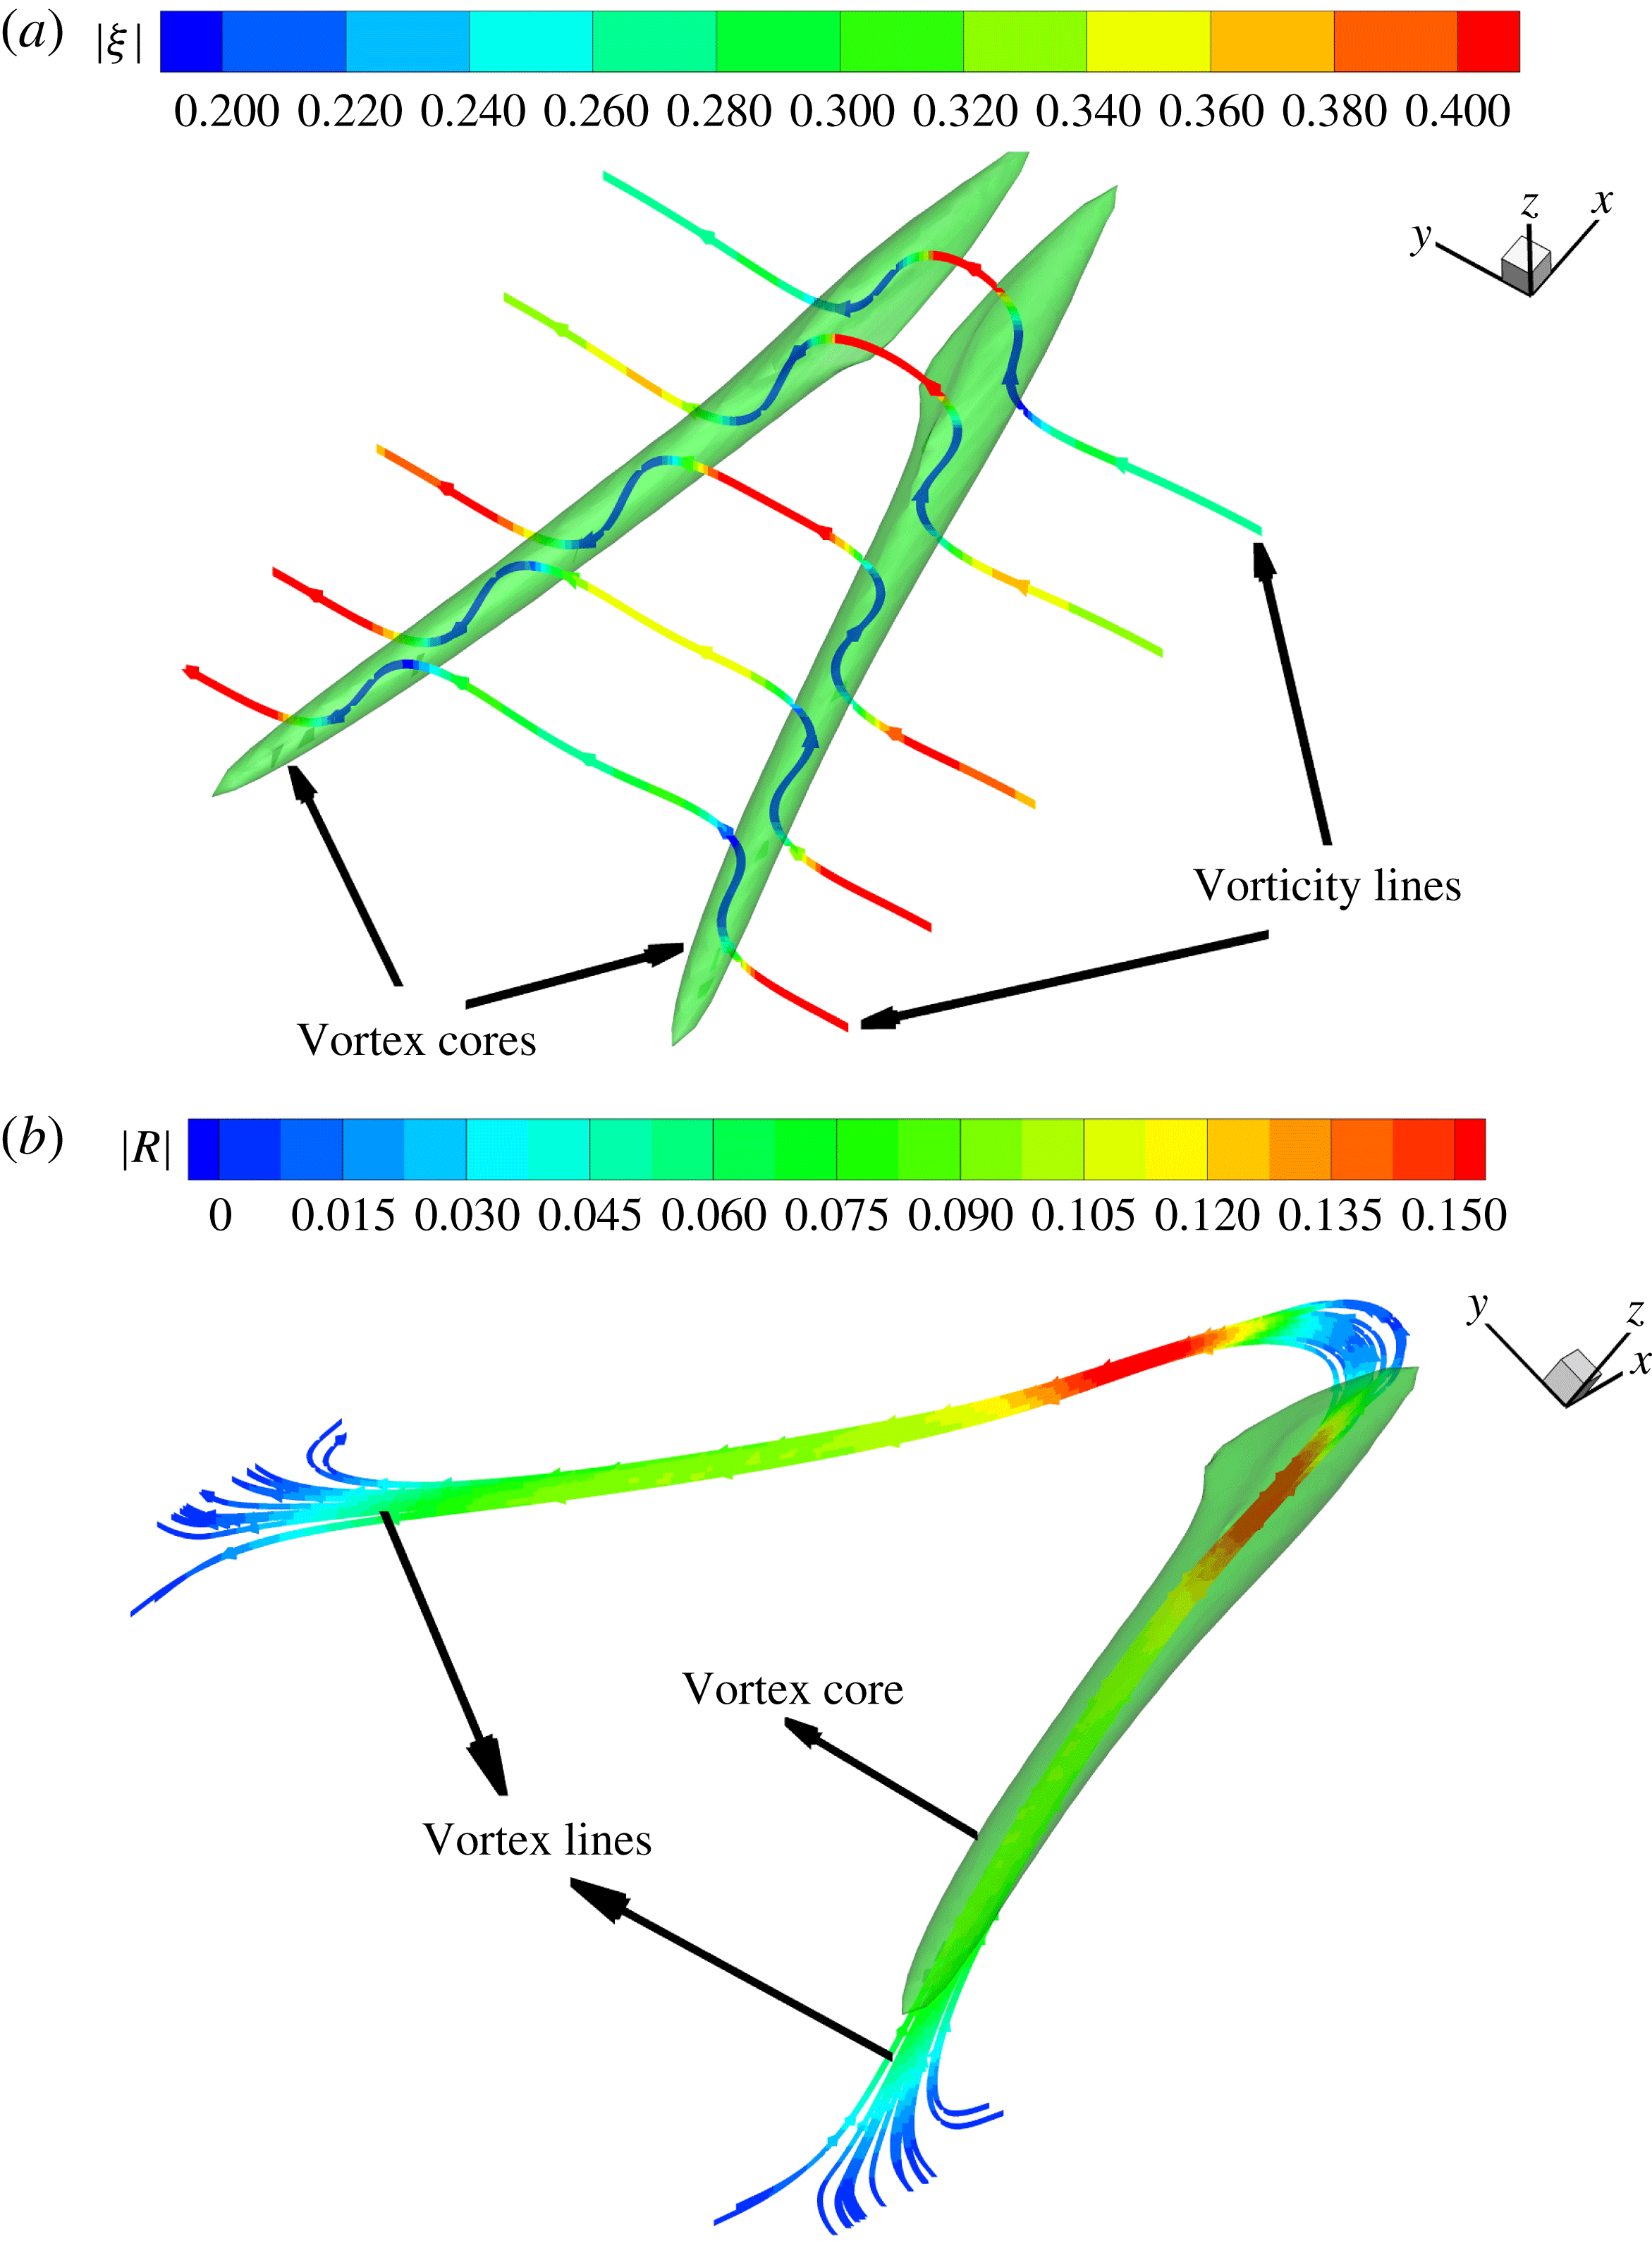
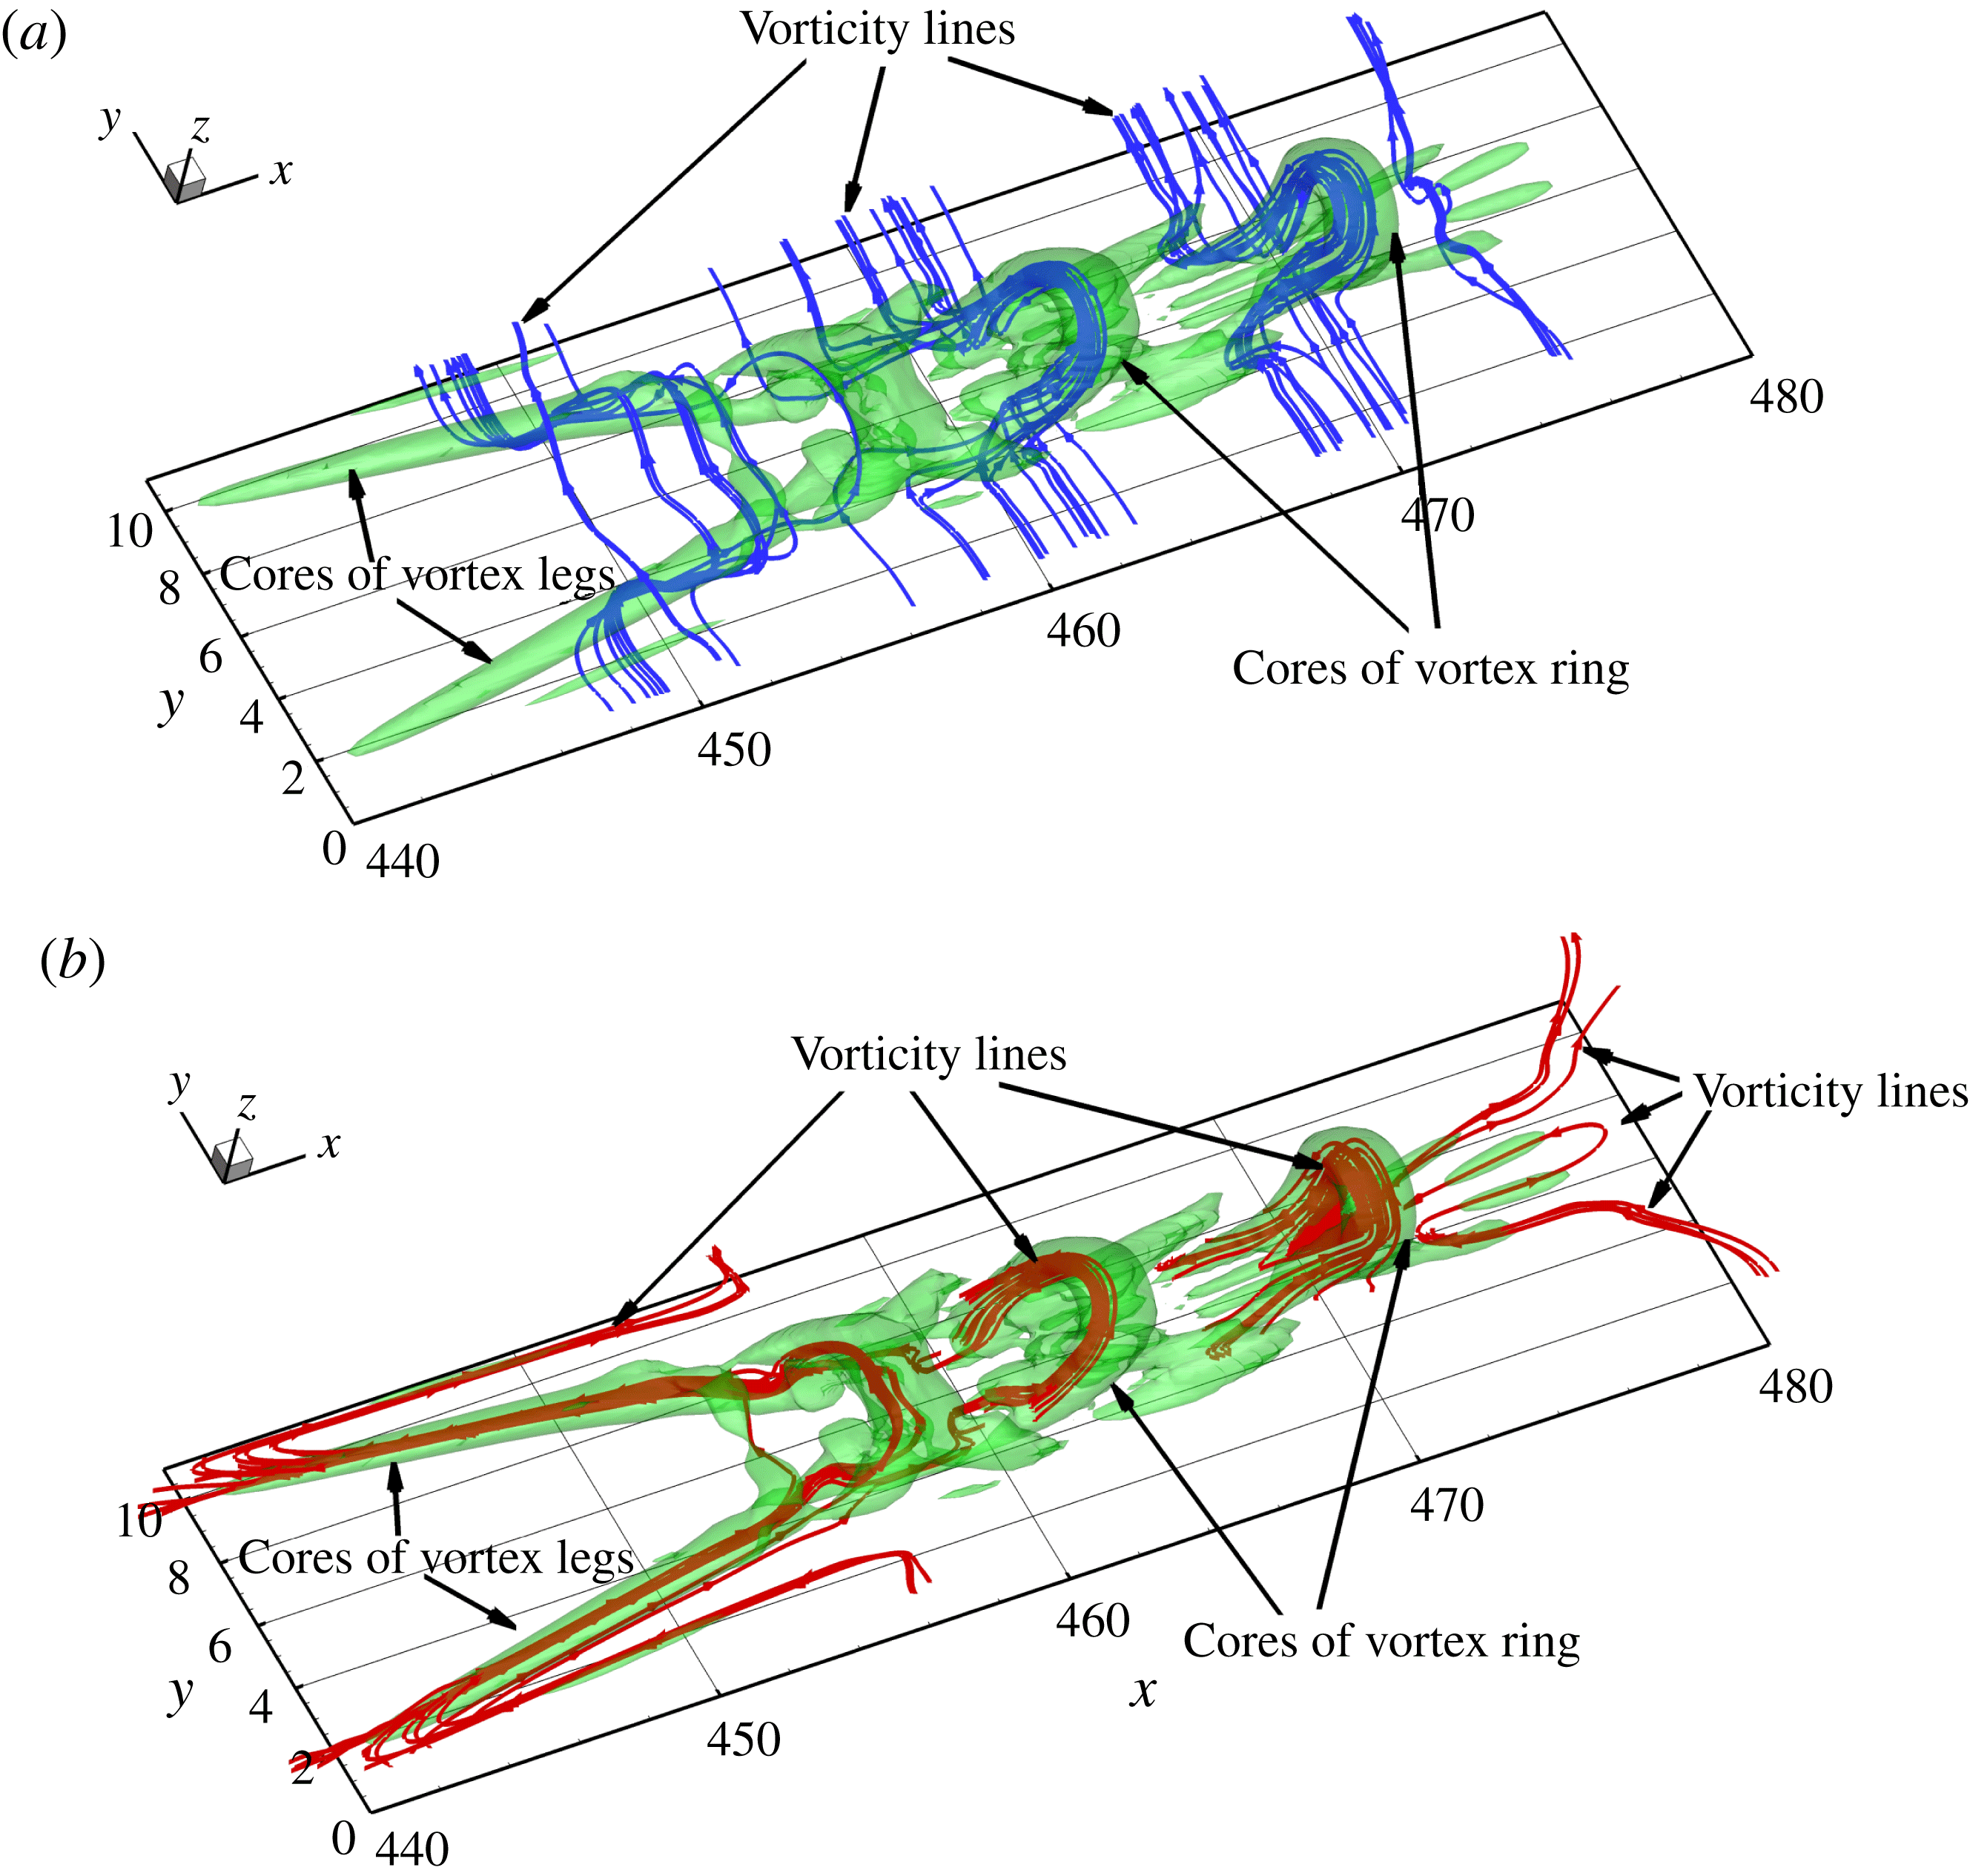
vortex. As shown in figure 8(a), the vorticity lines are created through points in the core of a
 $\unicode[STIX]{x1D6EC}$
vortex and it can be seen that the structure of the vorticity lines is totally different from that of the
 $\unicode[STIX]{x1D6EC}$
vortex. There are only a small portion of vorticity lines roughly aligned with the cores of vortex, but the new vortex lines defined in § 3 of this paper have the same structure as the cores of the
 $\unicode[STIX]{x1D6EC}$
vortex, see figure 8(b) in which the vortex lines are created inside the vortex core. These vortex lines are all aligned with the vortex core direction. In figure 8, the vorticity lines and vortex lines are coloured with the magnitude of the vorticity and vortex vector, respectively. It can be seen that as the rotational part of the vorticity, i.e. the vortex vector, cannot only fully describe the vortex structure but can also quantitatively give the strength of fluid rotation, where the red colour represents stronger rotation.
Comparison of vorticity lines with vortex lines. (a) Vorticity lines which are created through points in the vortex core are not aligned with the cores of the
 $\unicode[STIX]{x1D6EC}$
vortex legs and cannot be used to represent the vortex. (b) Vortex lines which are also created through the points in the vortex cores are aligned with the cores of the
 $\unicode[STIX]{x1D6EC}$
vortex legs and can represent the structure of the vortex.

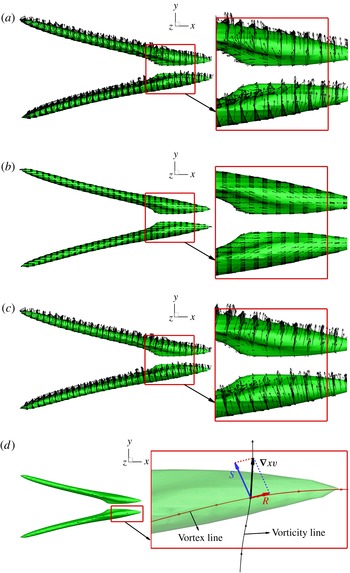
Compare the vector of vorticity with the vortex vector on the cores of the vortices which are illustrated by the iso-surface of
 $|\boldsymbol{R}|=0.075$
. (a) The vector of vorticity which is not aligned with (even orthogonal to) the vortex core and cannot fully describe the vortex. (b) The vector of the vortex vector which is aligned with the core of the
 $\unicode[STIX]{x1D6EC}$
vortex can represent the vortex. (c) The vector of shear vector which is the non-rotational part of the vorticity. (d) Comparison of the vectors of vorticity, vortex vector and shear vector at a point.

Different from vortex identification methods such as the
 $\unicode[STIX]{x1D6E5}$
-criterion,
 $Q$
-criterion,
 $\unicode[STIX]{x1D706}_{ci}$
-criterion,
 $\unicode[STIX]{x1D706}_{2}$
-criterion and
 $\unicode[STIX]{x1D6FA}$
-criterion, which are scalar quantities, the vortex vector, as a vector quantity, can also show the direction of local fluid rotation. In order to further compare the difference between the vorticity and vortex vector, the vectors on the vortex cores, which are illustrated by the iso-surface of
 $|\boldsymbol{R}|=0.075$
, are shown in figure 9. As we can see, the vector of vorticity is not aligned (even orthogonal to) with the vortex core (see figure 9
a), but the vortex vector is highly aligned with all parts of the
 $\unicode[STIX]{x1D6EC}$
vortex cores (see figure 9
b). The shear vector is also shown on the vortex cores and it has a very similar distribution as vorticity, see figures 9(a) and 9(c). When we draw the vectors of vorticity
 $\unicode[STIX]{x1D735}\times \boldsymbol{v}$
, the vortex vector
 $\boldsymbol{R}$
and shear vector
 $\boldsymbol{S}$
at the same point and create the vortex line and vorticity line through that point, it can be seen clearly that the vortex line and vortex vector are aligned with the vortex core, the vortex vector can represent fluid rotation and the vortex vector is the rotational part of the vorticity. However, the vector of vorticity has a different direction from the vortex and it further shows that vorticity cannot represent the rotation of the fluid. On the iso-surface of
 $|\boldsymbol{R}|=0.075$
, the shear vector is the main part of the vorticity at that point located at the tip of the
 $\unicode[STIX]{x1D6EC}$
vortex, as shown in figure 9(d). The vector distributions of the vortex vector and vorticity further imply that the vortex vector can fully describe the vortex structure, but the vorticity cannot for 3-D vortices. Actually, we have the formula:
 $\unicode[STIX]{x1D735}\times \boldsymbol{v}=\boldsymbol{R}+\boldsymbol{S}$
, which means the vorticity should be further decomposed into the vortex vector and shear vector.
In the process of late boundary layer transition, the hairpin vortex is a common vortex structure (Adrian Reference Adrian2007) and the flow structure is dominated by the hairpin vortices after the overshoot of skin friction (Sayadi, Hamman & Moin Reference Sayadi, Hamman and Moin2013). In natural flow transition, the hairpin vortices always appear in packets, as shown in figure 10 where a typical packet of hairpin vortices is visualized by using the iso-surface of
 $Q=0.02$
(see figure 10
a) and the magnitude of the vortex vector
 $|\boldsymbol{R}|=0.075$
(see figure 10
b). Similar to the example of a
 $\unicode[STIX]{x1D6EC}$
vortex, both methods give a similar structure for the vortices. However, the iso-surface of the vortex vector can show more small vortices while keeping the same shape and size of the large vortices than the
 $Q$
-criterion. This implies that the iso-surface of the magnitude of the vortex vector can correctly and accurately represent the topology and geometry of the vortex core structures of the complex vortices.
Typical structure of a packet of hairpin vortices illustrated by (a) iso-surface of
 $Q=0.02$
; (b) iso-surface of the magnitude of the vortex vector
 $|\boldsymbol{R}|=0.075$
.

The distribution of vorticity lines and vortex lines. (a) Vorticity lines which are not consistent with the cores of vortices. (b) Vortex lines which are aligned to the cores of the complex vortices.

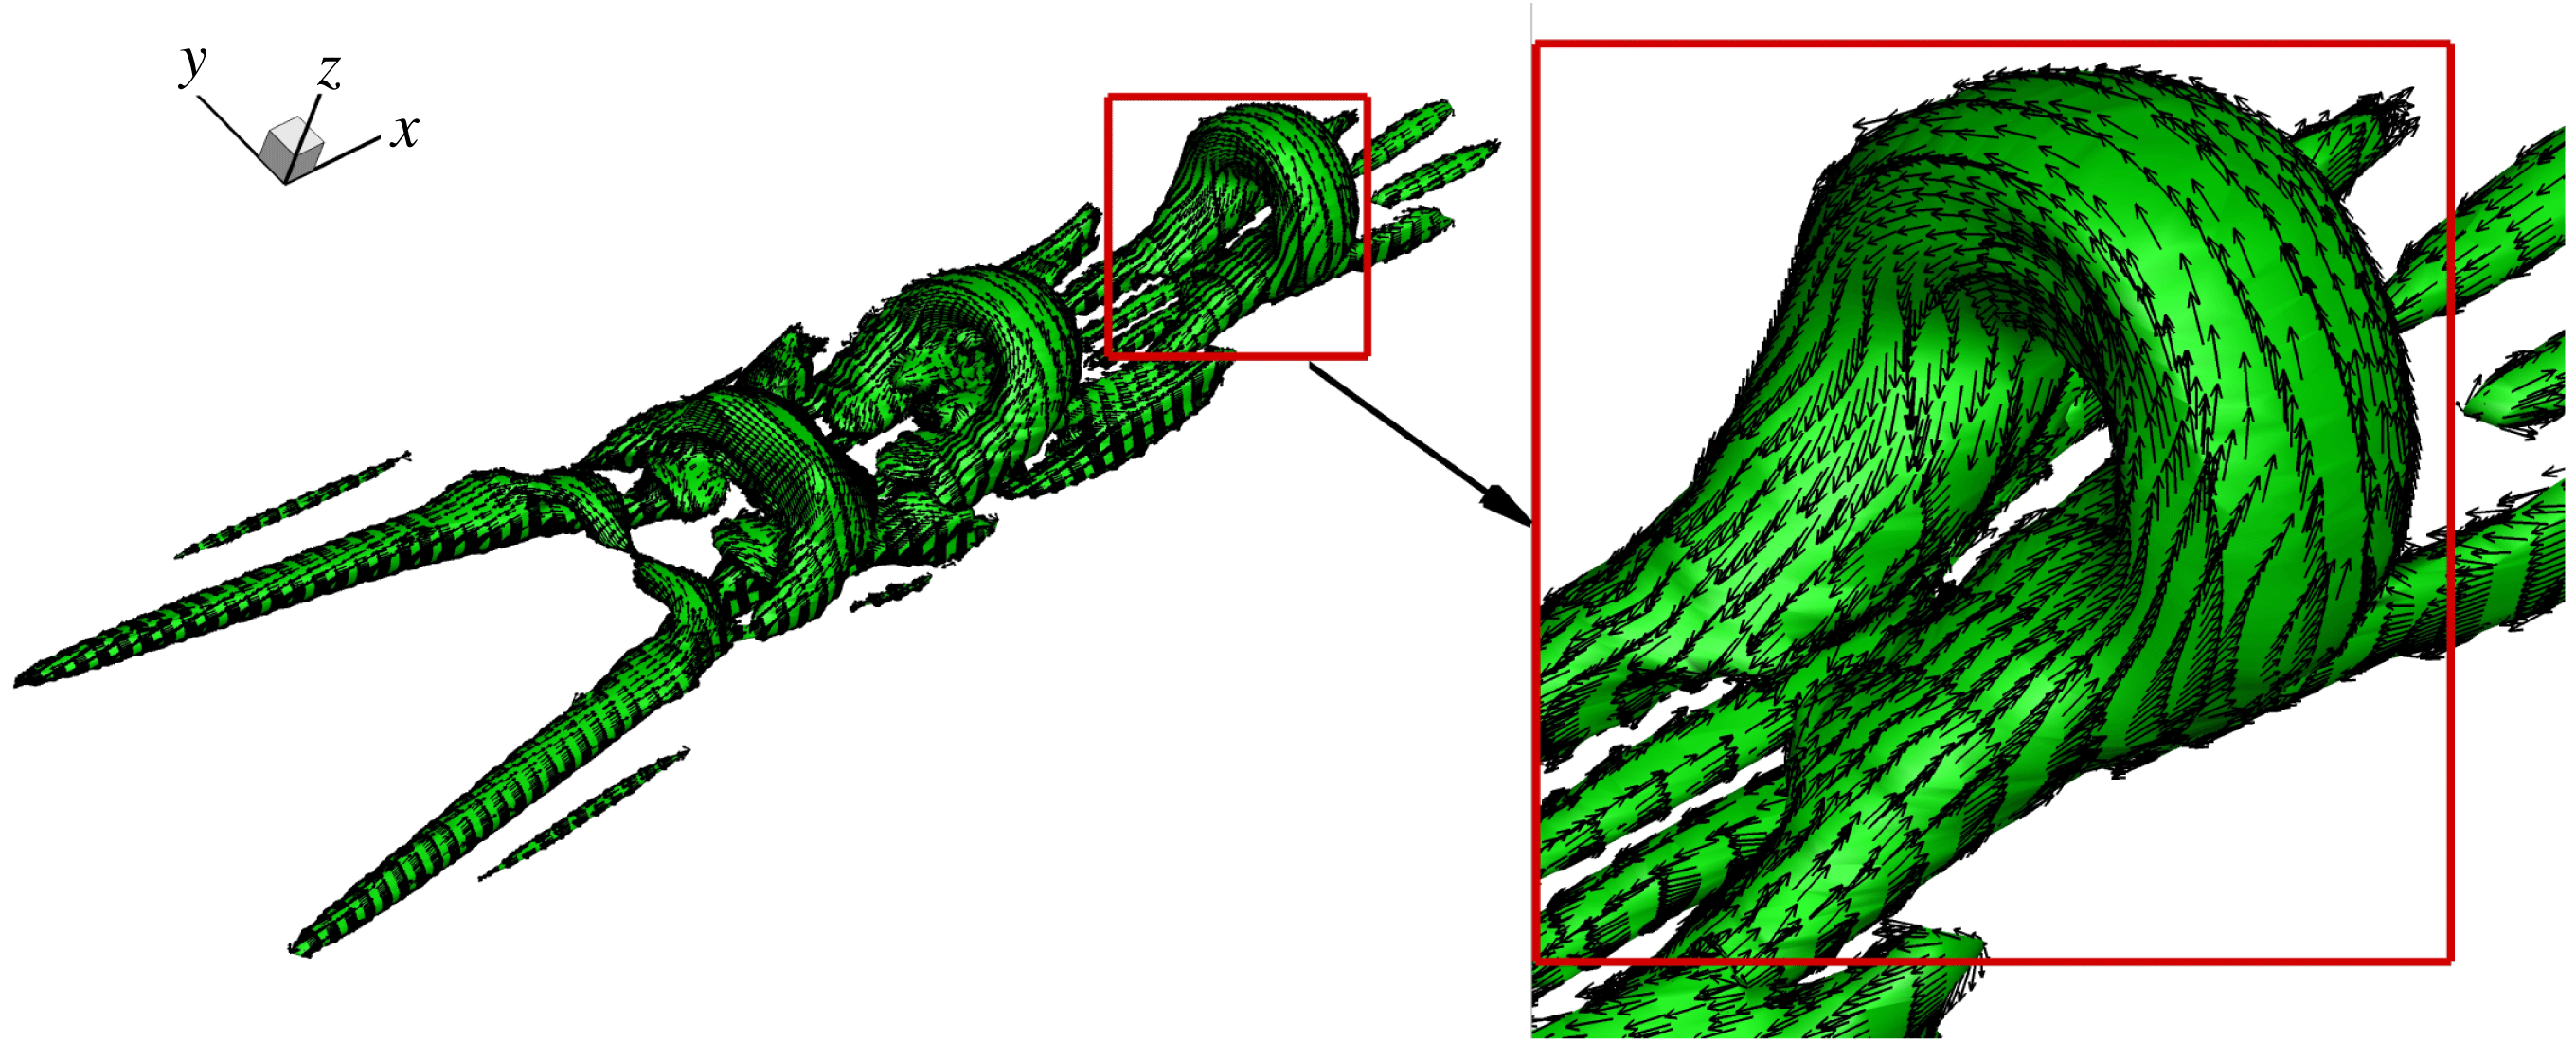
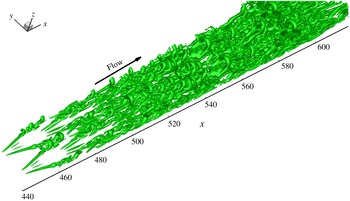
Figure 11 shows the structures of the vorticity lines and vortex lines which are all created through the same points. As can be seen, both vorticity lines and vortex lines can represent the topology of the ring of the hairpin vortex, but only the vortex lines are consistent with all vortex cores. The analysis of the distribution of vorticity and vortex vectors shows that the ring of the hairpin vortex is a very strong vortex core and a large part of the vorticity is rotational vorticity or the vortex vector. However, the other parts of the packet of the hairpin vortex are weak and the vortex vector is only a small part of the vorticity, so that the vorticity lines through those points in the weak vortex cores are not aligned to the vortex cores and only the vortex lines are always consistent with the vortex cores everywhere. This can be further verified by the vector distribution of the vortex vector (see figure 12) which illustrates vortex vectors on the surface of the core of the hairpin vortex packet. To show the ability of the vortex vector in describing the complex structure of the vortices, the vortical structures at one instant in the build-up of the laminar–turbulent flow transition process are visualized in figure 13 where the vortex cores are illustrated as the iso-surface of the magnitude of the vortex vector
 $|\boldsymbol{R}|=0.075$
. It can be found that the structures of the complex vortex can be correctly captured by the vortex vector. For these DNS data of the late flow transition, which contain a total of 60 million grid points, it only takes approximately 4.4 minutes to complete the calculation of the vortex vector on a regular laptop with a 2.9 GHz Intel Core i5 CPU and 8 GB memory.
The distribution of vortex vectors on the vortex cores which are illustrated by the iso-surface of
 $|\boldsymbol{R}|=0.075$
.

The process of vortical structure build-up in laminar–turbulent flow transition visualized by the iso-surface of the magnitude of the vortex vector
 $|\boldsymbol{R}|=0.075$
.

From the applications of the vorticity and vortex vector to describing the vortices in the late boundary layer transition, it can be found that the vorticity cannot fully describe the rotation of the fluid and the vorticity line or tube cannot well represent the vortex structure of the complex flow field. However, the newly defined vortex vector can fully represent the fluid rotation and can fully describe the vortices, even if they are as complex as vortices in turbulence. The vortex can be visualized by the vortex line, vortex tube or the iso-surface of the magnitude of the vortex vector. Different from the traditional vortex identification methods, the vortex vector cannot only visualize the structures of the vortex cores but also shows the rotation direction and the accurate strength of the vortex.
4.4 Vortical structures after micro-vortex generator (MVG)
For most vortex identification methods, there are problems when they are applied to compressible flow and modification is required (Kolář & Šístek Reference Kolář and Šístek2015; Epps Reference Epps2017). However, from the mathematical definition of our new vortex vector, it can be seen that the derivation is based on the analysis of the kinematics of a fluid element and it is not related to the compressibility of the flow. Therefore, the vortex vector only depends on the field of the velocity and therefore it can be used in any type of flow field. To show the ability in describing the complex vortical structures in compressible flow, a MVG (micro-vortex generator) case with an inflow
 $Ma=2.5$
is used as the last example in this paper. MVG is a passive control device aiming to alleviate flow separation. The previous study (Yang, Yan & Liu Reference Yang, Yan and Liu2016) shows that MVG can produce strong vortex rings and that the ring-like vortical structures could reduce the flow separation. The computational domain is the same as given by Yang et al. (Reference Yang, Yan and Liu2016) and the flow field is simulated by the LES method in which the fifth-order bandwidth-optimized weighted essentially non-oscillatory (WENO) scheme is used.
The distribution of vorticity lines and vortex lines. (a) Vorticity lines which are not consistent with the cores of the vortices. (b) Vortex lines which are aligned to the cores of the complex vortices.

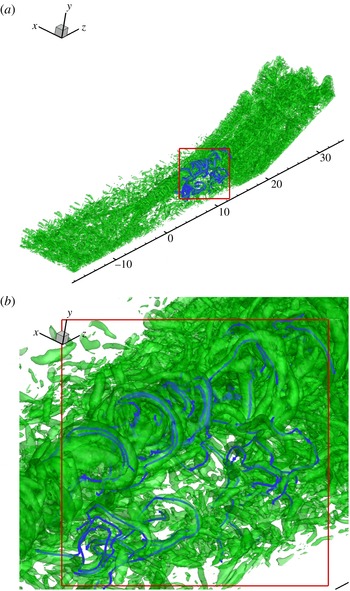
The complex vortical structures near the MVG are visualized by the iso-surface of the magnitude of the vortex vector
 $|\boldsymbol{R}|=1$
, see figure 14 in which the global view (figure 14
a) and local view (figure 14
b) of the vortical structures are presented. As we can see, the vortex vector defined in this paper can clearly capture the large ring-like vortex structures and the small vortices at the same time, even in such a complex case with interaction of the shock wave and turbulent boundary layers. The structures of the vortex lines (blue lines in figure 14
b) are also consistent with the cores of the vortices. This reveals that the newly defined vortex vector can well describe the vortical structures even in compressible turbulence.
5 Conclusions
In this paper, a mathematical definition of a new vector quantity called the vortex vector is given based on the kinematics of a fluid element to describe the local rotation of the fluid. The direction of the vortex vector is defined as the direction of the local fluid rotation axis which can be determined by the theorem that the velocity components in the local rotational plane have zero derivatives along the local rotation axis. The magnitude of the vortex vector is defined as the rotational part of the vorticity in the direction of the vortex vector which is twice the minimum angular velocity of the fluid in the plane perpendicular to the vortex vector. The vortex vector is the rotational part of the vorticity and, accordingly, the vorticity can be decomposed. According to the definition of the vortex vector, a vortex is defined as a connected flow region where the magnitude of the vortex vector at each point is larger than zero. The new definition is carefully checked by 2-D rigid-body rotation, 2-D laminar boundary layer, 2-D mixing layer, late boundary layer transition and supersonic flow around a micro-vortex generator. All these examples show the newly defined vortex vector can accurately represent the flow rotation and clearly displays the vortical structure of the flow field. Different from the vorticity vectors and vorticity lines, the newly defined vortex vectors and vortex lines are always aligned with the vortex cores. Based on the results, it can be concluded that the vorticity can be decomposed quantitatively into a rotational part (vortex vector) and non-rotational part (shear). Vorticity is not the vortex vector and cannot be applied to describe the vertical structure of complex flows. As turbulence is built up by vortices and driven by vortices, the newly defined vortex vector will become a powerful tool to study the coherent vertical structure of turbulence.
Acknowledgements
The authors are grateful to the Texas Advanced Computing Center (TACC) for providing computation hours. This research was funded in part by MURI FA9559-16-1-0364. The work was also supported by the Priority Academic Program Development of Jiangsu Higher Education Institutions. This work is accomplished by using Code DNSUTA which was released by Dr C. Liu at University of Texas at Arlington in 2009.
Appendix A
Here we derive (2.4). In order to transform the reference frame from
 $xyz$
to
 $XYZ$
, we can use the method of the quaternions which are often referred to as Euler parameters (Katz Reference Katz1996; Murman, Aftosmis & Berger Reference Murman, Aftosmis and Berger2003). The quadratic transformation matrix
 $\unicode[STIX]{x1D64C}$
, which is composed of the direction cosines, is composed of the four Euler parameters
 $$\begin{eqnarray}\displaystyle \boldsymbol{p}=\left[\begin{array}{@{}c@{}}e_{0}\\ e_{1}\\ e_{2}\\ e_{3}\end{array}\right]. & & \displaystyle\end{eqnarray}$$
The Euler parameters specify an axis of rotation
 $(\boldsymbol{a}=a_{x}\boldsymbol{i}+a_{y}\,\boldsymbol{j}+a_{z}\boldsymbol{k})$
, and an angular displacement
 $(\unicode[STIX]{x1D711})$
about that axis
 $$\begin{eqnarray}\displaystyle \left.\begin{array}{@{}c@{}}e_{0}=\displaystyle \cos \frac{\unicode[STIX]{x1D711}}{2},\\[12.0pt] e_{1}=a_{x}\displaystyle \sin \frac{\unicode[STIX]{x1D711}}{2},\\[12.0pt] e_{2}=a_{y}\displaystyle \sin \frac{\unicode[STIX]{x1D711}}{2},\\[12.0pt] e_{3}=a_{z}\displaystyle \sin \frac{\unicode[STIX]{x1D711}}{2}.\end{array}\right\} & & \displaystyle\end{eqnarray}$$
The transformation matrix
 $\unicode[STIX]{x1D64C}$
in terms of the Euler parameters is given by
 $$\begin{eqnarray}\displaystyle \unicode[STIX]{x1D64C}=2\left[\begin{array}{@{}ccc@{}}e_{0}^{2}+e_{1}^{2}-\frac{1}{2} & e_{1}e_{2}-e_{0}e_{3} & e_{1}e_{3}+e_{0}e_{2}\\ e_{1}e_{2}+e_{0}e_{3} & e_{0}^{2}+e_{2}^{2}-\frac{1}{2} & e_{2}e_{3}-e_{0}e_{1}\\ e_{1}e_{3}-e_{0}e_{2} & e_{2}e_{3}+e_{0}e_{1} & e_{0}^{2}+e_{3}^{2}-\frac{1}{2}\end{array}\right]. & & \displaystyle\end{eqnarray}$$
Therefore, we can transform the reference frame
 $xyz$
to
 $XYZ$
in which the vector
 $\boldsymbol{r}=r_{x}\boldsymbol{i}+r_{y}\,\boldsymbol{j}+r_{z}\boldsymbol{k}$
is parallel to axis
 $Z$
by rotating the frame about an axis
 $\boldsymbol{a}=a_{x}\boldsymbol{i}+a_{y}\,\boldsymbol{j}+a_{z}\boldsymbol{k}$
with an angular
 $\unicode[STIX]{x1D711}$
. Here, the rotation axis is perpendicular to the plane determined by the axis
 $z(\boldsymbol{z}=0\boldsymbol{i}+0\boldsymbol{j}+1\boldsymbol{k})$
and the vector
 $\boldsymbol{r}$
, so that
 $$\begin{eqnarray}\displaystyle & \displaystyle \boldsymbol{a}={\displaystyle \frac{\boldsymbol{r}\times \boldsymbol{z}}{|\boldsymbol{r}\times \boldsymbol{z}|}}={\displaystyle \frac{r_{y}}{\sqrt{r_{x}^{2}+r_{y}^{2}}}}\boldsymbol{i}-{\displaystyle \frac{r_{x}}{\sqrt{r_{x}^{2}+r_{y}^{2}}}}\,\boldsymbol{j}+0\boldsymbol{k}={\displaystyle \frac{r_{y}}{\sqrt{1-r_{z}^{2}}}}\boldsymbol{i}-{\displaystyle \frac{r_{x}}{\sqrt{1-r_{z}^{2}}}}\,\boldsymbol{j}+0\boldsymbol{k}.\quad & \displaystyle\end{eqnarray}$$
The angular displacement is the angle between the axis
 $z$
and the vector
 $\boldsymbol{r}$
and
 $$\begin{eqnarray}\displaystyle & \displaystyle \cos \unicode[STIX]{x1D711}={\displaystyle \frac{\boldsymbol{z}\boldsymbol{\cdot }\boldsymbol{r}}{|\boldsymbol{z}||\boldsymbol{r}|}}=r_{z}. & \displaystyle\end{eqnarray}$$
As
 $0\leqslant \unicode[STIX]{x1D711}\leqslant \unicode[STIX]{x03C0}$
,
 $$\begin{eqnarray}\displaystyle \left.\begin{array}{@{}l@{}}\sin \displaystyle \frac{\unicode[STIX]{x1D711}}{2}=\sqrt{\displaystyle \frac{\displaystyle 1-r_{z}}{2}},\\[12.0pt] \cos \displaystyle \frac{\unicode[STIX]{x1D711}}{2}=\sqrt{\displaystyle \frac{\displaystyle 1+r_{z}}{2}}.\end{array}\right\} & & \displaystyle\end{eqnarray}$$
Therefore, the four Euler parameters can be given as follows,
 $$\begin{eqnarray}\displaystyle \left.\begin{array}{@{}l@{}}e_{0}=\cos \displaystyle \frac{\unicode[STIX]{x1D711}}{2}=\sqrt{\frac{1+r_{z}}{2}},\\[12.0pt] e_{1}=a_{x}\sin \displaystyle \frac{\unicode[STIX]{x1D711}}{2}=\frac{r_{y}}{\sqrt{2(1+r_{z})}},\\[12.0pt] e_{2}=a_{y}\sin \displaystyle \frac{\unicode[STIX]{x1D711}}{2}=-\frac{r_{x}}{\sqrt{2(1+r_{z})}},\\[12.0pt] e_{3}=a_{z}\displaystyle \sin \frac{\unicode[STIX]{x1D711}}{2}=0.\end{array}\right\} & & \displaystyle\end{eqnarray}$$
Substituting (A 7) above into (A 3), the transformation matrix, in terms of vector
 $\boldsymbol{r}$
, can be written as
 $$\begin{eqnarray}\displaystyle \unicode[STIX]{x1D64C}=\left[\begin{array}{@{}ccc@{}}\displaystyle \frac{{r_{y}}^{2}+{r_{z}}^{2}+r_{z}}{1+r_{z}} & -\displaystyle \frac{r_{x}r_{y}}{1+r_{z}} & -r_{x}\\ \displaystyle -\frac{r_{x}r_{y}}{1+r_{z}} & \displaystyle \frac{{r_{x}}^{2}+{r_{z}}^{2}+r_{z}}{1+r_{z}} & -r_{y}\\ r_{x} & r_{y} & r_{z}\end{array}\right]. & & \displaystyle\end{eqnarray}$$
The transformation matrix is an orthogonal matrix and
 $$\begin{eqnarray}\displaystyle \unicode[STIX]{x1D64C}^{-1}=\unicode[STIX]{x1D64C}^{\text{T}}=\left[\begin{array}{@{}ccc@{}}\displaystyle \frac{{r_{y}}^{2}+{r_{z}}^{2}+r_{z}}{1+r_{z}} & -\displaystyle \frac{r_{x}r_{y}}{1+r_{z}} & r_{x}\\ \displaystyle -\frac{r_{x}r_{y}}{1+r_{z}} & \displaystyle \frac{{r_{x}}^{2}+{r_{z}}^{2}+r_{z}}{1+r_{z}} & r_{y}\\ -r_{x} & -r_{y} & r_{z}\end{array}\right]. & & \displaystyle\end{eqnarray}$$
Appendix B
The formulas of equations (2.7) and (2.8) in terms of vector
 $\boldsymbol{r}$
are given here. Substituting (2.1) and (2.2) into (2.3), we can obtain
 $$\begin{eqnarray}\displaystyle {\displaystyle \frac{\unicode[STIX]{x2202}U}{\unicode[STIX]{x2202}Z}} & = & \displaystyle \left(\unicode[STIX]{x1D618}_{11}{\displaystyle \frac{\unicode[STIX]{x2202}u}{\unicode[STIX]{x2202}x}}+\unicode[STIX]{x1D618}_{12}{\displaystyle \frac{\unicode[STIX]{x2202}v}{\unicode[STIX]{x2202}x}}+\unicode[STIX]{x1D618}_{13}{\displaystyle \frac{\unicode[STIX]{x2202}w}{\unicode[STIX]{x2202}x}}\right)\unicode[STIX]{x1D618}_{31}+\left(\unicode[STIX]{x1D618}_{11}{\displaystyle \frac{\unicode[STIX]{x2202}u}{\unicode[STIX]{x2202}y}}+\unicode[STIX]{x1D618}_{12}{\displaystyle \frac{\unicode[STIX]{x2202}v}{\unicode[STIX]{x2202}y}}+\unicode[STIX]{x1D618}_{13}\frac{\unicode[STIX]{x2202}w}{\unicode[STIX]{x2202}y}\right)Q_{32}\nonumber\\ \displaystyle & & \displaystyle \quad +\,\left(\unicode[STIX]{x1D618}_{11}{\displaystyle \frac{\unicode[STIX]{x2202}u}{\unicode[STIX]{x2202}z}}+\unicode[STIX]{x1D618}_{12}\frac{\unicode[STIX]{x2202}v}{\unicode[STIX]{x2202}z}+\unicode[STIX]{x1D618}_{13}\frac{\unicode[STIX]{x2202}w}{\unicode[STIX]{x2202}z}\right)Q_{33},\end{eqnarray}$$
 $$\begin{eqnarray}\displaystyle {\displaystyle \frac{\unicode[STIX]{x2202}V}{\unicode[STIX]{x2202}Z}} & = & \displaystyle \left(\unicode[STIX]{x1D618}_{21}{\displaystyle \frac{\unicode[STIX]{x2202}u}{\unicode[STIX]{x2202}x}}+\unicode[STIX]{x1D618}_{22}{\displaystyle \frac{\unicode[STIX]{x2202}v}{\unicode[STIX]{x2202}x}}+\unicode[STIX]{x1D618}_{23}{\displaystyle \frac{\unicode[STIX]{x2202}w}{\unicode[STIX]{x2202}x}}\right)\unicode[STIX]{x1D618}_{31}+\left(\unicode[STIX]{x1D618}_{21}{\displaystyle \frac{\unicode[STIX]{x2202}u}{\unicode[STIX]{x2202}y}}+\unicode[STIX]{x1D618}_{22}{\displaystyle \frac{\unicode[STIX]{x2202}v}{\unicode[STIX]{x2202}y}}+\unicode[STIX]{x1D618}_{23}{\displaystyle \frac{\unicode[STIX]{x2202}w}{\unicode[STIX]{x2202}y}}\right)Q_{32}\nonumber\\ \displaystyle & & \displaystyle \quad +\,\left(\unicode[STIX]{x1D618}_{21}\frac{\unicode[STIX]{x2202}u}{\unicode[STIX]{x2202}z}+\unicode[STIX]{x1D618}_{22}\frac{\unicode[STIX]{x2202}v}{\unicode[STIX]{x2202}z}+\unicode[STIX]{x1D618}_{23}\frac{\unicode[STIX]{x2202}w}{\unicode[STIX]{x2202}z}\right)Q_{33},\end{eqnarray}$$
where
 $\unicode[STIX]{x1D618}_{ij}$
is the element of the transformation matrix
 $\unicode[STIX]{x1D64C}$
. Substituting (2.4) into the above equations, we obtain (2.7) and (2.8) in terms of vector
 $\boldsymbol{r}$
as follows,
 $$\begin{eqnarray}\displaystyle \frac{\unicode[STIX]{x2202}U}{\unicode[STIX]{x2202}Z} & = & \displaystyle \left(1-{\displaystyle \frac{r_{x}^{2}}{1+r_{z}}}\right)\left({\displaystyle \frac{\unicode[STIX]{x2202}u}{\unicode[STIX]{x2202}x}}r_{x}+{\displaystyle \frac{\unicode[STIX]{x2202}u}{\unicode[STIX]{x2202}y}}r_{y}+\frac{\unicode[STIX]{x2202}u}{\unicode[STIX]{x2202}z}r_{z}\right)-{\displaystyle \frac{r_{x}r_{y}}{1+r_{z}}}\left(\frac{\unicode[STIX]{x2202}v}{\unicode[STIX]{x2202}x}r_{x}+\frac{\unicode[STIX]{x2202}v}{\unicode[STIX]{x2202}y}r_{y}+{\displaystyle \frac{\unicode[STIX]{x2202}v}{\unicode[STIX]{x2202}z}}r_{z}\right)\nonumber\\ \displaystyle & & \displaystyle \quad -\,r_{x}\left({\displaystyle \frac{\unicode[STIX]{x2202}w}{\unicode[STIX]{x2202}x}}r_{x}+{\displaystyle \frac{\unicode[STIX]{x2202}w}{\unicode[STIX]{x2202}y}}r_{y}+{\displaystyle \frac{\unicode[STIX]{x2202}w}{\unicode[STIX]{x2202}z}}r_{z}\right)=0,\end{eqnarray}$$
 $$\begin{eqnarray}\displaystyle \frac{\unicode[STIX]{x2202}V}{\unicode[STIX]{x2202}Z} & = & \displaystyle -\frac{r_{x}r_{y}}{1+r_{z}}\left(\frac{\unicode[STIX]{x2202}u}{\unicode[STIX]{x2202}x}r_{x}+{\displaystyle \frac{\unicode[STIX]{x2202}u}{\unicode[STIX]{x2202}y}}r_{y}+\frac{\unicode[STIX]{x2202}u}{\unicode[STIX]{x2202}z}r_{z}\right)+\left(1-{\displaystyle \frac{r_{y}^{2}}{1+r_{z}}}\right)\left(\frac{\unicode[STIX]{x2202}v}{\unicode[STIX]{x2202}x}r_{x}+{\displaystyle \frac{\unicode[STIX]{x2202}v}{\unicode[STIX]{x2202}y}}r_{y}+{\displaystyle \frac{\unicode[STIX]{x2202}v}{\unicode[STIX]{x2202}z}}r_{z}\right)\nonumber\\ \displaystyle & & \displaystyle \quad -\,r_{y}\left({\displaystyle \frac{\unicode[STIX]{x2202}w}{\unicode[STIX]{x2202}x}}r_{x}+{\displaystyle \frac{\unicode[STIX]{x2202}w}{\unicode[STIX]{x2202}y}}r_{y}+{\displaystyle \frac{\unicode[STIX]{x2202}w}{\unicode[STIX]{x2202}z}}r_{z}\right)=0.\end{eqnarray}$$
The vector form can be written
 $$\begin{eqnarray}\displaystyle & \displaystyle \frac{\unicode[STIX]{x2202}U}{\unicode[STIX]{x2202}Z}=\left(1-{\displaystyle \frac{r_{x}^{2}}{1+r_{z}}}\right)\boldsymbol{r}\boldsymbol{\cdot }\unicode[STIX]{x1D735}u-{\displaystyle \frac{r_{x}r_{y}}{1+r_{z}}}\boldsymbol{r}\boldsymbol{\cdot }\unicode[STIX]{x1D735}v-r_{x}\boldsymbol{r}\boldsymbol{\cdot }\unicode[STIX]{x1D735}w=0, & \displaystyle\end{eqnarray}$$
 $$\begin{eqnarray}\displaystyle & \displaystyle {\displaystyle \frac{\unicode[STIX]{x2202}V}{\unicode[STIX]{x2202}Z}}=-{\displaystyle \frac{r_{x}r_{y}}{1+r_{z}}}\boldsymbol{r}\boldsymbol{\cdot }\unicode[STIX]{x1D735}u+\left(1-{\displaystyle \frac{r_{y}^{2}}{1+r_{z}}}\right)\boldsymbol{r}\boldsymbol{\cdot }\unicode[STIX]{x1D735}v-r_{y}\boldsymbol{r}\boldsymbol{\cdot }\unicode[STIX]{x1D735}w=0, & \displaystyle\end{eqnarray}$$
where
 $\unicode[STIX]{x1D735}u$
,
 $\unicode[STIX]{x1D735}v$
and
 $\unicode[STIX]{x1D735}w$
are the velocity gradient of
 $u$
,
 $v$
and
 $w$
, respectively.