1. Introduction
The complex transport phenomena that occur during the solidification of multicomponent alloys have been the focus of many theoretical and experimental researches to date. The influence of multiple components on the transport phenomena manifests itself through the presence of four physical ingredients in the solidification process: (i) the differences in the initial liquid compositions of the alloy components in the melt; (ii) the differences in the rates of mass diffusion of the alloy components in the liquid and solid phases; (iii) the differences in the solutal expansion coefficients of the alloy components in the liquid phase; (iv) the differences in the segregation coefficients of the alloy components and the slopes of the liquidus surface of the equilibrium phase diagram. These differences significantly affect the dynamical interactions between heat transfer, convection and solidification in multicomponent alloys, and thus the compositional properties of the final castings (macrosegregation).
Previous studies have typically concentrated on the combined, fully coupled effects of these ingredients in the solidification process. Early numerical analyses of macrosegregation (Mehrabian & Flemings Reference Mehrabian and Flemings1970; Mehrabian, Keane & Flemings Reference Mehrabian, Keane and Flemings1970) focused on approximate solutions for the flow field in a regime dominated by expansion or contraction due to density change upon solidification (solidification shrinkage). The limitations are a prescribed temperature field and a linear solid-fraction distribution based on the Scheil equation (no solid-state diffusion) generalized to three-component systems. Fujii, Poirier & Flemings (Reference Fujii, Poirier and Flemings1979) proposed an improved physical description of the solute conservation which accounted both for species with zero solid-state diffusion and complete solid-state diffusion, including shrinkage and buoyancy-driven flow. Their thermodynamic model is based on the assumption that only the primary solid state forms. However, solidification is a dynamic process and the local compositions of alloy components are altered by the fluid flow during the evolution of the system.
More recent numerical simulations of macrosegregation in multicomponent alloys (Schneider & Beckermann Reference Schneider and Beckermann1995; Krane & Incropera Reference Krane and Incropera1997; Krane, Incropera & Gaskell Reference Krane, Incropera and Gaskell1997, Reference Krane, Incropera and Gaskell1998) are usually based on generalizations of continuum models for heat, mass, momentum and species transport in binary-alloy systems (Bennon & Incropera Reference Bennon and Incropera1987; Beckermann & Viskanta Reference Beckermann and Viskanta1993; Schneider & Beckermann Reference Schneider and Beckermann1995). These studies generally seek to provide quantitatively accurate predictions of convective patterns and macrosegregation for specific, often very complex, physical systems of interest in industry. The most qualitatively significant corollary of these studies is that while changing the number of alloy components does not significantly alter macrosegregation, the initial composition of the alloy melt and the parameters quantifying an equilibrium phase diagram, particularly the segregation coefficients and liquidus surface slopes, play a crucial role. However, systematic isolation and physical explanation of particular features of the multicomponent solidification process have yet to be given.
Laboratory experiments have identified various novel aspects of the solidification in aqueous ternary solutions, including the formation of primary and secondary mushy layers (Aitta, Huppert & Worster Reference Aitta, Huppert and Worster2001; Bloomfield & Huppert Reference Bloomfield and Huppert2003; Thompson et al. Reference Thompson, Huppert, Worster and Aitta2003). A convenient model in which to study isolated ingredients of the solidification of a ternary alloy has recently been developed by Anderson et al. (Reference Anderson, McFadden, Coriell and Murray2010). Their model includes diffusive and convective transport of heat and solutes, constrained by the requirement of thermodynamic equilibrium. As a result of the direct coupling between the temperature and the compositions of the two species through the liquidus constraint, there are no triple-diffusive effects in the primary mush of the ternary system; an essential mechanism for double-diffusive convection is, however, still allowed. They performed a linear stability analysis to assess convective instabilities in the system, focusing primarily on the modes driven by double-diffusive effects associated with the different diffusion rates of the two solutes. They identified a direct mode of instability which exists under statically stable conditions. More surprisingly, a direct mode could also exist when all fields – thermal and solutal – were individually statically stable. In the special case of vanishing latent heat, solute rejection and background solidification, they identified a simplified model for which the linear stability analysis could be worked out analytically. Investigations of this simple model showed that this exceptional, statically unexpected, mode was the result of interactions between convection, solidification and diffusion processes within the primary mushy layer. In this simplified model, this mode develops only when the diffusivities of the two solutes differ. On the other hand, from the numerical results of Anderson et al. (Reference Anderson, McFadden, Coriell and Murray2010, § 4) in a full ternary-alloy model, it is apparent that the statically unexpected direct modes can occur even in cases when the diffusivities of the two solutes are the same. Hence, the exceptional direct mode found in their full numerical model must necessarily be distinct from that described in their simple analytical model.
A further notable feature of the simple model of Anderson et al. (Reference Anderson, McFadden, Coriell and Murray2010) is that it also admits an oscillatory mode of instability which exists despite the lack of any statically stable thermal or solute field in the system, unlike the standard double-diffusive oscillatory mode in a non-reactive porous layer. The fact that this instability owes its existence to a difference in the diffusion rates of the two solutes indicates that it is still a double-diffusive instability in nature. Nevertheless, when double-diffusive effects are absent, an oscillatory instability can arise in their full model, suggesting a different mechanism from the one elucidated from their simple model.
This context provides the motivation for the present study. In view of the complexity of the full ternary-alloy mushy-layer model introduced by Anderson et al. (Reference Anderson, McFadden, Coriell and Murray2010), it would be helpful to have a simpler model which isolates other essential physical mechanisms – in particular, those associated with background solidification, solute rejection and latent-heat release – not operating in their simple analytical model, giving rise to convective instabilities of novel types. In the asymptotic limit we analyse here, such instabilities are intrinsic to an interaction between convection and solidification, and the independent nature of the two solutal fields as dictated by the disparate rates at which the two solutes are rejected upon local solidification, even in the absence of double-diffusive effects. The resulting description of the stability boundaries in the available parameter space extends and clarifies the numerical results of Anderson et al. (Reference Anderson, McFadden, Coriell and Murray2010).
The outline of the paper is as follows. In § 2 the governing equations and boundary conditions are described. In § 3 we derive the steady base-state solution and perform the linear stability calculation to derive the dispersion relation. In § 4 we examine the reduced cases in which buoyancy is present only with respect to a single agency (heat, first solute or second solute). In § 5 we discuss interpretations, followed by conclusions in § 6.
2. Formulation
2.1. A ternary phase diagram
A ternary phase diagram determines the solid and liquid phases present in local thermodynamic equilibrium at a given temperature and bulk composition. For a detailed description of ternary phase diagrams, see e.g. West (Reference West1982). Related theoretical studies on diffusion-limited (Anderson Reference Anderson2003) and convective (Anderson & Schulze Reference Anderson and Schulze2005) regimes of ternary-alloy solidification consider an idealized ternary phase diagram based on the two principal simplifications: there is complete immiscibility in the solid phase (no solid solutions form) and all liquidus surfaces are planar. Here, as in Anderson et al. (Reference Anderson, McFadden, Coriell and Murray2010), we relax the first assumption by considering a partial solid miscibility, giving rise to the formation of solid solutions rather than pure solid phases.
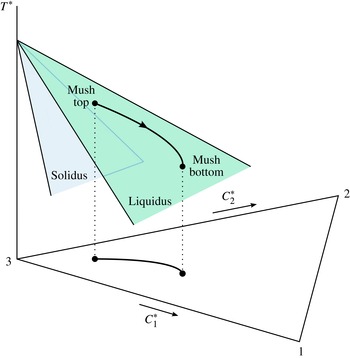
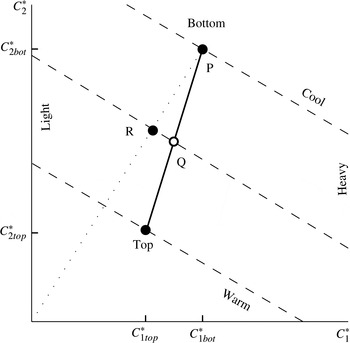
Figure 1 depicts a perspective sketch of the ternary phase diagram under consideration. We consider a ternary alloy of components 1, 2 and 3, and denote the liquid compositions of components 1, 2 and 3 by
 $C_{1}^{\ast }$
,
 $C_{2}^{\ast }$
and
 $C_{3}^{\ast }$
, noting that
 $C_{1}^{\ast }+C_{2}^{\ast }+C_{3}^{\ast }=1$
. The three corners of a compositional base of the phase diagram correspond to the pure components 1, 2 and 3 of the alloy. A portion of the phase diagram shown in figure 1 is chosen to correspond to the corner 3 of the full ternary phase diagram. We address the evolution of a ternary alloy along the liquidus surface of the phase diagram and the associated formation of a primary mushy layer. The solid phase forming the dendrites in the mushy layer is a solid solution, made up primarily of component 3 of the alloy, with components 1 and 2 incorporated; there is a partial rejection of the alloy components into the residual liquid. The solid compositions are determined by the solidus surface at a given temperature and are related to the liquid compositions by
 $k_{j}C_{j}^{\ast }$
, where
 $k_{j}$
is a constant segregation coefficient for component
 $j$
(
 $j=1,2$
). We denote the local volume fraction of the solid in the mushy layer by
 ${\it\phi}$
. We invoke an additional simplification that there is no formation of secondary and tertiary solid phases or intercrystalline compounds. The caption to figure 1 describes the features of the phase diagram in further detail.
A schematic of the ternary phase diagram. The three corners of a triangular base of the phase diagram correspond to the pure components 1, 2 and 3 of the ternary alloy. The liquidus surface and the solidus surface associated with the corner 3 are illustrated. A typical solidification path and its projection onto the base of the diagram are also depicted, indicating the phase trajectory of ternary melt as it descends along the liquidus surface. The solidification path corresponds to the formation of a primary mushy layer made up of dendrites of a component-3-rich solid phase surrounded by the residual liquid. In an ideal primary mushy layer, both the liquidus and solidus surfaces are taken to be planar.

2.2. Dimensional governing equations
The model we analyse here is that introduced by Anderson et al. (Reference Anderson, McFadden, Coriell and Murray2010). The present formulation and notation are similar to theirs. For clarity, we start with the governing equations and boundary conditions in dimensional units. We only sketch the main aspects of the model; full details are given in Anderson et al. (Reference Anderson, McFadden, Coriell and Murray2010).
We consider a two-dimensional system in which a ternary alloy is solidifying at a constant rate
 $V^{\ast }$
. There is a primary mushy layer in the region
 $0<z^{\ast }<H^{\ast }$
, where the mushy-layer thickness
 $H^{\ast }$
is assumed to be a given constant. The liquid compositions at the top of the mushy layer are
 $C_{1\mathit{top}}^{\ast }$
and
 $C_{2\mathit{top}}^{\ast }$
while those at the bottom are
 $C_{1\mathit{bot}}^{\ast }$
and
 $C_{2\mathit{bot}}^{\ast }$
, each of which is assumed constant. The temperatures at the top and bottom boundaries,
 $T_{\mathit{top}}^{\ast }$
and
 $T_{\mathit{bot}}^{\ast }$
, are then specified by a single liquidus surface of the equilibrium ternary phase diagram, which is here taken to be associated with corner 3 and also assumed to be away from any cotectic curves or eutectic points. We view the system from a frame of reference fixed to the bottom of the mush, in which the solid phase formed within the mush is moving downwards with the background solidification speed
 $V^{\ast }$
. For simplicity, the thermal properties, the specific heat and the thermal conductivity, are assumed to be the same in the solid and liquid phases.
The equations governing the primary mushy layer are the thermal balance, two solute balances, ternary liquidus constraint, Darcy’s equation and mass balance given by
 $$\begin{eqnarray}c^{\ast }\left(\frac{\partial T^{\ast }}{\partial t^{\ast }}-V^{\ast }\frac{\partial T^{\ast }}{\partial z^{\ast }}\right)+c^{\ast }\boldsymbol{u}^{\ast }\boldsymbol{\cdot }\boldsymbol{{\rm\nabla}}^{\ast }T^{\ast }=k^{\ast }{\rm\nabla}^{\ast 2}T^{\ast }+L_{v}^{\ast }\left(\frac{\partial {\it\phi}}{\partial t^{\ast }}-V^{\ast }\frac{\partial {\it\phi}}{\partial z^{\ast }}\right),\end{eqnarray}$$
 $$\begin{eqnarray}\displaystyle & & \displaystyle \displaystyle \left(1-{\it\phi}\right)\left(\frac{\partial C_{j}^{\ast }}{\partial t^{\ast }}-V^{\ast }\frac{\partial C_{j}^{\ast }}{\partial z^{\ast }}\right)+\boldsymbol{u}^{\ast }\boldsymbol{\cdot }\boldsymbol{{\rm\nabla}}^{\ast }C_{j}^{\ast }=D_{j}^{\ast }\boldsymbol{{\rm\nabla}}^{\ast }\boldsymbol{\cdot }\left[\left(1-{\it\phi}\right)\boldsymbol{{\rm\nabla}}^{\ast }C_{j}^{\ast }\right]\nonumber\\ \displaystyle & & \displaystyle \displaystyle \quad +\left(1-k_{j}\right)C_{j}^{\ast }\left(\frac{\partial {\it\phi}}{\partial t^{\ast }}-V^{\ast }\frac{\partial {\it\phi}}{\partial z^{\ast }}\right),\quad \text{for }j=1,2,\end{eqnarray}$$
 $$\begin{eqnarray}\displaystyle & \displaystyle T^{\ast }=T_{\mathit{top}}^{\ast }+m_{1}^{\ast }\left(C_{1}^{\ast }-C_{1\mathit{top}}^{\ast }\right)+m_{2}^{\ast }\left(C_{2}^{\ast }-C_{2\mathit{top}}^{\ast }\right), & \displaystyle\end{eqnarray}$$
 $$\begin{eqnarray}\displaystyle & \displaystyle \boldsymbol{u}^{\ast }=-\frac{{\it\Pi}^{\ast }\left({\it\phi}\right)}{{\it\mu}^{\ast }}\big(\boldsymbol{{\rm\nabla}}^{\ast }p^{\ast }+{\rm\Delta}{\it\rho}^{\ast }g^{\ast }\hat{\boldsymbol{k}}\big), & \displaystyle\end{eqnarray}$$
 $$\begin{eqnarray}\displaystyle & \displaystyle \boldsymbol{{\rm\nabla}}^{\ast }\boldsymbol{\cdot }\boldsymbol{u}^{\ast }=0. & \displaystyle\end{eqnarray}$$
 $T^{\ast }$
, the liquid compositions
 $C_{1}^{\ast }$
and
 $C_{2}^{\ast }$
, the solid fraction
 ${\it\phi}$
, the reduced pressure
 $p^{\ast }$
(i.e. the dynamic pressure plus a hydrostatic part,
 $p^{\ast }=p_{\mathit{dyn}}+{\it\rho}_{\mathit{top}}^{\ast }g^{\ast }z^{\ast }$
) and the Darcy velocity
 $\boldsymbol{u}^{\ast }$
. Here,
 $c^{\ast }$
is the specific heat,
 $k^{\ast }$
is the thermal conductivity,
 $L_{v}^{\ast }$
is the latent heat per unit volume,
 $D_{j}^{\ast }$
is the solutal diffusivity in the liquid for species
 $j$
,
 $k_{j}$
is the segregation coefficient for species
 $j$
,
 $m_{j}^{\ast }$
are the liquidus surface slopes,
 ${\it\Pi}^{\ast }({\it\phi})$
is the permeability of the mushy layer,
 ${\it\mu}^{\ast }$
is the fluid dynamic viscosity,
 $g^{\ast }$
is the gravitational acceleration and
 $\hat{\boldsymbol{k}}$
is the upward unit vector.
Convective motions in the mush are driven by a density differential
 ${\rm\Delta}{\it\rho}^{\ast }={\it\rho}^{\ast }-{\it\rho}_{\mathit{top}}^{\ast }$
in (2.1d
), with the density assumed to be linearly related to the temperature and compositions,
 $$\begin{eqnarray}{\it\rho}^{\ast }={\it\rho}_{\mathit{top}}^{\ast }\left[1-{\it\alpha}^{\ast }\left(T^{\ast }-T_{\mathit{top}}^{\ast }\right)-{\it\alpha}_{1}^{\ast }\left(C_{1}^{\ast }-C_{1\mathit{top}}^{\ast }\right)-{\it\alpha}_{2}^{\ast }\left(C_{2}^{\ast }-C_{2\mathit{top}}^{\ast }\right)\right],\end{eqnarray}$$
where
 ${\it\alpha}^{\ast }$
and
 ${\it\alpha}_{j}^{\ast }$
(
 $j=1,2$
) are the thermal and compositional expansion coefficients, respectively. It should be noted that, since the variables
 $T^{\ast }$
,
 $C_{1}^{\ast }$
and
 $C_{2}^{\ast }$
are related by the ternary liquidus constraint (2.1c
), we could eliminate either of
 $T^{\ast }$
,
 $C_{1}^{\ast }$
or
 $C_{2}^{\ast }$
from direct consideration.
These equations are subject to the following boundary conditions:
 $$\begin{eqnarray}C_{1}^{\ast }=C_{1\mathit{top}}^{\ast },\quad C_{2}^{\ast }=C_{2\mathit{top}}^{\ast },\quad {\it\phi}={\it\phi}_{0},\quad \boldsymbol{u}^{\ast }\boldsymbol{\cdot }\hat{\boldsymbol{k}}=0\quad \text{at }z^{\ast }=H^{\ast },\end{eqnarray}$$
 $$\begin{eqnarray}C_{1}^{\ast }=C_{1\mathit{bot}}^{\ast },\quad C_{2}^{\ast }=C_{2\mathit{bot}}^{\ast },\quad \boldsymbol{u}^{\ast }\boldsymbol{\cdot }\hat{\boldsymbol{k}}=0\quad \text{at }z^{\ast }=0,\end{eqnarray}$$
where
 $C_{jtop}^{\ast }$
,
 $C_{jbot}^{\ast }$
(
 $j=1,2$
) and
 ${\it\phi}_{0}$
are prescribed constants. It should be noted that, in light of (2.1c
), the temperature is automatically
 $T_{\mathit{top}}^{\ast }$
at the mush top, while the temperature at the mush bottom attains a dependent value
 $T_{\mathit{bot}}^{\ast }=T_{\mathit{top}}^{\ast }+m_{1}^{\ast }\left(C_{1\mathit{bot}}^{\ast }-C_{1\mathit{top}}^{\ast }\right)+m_{2}^{\ast }\left(C_{2\mathit{bot}}^{\ast }-C_{2\mathit{top}}^{\ast }\right)$
. Thus, the boundary conditions (2.3) and (2.4) are sufficient. As described in Anderson et al. (Reference Anderson, McFadden, Coriell and Murray2010), these boundary conditions effectively decouple the primary mushy layer from the dynamics of any adjacent layers (an overlying liquid layer, an underlying secondary mushy layer or a eutectic solid layer), thus simplifying the mathematical analysis of the essential interactions internal to the primary mushy layer.
2.3. Dimensionless governing equations
Here we recast the equations governing the primary mush in dimensionless form. In the present analysis, we adopt a different scheme of non-dimensionalization from that in Anderson et al. (Reference Anderson, McFadden, Coriell and Murray2010). Specifically, we define a dimensionless temperature
 $T$
and compositions
 $C_{j}$
,
 $$\begin{eqnarray}T=\frac{T^{\ast }-T_{\mathit{top}}^{\ast }}{{\rm\Delta}T^{\ast }},\quad C_{j}=\frac{C_{j}^{\ast }-C_{jtop}^{\ast }}{{\rm\Delta}C_{j}^{\ast }},\end{eqnarray}$$
where
 ${\rm\Delta}T^{\ast }=T_{\mathit{top}}^{\ast }-T_{\mathit{bot}}^{\ast }$
and
 ${\rm\Delta}C_{j}^{\ast }=C_{jtop}^{\ast }-C_{jbot}^{\ast }$
(
 $j=1,2$
). The velocity is non-dimensionalized using
 $V^{\ast }$
, space and time by the thermal diffusion length and time
 ${\it\kappa}^{\ast }/V^{\ast }$
and
 ${\it\kappa}^{\ast }/V^{\ast 2}$
, respectively, where
 ${\it\kappa}^{\ast }=k^{\ast }/c^{\ast }$
is the thermal diffusivity, the reduced pressure by the factor
 ${\it\mu}^{\ast }{\it\kappa}^{\ast }/{\it\Pi}^{\ast }\left({\it\phi}_{0}\right)$
, where
 ${\it\Pi}^{\ast }\left({\it\phi}_{0}\right)$
is a permeability scale, and the density differential by the scale
 ${\it\mu}^{\ast }V^{\ast }/\left(g^{\ast }{\it\Pi}^{\ast }\left({\it\phi}_{0}\right)\right)$
. The dimensionless form of the governing equations is then
 $$\begin{eqnarray}\displaystyle & \displaystyle \left(\frac{\partial }{\partial t}-\frac{\partial }{\partial z}\right)T+\boldsymbol{u}\boldsymbol{\cdot }\boldsymbol{{\rm\nabla}}T={\rm\nabla}^{2}T+S\left(\frac{\partial }{\partial t}-\frac{\partial }{\partial z}\right){\it\phi}, & \displaystyle\end{eqnarray}$$
 $$\begin{eqnarray}\displaystyle & \displaystyle (1-{\it\phi})\left(\frac{\partial }{\partial t}-\frac{\partial }{\partial z}\right)C_{j}+\boldsymbol{u}\boldsymbol{\cdot }\boldsymbol{{\rm\nabla}}C_{j}\hspace{230.39996pt} & \displaystyle \nonumber\\ \displaystyle & \displaystyle =\frac{1}{\mathit{Le}_{j}}\boldsymbol{{\rm\nabla}}\boldsymbol{\cdot }[(1-{\it\phi})\boldsymbol{{\rm\nabla}}C_{j}]+(1-k_{j})(1+C_{j}^{bot}+C_{j})\!\left(\frac{\partial }{\partial t}-\frac{\partial }{\partial z}\right)\!{\it\phi},\quad \text{for }j=1,2,\qquad & \displaystyle\end{eqnarray}$$
 $$\begin{eqnarray}\displaystyle & \displaystyle T=m_{1}C_{1}+m_{2}C_{2}, & \displaystyle\end{eqnarray}$$
 $$\begin{eqnarray}\displaystyle & \displaystyle K({\it\phi})\boldsymbol{u}=-\boldsymbol{{\rm\nabla}}p-{\rm\Delta}{\it\rho}\,\hat{\boldsymbol{k}}, & \displaystyle\end{eqnarray}$$
 $$\begin{eqnarray}\displaystyle & \displaystyle \boldsymbol{{\rm\nabla}}\boldsymbol{\cdot }\boldsymbol{u}=0, & \displaystyle\end{eqnarray}$$
 $K({\it\phi})={\it\Pi}^{\ast }({\it\phi}_{0})/{\it\Pi}^{\ast }({\it\phi})$
is a resistance function, and the dimensionless density differential
 $$\begin{eqnarray}{\rm\Delta}{\it\rho}=-RaT-Ra_{1}C_{1}-Ra_{2}C_{2}.\end{eqnarray}$$
The dimensionless parameters appearing in these equations are the Stefan number
 $S$
, the Lewis numbers
 $\mathit{Le}_{j}$
, the concentration ratios
 $C_{j}^{bot}$
, the liquidus surface slopes
 $m_{j}$
, the thermal Rayleigh number
 $Ra$
and the compositional Rayleigh numbers
 $Ra_{j}$
, defined by
 $$\begin{eqnarray}S=\frac{L_{v}^{\ast }}{c^{\ast }{\rm\Delta}T^{\ast }},\quad \mathit{Le}_{j}=\frac{{\it\kappa}^{\ast }}{D_{j}^{\ast }},\quad C_{j}^{bot}=\frac{C_{jbot}^{\ast }}{{\rm\Delta}C_{j}^{\ast }},\quad m_{j}=\frac{m_{j}^{\ast }{\rm\Delta}C_{j}^{\ast }}{{\rm\Delta}T^{\ast }},\end{eqnarray}$$
 $$\begin{eqnarray}Ra=\frac{{\it\rho}_{\mathit{top}}^{\ast }{\it\alpha}^{\ast }{\rm\Delta}T^{\ast }g^{\ast }{\it\Pi}^{\ast }({\it\phi}_{0})}{{\it\mu}^{\ast }V^{\ast }},\quad Ra_{j}=\frac{{\it\rho}_{\mathit{top}}^{\ast }{\it\alpha}_{j}^{\ast }{\rm\Delta}C_{j}^{\ast }g^{\ast }{\it\Pi}^{\ast }({\it\phi}_{0})}{{\it\mu}^{\ast }V^{\ast }},\end{eqnarray}$$
for
 $j=1,2$
. It should be noted that, from the liquidus constraint (2.1c
) considered at the bottom of the mush, the slopes
 $m_{1}$
and
 $m_{2}$
are not independent but are related by
 $m_{1}+m_{2}=1$
.
Equations (2.6) are subject to the boundary conditions
 $$\begin{eqnarray}C_{1}=0,\quad C_{2}=0,\quad {\it\phi}={\it\phi}_{0},\quad \boldsymbol{u}\boldsymbol{\cdot }\hat{\boldsymbol{k}}=0\quad \text{at }z={\it\delta},\end{eqnarray}$$
 $$\begin{eqnarray}C_{1}=-1,\quad C_{2}=-1,\quad \boldsymbol{u}\boldsymbol{\cdot }\hat{\boldsymbol{k}}=0\quad \text{at }z=0.\end{eqnarray}$$
Conditions (2.10) contain one additional parameter: the dimensionless thickness of the mushy layer, defined by
 $$\begin{eqnarray}{\it\delta}=\frac{H^{\ast }}{{\it\kappa}^{\ast }/V^{\ast }}.\end{eqnarray}$$
It should be noted that the parameter
 ${\it\delta}$
can also be considered as a scaled pulling speed (denoted as
 $V$
in Anderson et al.
Reference Anderson, McFadden, Coriell and Murray2010; see their equation (2.8a)).
In (2.7) we eliminate
 $T$
in favour of
 $C_{1}$
and
 $C_{2}$
so that
 $$\begin{eqnarray}{\rm\Delta}{\it\rho}=-Ra_{C1}C_{1}-Ra_{C2}C_{2},\end{eqnarray}$$
depending only on the two effective compositional Rayleigh numbers
 $$\begin{eqnarray}Ra_{Cj}=m_{j}Ra+Ra_{j},\quad \text{for }j=1,2.\end{eqnarray}$$
It should be noted that
 $Ra_{C1}+Ra_{C2}=Ra+Ra_{1}+Ra_{2}$
.
Formulation of the problem is completed by a choice of the function
 $K({\it\phi})$
. We discuss this choice in § 3.2.
2.4. Rescaling
The model is reduced asymptotically by restricting the primary mush thickness to be thin by letting
 ${\it\delta}\ll 1$
. This means that the dimensional mush thickness is much less than the thermal diffusive length; equivalently, the dimensional pulling speed is much smaller than the rate of heat transfer across the layer by thermal conduction.
The particular physical effect that gave rise to convective instabilities in the Anderson et al. (Reference Anderson, McFadden, Coriell and Murray2010) simple-model analysis was that associated with the phase change influence on the net solute balance through solute diffusion. Here, in addition to all the diffusive processes, we wish to isolate a variety of other phase change effects, in particular the rejection of two solutes and the release of latent heat, at dominant order in the limit of small
 ${\it\delta}$
. These physical effects underpin the rescalings to follow.
We consider the limits where
 $C_{j}^{bot}$
and
 $S$
are large by writing
 $$\begin{eqnarray}C_{j}^{bot}=\frac{\bar{C}_{j}^{bot}}{{\it\delta}^{2}},\quad S=\frac{\bar{S}}{{\it\delta}^{2}},\end{eqnarray}$$
where
 $\bar{C}_{j}^{bot}$
and
 $\bar{S}$
are
 $O(1)$
as
 ${\it\delta}\rightarrow 0$
, for
 $j=1,2$
. Physically, the scaling for
 $C_{j}^{bot}$
corresponds to relatively weak compositional variations in the two solute components across the mush, and enables the dynamics of the system to take place away from binary sides of the ternary phase diagram. The scaling for
 $S$
assumes that the latent heat released on local phase change is much greater than the heat associated with the mush temperature drop. We note in passing that a regime where
 $C_{j}^{bot}$
and
 $S$
are
 $O(1/{\it\delta})$
, in analogy to binary mushy-layer systems with no solute diffusion (Anderson & Worster Reference Anderson and Worster1995, Reference Anderson and Worster1996), turns out to be inappropriate when solute diffusion is included; this is discussed further in the final paragraph of appendix B.
Next, we rescale space and time, and introduce new scaled Rayleigh numbers as
 $$\begin{eqnarray}(x,z)={\it\delta}(\bar{x},\bar{z}),\quad t={\it\delta}^{2}\bar{t},\end{eqnarray}$$
 $$\begin{eqnarray}Ra=\frac{1}{{\it\delta}}\overline{Ra},\quad Ra_{j}=\frac{1}{{\it\delta}}\overline{Ra}_{j},\end{eqnarray}$$
for
 $j=1,2$
, where all the barred quantities are assumed fixed, of
 $O(1)$
, as
 ${\it\delta}\rightarrow 0$
. We shall have occasion below to interpret the stability results in terms of the effective Rayleigh numbers and hence conveniently define also their scaled versions by
 $\overline{Ra}_{Cj}=m_{j}\overline{Ra}+\overline{Ra}_{j}$
for
 $j=1,2$
(cf. (2.14)). It should be noted that, as implied by (2.17), the scaled Rayleigh numbers
 $\overline{Ra}$
,
 $\overline{Ra}_{1}$
and
 $\overline{Ra}_{2}$
are based on the thermal diffusive length scale, rather than the actual mush thickness employed in the original definitions (2.9). Hence
 $\overline{Ra}$
,
 $\overline{Ra}_{1}$
and
 $\overline{Ra}_{2}$
in our analysis are identical to
 $Ra$
,
 $Ra_{1}$
and
 $Ra_{2}$
in Anderson et al. (Reference Anderson, McFadden, Coriell and Murray2010).
3. Linear stability analysis
To examine the linear stability properties of the present ternary mush system, we separate the dependent quantities into a non-convecting base-state portion, denoted by a tilde, and a normal-mode perturbation of infinitesimal amplitude, measured by a small parameter
 ${\it\epsilon}$
, by writing
 $$\begin{eqnarray}\displaystyle & \displaystyle T=\tilde{T}(\bar{z}\,)+{\it\epsilon}\hat{T}(\bar{z}\,)\text{e}^{{\it\sigma}\bar{t}+\text{i}k\bar{x}}+\text{c.c.}, & \displaystyle\end{eqnarray}$$
 $$\begin{eqnarray}\displaystyle & \displaystyle C_{j}=\tilde{C}_{j}(\bar{z}\,)+{\it\epsilon}{\hat{C}}_{j}(\bar{z}\,)\text{e}^{{\it\sigma}\bar{t}+\text{i}k\bar{x}}+\text{c.c.}, & \displaystyle\end{eqnarray}$$
 $$\begin{eqnarray}\displaystyle & \displaystyle {\it\phi}=\tilde{{\it\phi}}(\bar{z}\,)+{\it\epsilon}{\it\delta}\hat{{\it\phi}}(\bar{z}\,)\text{e}^{{\it\sigma}\bar{t}+\text{i}k\bar{x}}+\text{c.c.}, & \displaystyle\end{eqnarray}$$
 $$\begin{eqnarray}\displaystyle & \displaystyle \boldsymbol{u}=\mathbf{0}+{\it\epsilon}\frac{1}{{\it\delta}}\hat{\boldsymbol{u}}(\bar{z}\,)\text{e}^{{\it\sigma}\bar{t}+\text{i}k\bar{x}}+\text{c.c.}, & \displaystyle\end{eqnarray}$$
 $$\begin{eqnarray}\displaystyle & \displaystyle p=\tilde{p}(\bar{z}\,)+{\it\epsilon}\hat{p}(\bar{z}\,)\text{e}^{{\it\sigma}\bar{t}+\text{i}k\bar{x}}+\text{c.c.}, & \displaystyle\end{eqnarray}$$
 $\hat{\boldsymbol{u}}=\left[{\hat{u}}(\bar{z}\,),0,{\hat{w}}(\bar{z}\,)\right]$
,
 ${\it\sigma}={\it\sigma}_{R}+\text{i}{\it\sigma}_{I}$
is a complex growth rate expressed in terms of its real and imaginary parts, and
 $k$
is a horizontal wavenumber. The scaling introduced in (3.1c
) ensures decoupling of
 $\hat{{\it\phi}}$
from the other disturbance fields at dominant order; see § 3.2 below. It should be noted that, in contrast to related analyses by Amberg & Homsy (Reference Amberg and Homsy1993) and Anderson & Worster (Reference Anderson and Worster1995, Reference Anderson and Worster1996) for a binary mush problem, we do not introduce an additional scaling on
 $\boldsymbol{u}$
and
 $p$
that involves any of the scaled Rayleigh numbers (2.17).
3.1. Steady non-convecting solution
Here, we present an asymptotic solution for the non-convecting mushy layer. This base-state solution is steady, horizontally uniform and satisfies
 $$\begin{eqnarray}-{\it\delta}\frac{\text{d}}{\text{d}\bar{z}}\left(\tilde{T}-\frac{1}{{\it\delta}^{2}}\bar{S}\tilde{{\it\phi}}\right)=\frac{\text{d}^{2}\tilde{T}}{\text{d}\bar{z}^{2}},\end{eqnarray}$$
 $$\begin{eqnarray}\displaystyle -{\it\delta}\big(1-\tilde{{\it\phi}}\big)\frac{\text{d}\tilde{C}_{j}}{\text{d}\bar{z}} & = & \displaystyle \frac{1}{\mathit{Le}_{j}}\frac{\text{d}}{\text{d}\bar{z}}\left[\big(1-\tilde{{\it\phi}}\big)\frac{\text{d}\tilde{C}_{j}}{\text{d}\bar{z}}\right]\nonumber\\ \displaystyle & & \displaystyle -\,{\it\delta}(1-k_{j})\left(1+\frac{1}{{\it\delta}^{2}}\bar{C}_{j}^{bot}+\tilde{C}_{j}\right)\frac{\text{d}\tilde{{\it\phi}}}{\text{d}\bar{z}},\quad \text{for }j=1,2,\end{eqnarray}$$
 $$\begin{eqnarray}\tilde{T}=m_{1}\tilde{C}_{1}+m_{2}\tilde{C}_{2},\end{eqnarray}$$
 $$\begin{eqnarray}\tilde{C}_{1}=0,\quad \tilde{C}_{2}=0,\quad \tilde{{\it\phi}}={\it\phi}_{0}\quad \text{at }\bar{z}=1,\end{eqnarray}$$
 $$\begin{eqnarray}\tilde{C}_{1}=-1,\quad \tilde{C}_{2}=-1\quad \text{at }\bar{z}=0.\end{eqnarray}$$
An equation for
 $\tilde{p}$
will not be needed explicitly.
We solve these equations asymptotically in terms of regular expansions in powers of
 ${\it\delta}$
, namely
 $$\begin{eqnarray}\tilde{T}=\tilde{T}^{0}+{\it\delta}\,\tilde{T}^{1}+\cdots \,,\end{eqnarray}$$
and similarly for other base-state quantities
 $\tilde{C}_{1}$
,
 $\tilde{C}_{2}$
and
 $\tilde{{\it\phi}}$
. The solution is
 $$\begin{eqnarray}\displaystyle & \displaystyle \tilde{T}=-\left(1-\bar{z}\right)+{\it\delta}{\textstyle \frac{1}{2}}{\it\Omega}\bar{z}\left(1-\bar{z}\right)+\cdots \,, & \displaystyle\end{eqnarray}$$
 $$\begin{eqnarray}\displaystyle & \displaystyle \tilde{C}_{j}=-\left(1-\bar{z}\right)+{\it\delta}{\textstyle \frac{1}{2}}{\it\Omega}_{j}\bar{z}\left(1-\bar{z}\right)+\cdots \,, & \displaystyle\end{eqnarray}$$
 $$\begin{eqnarray}\displaystyle & \displaystyle \tilde{{\it\phi}}={\it\phi}_{0}-{\it\delta}^{2}\frac{1}{{\it\Gamma}}\left(1-\bar{z}\right)+\cdots \,, & \displaystyle\end{eqnarray}$$
 $$\begin{eqnarray}{\it\Omega}=1-\frac{\bar{S}}{{\it\Gamma}},\quad {\it\Omega}_{j}=1-\frac{{\it\Gamma}_{j}}{{\it\Gamma}},\end{eqnarray}$$
for
 $j=1,2$
, with
 $$\begin{eqnarray}\displaystyle & \displaystyle {\it\Gamma}=-\frac{m_{1}\mathit{Le}_{1}\mathscr{C}_{1}+m_{2}\mathit{Le}_{2}\mathscr{C}_{2}-(1-{\it\phi}_{0})\bar{S}}{(1-{\it\phi}_{0})(1-m_{1}\mathit{Le}_{1}-m_{2}\mathit{Le}_{2})}, & \displaystyle\end{eqnarray}$$
 $$\begin{eqnarray}\displaystyle & \displaystyle {\it\Gamma}_{1}=\frac{(1-\mathit{Le}_{1})(1-{\it\phi}_{0})\bar{S}+m_{2}[\mathit{Le}_{1}\mathscr{C}_{1}-\mathit{Le}_{2}\mathscr{C}_{2}+\mathit{Le}_{1}\mathit{Le}_{2}(\mathscr{C}_{2}-\mathscr{C}_{1})]}{(1-{\it\phi}_{0})(1-m_{1}\mathit{Le}_{1}-m_{2}\mathit{Le}_{2})}, & \displaystyle\end{eqnarray}$$
 $$\begin{eqnarray}\displaystyle & \displaystyle {\it\Gamma}_{2}=\frac{(1-\mathit{Le}_{2})(1-{\it\phi}_{0})\bar{S}+m_{1}[\mathit{Le}_{2}\mathscr{C}_{2}-\mathit{Le}_{1}\mathscr{C}_{1}+\mathit{Le}_{1}\mathit{Le}_{2}(\mathscr{C}_{1}-\mathscr{C}_{2})]}{(1-{\it\phi}_{0})(1-m_{1}\mathit{Le}_{1}-m_{2}\mathit{Le}_{2})}. & \displaystyle\end{eqnarray}$$
 $k_{j}$
appear only in association with the compositional ratios
 $\bar{C}_{j}^{bot}$
as
 $\mathscr{C}_{j}\equiv (1-k_{j})\bar{C}_{j}^{bot}$
. The assumptions
 $C_{j}^{bot}=O(1/{\it\delta}^{2})$
and
 $S=O(1/{\it\delta}^{2})$
as
 ${\it\delta}\rightarrow 0$
lead to a constant base-state solid fraction at leading order, equal to
 ${\it\phi}_{0}$
as implied by (3.3c
). As
 ${\it\delta}\rightarrow 0$
, the base-state solution is identical to that of Anderson et al. (Reference Anderson, McFadden, Coriell and Murray2010) in their simplified ternary mushy-layer model. Correct to
 $O({\it\delta}^{1})$
, the form of (3.6) shows that
 $\tilde{T}$
,
 $\tilde{C}_{1}$
and
 $\tilde{C}_{2}$
depend on the parameters only through the
 $O(1)$
combination groups
 ${\it\Omega}$
,
 ${\it\Omega}_{1}$
and
 ${\it\Omega}_{2}$
, measuring curvature in the respective base-state profiles. For the typical conditions that require
 $\mathit{Le}_{j}>1$
,
 $\bar{S}>0$
and
 $\mathscr{C}_{j}<0$
, we find that
 ${\it\Omega}$
is always positive, while
 ${\it\Omega}_{j}$
can take either sign. From (3.2c
) we find that the base-state curvatures are related by
 ${\it\Omega}=m_{1}{\it\Omega}_{1}+m_{2}{\it\Omega}_{2}$
, indicating that
 ${\it\Omega}_{1}$
and
 ${\it\Omega}_{2}$
cannot be simultaneously negative. The parameters
 ${\it\Omega}$
and
 ${\it\Omega}_{j}$
play a prominent role in the stability analysis, as will emerge later. It should also be noted that the parameter combination
 ${\it\Gamma}$
in (3.6c
) is negative, implying that
 $\tilde{{\it\phi}}$
decreases with height. The higher-order corrections to the base-state solution will not be needed in the analysis.
3.2. Linearized disturbance equations
The linearized equations governing the perturbation amplitudes are
 $$\begin{eqnarray}\left({\it\sigma}-{\it\delta}\text{D}\right)\left(\hat{T}-\frac{1}{{\it\delta}}\bar{S}\hat{{\it\phi}}\right)+{\hat{w}}\,\text{D}\tilde{T}=\left(\text{D}^{2}-k^{2}\right)\hat{T},\end{eqnarray}$$
 $$\begin{eqnarray}\displaystyle & & \displaystyle \displaystyle \big(1-\tilde{{\it\phi}}\big)\left({\it\sigma}-{\it\delta}\text{D}\right){\hat{C}}_{j}+{\it\delta}^{2}\hat{{\it\phi}}\,\text{D}\tilde{C}_{j}+{\hat{w}}\,\text{D}\tilde{C}_{j}\nonumber\\ \displaystyle & & \displaystyle \displaystyle \quad =\frac{1}{\mathit{Le}_{j}}\left\{\text{D}\big[\big(1-\tilde{{\it\phi}}\big)\text{D}{\hat{C}}_{j}\big]-{\it\delta}\text{D}\big(\hat{{\it\phi}}\,\text{D}\tilde{C}_{j}\big)-k^{2}\big(1-\tilde{{\it\phi}}\big){\hat{C}}_{j}\right\}\nonumber\\ \displaystyle & & \displaystyle \displaystyle \qquad +\left(1-k_{j}\right)\left[{\it\delta}\left(1+\frac{1}{{\it\delta}^{2}}\bar{C}_{j}^{bot}+\tilde{C}_{j}\right)\left({\it\sigma}-{\it\delta}\text{D}\right)\hat{{\it\phi}}-{\it\delta}{\hat{C}}_{j}\,\text{D}\tilde{{\it\phi}}\right],\end{eqnarray}$$
 $$\begin{eqnarray}\displaystyle & \displaystyle \left(\text{D}^{2}-k^{2}\right)\big[K\big(\tilde{{\it\phi}}\big){\hat{w}}\big]+k^{2}\big(\overline{Ra}\hat{T}+\overline{Ra}_{1}{\hat{C}}_{1}+\overline{Ra}_{2}{\hat{C}}_{2}\big)=\text{D}\big[{\hat{w}}\,\text{D}\big[K\big(\tilde{{\it\phi}}\big)\big]\big], & \displaystyle\end{eqnarray}$$
 $$\begin{eqnarray}\displaystyle & \displaystyle \hat{T}=m_{1}{\hat{C}}_{1}+m_{2}{\hat{C}}_{2}, & \displaystyle\end{eqnarray}$$
 $$\begin{eqnarray}{\hat{C}}_{1}=0,\quad {\hat{C}}_{2}=0,\quad \hat{{\it\phi}}=0,\quad {\hat{w}}=0\quad \text{at }\bar{z}=1,\end{eqnarray}$$
 $$\begin{eqnarray}{\hat{C}}_{1}=0,\quad {\hat{C}}_{2}=0,\quad {\hat{w}}=0\quad \text{at }\bar{z}=0,\end{eqnarray}$$
where
 $\text{D}\equiv \text{d}/\text{d}\bar{z}$
. In writing (3.9), we have eliminated
 $\hat{p}$
and
 ${\hat{u}}$
from direct consideration. It should be noted that, without loss of generality, we may consider two-dimensional disturbances in this linear theory.
Equations (3.9) and boundary conditions (3.10) and (3.11) define a seventh-order non-self-adjoint eigenvalue problem for the growth rate
 ${\it\sigma}$
. Asymptotic solutions are sought in the form
 $$\begin{eqnarray}\displaystyle & \displaystyle {\it\sigma}={\it\sigma}^{0}+{\it\delta}{\it\sigma}^{1}+\cdots \,, & \displaystyle\end{eqnarray}$$
 $$\begin{eqnarray}\displaystyle & \displaystyle \overline{Ra}=\mathit{Ra}^{0}+{\it\delta}\mathit{Ra}^{1}+\cdots \,, & \displaystyle\end{eqnarray}$$
 $$\begin{eqnarray}\displaystyle & \displaystyle \overline{Ra}_{j}=\mathit{Ra}_{j}^{0}+{\it\delta}\mathit{Ra}_{j}^{1}+\cdots \,, & \displaystyle\end{eqnarray}$$
 $$\begin{eqnarray}\displaystyle & \displaystyle \hat{T}=T^{0}+{\it\delta}T^{1}+\cdots \,, & \displaystyle\end{eqnarray}$$
 $$\begin{eqnarray}\displaystyle & \displaystyle {\hat{C}}_{j}=C_{j}^{0}+{\it\delta}C_{j}^{1}+\cdots \,, & \displaystyle\end{eqnarray}$$
 $$\begin{eqnarray}\displaystyle & \displaystyle \hat{{\it\phi}}={\it\phi}^{0}+{\it\delta}{\it\phi}^{1}+\cdots \,, & \displaystyle\end{eqnarray}$$
 $$\begin{eqnarray}\displaystyle & \displaystyle {\hat{w}}=w^{0}+{\it\delta}w^{1}+\cdots \,. & \displaystyle\end{eqnarray}$$
 $K(\tilde{{\it\phi}})$
has a Taylor series about
 ${\it\phi}_{0}$
for
 ${\it\delta}\ll 1$
. Noting that
 $\tilde{{\it\phi}}$
has no correction at
 $O({\it\delta}^{1})$
(see (3.6c
)), we take
 $$\begin{eqnarray}K(\tilde{{\it\phi}})=1+{\it\delta}^{2}K_{1}\tilde{{\it\phi}}^{2}+\cdots \,,\end{eqnarray}$$
where
 $K_{1}$
measures the linear permeability variations with base-state solid fraction. Here, we desire this particular physical effect to be captured at
 $O({\it\delta}^{1})$
in our analysis, and so assume that
 $K_{1}$
is large, namely
 $$\begin{eqnarray}K_{1}=\frac{1}{{\it\delta}}\bar{K}_{1},\end{eqnarray}$$
where
 $\bar{K}_{1}=O(1)$
as
 ${\it\delta}\rightarrow 0$
. We also require that
 $\bar{K}_{1}$
is positive so that the permeability decreases with increasing solid fraction.
In a binary-alloy mushy-layer model of Anderson & Worster (Reference Anderson and Worster1995, Reference Anderson and Worster1996) with solute diffusion neglected, the limit appropriate to a thin mushy layer has been shown to effectively reduce the system to one of a non-reactive porous layer with uniform permeability; the physical effects intrinsic to the binary-alloy mushy layer have only appeared as higher-order corrections. In the present ternary-alloy mushy-layer model with finite solute diffusion, in contrast, we find that the leading-order description of the system differs in a variety of ways from the classical (double-diffusive) convection in a non-reactive porous layer, although the leading-order permeability is still uniform (see (3.13)). Specifically, the present system is inherently reactive already at leading order, with the local phase change altering both the heat and solute balances through the physical effects associated with the release of latent heat and the rejection of solutes during local solidification. In § 5, these physical effects are considered further and a formal link with the model of Anderson et al. (Reference Anderson, McFadden, Coriell and Murray2010) is established.
The first equations arise at
 $O(1/{\it\delta})$
from the heat balance and the two solute balances
 $$\begin{eqnarray}\displaystyle & -{\it\sigma}^{0}\bar{S}{\it\phi}^{0}=0, & \displaystyle\end{eqnarray}$$
 $$\begin{eqnarray}\displaystyle & 0={\it\sigma}^{0}\mathscr{C}_{j}{\it\phi}^{0},\quad \text{for }j=1,2. & \displaystyle\end{eqnarray}$$
 ${\it\sigma}^{0}=0$
. This result suggests that disturbances grow or oscillate on a new dynamical time scale, of
 $O({\it\delta}^{1})$
, rather than the
 $O({\it\delta}^{2})$
time scale implied by the initial rescaling (2.16b
). In dimensional terms, the instabilities emerging here act on a slow ‘directional solidification’ time scale
 ${\it\tau}_{V^{\ast }}^{\ast }=H^{\ast }/V^{\ast }$
, while those studied by Anderson et al. (Reference Anderson, McFadden, Coriell and Murray2010) act on the fast thermal diffusion time scale
 ${\it\tau}_{{\it\kappa}^{\ast }}^{\ast }=H^{\ast 2}/{\it\kappa}^{\ast }$
, noting that
 ${\it\tau}_{{\it\kappa}^{\ast }}^{\ast }/{\it\tau}_{V^{\ast }}^{\ast }={\it\delta}\ll 1$
.
We proceed to equations at
 $O({\it\delta}^{0})$
. We eliminate
 $\hat{T}$
in favour of
 ${\hat{C}}_{1}$
and
 ${\hat{C}}_{2}$
from (3.9a,c
) using (3.9d
), use the heat balance thus obtained to eliminate the terms involving
 $\hat{{\it\phi}}$
in the two solute balances (3.9b
), and combine the resulting solute balances to yield a reduced system
 $$\begin{eqnarray}\displaystyle & \displaystyle \left(\text{D}-{\it\sigma}^{1}\right){\it\phi}^{0}+\frac{1}{{\it\Gamma}\hat{{\it\Gamma}}}w^{0}=0, & \displaystyle\end{eqnarray}$$
 $$\begin{eqnarray}\displaystyle & \displaystyle \left(\text{D}^{2}-k^{2}\right)C_{j}^{0}-\frac{{\it\Omega}_{j}+\hat{{\it\Omega}}_{j}}{1-{\it\phi}_{0}}w^{0}=0,\quad \text{for }j=1,2, & \displaystyle\end{eqnarray}$$
 $$\begin{eqnarray}\displaystyle & \displaystyle \left(\text{D}^{2}-k^{2}\right)w^{0}+k^{2}\big(\mathit{Ra}_{C1}^{0}C_{1}^{0}+\mathit{Ra}_{C2}^{0}C_{2}^{0}\big)=0, & \displaystyle\end{eqnarray}$$
 $C_{1}^{0}=C_{2}^{0}={\it\phi}^{0}=w^{0}=0$
at
 $\bar{z}=1$
and
 $C_{1}^{0}=C_{2}^{0}=w^{0}=0$
at
 $\bar{z}=0$
. Here,
 $\mathit{Ra}_{Cj}^{0}=m_{j}Ra^{0}+Ra_{j}^{0}$
,
 ${\it\Omega}_{j}$
and
 ${\it\Gamma}$
are given by (3.7b
) and (3.8), and
 $$\begin{eqnarray}\displaystyle & \displaystyle \hat{{\it\Omega}}_{j}=-\frac{{\it\phi}_{0}\mathit{Le}_{j}\mathscr{C}_{j}}{m_{1}\mathit{Le}_{1}\mathscr{C}_{1}+m_{2}\mathit{Le}_{2}\mathscr{C}_{2}-\left(1-{\it\phi}_{0}\right)\bar{S}},\quad \text{for }j=1,2, & \displaystyle\end{eqnarray}$$
 $$\begin{eqnarray}\displaystyle & \displaystyle \hat{{\it\Gamma}}=\frac{\left(1-{\it\phi}_{0}\right)\left(1-m_{1}\mathit{Le}_{1}-m_{2}\mathit{Le}_{2}\right)}{1-{\it\phi}_{0}-m_{1}\mathit{Le}_{1}-m_{2}\mathit{Le}_{2}}, & \displaystyle\end{eqnarray}$$
 $\hat{{\it\Omega}}_{j}=0$
and
 $\hat{{\it\Gamma}}=1$
for
 ${\it\phi}_{0}=0$
. The problem factorizes into a sixth-order system and a first-order equation. The former consists of solving (3.16b,c
) to determine
 $C_{1}^{0}$
,
 $C_{2}^{0}$
,
 $w^{0}$
and
 $\mathit{Ra}_{C1}^{0}$
(or alternatively
 $\mathit{Ra}_{C2}^{0}$
). Equation (3.16a
) is then solved for
 ${\it\phi}^{0}$
.
The solutions at this order take the form
 $$\begin{eqnarray}\displaystyle & \displaystyle T^{0}=-\sin n{\rm\pi}\bar{z}, & \displaystyle\end{eqnarray}$$
 $$\begin{eqnarray}\displaystyle & \displaystyle C_{j}^{0}=-\frac{{\it\Omega}_{j}+\hat{{\it\Omega}}_{j}}{{\it\Omega}+\hat{{\it\Omega}}}\sin n{\rm\pi}\bar{z},\quad \text{for }j=1,2, & \displaystyle\end{eqnarray}$$
 $$\begin{eqnarray}\displaystyle & \displaystyle {\it\phi}^{0}=\frac{n{\rm\pi}J\left(1-{\it\phi}_{0}\right)}{{\it\Gamma}\hat{{\it\Gamma}}({\it\Omega}+\hat{{\it\Omega}})[n^{2}{\rm\pi}^{2}+({\it\sigma}^{1})^{2}]}\!\left[\left(-1\right)^{n+1}\text{e}^{-{\it\sigma}^{1}\left(1-\bar{z}\right)}+\cos n{\rm\pi}\bar{z}+\frac{{\it\sigma}^{1}}{n{\rm\pi}}\sin n{\rm\pi}\bar{z}\right]\!,\hspace{27.0pt} & \displaystyle\end{eqnarray}$$
 $$\begin{eqnarray}\displaystyle & \displaystyle w^{0}=\frac{J\left(1-{\it\phi}_{0}\right)}{{\it\Omega}+\hat{{\it\Omega}}}\sin n{\rm\pi}\bar{z}, & \displaystyle\end{eqnarray}$$
 $$\begin{eqnarray}\frac{J^{2}}{k^{2}}+\frac{{\it\Omega}_{1}+\hat{{\it\Omega}}_{1}}{1-{\it\phi}_{0}}\mathit{Ra}_{C1}^{0}+\frac{{\it\Omega}_{2}+\hat{{\it\Omega}}_{2}}{1-{\it\phi}_{0}}\mathit{Ra}_{C2}^{0}=0,\end{eqnarray}$$
where
 $\hat{{\it\Omega}}=m_{1}\hat{{\it\Omega}}_{1}+m_{2}\hat{{\it\Omega}}_{2}$
,
 $J=n^{2}{\rm\pi}^{2}+k^{2}$
and
 $n$
is a non-zero integer. It should be noted that
 ${\it\sigma}^{1}={\it\sigma}_{R}^{1}+\text{i}{\it\sigma}_{I}^{1}$
, appearing in the solution for
 ${\it\phi}^{0}$
, is not yet known. This is found by considering a solvability condition on the
 $O({\it\delta}^{1})$
perturbation equations.
At
 $O({\it\delta}^{1})$
, the relevant equations are the two modified solute balances and the vertical component of the Darcy equation, recorded in appendix A. We combine the solvability condition determined at
 $O({\it\delta}^{1})$
with the
 $O({\it\delta}^{0})$
characteristic equation (3.19) to obtain
 $$\begin{eqnarray}a_{1}\overline{Ra}_{C1}+a_{2}\overline{Ra}_{C2}=-b\frac{J^{2}}{k^{2}},\end{eqnarray}$$
where
 $$\begin{eqnarray}\displaystyle a_{j} & = & \displaystyle \frac{{\it\Omega}_{j}+\hat{{\it\Omega}}_{j}}{1-{\it\phi}_{0}}\nonumber\\ \displaystyle & & \displaystyle -\,{\it\delta}\!\left[\frac{1}{J}{\it\sigma}^{1}c_{j}+d_{j}\frac{n^{2}{\rm\pi}^{2}}{n^{2}{\rm\pi}^{2}\!+\!({\it\sigma}^{1})^{2}}\!\left(\!1\!-\frac{2{\it\sigma}^{1}[1\!+(-1)^{n+1}\text{e}^{-{\it\sigma}^{1}}]}{n^{2}{\rm\pi}^{2}+({\it\sigma}^{1})^{2}}\right)\right]\!,\quad \!\text{for }j=1,2,\end{eqnarray}$$
 $$\begin{eqnarray}\displaystyle \displaystyle b & = & \displaystyle 1-{\it\delta}\frac{1}{2}\frac{\bar{K}_{1}}{{\it\Gamma}}\end{eqnarray}$$
 $$\begin{eqnarray}\displaystyle & \displaystyle c_{1}=\frac{\mathit{Le}_{1}\left\{\!\left[m_{1}\mathscr{C}_{1}+m_{2}\mathit{Le}_{2}\mathscr{C}_{2}-\left(1-{\it\phi}_{0}\right)\bar{S}\right]({\it\Omega}_{1}+\hat{{\it\Omega}}_{1})+m_{2}\left(1-\mathit{Le}_{2}\right)\mathscr{C}_{1}({\it\Omega}_{2}+\hat{{\it\Omega}}_{2})\!\right\}}{\left(1-{\it\phi}_{0}\right)\left[m_{1}\mathit{Le}_{1}\mathscr{C}_{1}+m_{2}\mathit{Le}_{2}\mathscr{C}_{2}-\left(1-{\it\phi}_{0}\right)\bar{S}\right]}, & \displaystyle \nonumber\\ \displaystyle & & \displaystyle\end{eqnarray}$$
 $$\begin{eqnarray}\displaystyle & \displaystyle c_{2}=\frac{\mathit{Le}_{2}\left\{\!\left[m_{2}\mathscr{C}_{2}+m_{1}\mathit{Le}_{1}\mathscr{C}_{1}-\left(1-{\it\phi}_{0}\right)\bar{S}\right]({\it\Omega}_{2}+\hat{{\it\Omega}}_{2})+m_{1}\left(1-\mathit{Le}_{1}\right)\mathscr{C}_{2}({\it\Omega}_{1}+\hat{{\it\Omega}}_{1})\!\right\}}{\left(1-{\it\phi}_{0}\right)\left[m_{1}\mathit{Le}_{1}\mathscr{C}_{1}+m_{2}\mathit{Le}_{2}\mathscr{C}_{2}-\left(1-{\it\phi}_{0}\right)\bar{S}\right]}, & \displaystyle \nonumber\\ \displaystyle & & \displaystyle\end{eqnarray}$$
 $$\begin{eqnarray}\displaystyle & \displaystyle d_{1}=\frac{m_{2}\left(\mathit{Le}_{2}\mathscr{C}_{2}-\mathit{Le}_{1}\mathscr{C}_{1}\right)-\left(1-{\it\phi}_{0}\right)\bar{S}}{{\it\Gamma}\hat{{\it\Gamma}}\left(1-{\it\phi}_{0}\right)\left[m_{1}\mathit{Le}_{1}\mathscr{C}_{1}+m_{2}\mathit{Le}_{2}\mathscr{C}_{2}-\left(1-{\it\phi}_{0}\right)\bar{S}\right]}, & \displaystyle\end{eqnarray}$$
 $$\begin{eqnarray}\displaystyle & \displaystyle d_{2}=\frac{m_{1}\left(\mathit{Le}_{1}\mathscr{C}_{1}-\mathit{Le}_{2}\mathscr{C}_{2}\right)-\left(1-{\it\phi}_{0}\right)\bar{S}}{{\it\Gamma}\hat{{\it\Gamma}}\left(1-{\it\phi}_{0}\right)\left[m_{1}\mathit{Le}_{1}\mathscr{C}_{1}+m_{2}\mathit{Le}_{2}\mathscr{C}_{2}-\left(1-{\it\phi}_{0}\right)\bar{S}\right]}. & \displaystyle\end{eqnarray}$$
The dispersion equation (3.20) relates the Rayleigh numbers
 $\overline{Ra}_{Cj}$
, correct to
 $O({\it\delta}^{1})$
, and the complex growth rate
 ${\it\sigma}^{1}$
. It should be noted that the coefficients
 $c_{j}$
and
 $d_{j}$
, which encode the physics of the problem through the various dimensional parameters, are independent of
 ${\it\sigma}^{1}$
and
 $k$
. The coefficients
 $c_{j}$
are related to the time-derivative terms in the disturbance equations, and measure the combined effects of the rate-of-change in the leading-order perturbations to thermal and solutal fields. The coefficients
 $d_{j}$
are related to the solute-diffusion terms, and measure the combined effects of dissipation in solutal fluxes induced by the leading-order solid-fraction perturbation. The coefficients
 $c_{j}$
and
 $d_{j}$
, while appearing somewhat innocuously in (3.21a
), turn out to be major controlling factors, along with
 ${\it\Omega}_{j}+\hat{{\it\Omega}}_{j}$
, in the system dynamics.
The dispersion equation (3.20) is a central consequence of the asymptotic scalings adumbrated in § 2 and embodies various physical effects that give rise to novel convective instabilities in the ternary mushy-layer systems. We explore the consequences of (3.20) in the next section. A complete picture of the linear stability characteristics requires a numerical solution approach that relaxes the assumption of small growth rate (details of these calculations are discussed in appendix C).
4. Stability results
4.1. Neutral stability: direct and oscillatory modes
For the neutrally stable oscillatory modes (
 ${\it\sigma}_{R}^{1}=0$
,
 ${\it\sigma}_{I}^{1}\neq 0$
), the real part of (3.20) relates the Rayleigh numbers
 $\overline{Ra}_{Cj}$
and the frequency
 ${\it\sigma}_{I}^{1}$
,
 $$\begin{eqnarray}a_{1R}\overline{Ra}_{C1}+a_{2R}\overline{Ra}_{C2}=-b\frac{J^{2}}{k^{2}},\end{eqnarray}$$
where
 $$\begin{eqnarray}\displaystyle a_{jR}=a_{jR}^{0}+{\it\delta}a_{jR}^{1}\equiv \frac{{\it\Omega}_{j}+\hat{{\it\Omega}}_{j}}{1-{\it\phi}_{0}}\!-{\it\delta}d_{j}\frac{n^{2}{\rm\pi}^{2}}{n^{2}{\rm\pi}^{2}-({\it\sigma}_{I}^{1})^{2}}\!\left(\!1\!-\!\frac{2(-1)^{n+1}{\it\sigma}_{I}^{1}\sin {\it\sigma}_{I}^{1}}{n^{2}{\rm\pi}^{2}-({\it\sigma}_{I}^{1})^{2}}\!\right)\!,\quad \text{for }j=1,2, & & \displaystyle \nonumber\\ \displaystyle & & \displaystyle\end{eqnarray}$$
while the imaginary part of (3.20) determines
 ${\it\sigma}_{I}^{1}$
as a function of
 $k$
,
 $$\begin{eqnarray}a_{1I}\overline{Ra}_{C1}+a_{2I}\overline{Ra}_{C2}=0,\end{eqnarray}$$
where
 $$\begin{eqnarray}a_{jI}=0+{\it\delta}a_{jI}^{1}\equiv -{\it\delta}{\it\sigma}_{I}^{1}\left[\frac{1}{J}c_{j}-d_{j}\frac{2n^{2}{\rm\pi}^{2}\left[1+(-1)^{n+1}\cos {\it\sigma}_{I}^{1}\right]}{[n^{2}{\rm\pi}^{2}-\left({\it\sigma}_{I}^{1}\right)^{2}]^{2}}\right],\quad \text{for }j=1,2,\end{eqnarray}$$
provided that
 $({\it\sigma}_{I}^{1})^{2}>0$
. These relations are correct to
 $O({\it\delta}^{1})$
. Here
 $b$
,
 $c_{j}$
and
 $d_{j}$
are still given by (3.21b
) and (3.22). Equation (4.3), correct to dominant order, becomes
 $a_{1I}^{1}\mathit{Ra}_{C1}^{0}+a_{2I}^{1}\mathit{Ra}_{C2}^{0}=0$
, or, substituting from (4.4),
 $$\begin{eqnarray}{\it\sigma}_{I}^{1}\left[\frac{1}{J}\left(c_{1}\mathit{Ra}_{C1}^{0}+c_{2}\mathit{Ra}_{C2}^{0}\right)-\left(d_{1}\mathit{Ra}_{C1}^{0}+d_{2}\mathit{Ra}_{C2}^{0}\right)\frac{2n^{2}{\rm\pi}^{2}[1+(-1)^{n+1}\cos {\it\sigma}_{I}^{1}]}{[n^{2}{\rm\pi}^{2}-\left({\it\sigma}_{I}^{1}\right)^{2}]^{2}}\right]=0,\end{eqnarray}$$
with
 $\mathit{Ra}_{C1}^{0}$
and
 $\mathit{Ra}_{C2}^{0}$
related through (3.19).
For the neutrally stable direct modes (
 ${\it\sigma}_{R}^{1}=0$
,
 ${\it\sigma}_{I}^{1}=0$
), (4.3) is satisfied automatically since
 $a_{jI}=0$
, while (4.1) still holds with (4.2) replaced by
 $$\begin{eqnarray}a_{jR}=a_{jR}^{0}+{\it\delta}a_{jR}^{1}\equiv \frac{{\it\Omega}_{j}+\hat{{\it\Omega}}_{j}}{1-{\it\phi}_{0}}-{\it\delta}d_{j},\quad \text{for }j=1,2.\end{eqnarray}$$
In the stability analysis, the natural Rayleigh numbers are the effective ones
 $\overline{Ra}_{C1}$
and
 $\overline{Ra}_{C2}$
. In order to most clearly identify the physical mechanisms driving the instabilities, it is useful to revert back to the Rayleigh numbers
 $\overline{Ra}$
,
 $\overline{Ra}_{1}$
and
 $\overline{Ra}_{2}$
, whose interpretation can be linked to specific thermal and compositional fields. We shall examine three simplified cases as follows:
 $\overline{Ra}=0$
,
 $\overline{Ra}_{1}\neq 0$
,
 $\overline{Ra}_{2}=0$
(case 1);
 $\overline{Ra}=0$
,
 $\overline{Ra}_{1}=0$
,
 $\overline{Ra}_{2}\neq 0$
(case 2) and
 $\overline{Ra}\neq 0$
,
 $\overline{Ra}_{1}=0$
,
 $\overline{Ra}_{2}=0$
(case 3). Essentially, we distinguish between three idealized ternary systems in which buoyancy is present only with respect to a single component (
 $C_{1}$
,
 $C_{2}$
or
 $T$
). The stability problem is symmetric with respect to indices 1 and 2, so the results for case 2 can be deduced directly from those for case 1. Additionally, we identify two special cases (appendix B) in which the present ternary system reduces to an effective binary one, as noted by Anderson et al. (Reference Anderson, McFadden, Coriell and Murray2010).
4.2. Case 1:
 $\overline{Ra}=0$
,
$\overline{Ra}_{1}\neq 0$
,
$\overline{Ra}_{2}=0$


In this case, only composition
 $C_{1}$
makes a contribution to buoyancy. The neutral-stability bounds for the direct and oscillatory modes take the forms
 $$\begin{eqnarray}\displaystyle \overline{Ra}_{1} & = & \displaystyle \mathit{Ra}_{1}^{0}\left(1+{\it\delta}\frac{\mathit{Ra}_{1}^{1}}{\mathit{Ra}_{1}^{0}}\right)+O({\it\delta}^{2})\nonumber\\ \displaystyle & = & \displaystyle -\frac{1-{\it\phi}_{0}}{{\it\Omega}_{1}+\hat{{\it\Omega}}_{1}}\frac{J^{2}}{k^{2}}\left[1+{\it\delta}\left(\frac{1-{\it\phi}_{0}}{{\it\Omega}_{1}+\hat{{\it\Omega}}_{1}}d_{1}-\frac{1}{2}\frac{\bar{K}_{1}}{{\it\Gamma}}\right)\right]+O({\it\delta}^{2})\end{eqnarray}$$
 $$\begin{eqnarray}\displaystyle \overline{Ra}_{1} & = & \displaystyle -\frac{1-{\it\phi}_{0}}{{\it\Omega}_{1}+\hat{{\it\Omega}}_{1}}\frac{J^{2}}{k^{2}}\left\{1+{\it\delta}\left[\frac{1-{\it\phi}_{0}}{{\it\Omega}_{1}+\hat{{\it\Omega}}_{1}}d_{1}\frac{n^{2}{\rm\pi}^{2}}{n^{2}{\rm\pi}^{2}-({\it\sigma}_{I}^{1})^{2}}\right.\right.\nonumber\\ \displaystyle & & \displaystyle \left.\times \left.\left(1-\frac{2(-1)^{n+1}{\it\sigma}_{I}^{1}\sin {\it\sigma}_{I}^{1}}{n^{2}{\rm\pi}^{2}-({\it\sigma}_{I}^{1})^{2}}\right)-\frac{1}{2}\frac{\bar{K}_{1}}{{\it\Gamma}}\right]\right\}+O({\it\delta}^{2}),\end{eqnarray}$$
respectively, where the frequency
 ${\it\sigma}_{I}^{1}$
in (4.8) is a non-zero real solution of a dispersion relation
 $$\begin{eqnarray}{\it\sigma}_{I}^{1}\left[1-JQ_{1}\frac{2n^{2}{\rm\pi}^{2}[1+(-1)^{n+1}\cos {\it\sigma}_{I}^{1}]}{[n^{2}{\rm\pi}^{2}-({\it\sigma}_{I}^{1})^{2}]^{2}}\right]=0,\quad \text{where}\ Q_{1}\equiv \frac{d_{1}}{c_{1}}.\end{eqnarray}$$
A couple of observations are worthy of note. First, the possibility of an oscillatory behaviour is controlled by a single parameter combination
 $Q_{1}$
; the oscillations occur if
 $Q_{1}$
is sufficiently positive. Second, the neutral curves,
 $\overline{Ra}_{1}$
versus
 $k$
, can lie in the region of static instability (
 $\overline{Ra}_{1}<0$
) or static stability (
 $\overline{Ra}_{1}>0$
), depending upon whether the combination group
 $$\begin{eqnarray}{\it\Omega}_{1}+\hat{{\it\Omega}}_{1}=\frac{\mathit{Le}_{1}\!\left[m_{2}\mathit{Le}_{2}\left(\mathscr{C}_{2}-\mathscr{C}_{1}\right)+\left(1-{\it\phi}_{0}\right)\left(\mathscr{C}_{1}-\bar{S}\right)\right]}{m_{1}\mathit{Le}_{1}\mathscr{C}_{1}+m_{2}\mathit{Le}_{2}\mathscr{C}_{2}-\left(1-{\it\phi}_{0}\right)\bar{S}}\end{eqnarray}$$
is positive or negative, respectively. To determine the relative locations of the region of stability (
 ${\it\sigma}_{R}^{1}<0$
) and the region of instability (
 ${\it\sigma}_{R}^{1}>0$
), however, we must consider the growth rates of modes by analysing the dispersion relation (4.9) in full. We have examined (4.9) asymptotically and numerically, and discuss the results, including physical interpretations, separately for the direct and oscillatory modes.
4.2.1. Direct modes
For the direct modes, the key quantity in determining the stability characteristics near neutral stability is
 $$\begin{eqnarray}\frac{\text{d}\overline{Ra}_{1}}{\text{d}{\it\sigma}_{R}^{1}}\bigg|_{{\it\sigma}_{R}^{1}=0}={\it\delta}\left[\frac{2({\rm\pi}^{2}+k^{2})}{{\rm\pi}a_{1R}^{0}k}\right]^{2}\left[Q_{1}-\frac{{\rm\pi}^{2}}{4({\rm\pi}^{2}+k^{2})}\right]c_{1}\quad (\text{for }n=1).\end{eqnarray}$$
When
 $Q_{1}<0$
, or equivalently
 $c_{1}$
and
 $d_{1}$
have opposite signs, only direct modes of instability occur, and the sign of (4.11) is given by the sign of negative
 $c_{1}$
. In light of the significance of the signs of
 ${\it\Omega}_{1}+\hat{{\it\Omega}}_{1}$
,
 $c_{1}$
and
 $d_{1}$
noted above, the qualitatively different stability scenarios can then be categorized as follows: (a)
 ${\it\Omega}_{1}+\hat{{\it\Omega}}_{1}>0$
,
 $c_{1}>0$
,
 $d_{1}<0$
; (b)
 ${\it\Omega}_{1}+\hat{{\it\Omega}}_{1}>0$
,
 $c_{1}<0$
,
 $d_{1}>0$
; (c)
 ${\it\Omega}_{1}+\hat{{\it\Omega}}_{1}<0$
,
 $c_{1}>0$
,
 $d_{1}<0$
; (d)
 ${\it\Omega}_{1}+\hat{{\it\Omega}}_{1}<0$
,
 $c_{1}<0$
,
 $d_{1}>0$
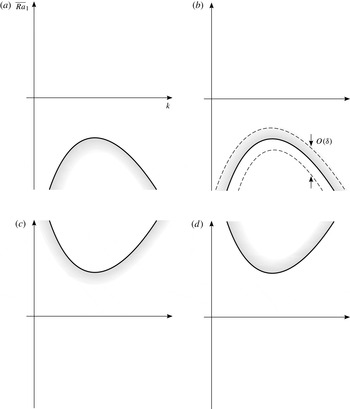
. The stability diagrams in the
 $(k,\overline{Ra}_{1})$
-plane for these cases are depicted in figure 2. We note here that case (c) will eventually be shown to not be permissible for physically realistic parameter values, but we leave this case in the discussion for completeness.
Schematic representation of the neutral-stability curves (solid) and the regions of instability (shaded) for direct modes in the four scenarios: (a)
 ${\it\Omega}_{1}+\hat{{\it\Omega}}_{1}>0$
,
 $c_{1}>0$
,
 $d_{1}<0$
; (b)
 ${\it\Omega}_{1}+\hat{{\it\Omega}}_{1}>0$
,
 $c_{1}<0$
,
 $d_{1}>0$
; (c)
 ${\it\Omega}_{1}+\hat{{\it\Omega}}_{1}<0$
,
 $c_{1}>0$
,
 $d_{1}<0$
; (d)
 ${\it\Omega}_{1}+\hat{{\it\Omega}}_{1}<0$
,
 $c_{1}<0$
,
 $d_{1}>0$
. The stability diagrams for case (a) are qualitatively related to those for case (d) by the sign change
 $\overline{Ra}_{1}\mapsto -\overline{Ra}_{1}$
,
 ${\it\Omega}_{1}+\hat{{\it\Omega}}_{1}\mapsto -({\it\Omega}_{1}+\hat{{\it\Omega}}_{1})$
,
 $c_{1}\mapsto -c_{1}$
and
 $d_{1}\mapsto -d_{1}$
; similarly for cases (b) and (c). It should be noted that
 $c_{1}$
and
 $d_{1}$
have opposite signs in each case, so that overstability does not arise. In each plot, the stability results from the small-
 ${\it\delta}$
theory are strictly valid locally in a region of width
 $O({\it\delta})$
centred on the neutral-stability boundary, as indicated in (b).

The presence of different convective scenarios, and hence the nature of the driving mechanisms, is quite sensitive to the parameters
 $Le_{j}$
and
 $\mathscr{C}_{j}$
(through the groups
 ${\it\Omega}_{1}+\hat{{\it\Omega}}_{1}$
,
 $c_{1}$
and
 $d_{1}$
). To emphasize the sensitivity of the system to
 $Le_{j}$
and
 $\mathscr{C}_{j}$
in isolation, we examine the following two parameter regimes: (i)
 $\mathit{Le}_{1}=\mathit{Le}_{2}$
, which we refer to as a ‘single-solute-diffusive’ regime; (ii)
 $\mathscr{C}_{1}=\mathscr{C}_{2}$
, which we refer to as a ‘single-solute-rejection’ regime. The parameters
 $\mathscr{C}_{j}$
measure the effective rates of solute rejection, involving a joint effect of the segregation coefficients
 $k_{j}$
and compositional ratios
 $\bar{C}_{j}^{bot}$
. The independent effects of a difference in
 $k_{j}$
and a difference in
 $\bar{C}_{j}^{bot}$
are discussed in § 5. For simplicity, we take
 $\bar{S}=0$
, noting that the limit
 $\bar{S}\rightarrow 0$
is non-singular. We assume that
 $0\leqslant {\it\phi}_{0}<1$
,
 $0<m_{j}<1$
,
 $\mathit{Le}_{j}>1$
and
 $\mathscr{C}_{j}\leqslant 0$
throughout.
(i) When
 $\mathit{Le}_{1}=\mathit{Le}_{2}\equiv \mathit{Le}$
, scenario (a) occurs if
 $$\begin{eqnarray}\mathscr{C}_{2}/\mathscr{C}_{1}>1.\end{eqnarray}$$
Next, scenario (b) occurs if either of the following two sets of criteria is satisfied:
 $$\begin{eqnarray}\displaystyle & \displaystyle 1-\frac{1-{\it\phi}_{0}}{m_{2}\mathit{Le}}<\frac{\mathscr{C}_{2}}{\mathscr{C}_{1}}<1-\frac{1-{\it\phi}_{0}}{m_{2}\mathit{Le}^{2}}\quad \text{for }\mathit{Le}\geqslant \frac{1-{\it\phi}_{0}}{m_{2}}, & \displaystyle\end{eqnarray}$$
 $$\begin{eqnarray}\displaystyle & \displaystyle 0\leqslant \frac{\mathscr{C}_{2}}{\mathscr{C}_{1}}<1-\frac{1-{\it\phi}_{0}}{m_{2}\mathit{Le}^{2}}\quad \text{for }\left(\frac{1-{\it\phi}_{0}}{m_{2}}\right)^{1/2}<\mathit{Le}<\frac{1-{\it\phi}_{0}}{m_{2}}. & \displaystyle\end{eqnarray}$$
 $$\begin{eqnarray}0\leqslant \frac{\mathscr{C}_{2}}{\mathscr{C}_{1}}<1-\frac{1-{\it\phi}_{0}}{m_{2}\mathit{Le}}\quad \text{for }\mathit{Le}>\frac{1-{\it\phi}_{0}}{m_{2}}.\end{eqnarray}$$
It should be noted that scenario (c) does not arise in this regime.
(ii) When
 $\mathscr{C}_{1}=\mathscr{C}_{2}\equiv \mathscr{C}$
, we find that only scenario (a) can arise provided
 $$\begin{eqnarray}\mathit{Le}_{1}<\mathit{Le}_{2}<{\textstyle \frac{1}{2}}\left\{\mathit{Le}_{1}+1+[(\mathit{Le}_{1}+1)^{2}+4m_{1}\mathit{Le}_{1}/m_{2}]^{1/2}\right\},\end{eqnarray}$$
independently of
 $\mathscr{C}$
.
These results will be exploited and physical interpretations discussed after the oscillatory modes have been presented below.
4.2.2. Oscillatory modes
When
 $\overline{Ra}=\overline{Ra}_{2}=0$
(case 1), the neutrally stable oscillatory modes must satisfy (4.8) and (4.9) with
 $({\it\sigma}_{I}^{1})^{2}>0$
. Notably, a non-zero solution for
 ${\it\sigma}_{I}^{1}$
, indicating the presence of an oscillatory instability, depends on a single parameter combination
 $Q_{1}$
and the wavenumber
 $k$
. By analysing (4.9) for
 $n=1$
in the limit of small
 ${\it\sigma}_{I}^{1}$
, we find that the oscillatory modes occur for
 $Q_{1}>{\rm\pi}^{2}/[4({\rm\pi}^{2}+k^{2})]$
.
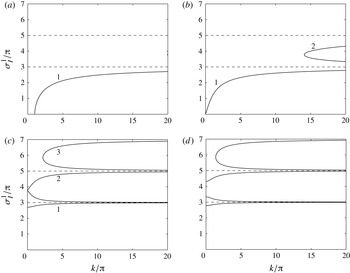
Figure 3 shows the effect of
 $Q_{1}$
on the solution structure
 ${\it\sigma}_{I}^{1}$
versus
 $k$
for
 $n=1$
, as computed from (4.9). At a fixed
 $Q_{1}$
, we find that there is a family of disjoint branches, with the associated
 ${\it\sigma}_{I}^{1}$
lying in the intervals
 $(0,3{\rm\pi})$
and
 $((2l+1){\rm\pi},(2l+3){\rm\pi})$
, where
 $l$
is a positive integer. The branches approach limiting values
 ${\it\sigma}_{I}^{1}=(2l+1){\rm\pi}$
as
 $k\rightarrow \infty$
. Thus, many more solution branches occur for increasing values of
 $k$
; only the first three, labelled 1–3, are apparent in figure 3. For
 $Q_{1}<{\textstyle \frac{1}{4}}$
, the lowest branch (mode 1) features a long-wavelength cutoff at
 $k=k_{\mathit{cutoff}}\equiv {\rm\pi}\left[1/\left(4Q_{1}\right)-1\right]^{1/2}$
, below which the oscillatory instability does not persist (e.g. figure 3
a). For
 $Q_{1}\geqslant {\textstyle \frac{1}{4}}$
, this solution is present at all wavenumbers, including zero wavenumber (figures 3
b–d). As
 $Q_{1}$
increases, each of the higher branches (modes 2 and 3) undergoes a breakup at zero wavenumber, forming a decoupled pair of branches; for mode 2 this occurs at
 $Q_{1}\approx 49.867$
(figure 3
c). Similar behaviour is exhibited by the next higher branches on increasing
 $Q_{1}$
further.
Frequency
 ${\it\sigma}_{I}^{1}$
as a function of wavenumber
 $k$
for
 $n=1$
and (a)
 $Q_{1}={\textstyle \frac{1}{8}}$
, (b)
 $Q_{1}={\textstyle \frac{1}{4}}$
, (c)
 $Q_{1}\approx 49.867$
and (d)
 $Q_{1}=100$
. In each case, there is a family of disjoint solution branches, asymptoting to
 ${\it\sigma}_{I}^{1}=(2l+1){\it\pi}$
as
 $k\rightarrow \infty$
(dashed), where
 $l$
is a positive integer. Many more branches occur for increasing
 $k$
; only the first three, labelled 1–3, are shown. The scales in each plot are the same to allow the effect of
 $Q_{1}$
to be seen more easily. For
 $Q_{1}<{\textstyle \frac{1}{4}}$
, as in (a), there is a long-wavelength cutoff along the mode-1 branch. In (c), there is a breakup of the mode-2 branch, resulting in a decoupled pair of branches, as apparent in (d). Similar behaviour is exhibited by all the higher solution branches.

When
 $Q_{1}>0$
, the different stability scenarios can be categorized as follows: (a)
 ${\it\Omega}_{1}+\hat{{\it\Omega}}_{1}>0$
,
 $c_{1}>0$
,
 $d_{1}>0$
; (b)
 ${\it\Omega}_{1}+\hat{{\it\Omega}}_{1}>0$
,
 $c_{1}<0$
,
 $d_{1}<0$
; (c)
 ${\it\Omega}_{1}+\hat{{\it\Omega}}_{1}<0$
,
 $c_{1}>0$
,
 $d_{1}>0$
; (d)
 ${\it\Omega}_{1}+\hat{{\it\Omega}}_{1}<0$
,
 $c_{1}<0$
,
 $d_{1}<0$
. It should be noted that these are the same as the previous cases (a)–(d) for direct modes, except that the sign of
 $d_{1}$
, and hence
 $Q_{1}$
, is reversed. Again, we note that case (c) will eventually be shown to not be permissible for physically realistic parameter values, but we leave this case in the discussion for completeness. The stability diagrams in the
 $(k,\overline{Ra}_{1})$
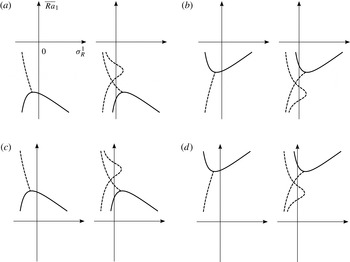
-plane for these cases are depicted in figure 4. The corresponding growth rates
 ${\it\sigma}_{R}^{1}$
as functions of Rayleigh number
 $\overline{Ra}_{1}$
at fixed
 $k$
are depicted in figure 5.
Schematic representation of the neutral-stability curves for the direct mode (solid), the oscillatory modes (dashed), the transition boundary separating the growing direct modes from the growing oscillatory modes (dotted), and the regions of instability (shaded) in the four scenarios: (a)
 ${\it\Omega}_{1}+\hat{{\it\Omega}}_{1}>0$
,
 $c_{1}>0$
,
 $d_{1}>0$
; (b)
 ${\it\Omega}_{1}+\hat{{\it\Omega}}_{1}>0$
,
 $c_{1}<0$
,
 $d_{1}<0$
; (c)
 ${\it\Omega}_{1}+\hat{{\it\Omega}}_{1}<0$
,
 $c_{1}>0$
,
 $d_{1}>0$
; (d)
 ${\it\Omega}_{1}+\hat{{\it\Omega}}_{1}<0$
,
 $c_{1}<0$
,
 $d_{1}<0$
. The stability diagrams for case (a) are qualitatively related to those for case (d) by the sign change
 $\overline{Ra}_{1}\mapsto -\overline{Ra}_{1}$
,
 ${\it\Omega}_{1}+\hat{{\it\Omega}}_{1}\mapsto -({\it\Omega}_{1}+\hat{{\it\Omega}}_{1})$
,
 $c_{1}\mapsto -c_{1}$
and
 $d_{1}\mapsto -d_{1}$
; similarly for cases (b) and (c). It should be noted that
 $c_{1}$
and
 $d_{1}$
have the same sign in each case, so that oscillatory modes are present for sufficiently large wavenumbers. Only the first three oscillatory branches are shown. As in figure 2, the results are valid only in a local sense (i.e. within an
 $O({\it\delta})$
neighbourhood of the neutral-stability boundary).

Growth rate
 ${\it\sigma}_{R}^{1}$
as a function of Rayleigh number
 $\overline{Ra}_{1}$
(shown in the
 ${\it\sigma}_{R}^{1}$
versus
 $\overline{Ra}_{1}$
plane) for fixed
 $k$
and
 $n=1$
. Cases (a–d) correspond to the neutral-stability diagrams portrayed in figures 4(a–d), respectively, with the plots on the left (right) representing cross-sections at
 $k<k_{\mathit{cutoff}}$
(
 $k>k_{\mathit{cutoff}}$
);
 $k_{\mathit{cutoff}}$
is the lowest oscillatory mode wavenumber cutoff as identified in the analysis of § 4.2. In each plot, the solid (dashed) curve corresponds to the direct (oscillatory) solution branch; only the first two oscillatory modes are indicated.

The situation shown in figure 4 is representative but does not illustrate the full range of possible behaviours. In particular, the details vary as
 $Q_{1}$
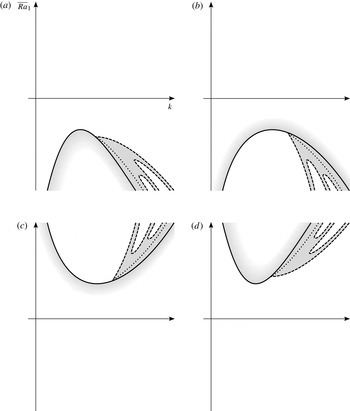
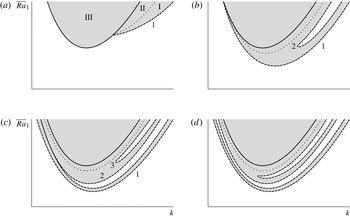
varies in accordance with the results of figure 3. Figure 6 depicts the sketches of the neutral-stability curve for the direct mode (solid), the neutral-stability curves for the oscillatory modes (dashed) and the transition boundary between the growing direct modes and the growing oscillatory modes (dotted) for illustrative values of
 $Q_{1}$
. The results shown correspond to scenario (d) in figure 4; scenarios (a–c) possess similar behaviour. The neutral curves for the oscillatory modes can be associated with the frequency solution branches shown in figure 3. Figure 6(a) shows a case when
 $Q_{1}<{\textstyle \frac{1}{4}}$
, in which the lowest oscillatory curve (mode 1) terminates on the direct curve at a finite
 $k$
with an associated
 ${\it\sigma}_{I}^{1}$
of zero. When
 $Q_{1}={\textstyle \frac{1}{4}}$
, this termination occurs at
 $k=0$
(figure 6
b), while for
 $Q_{1}>{\textstyle \frac{1}{4}}$
the branches do not intersect (figures 6
c,d). A couple of further aspects related to the juxtaposition of the higher oscillatory modes and the direct mode are illustrated in figure 6 for (c)
 $Q_{1}\approx 49.867$
and (d)
 $Q_{1}>49.867$
. In (c) the second oscillatory branch (mode 2) splits at
 $k=0$
, forming a pair of decoupled oscillatory branches, as apparent in (d). The same qualitative results hold also for the higher oscillatory modes. It should be noted also that these modes never intersect the direct mode.
Sketches of typical neutral-stability curves for the direct mode (solid), the oscillatory modes (dashed) and the transition boundary separating the growing direct modes from the growing oscillatory modes (dotted) in the
 $(k,\overline{Ra}_{1})$
-plane for representative cases (a)
 $0<Q_{1}<{\textstyle \frac{1}{4}}$
, (b)
 $Q_{1}={\textstyle \frac{1}{4}}$
, (c)
 $Q_{1}\approx 49.867$
and (d)
 $49.867<Q_{1}<291.766$
. The oscillatory branches are labelled as in figure 3. Each sketch applies to the case
 $\overline{Ra}=\overline{Ra}_{2}=0$
(case 1), and
 ${\it\Omega}_{1}+\hat{{\it\Omega}}_{1}<0$
,
 $c_{1}<0$
and
 $d_{1}<0$
(scenario d in figure 4). The system is linearly unstable in the shaded region. This region divides, as in (a), into three domains, marked I–III, in which a pair of growing oscillatory modes exists (I), two growing direct modes exist (II) and a single growing direct mode exists (III). As
 $Q_{1}$
increases, the point at which the mode-1 branch terminates on the direct branch as well as the noses of the higher oscillatory branches (modes 2 and 3) move to smaller wavenumbers (cf. figure 3). In (b) the mode-1 branch terminates on the direct branch at
 $k=0$
, while in (c) and (d) there is no such termination. In (c) the mode-2 branch splits at
 $k=0$
to form a decoupled pair of oscillatory branches, as seen in (d).

As was done for the direct modes, we rewrite the inequalities that define the different scenarios in figure 4 in terms of the original parameters. Three parameter regimes are now of particular interest. Two of these regimes are the same as those discussed for direct modes (regimes (i) and (ii)). Additionally, we examine a more general case when both the double-solute-diffusive and double-solute-rejection effects are present (
 $\mathit{Le}_{1}\neq \mathit{Le}_{2}$
and
 $\mathscr{C}_{1}\neq \mathscr{C}_{2}$
, regime (iii) below).
(i) When
 $\mathit{Le}_{1}=\mathit{Le}_{2}\equiv \mathit{Le}$
, we find that only scenario (a) can arise, provided either of the following two sets of criteria is satisfied:
 $$\begin{eqnarray}\displaystyle & \displaystyle 1-\frac{1-{\it\phi}_{0}}{m_{2}\mathit{Le}^{2}}<\frac{\mathscr{C}_{2}}{\mathscr{C}_{1}}<1\quad \text{for }\mathit{Le}\geqslant \left(\frac{1-{\it\phi}_{0}}{m_{2}}\right)^{1/2}, & \displaystyle\end{eqnarray}$$
 $$\begin{eqnarray}\displaystyle & \displaystyle \frac{\mathscr{C}_{2}}{\mathscr{C}_{1}}\geqslant 0\quad \text{for }\mathit{Le}<\left(\frac{1-{\it\phi}_{0}}{m_{2}}\right)^{1/2}. & \displaystyle\end{eqnarray}$$
(ii) When
 $\mathscr{C}_{1}=\mathscr{C}_{2}\equiv \mathscr{C}$
, scenario (a) requires
 $$\begin{eqnarray}\mathit{Le}_{2}<\mathit{Le}_{1},\end{eqnarray}$$
while scenario (b) occurs if
 $$\begin{eqnarray}\mathit{Le}_{2}>{\textstyle \frac{1}{2}}\left\{\mathit{Le}_{1}+1+[(\mathit{Le}_{1}+1)^{2}+4m_{1}\mathit{Le}_{1}/m_{2}]^{1/2}\right\}.\end{eqnarray}$$
It should be noted that these criteria are independent of
 $\mathscr{C}$
. An inspection shows that scenarios (c) and (d) do not arise in this regime.
(iii) We now restore both the double-solute-diffusive (
 $\mathit{Le}_{1}\neq \mathit{Le}_{2}$
) and double-solute-rejection (
 $\mathscr{C}_{1}\neq \mathscr{C}_{2}$
) effects. The question we are asking is whether a combined action of these effects can give rise to scenario (d), particularly to an oscillatory instability when
 $\overline{Ra}_{1}>0$
. A case that appears to enjoy a particular simplicity has
 ${\it\phi}_{0}=0$
, in which the scenario of figure 4(d) arises if
 $$\begin{eqnarray}\frac{\mathit{Le}_{1}}{\mathit{Le}_{2}}<\frac{\mathscr{C}_{2}}{\mathscr{C}_{1}}<1-\frac{1}{m_{2}\mathit{Le}_{2}}\quad \text{for }\mathit{Le}_{2}>\frac{1}{m_{2}}.\end{eqnarray}$$
4.2.3. Regime diagrams
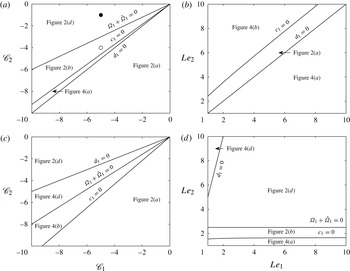
A simple representation of the regions in parameter space, where different convective scenarios are possible, is shown in figure 7. Figure 7(a) shows the results in the (
 $\mathscr{C}_{1},\mathscr{C}_{2}$
)-plane for the case of equal Lewis numbers (single-solute-diffusive regime). Figure 7(b) shows the results in the (
 $Le_{1},Le_{2}$
)-plane for the case of equal compositional ratios (single-solute-rejection regime). These plots are also extended to more general situations of unequal Lewis numbers (figure 7
c) and unequal compositional ratios (figure 7
d). The transition boundaries between different convective scenarios correspond to the points at which any of the parameter combinations
 ${\it\Omega}_{1}+\hat{{\it\Omega}}_{1}$
,
 $c_{1}$
and
 $d_{1}$
vanishes. It should be noticed that these plots capture all the scenarios that can be found in figures 2 and 4, except for scenario (c). Detailed analysis shows that the latter scenario does not arise for any allowed parameter values. The reduced parameter regimes examined are thus exhaustive. The description may be further generalized to include the effects of latent-heat release, with some implications discussed in § 5.
Regime diagrams. The regions of different convective scenarios, as identified in figures 2 and 4, are indicated. Plots (a) and (c) show the results in the
 $(\mathscr{C}_{1},\mathscr{C}_{2})$
-plane, with equal Lewis numbers (
 $\mathit{Le}_{1}=\mathit{Le}_{2}=5$
) in (a) and unequal ones (
 $\mathit{Le}_{1}=5$
,
 $\mathit{Le}_{2}=10$
) in (c). Plots (b) and (d) show the results in the
 $(\mathit{Le}_{1},\mathit{Le}_{2})$
-plane, with equal compositional ratios (
 $\mathscr{C}_{1}=\mathscr{C}_{2}\equiv \mathscr{C}$
) in (b) and unequal ones (
 $\mathscr{C}_{1}=-5$
,
 $\mathscr{C}_{2}=-1$
) in (d). The results in (b) are independent of the value of
 $\mathscr{C}$
. The remaining parameters are fixed at
 $\bar{S}=0$
,
 $m_{1}=m_{2}={\textstyle \frac{1}{2}}$
and
 ${\it\phi}_{0}=0$
. The neutral-stability curves, validated numerically, at the points marked ○ and ● in (a) are shown in figures 10(a) and (b).

4.3. Case 3:
$\overline{Ra}\neq 0$
,
$\overline{Ra}_{1}=0$
,
$\overline{Ra}_{2}=0$


In the presence of thermal buoyancy alone, the forms (4.7)–(4.9) are unchanged but
 $\overline{Ra}_{1}$
,
 ${\it\Omega}_{1}+\hat{{\it\Omega}}_{1}$
,
 $c_{1}$
and
 $d_{1}$
are replaced with
 $\overline{Ra}$
,
 ${\it\Omega}+\hat{{\it\Omega}}$
,
 $c$
and
 $d$
, respectively, where
 ${\it\Omega}+\hat{{\it\Omega}}=m_{1}({\it\Omega}_{1}+\hat{{\it\Omega}}_{1})+m_{2}({\it\Omega}_{2}+\hat{{\it\Omega}}_{2})$
,
 $c=m_{1}c_{1}+m_{2}c_{2}$
and
 $d=m_{1}d_{1}+m_{2}d_{2}$
, or
 $$\begin{eqnarray}\displaystyle & \displaystyle {\it\Omega}+\hat{{\it\Omega}}=\frac{\left(1-{\it\phi}_{0}\right)\left[m_{1}\mathit{Le}_{1}\mathscr{C}_{1}+m_{2}\mathit{Le}_{2}\mathscr{C}_{2}-\left(m_{1}\mathit{Le}_{1}+m_{2}\mathit{Le}_{2}\right)\bar{S}\right]}{m_{1}\mathit{Le}_{1}\mathscr{C}_{1}+m_{2}\mathit{Le}_{2}\mathscr{C}_{2}-\left(1-{\it\phi}_{0}\right)\bar{S}}, & \displaystyle\end{eqnarray}$$
 $$\begin{eqnarray}\displaystyle & \displaystyle c=\frac{\left(m_{1}\mathit{Le}_{1}\mathscr{C}_{1}+m_{2}\mathit{Le}_{2}\mathscr{C}_{2}\right)\!({\it\Omega}+\!\hat{{\it\Omega}})\!-\![m_{1}\mathit{Le}_{1}({\it\Omega}_{1}+\hat{{\it\Omega}}_{1})+m_{2}\mathit{Le}_{2}({\it\Omega}_{2}+\hat{{\it\Omega}}_{2})]\!\left(1\!-{\it\phi}_{0}\right)\bar{S}}{\left(1-{\it\phi}_{0}\right)\left[m_{1}\mathit{Le}_{1}\mathscr{C}_{1}+m_{2}\mathit{Le}_{2}\mathscr{C}_{2}-\left(1-{\it\phi}_{0}\right)\bar{S}\right]}, & \displaystyle \nonumber\\ \displaystyle & & \displaystyle\end{eqnarray}$$
 $$\begin{eqnarray}\displaystyle & \displaystyle d=-\frac{\bar{S}\left[m_{1}\mathit{Le}_{1}+m_{2}\mathit{Le}_{2}-\left(1-{\it\phi}_{0}\right)\right]}{\left[m_{1}\mathit{Le}_{1}\mathscr{C}_{1}+m_{2}\mathit{Le}_{2}\mathscr{C}_{2}-\left(1-{\it\phi}_{0}\right)\bar{S}\right]^{2}}. & \displaystyle\end{eqnarray}$$
 $\bar{S}>0$
), we find that
 ${\it\Omega}+\hat{{\it\Omega}}$
is always positive and
 $d$
is always negative, while
 $c$
can take either sign. If
 $c>0$
, the system is unstable to direct modes with
 $\overline{Ra}<0$
(scenario (a) of figure 2). If
 $c<0$
, the system can also exhibit the oscillatory instability at
 $\overline{Ra}<0$
, since scenario (b) of figure 4 is then appropriate. The latter possibility can be most easily seen in the limiting case of large
 $\mathit{Le}_{j}$
. Specifically, for
 $\mathit{Le}_{1}\gg \mathit{Le}_{2}\gg 1$
, we find that
 $c\sim m_{2}\bar{S}\left(\mathscr{C}_{1}-\mathscr{C}_{2}\right)\mathit{Le}_{2}/\left(m_{1}\mathscr{C}_{1}^{2}\right)$
, indicating that the faster-diffusing, faster-rejected second solute dominates this scenario. A similar argument holds for
 $\mathit{Le}_{2}\gg \mathit{Le}_{1}\gg 1$
and the first solute involved.
However, for the liquid that descends along the liquidus surface upon cooling (
 ${\rm\Delta}T^{\ast }>0$
), both alternatives described above would require increase of the liquid density with increasing temperature (
 ${\it\alpha}^{\ast }<0$
), which is not the usual liquid behaviour.
5. Interpretations
For definiteness, we assume that the interstitial liquid at the mush top has composition less than at the mush bottom (
 ${\rm\Delta}C_{1}^{\ast }<0$
), resulting in the release by the background solidification of relatively light (heavy) fluid when
 ${\it\alpha}_{1}^{\ast }>0$
(
 ${\it\alpha}_{1}^{\ast }<0$
); see (2.2) with
 ${\it\alpha}^{\ast }$
and
 ${\it\alpha}_{2}^{\ast }$
set to zero (case 1).
When the neutral-stability curves lie in a region of static instability (scenarios (a) and (b) in figures 2 and 4) the presence of unstable modes can be anticipated by known buoyancy arguments. For scenario (d), however, the neutral-stability curves are found to lie in a region of static stability, permitting, remarkably, the modes of instability to occur in a bottom-heavy layer. Correspondingly, the modes of scenarios (a) and (b) may be referred to as the statically expected modes, while those of scenario (d) as statically unexpected modes.
Another surprising result is associated with the response of these modes to density gradients. While for modes of scenario (a) a top-heavy density distribution is destabilizing, as usual, the modes of scenarios (b) and (d) are found to respond in just the opposite way: for scenario (b) a top-heavy density distribution is stabilizing and for scenario (d) a bottom-heavy distribution is destabilizing, both contrary to intuition. Said another way, in scenarios (b) and (d) the growth rate of the instability is increased if the Rayleigh number is changed in the direction of static stability. In (a) the response to buoyancy may be referred to as ordinary, while that in (b) and (d) as exceptional. For the direct and (lowest) oscillatory modes, the stability characteristics in terms of their static-stability properties and response to variations in density gradients are summarized in table 1. The parameter regimes in which each convective scenario can arise are also indicated.
Classification of convective scenarios for case 1. In scenarios (c) and (d), an instability arises despite an arguably statically stable density stratification. In scenarios (b) and (d), buoyancy forces oppose an instability: if
 $\mathit{Ra}_{1}$
is decreased from the neutral value, the growth rate
 ${\it\sigma}_{R}$
of perturbations decreases, in contrast to normal expectations. It should be noted that the position of the neutral-stability boundaries is controlled by the sign of
 ${\it\Omega}_{1}+\hat{{\it\Omega}}_{1}$
, while the response of unstable modes to stratification is controlled by the sign of
 $c_{1}$
. The presence of an oscillatory instability in each scenario is controlled by the sign of
 $d_{1}$
.

In scenario (a), the direct modes correspond to the usual instability driven by the compositional buoyancy from the unstably stratified solutal field. The oscillatory instability in this context may arise in both the single-solute-diffusive (
 $\mathit{Le}_{1}=\mathit{Le}_{2}$
) and single-solute-rejection (
 $\mathscr{C}_{1}=\mathscr{C}_{2}$
) regimes; see (4.16) and (4.17). Such oscillatory instability is an analogue of the ternary oscillatory mode identified by Anderson et al. (Reference Anderson, McFadden, Coriell and Murray2010) in both their full and simple models (see their figures 6 and 8(c,d), the dashed vertical lines), since there is no statically stabilizing thermal or second solute field present to provide a restoring field for an oscillation. This oscillatory instability can be interpreted through a mechanism that involves the thermodynamic equilibrium constraint, a rapidly diffusing thermal field and a slowly diffusing second solute field (Anderson et al.
Reference Anderson, McFadden, Coriell and Murray2010).
Scenario (b) requires the system to be stratified in a top-heavy way, as in (a), but the statically stable stratification has an anomalous effect on the unstable modes. One should recall, however, that our asymptotic analysis is only valid if the growth rate
 ${\it\sigma}$
is small, of
 $O({\it\delta})$
, as
 ${\it\delta}\rightarrow 0$
. In fact, for the conditions of scenario (b), the numerical evidence outside of this approximation (appendix C) indicates the existence of a high-frequency oscillatory branch at
 $\overline{Ra}_{1}<0$
(figure 10
a); this branch persists to the conditions of scenario (d) (figure 10
b). It should be noted that this high-frequency oscillatory mode is not apparent from the sketches in figures 2(b,d) and 4(b,d), which only depict the stability results from the small-
 ${\it\sigma}$
theory. The sharp distinction between low- and high-frequency oscillatory modes is a feature of our thin-mushy-layer theory and emphasizes the local nature of stability predictions associated with scenarios (b) and (d) at negative
 $\overline{Ra}_{1}$
.
We now consider the situation in which the instability, either direct or oscillatory, may be provoked by a bottom-heavy solutal gradient (scenario (d) in figures 2 and 4). We note at the outset that a direct mode identified here is necessarily distinct from the direct mode found in the simple model of Anderson et al. (Reference Anderson, McFadden, Coriell and Murray2010) in statically stable regions: a novel direct mode here is present even in the absence of double-solute-diffusive effects; see (4.14). Further, the results of Anderson et al. (Reference Anderson, McFadden, Coriell and Murray2010) have shown that the ternary oscillatory mode in their model cannot exist outside the region of static instability. Our results here indicate the presence of a novel, quite different, oscillatory mode of instability, for which no statically unstable density is required. This ternary oscillatory instability involves the simultaneous operation of two distinct mechanisms associated with (double) solute diffusion and (double) solute rejection; see (4.19). An attempt to elucidate these unsuspected discoveries is given below.
Consider the leading-order neutral-stability result in (3.19) for the reduced case in which
 $Ra^{0}=Ra_{2}^{0}=0$
with
 $Ra_{1}^{0}\neq 0$
(case 1). Here, buoyancy is only influenced by the composition of species 1. We have
 $$\begin{eqnarray}Ra_{1}^{0}=-\frac{1-{\it\phi}_{0}}{{\it\Omega}_{1}+\hat{{\it\Omega}}_{1}}\frac{J^{2}}{k^{2}},\end{eqnarray}$$
where
 ${\it\Omega}_{1}+\hat{{\it\Omega}}_{1}$
is given by (4.10). This result predicts statically unexpected neutral modes when
 $Ra_{1}^{0}>0$
. This corresponds to the requirement
 ${\it\Omega}_{1}+\hat{{\it\Omega}}_{1}<0$
. Keeping in mind that
 $\mathscr{C}_{j}\leqslant 0$
,
 $0<m_{j}<1$
,
 $\bar{S}\geqslant 0$
and
 $\mathit{Le}_{j}>0$
this can be expressed as
 $$\begin{eqnarray}m_{2}\mathit{Le}_{2}\left(\mathscr{C}_{2}-\mathscr{C}_{1}\right)+\left(1-{\it\phi}_{0}\right)\mathscr{C}_{1}>\left(1-{\it\phi}_{0}\right)\bar{S}.\end{eqnarray}$$
It should be noted that unless
 $\mathscr{C}_{1}<\mathscr{C}_{2}$
it is not possible to obtain statically unexpected modes when only solute 1 contributes to buoyancy. It should also be noted that increasing the influence of latent heat (i.e. increasing
 $\bar{S}$
) simply increases the amount by which
 $\mathscr{C}_{2}$
must exceed
 $\mathscr{C}_{1}$
for these modes to occur. Further, a difference in solute diffusivities is not required as the parameter
 $\mathit{Le}_{1}$
does not enter the condition (5.2). Noting that
 $\mathscr{C}_{j}=\left(1-k_{j}\right)\bar{C}_{j}^{bot}$
and
 $0\leqslant k_{j}\leqslant 1$
, there are two useful situations to examine. First, we consider an extreme case in which there is complete rejection of solute 1 so that
 $k_{1}=0$
and no rejection of solute 2 so that
 $k_{2}=1$
. Second, we suppose that there is complete rejection of both solutes so that
 $k_{1}=k_{2}=0$
. In the former case, solute 2 can be stored in the solid while in the latter case neither solute 1 nor 2 can be stored in the solid (i.e. the case of pure ice formed from a ternary aqueous solution).
5.1. Parcel argument:
$k_{1}=0$
,
$k_{2}=1$


Here,
 $\mathscr{C}_{1}=\bar{C}_{1}^{bot}$
and
 $\mathscr{C}_{2}=0$
. The two scenarios of interest are most readily distinguished in the two disparate limiting cases:
 $\mathit{Le}_{1}=\mathit{Le}_{2}\equiv \mathit{Le}\gg 1$
(with
 $\bar{S}=0$
) and
 $\bar{S}\sim \mathit{Le}_{2}\gg \mathit{Le}_{1}$
. In the former case, we find that
 $$\begin{eqnarray}{\it\Omega}_{1}+\hat{{\it\Omega}}_{1}\sim -\frac{m_{2}}{m_{1}}\mathit{Le},\quad c_{1}\sim -\frac{m_{2}}{m_{1}\left(1-{\it\phi}_{0}\right)}\mathit{Le}^{2},\quad d_{1}\sim \frac{m_{2}}{m_{1}^{2}\left(1-{\it\phi}_{0}\right)|\bar{C}_{1}^{bot}|},\end{eqnarray}$$
corresponding to the scenario of figure 2(d). In the latter case,
 $$\begin{eqnarray}{\it\Omega}_{1}+\hat{{\it\Omega}}_{1}\sim -\left(\frac{m_{2}|\bar{C}_{1}^{bot}|}{1-{\it\phi}_{0}}\frac{\mathit{Le}_{2}}{\bar{S}}-1\right)\mathit{Le}_{1},\quad c_{1}\sim -\frac{m_{2}\mathit{Le}_{1}|\bar{C}_{1}^{bot}|\mathit{Le}_{2}^{2}}{\left(1-{\it\phi}_{0}\right)^{2}\bar{S}},\quad d_{1}\sim -\frac{m_{2}\mathit{Le}_{2}}{\left(1-{\it\phi}_{0}\right)^{2}\bar{S}},\end{eqnarray}$$
yielding the scenario of figure 4(d) provided that
 $\mathit{Le}_{2}/\bar{S}$
is sufficiently large.
With these observations in mind we put forward the following parcel argument to help in understanding a direct instability of figure 2(d). Consider a portion of ternary mushy layer that is cold and salty with respect to both solutes at the bottom and warm and fresh at the top. We assume that the two solutes have the same diffusion rate, which is exceedingly slow compared with thermal diffusion (
 $\mathit{Le}_{1}=\mathit{Le}_{2}\gg 1$
with
 $\bar{S}=0$
). From a static point of view, noting that buoyancy is present only with respect to solute 1, this would be expected to be a stable configuration. Suppose now that a parcel of fluid is displaced upwards. The parcel warms rapidly but remains relatively salty with respect to its new local environment. In order for the parcel to equilibrate to its new environment some local remelting of the solid must occur. Dissolution of the solid means that solvent (species 3, e.g. water) and solute 2 are incorporated back into the liquid – recall that no solute 1 is stored in the solid. This dissolution of the solid brings the overall solute content back to a level where the parcel is in local thermodynamic equilibrium with its surroundings but at the cost of an overcompensation with respect to solute 2 (as water is added back into the system during melting so is solute 2). That is, the fluid parcel is relatively salty with respect to solute 2 but remains relatively fresh with respect to solute 1. Therefore, since only solute 1 influences the buoyancy the parcel remains relatively light with respect to its surroundings and so the upwardly displaced parcel continues to rise. This provides a mechanism for a direct instability despite statically stable conditions.
We now outline a modified argument for the case in which the diffusion of solute 1 is moderate (
 $\mathit{Le}_{2}\gg \mathit{Le}_{1}$
with
 $\bar{S}=0$
). The upwardly displaced parcel can adapt to its new fresher environment by reducing its solute 1 content by diffusion. Any melting of the solid that occurs would only continue to make the parcel relatively salty with respect to solute 2 and relatively fresh with respect to solute 1. Either of these effects has the tendency to make the parcel relatively fresh in solute 1, and hence relatively buoyant. The solute-diffusion imbalance outlined here represents the instability mechanism identified by Anderson et al. (Reference Anderson, McFadden, Coriell and Murray2010) in their simple ternary mushy-layer model. One of the key points of the present work is that we have been able to identify other mechanisms – in this particular case an imbalance associated with solute rejection – that can generate similar novel instabilities.
The possibility for an oscillatory mode in this context (figure 4
d) is related to a relatively fast diffusing solute 1 and large latent heat (
 $\bar{S}\sim \mathit{Le}_{2}\gg \mathit{Le}_{1}$
). Due to the non-zero latent heat, the melting process requires the supply of additional heating while at the same time the diffusion of solute 1 is enhanced. It is an interplay between double diffusion, latent-heat release and melting that gives rise to an oscillatory instability.
In the next section we examine another situation in which the imbalance comes not from different rates of solute diffusion or solute rejection but rather a difference in the background solute distributions.
5.2. Parcel argument:
$k_{1}=k_{2}=0$

In this case both solutes are completely rejected upon solidification so that pure solid made up of only species 3 forms (pure ice, say). With
 $\bar{S}=0$
for simplicity, two extreme cases that allow physical interpretation are cases in which
 $\mathit{Le}_{1}=\mathit{Le}_{2}\equiv \mathit{Le}\gg 1$
and
 $\mathit{Le}_{2}\gg \mathit{Le}_{1}$
. In the former case, we find that
 $$\begin{eqnarray}{\it\Omega}_{1}+\hat{{\it\Omega}}_{1}\sim \frac{m_{2}\left(\mathscr{C}_{2}-\mathscr{C}_{1}\right)}{m_{1}\mathscr{C}_{1}+m_{2}\mathscr{C}_{2}}\mathit{Le},\quad c_{1}\sim \frac{m_{2}\left(\mathscr{C}_{2}-\mathscr{C}_{1}\right)}{\left(1-{\it\phi}_{0}\right)\left(m_{1}\mathscr{C}_{1}+m_{2}\mathscr{C}_{2}\right)}\mathit{Le}^{2},\end{eqnarray}$$
 $$\begin{eqnarray}\quad d_{1}\sim \frac{m_{2}\left(\mathscr{C}_{2}-\mathscr{C}_{1}\right)}{\left(1-{\it\phi}_{0}\right)\left(m_{1}\mathscr{C}_{1}+m_{2}\mathscr{C}_{2}\right)^{2}}.\end{eqnarray}$$
In the latter case,
 $$\begin{eqnarray}{\it\Omega}_{1}+\hat{{\it\Omega}}_{1}\sim \frac{\mathscr{C}_{2}-\mathscr{C}_{1}}{\mathscr{C}_{2}}\mathit{Le}_{1},\quad c_{1}\sim \frac{\left(m_{1}\mathscr{C}_{1}+m_{2}\mathscr{C}_{2}\right)\left(\mathscr{C}_{2}-\mathscr{C}_{1}\right)}{m_{2}\left(1-{\it\phi}_{0}\right)\mathscr{C}_{2}^{2}}\mathit{Le}_{1}^{2},\quad d_{1}\sim \frac{1}{\left(1-{\it\phi}_{0}\right)\mathscr{C}_{2}}.\end{eqnarray}$$
As long as
 $\mathscr{C}_{1}<\mathscr{C}_{2}$
the former case gives rise to a direct mode of figure 2(d) while the latter case gives rise to an oscillatory mode of figure 4(d). For
 $k_{1}=k_{2}=0$
the condition on the composition parameters can be most effectively written in dimensional terms as
 $$\begin{eqnarray}\frac{C_{2\mathit{bot}}^{\ast }}{C_{1\mathit{bot}}^{\ast }}<\frac{C_{2\mathit{bot}}^{\ast }-C_{2\mathit{top}}^{\ast }}{C_{1\mathit{bot}}^{\ast }-C_{1\mathit{top}}^{\ast }}.\end{eqnarray}$$
In the
 $C_{2}^{\ast }$
versus
 $C_{1}^{\ast }$
plane, the ratios appearing in this inequality,
 $$\begin{eqnarray}m_{B}\equiv \frac{C_{2\mathit{bot}}^{\ast }}{C_{1\mathit{bot}}^{\ast }},\quad m_{SP}\equiv \frac{C_{2\mathit{bot}}^{\ast }-C_{2\mathit{top}}^{\ast }}{C_{1\mathit{bot}}^{\ast }-C_{1\mathit{top}}^{\ast }},\end{eqnarray}$$
have useful interpretations. The first ratio represents the slope of the line connecting the origin to the composition at the bottom of the mushy layer. The second ratio represents the slope of the line connecting the composition of the top and bottom of the mushy layer. At least to a leading-order approximation this straight line can be interpreted as the solidification path, or the line denoting the composition through the mushy layer from bottom to top. The condition that
 $m_{B}<m_{SP}$
can be understood as giving rise to a statically unexpected destabilization as follows (see also figure 8).
A mechanism of a direct instability of stably stratified ternary mushy layers with no solid solutions (see § 5.2). The solid line corresponds to the solidification path in the
 $(C_{1}^{\ast },C_{2}^{\ast })$
-plane. The dotted line corresponds to the tie line joining the origin and the bottom of the mush. The dashed lines indicate the isotherms. The density decreases from bottom to top, implying a statically stable stratification. When a parcel initially at point P, here chosen to correspond to the mush bottom, is displaced upwards to a QR isotherm, a dissolution of the solid dendrites forces the parcel to adjust its net composition to that of point R whose solute 1 content, and hence density, is less than that of point Q.

A parcel originally at point P (for simplicity but not necessity chosen at the bottom of the mush), as shown in figure 8, gets displaced upwards to a position corresponding to the RQ isotherm. In the limiting case of slow diffusion of both solutes (
 $\mathit{Le}_{1}=\mathit{Le}_{2}\gg 1$
) the parcel must regain the local liquidus temperature by dissolving the surrounding (pure ice) dendrites. However, dissolution of pure ice moves the composition of the parcel along the tie line connecting point P to the origin and hence the parcel reaches the liquidus temperature at a net composition in which the composition of solute 1 is lower (fresher) than its local surroundings (the parcel has composition R but is in an environment associated with composition Q). As a result, the parcel is lighter than its surroundings and continues to rise, producing a direct instability despite the statically stable density field (figure 2
d). We emphasize that the requirement
 $m_{B}<m_{SP}$
is essential to the argument: if
 $m_{B}>m_{SP}$
a parcel would again take on the composition of point R, but now it would acquire some solute 1 by dissolving the dendrites and hence become heavier, thus returning towards its original position P.
Consider now a different limit in which the Lewis numbers are widely separated as
 $\mathit{Le}_{2}\gg \mathit{Le}_{1}$
. This assumption effectively excludes diffusion of solute 2. In this case, the same condition on the slopes,
 $m_{B}<m_{SP}$
, gives rise to an oscillatory instability (figure 4
d). By the previous argument, the parcel would lose a further amount of solute 1 by diffusion, thereby enhancing the instability. Any physical mechanism capable of producing oscillations must involve a restoring force of some sort. At
 $O({\it\delta}^{0})$
, there is neutral stability and no oscillations are predicted. With weak background solidification present at
 $O({\it\delta}^{1})$
, however, such a restoring agency is provided by a particular double-diffusive effect associated with dissipation in solutal fluxes induced by the leading-order solid-fraction perturbation (cf. Anderson et al.
Reference Anderson, McFadden, Coriell and Murray2010). This effect is measured by the parameter combination
 $d_{1}$
, which in the present regime has the appropriate sign to force an upwardly displaced parcel to go back and oscillate about its original position. A growth in amplitude of the oscillations can be described in terms of an overly large restoring effect. We point out that it is only due to the presence of background solidification that we have this oscillatory instability, introducing a phase lag between the solid-fraction perturbation and other disturbance fields.
6. Conclusions
We have examined the linear stability of a mushy layer during the directional solidification of ternary alloys. The model is of an isolated primary mushy layer, dynamically decoupled from any other liquid, secondary mushy or solid layers. The model accounts for phase change effects due to latent-heat release, solute rejection and background solidification. In addition to double-diffusive convective modes of the Anderson et al. (Reference Anderson, McFadden, Coriell and Murray2010) type occurring because of the mismatch in diffusivities of the two solutes, our results establish the existence of novel convective modes, phase change in nature, which may similarly be provoked by a statically stable solute stratification. The nature of these instabilities is described in two distinct situations corresponding either to complete rejection of one solute and no rejection of the other (§ 5.1) or to complete rejection of both solutes (§ 5.2). The physical mechanisms underlying these instabilities involve a difference in the rates of solute rejection and a difference in the background solute distributions, respectively, as the essential ingredients.
We remark here on a relationship between the present problem and the classical problem of double-diffusive convection in a non-reactive porous medium (Nield Reference Nield1968). We eliminate
 ${\hat{C}}_{2}$
, rather than
 $\hat{T}$
, from (3.9) and, noting that
 $\hat{{\it\phi}}$
can be decoupled from the other fields, derive an equivalent set of equations for
 $\hat{T}$
,
 ${\hat{C}}_{1}$
and
 ${\hat{w}}$
, which at leading order has the form
 $$\begin{eqnarray}\displaystyle & \displaystyle \frac{1-{\it\phi}_{0}}{{\it\Omega}+\hat{{\it\Omega}}}\left(\text{D}^{2}-k^{2}\right)T^{0}-w^{0}=0, & \displaystyle\end{eqnarray}$$
 $$\begin{eqnarray}\displaystyle & \displaystyle \frac{1-{\it\phi}_{0}}{{\it\Omega}_{1}+\hat{{\it\Omega}}_{1}}\left(\text{D}^{2}-k^{2}\right)C_{1}^{0}-w^{0}=0, & \displaystyle\end{eqnarray}$$
 $$\begin{eqnarray}\displaystyle & \displaystyle \left(\text{D}^{2}-k^{2}\right)w^{0}+k^{2}\big(\mathit{Ra}_{T}^{0}T^{0}+\mathit{Ra}_{C}^{0}C_{1}^{0}\big)=0, & \displaystyle\end{eqnarray}$$
 $\mathit{Ra}_{T}^{0}\equiv \mathit{Ra}^{0}+\mathit{Ra}_{2}^{0}/m_{2}$
and
 $\mathit{Ra}_{C}^{0}\equiv \mathit{Ra}_{1}^{0}-m_{1}\mathit{Ra}_{2}^{0}/m_{2}$
. It should be noted that
 ${\it\phi}^{0}$
still satisfies (3.16a
), while
 $C_{2}^{0}=(T^{0}-m_{1}C_{1}^{0})/m_{2}$
from (3.9d
). Although this rearrangement breaks the symmetry with respect to indices 1 and 2 inherent in the equivalent system (3.16), it allows a comparison with the disturbance equations in the classical case of Nield (Reference Nield1968). In the modified heat balance (6.1a
), an effective heat-diffusion coefficient is produced,
 $(1-{\it\phi}_{0})/({\it\Omega}+\hat{{\it\Omega}})$
, which is always positive and, for
 $\mathit{Le}_{j}>1$
, smaller than unity. In the classical non-reactive porous case, the equivalent of this coefficient is equal to unity. The incorporation of a variety of phase change effects at
 $O({\it\delta}^{0})$
, i.e. the release of latent heat and the rejection of two solutes, thus acts only to effectively weaken heat diffusion in the mush. However, in the modified solute balance (6.1b
), an effective solute-diffusion coefficient is produced,
 $(1-{\it\phi}_{0})/({\it\Omega}_{1}+\hat{{\it\Omega}}_{1})$
, which, in contrast to the classical case, can have either sign. In the classical non-reactive porous case, the equivalent of this coefficient is
 $\left(1-{\it\phi}_{0}\right)/\mathit{Le}_{1}$
. The Nield (Reference Nield1968) model is formally regained if we first let
 $\bar{S}\rightarrow 0$
and then
 $\mathscr{C}_{1}\rightarrow 0$
. Remarkably, the negative
 ${\it\Omega}_{1}+\hat{{\it\Omega}}_{1}$
identifies the ‘unconventional’ convective scenarios (d) in figures 2 and 4. This suggests that the physical explanation of their mechanisms could be sought in the phenomenon of a ‘negative solutal diffusivity’, in analogy with a ‘negative-viscosity’ effect in large-scale flows (Starr Reference Starr1968; Sivashinsky Reference Sivashinsky1983; Sivashinsky & Yakhot Reference Sivashinsky and Yakhot1985) and ‘negative-resistivity’ effect in magnetohydrodynamic flows (Roberts & Loper Reference Roberts and Loper1979; Hughes Reference Hughes1985). It should be noted that in these leading-order equations the roles of the parameters
 $c_{1}$
and
 $d_{1}$
(relating to the stability response and mode type) are not represented.
Finally, we make a link to the analysis of Anderson et al. (Reference Anderson, McFadden, Coriell and Murray2010). The particular effects of background solidification, solute rejection and latent-heat release, which were present in the full numerical model of Anderson et al. (Reference Anderson, McFadden, Coriell and Murray2010) but omitted from their simple analytical model, have been carefully analysed in the present work. Here, we have been able to identify the physical role of these effects as sources of more general imbalances in the two solutes during phase transformation. Thus, in analogy to ‘double-solute-diffusive’ phenomena we identify the phase-transformation-related phenomenon of ‘double-solute rejection’ that arises due to different rates of solute rejection and/or different levels of initial solute compositions. In the present work we have been able to individually associate these effects with a variety of modes of instability in the ternary-alloy mush layer. We observe here, for example, a previously undetected oscillatory mode of instability for which no statically unstable density is required. This is in some sense an analogue of the direct mode found in Anderson et al. (Reference Anderson, McFadden, Coriell and Murray2010) that was present in the absence of unstable stratification with respect to any thermal or solute field. In our study, the phase change effects appearing at leading order are those proportional to
 $\bar{S}$
and
 $\mathscr{C}_{j}$
. These particular effects were absent in the simple model of Anderson et al. (Reference Anderson, McFadden, Coriell and Murray2010). The extra phase change effects are present at
 $O({\it\delta}^{1})$
and appear as the terms proportional to the parameter groups
 $d_{j}$
in (3.21a
). These extra phase change effects arise as a result of the interaction between the solid fraction and solutal fields through the solute-diffusion terms. The analogous (solute-diffusion) effects were found to be crucial in the Anderson et al. (Reference Anderson, McFadden, Coriell and Murray2010) simple model in identification of their novel modes of convective instability. In the present limit (
 ${\it\delta}\ll 1$
), one would expect that these effects would be swamped by the dominant phase change processes discussed above, and would be unlikely to provide more than a small correction. It should be noted, however, that there is neutral stability at
 $O({\it\delta}^{0})$
, indicating that the
 $O({\it\delta}^{1})$
phase change effects indeed play a crucial role as far as the type and stability properties of modal disturbances are concerned.
We have identified the new interactions between convection and solidification that can occur within ternary mushy layers, focusing on the linear aspects of these interactions. The nonlinear development of convective instabilities created through such interactions remains a task for the future. Efforts are in progress to incorporate the novel physical mechanisms revealed in this paper into a conceptual picture of the wealth of convective scenarios in ternary mushy layers.
Acknowledgements
This work was supported in part by the US National Science Foundation, DMS-1107848 (D.M.A.) and by the Slovak Scientific Grant Agency, VEGA 1/0711/12 (P.G.). The authors would also like to thank G. McFadden for helpful comments on an earlier version of this manuscript.
Appendix A. The
$O({\it\delta}^{1})$
problem

A problem adjoint to the linear homogeneous problem defined in (3.16b,c ) with the associated boundary conditions is
 $$\begin{eqnarray}\displaystyle & \displaystyle \left(\text{D}^{2}-k^{2}\right)C_{j}^{\dagger }+k^{2}\mathit{Ra}_{Cj}^{0}w^{\dagger }=0,\quad \text{for }j=1,2, & \displaystyle\end{eqnarray}$$
 $$\begin{eqnarray}\displaystyle & \displaystyle \left(\text{D}^{2}-k^{2}\right)w^{\dagger }-\frac{{\it\Omega}_{1}+\hat{{\it\Omega}}_{1}}{1-{\it\phi}_{0}}C_{1}^{\dagger }-\frac{{\it\Omega}_{2}+\hat{{\it\Omega}}_{2}}{1-{\it\phi}_{0}}C_{2}^{\dagger }=0, & \displaystyle\end{eqnarray}$$
 $C_{1}^{\dagger }=C_{2}^{\dagger }=w^{\dagger }=0$
at
 $\bar{z}=0$
and
 $1$
. The adjoint solutions may be written as
 $$\begin{eqnarray}\displaystyle & \displaystyle C_{j}^{\dagger }=\frac{k^{2}\mathit{Ra}_{Cj}^{0}}{J}\sin n{\rm\pi}\bar{z},\quad \text{for }j=1,2, & \displaystyle\end{eqnarray}$$
 $$\begin{eqnarray}\displaystyle & \displaystyle w^{\dagger }=\sin n{\rm\pi}\bar{z}. & \displaystyle\end{eqnarray}$$
 $Ra_{C1}^{0}$
and
 $Ra_{C2}^{0}$
are still related by (3.19).
By the same procedure as outlined at
 $O({\it\delta}^{0})$
in § 3.2, the
 $O({\it\delta}^{1})$
disturbance equations can be reduced to
 $$\begin{eqnarray}\displaystyle & \displaystyle \left(\text{D}^{2}-k^{2}\right)C_{j}^{1}-\frac{{\it\Omega}_{j}+\hat{{\it\Omega}}_{j}}{1-{\it\phi}_{0}}w^{1}={\it\Theta}_{j},\quad \text{for }j=1,2, & \displaystyle\end{eqnarray}$$
 $$\begin{eqnarray}\displaystyle & \displaystyle \left(\text{D}^{2}-k^{2}\right)w^{1}+k^{2}\big(\mathit{Ra}_{C1}^{0}C_{1}^{1}+\mathit{Ra}_{C2}^{0}C_{2}^{1}\big)=W, & \displaystyle\end{eqnarray}$$
 $$\begin{eqnarray}\displaystyle & \displaystyle {\it\Theta}_{1}=\frac{\mathit{Le}_{1}[1-{\it\phi}_{0}-m_{2}\mathit{Le}_{2}-m_{1}({\it\Omega}_{1}+\hat{{\it\Omega}}_{1})]{\it\Sigma}_{1}+m_{2}\mathit{Le}_{2}[\mathit{Le}_{1}-({\it\Omega}_{1}+\hat{{\it\Omega}}_{1})]{\it\Sigma}_{2}}{\left(1-{\it\phi}_{0}\right)\left(1-{\it\phi}_{0}-m_{1}\mathit{Le}_{1}-m_{2}\mathit{Le}_{2}\right)}, & \displaystyle \nonumber\\ \displaystyle & & \displaystyle\end{eqnarray}$$
 $$\begin{eqnarray}\displaystyle & \displaystyle {\it\Theta}_{2}=\frac{\mathit{Le}_{2}[1-{\it\phi}_{0}-m_{1}\mathit{Le}_{1}-m_{2}({\it\Omega}_{2}+\hat{{\it\Omega}}_{2})]{\it\Sigma}_{2}+m_{1}\mathit{Le}_{1}[\mathit{Le}_{2}-({\it\Omega}_{2}+\hat{{\it\Omega}}_{2})]{\it\Sigma}_{1}}{\left(1-{\it\phi}_{0}\right)\left(1-{\it\phi}_{0}-m_{1}\mathit{Le}_{1}-m_{2}\mathit{Le}_{2}\right)}, & \displaystyle \nonumber\\ \displaystyle & & \displaystyle\end{eqnarray}$$
 $$\begin{eqnarray}\displaystyle & \displaystyle W=-\bar{K}_{1}\left(\text{D}^{2}-k^{2}\right)(\tilde{{\it\phi}}^{2}w^{0})+\bar{K}_{1}\text{D}(w^{0}\text{D}\tilde{{\it\phi}}^{2})-k^{2}(\mathit{Ra}_{C1}^{1}C_{1}^{0}+\mathit{Ra}_{C2}^{1}C_{2}^{0}), & \displaystyle\end{eqnarray}$$
 $$\begin{eqnarray}\displaystyle {\it\Sigma}_{1} & = & \displaystyle \left[1-{\it\phi}_{0}-\frac{m_{1}\mathscr{C}_{1}}{\bar{S}}\right]\left({\it\sigma}^{1}-\text{D}\right)C_{1}^{0}-\frac{m_{2}\mathscr{C}_{1}}{\bar{S}}\left({\it\sigma}^{1}-\text{D}\right)C_{2}^{0}\nonumber\\ \displaystyle & & \displaystyle +\left[\left(1-\frac{m_{1}\mathscr{C}_{1}}{\bar{S}}\right)\text{D}\tilde{C}_{1}^{1}-\frac{m_{2}\mathscr{C}_{1}}{\bar{S}}\text{D}\tilde{C}_{2}^{1}\right]w^{0}+\frac{1}{\mathit{Le}_{1}}\text{D}({\it\phi}^{0}\text{D}\tilde{C}_{1}^{0}),\end{eqnarray}$$
 $$\begin{eqnarray}\displaystyle {\it\Sigma}_{2} & = & \displaystyle \left[1-{\it\phi}_{0}-\frac{m_{2}\mathscr{C}_{2}}{\bar{S}}\right]\left({\it\sigma}^{1}-\text{D}\right)C_{2}^{0}-\frac{m_{1}\mathscr{C}_{2}}{\bar{S}}\left({\it\sigma}^{1}-\text{D}\right)C_{1}^{0}\nonumber\\ \displaystyle & & \displaystyle +\left[\left(1-\frac{m_{2}\mathscr{C}_{2}}{\bar{S}}\right)\text{D}\tilde{C}_{2}^{1}-\frac{m_{1}\mathscr{C}_{2}}{\bar{S}}\text{D}\tilde{C}_{1}^{1}\right]w^{0}+\frac{1}{\mathit{Le}_{2}}\text{D}({\it\phi}^{0}\text{D}\tilde{C}_{2}^{0}).\end{eqnarray}$$
 $$\begin{eqnarray}\int _{0}^{1}(C_{1}^{\dagger \ast }{\it\Theta}_{1}+C_{2}^{\dagger \ast }{\it\Theta}_{2}+w^{\dagger \ast }W)\text{d}\bar{z}=0,\end{eqnarray}$$
which, on performing the integration, yields the
 $O({\it\delta}^{1})$
contribution used in deriving the result (3.20).
Appendix B. Relations to binary mushy layers
The present ternary mushy-layer model includes a couple of special parametric regimes for which the ternary system reduces to an effective binary one, as noted by Anderson et al. (Reference Anderson, McFadden, Coriell and Murray2010). Our goal here is to recognize these cases contained in the stability results of § 4 and place our solutions in context.
The first parameter regime (case I) has
 $\mathit{Le}_{1}=\mathit{Le}_{2}\equiv \mathit{Le}_{12}$
,
 $k_{1}=k_{2}\equiv k_{12}$
and
 $m_{2}\overline{Ra}_{C1}=m_{1}\overline{Ra}_{C2}$
, so that the two species diffuse identically, are rejected identically upon solidification and have liquidus and solutal expansion coefficients related by
 $m_{2}^{\ast }{\it\alpha}_{1}^{\ast }=m_{1}^{\ast }{\it\alpha}_{2}^{\ast }$
. In this case, the stability characteristics depend on
 $\bar{C}_{1}^{\mathit{bot}}$
and
 $\bar{C}_{2}^{bot}$
only through an effective concentration ratio
 $\bar{C}_{\mathit{eff}}^{bot}\equiv m_{1}\bar{C}_{1}^{bot}+m_{2}\bar{C}_{2}^{bot}$
and the buoyant effects are quantified by an effective Rayleigh number
 $\overline{Ra}_{\mathit{eff}}\equiv \overline{Ra}_{C1}/m_{1}=\overline{Ra}_{C2}/m_{2}$
. A second parameter regime (case II) in which a binary-alloy model can be recovered is given by
 $\mathit{Le}_{1}=\mathit{Le}_{2}\equiv \mathit{Le}_{12}$
,
 $k_{1}=k_{2}\equiv k_{12}$
, together with the requirement that the concentration ratios are equal,
 $\bar{C}_{1}^{bot}=\bar{C}_{2}^{bot}\equiv \bar{C}_{12}^{bot}$
. The buoyant effects are quantified by an effective Rayleigh number
 $\overline{Ra}_{\mathit{eff}}\equiv \overline{Ra}_{C1}+\overline{Ra}_{C2}$
in this case.
For the neutrally stable direct modes (
 ${\it\sigma}_{R}^{1}=0$
,
 ${\it\sigma}_{I}^{1}=0$
), the effective Rayleigh number in cases I and II can be, from (4.1) and (4.6), put into a single form analogous to (4.7) of case 1. Specifically, we find
 $$\begin{eqnarray}\overline{Ra}_{\mathit{eff}}=-\frac{1-{\it\phi}_{0}}{{\it\Omega}_{\mathit{eff}}+\hat{{\it\Omega}}_{\mathit{eff}}}\frac{J^{2}}{k^{2}}\left[1+{\it\delta}\left(\frac{1-{\it\phi}_{0}}{{\it\Omega}_{\mathit{eff}}+\hat{{\it\Omega}}_{\mathit{eff}}}d_{\mathit{eff}}-\frac{1}{2}\frac{\bar{K}_{1}}{{\it\Gamma}_{\mathit{eff}}}\right)\right]+O({\it\delta}^{2}),\end{eqnarray}$$
where
 $$\begin{eqnarray}\displaystyle & \displaystyle {\it\Omega}_{\mathit{eff}}+\hat{{\it\Omega}}_{\mathit{eff}}=\frac{\mathit{Le}_{12}\left(1-{\it\phi}_{0}\right)\left(\bar{S}-\mathscr{C}_{\mathit{eff}}\right)}{\left(1-{\it\phi}_{0}\right)\bar{S}-\mathit{Le}_{12}\mathscr{C}_{\mathit{eff}}}, & \displaystyle\end{eqnarray}$$
 $$\begin{eqnarray}\displaystyle & \displaystyle d_{\mathit{eff}}=-\frac{\left[\mathit{Le}_{12}-\left(1-{\it\phi}_{0}\right)\right]\bar{S}}{\left[\left(1-{\it\phi}_{0}\right)\bar{S}-\mathit{Le}_{12}\mathscr{C}_{\mathit{eff}}\right]^{2}}, & \displaystyle\end{eqnarray}$$
 $$\begin{eqnarray}\displaystyle & \displaystyle {\it\Gamma}_{\mathit{eff}}=-\frac{\left(1-{\it\phi}_{0}\right)\bar{S}-\mathit{Le}_{12}\mathscr{C}_{\mathit{eff}}}{\left(1-{\it\phi}_{0}\right)\left(\mathit{Le}_{12}-1\right)}, & \displaystyle\end{eqnarray}$$
 $$\begin{eqnarray}\mathscr{C}_{\mathit{eff}}=\left\{\begin{array}{@{}l@{}}\left(1-k_{12}\right)\bar{C}_{\mathit{eff}}^{bot}\qquad \text{(case I)},\quad \\ \left(1-k_{12}\right)\bar{C}_{12}^{bot}\qquad \text{(case II)}.\quad \end{array}\right.\end{eqnarray}$$
Further,
 $c_{1}$
and
 $Q_{1}$
in (4.11) are replaced by
 $c_{\mathit{eff}}$
and
 $Q_{\mathit{eff}}\equiv d_{\mathit{eff}}/c_{\mathit{eff}}$
, where
 $$\begin{eqnarray}c_{\mathit{eff}}=\frac{\mathit{Le}_{12}^{2}\left(\bar{S}-\mathscr{C}_{\mathit{eff}}\right)\left[\left(1-{\it\phi}_{0}\right)\bar{S}-\mathscr{C}_{\mathit{eff}}\right]}{\left[\left(1-{\it\phi}_{0}\right)\bar{S}-\mathit{Le}_{12}\mathscr{C}_{\mathit{eff}}\right]^{2}}.\end{eqnarray}$$
Since
 ${\it\Omega}_{\mathit{eff}}+\hat{{\it\Omega}}_{\mathit{eff}}>0$
,
 $c_{\mathit{eff}}>0$
and
 $d_{\mathit{eff}}<0$
whenever
 $\mathscr{C}_{\mathit{eff}}<0$
and
 $\mathit{Le}_{12}>1$
, we find that only direct modes of instability, driven by the conventional buoyancy mechanism, are allowed in the binary system in the present asymptotic limit; cf. scenario (a) in figure 2. Since
 $Q_{\mathit{eff}}$
is always negative, an oscillatory instability cannot arise. As a consequence, any oscillations identified in § 4 must therefore be intrinsic to the ternary aspects of the primary mushy layer.
Finally, we make an observation concerning the direct instabilities (
 ${\it\sigma}_{R}^{1}>0$
,
 ${\it\sigma}_{I}^{1}=0$
), providing further arguments that justify our scalings introduced in (2.15). In particular, from (3.20) when
 ${\it\sigma}_{I}^{1}=0$
we find that there is a maximum growth rate (over all
 $k$
) which, when considered down to
 $\bar{S}={\it\delta}S^{\ast }$
and
 $\mathscr{C}_{\mathit{eff}}={\it\delta}\mathscr{C}_{\mathit{eff}}^{\ast }$
, has the limiting form
 $$\begin{eqnarray}{\it\sigma}_{R}^{1}\sim \frac{1}{{\it\delta}}\frac{2n^{2}{\rm\pi}^{2}\left[\mathit{Le}_{12}-\left(1-{\it\phi}_{0}\right)\right]}{\mathit{Le}_{12}{\it\phi}_{0}+\left(\mathit{Le}_{12}-1\right)({\it\Omega}_{\mathit{eff}}^{\ast }+\hat{{\it\Omega}}_{\mathit{eff}}^{\ast })}\left[-\frac{1}{4n^{2}{\rm\pi}^{2}}\frac{{\it\Omega}_{\mathit{eff}}^{\ast }+\hat{{\it\Omega}}_{\mathit{eff}}^{\ast }}{1-{\it\phi}_{0}}\overline{Ra}_{\mathit{eff}}-1\right],\end{eqnarray}$$
where
 ${\it\Omega}_{\mathit{eff}}^{\ast }+\hat{{\it\Omega}}_{\mathit{eff}}^{\ast }$
is defined by (B 2a
) with
 $\bar{S}$
and
 $\mathscr{C}_{\mathit{eff}}$
replaced by the
 $O(1)$
quantities
 $S^{\ast }$
and
 $\mathscr{C}_{\mathit{eff}}^{\ast }$
. Thus, a singular growth rate, scaled with
 $1/{\it\delta}$
as
 ${\it\delta}\rightarrow 0$
at a fixed
 $\overline{Ra}_{\mathit{eff}}$
, appears to emerge when the scalings
 $S\sim 1/{\it\delta}$
and
 $C_{\mathit{eff}}^{bot}\sim 1/{\it\delta}$
are adopted (cf. (2.15)). A similar result can be shown to hold true also in the general ternary case.
Appendix C. Numerical results
In order to further understand the stability results obtained in the asymptotic limits considered in the main text, here we explore some more general stability results computed numerically. In particular, we computed a solution to the full perturbation equations (3.9)–(3.11) along with base-state equations (3.2)–(3.4) using a pseudospectral Chebyshev collocation method as described previously (Anderson et al.
Reference Anderson, McFadden, Coriell and Murray2010). For a spatial discretization with
 $N_{P}$
Chebyshev points, this method provides an approximation to the first
 $N_{P}$
eigenvalues (growth rates) for a given set of system parameters. The lowest modes we find are well approximated numerically. There are spurious eigenvalues that arise as under-resolved approximations to the highest-frequency components in the spectrum. We have identified these spurious modes by comparing the spectra with different
 $N_{P}$
and have eliminated them by utilizing the intermodal separation drift criteria as suggested by Boyd (Reference Boyd2001).
Two specific situations we wish to investigate in more detail numerically are the following. First, we note that the leading-order result in (4.7) has a pole where
 ${\it\Omega}_{1}+\hat{{\it\Omega}}_{1}=0$
, so that the sign of
 $\overline{Ra}_{1}$
depends on the control parameters; numerical results described below also reveal this pole. Second, the neutral oscillatory modes identified by our asymptotic analysis rely on the assumption that their frequency is small, of
 $O({\it\delta})$
, as
 ${\it\delta}\rightarrow 0$
; this assumption breaks down when
 $c_{1}=0$
(where notable transitions occur with respect to different stability characteristics). The numerical results, not restricted by this limit, indicate that other, higher-frequency, modes may also be present.
Neutral-stability results as a function of the compositional ratio
 $\mathscr{C}_{2}$
, at fixed
 $k={\it\pi}$
. The symbols are results from the full numerical model (○ for a direct mode,
 $\times$
for an oscillatory mode). The curves are the small-
 ${\it\delta}$
asymptotic results given by (4.7) for a direct mode (solid), and (4.8) and (4.9) for an oscillatory mode (dashed). The direct mode exhibits pole-like behaviour near
 ${\it\Omega}_{1}+\hat{{\it\Omega}}_{1}=0$
, as captured both asymptotically and numerically. The asymptotics captures the low-frequency oscillatory behaviour near the point
 $Q_{1}={\textstyle \frac{1}{8}}$
at which the oscillatory mode branches off the direct mode (see the insets), but fails to show a smooth transition near
 $c_{1}=0$
to the higher-frequency modes evidenced numerically. It should be noted that in the upper inset only the most dangerous portion of the neutral-stability boundary is shown for clarity. The remaining parameters are fixed at
 $\mathscr{C}_{1}=-5$
,
 $\bar{S}=0$
,
 $m_{1}=m_{2}={\textstyle \frac{1}{2}}$
,
 ${\it\phi}_{0}=0$
,
 $\mathit{Le}_{1}=\mathit{Le}_{2}=5$
,
 $k_{1}=k_{2}=0$
,
 $K_{1}=0$
,
 $\overline{Ra}=\overline{Ra}_{2}=0$
,
 ${\it\delta}={\textstyle \frac{1}{10}}$
and
 $N_{P}=2^{5}$
.

We consider first the neutral-stability results for a range of
 $\mathscr{C}_{2}$
representing a section of parameter space in figure 7(a) at
 $\mathscr{C}_{1}=-5$
that crosses the three marked transition boundaries. In particular, along this slice,
 ${\it\Omega}_{1}+\hat{{\it\Omega}}_{1}$
,
 $c_{1}$
and
 $d_{1}$
cross zero at the values
 $\mathscr{C}_{2}=-3$
,
 $-{\textstyle \frac{23}{5}}$
and
 $-5$
respectively. Figure 9 shows the behaviour of the neutral-stability results for values of
 $\mathscr{C}_{2}$
that include this range. The symbols (○ for a direct mode,
 $\times$
for an oscillatory mode) correspond to the direct numerical calculations based on the full model, while the curves (solid for direct modes, dashed for oscillatory modes) correspond to the asymptotic results. We see that there is excellent agreement for the direct modes; the agreement is more impressive on taking a smaller value of
 ${\it\delta}$
. Of particular note is the verification that the direct mode forms a pole in
 $\overline{Ra}_{1}$
for
 ${\it\Omega}_{1}+\hat{{\it\Omega}}_{1}=0$
(or
 $\mathscr{C}_{2}=-3$
). It should be recalled from § 4.2.2 that, for fixed
 $k={\it\pi}$
, the low-frequency oscillatory mode exists in the range
 $Q_{1}\equiv d_{1}/c_{1}>{\textstyle \frac{1}{8}}$
or equivalently
 $-{\textstyle \frac{3}{125}}(8\sqrt{699}-19)\approx -4.62<\mathscr{C}_{2}<-{\textstyle \frac{23}{5}}=-4.60$
, as confirmed numerically (see the insets). At
 $c_{1}=0$
(or
 $\mathscr{C}_{2}=-{\textstyle \frac{23}{5}}$
), the asymptotic form for
 ${\it\sigma}_{I}$
defined by (4.9) breaks down. The numerical results show, however, that near this point the oscillatory mode continues with increasing frequency as
 $\mathscr{C}_{2}$
increases. This behaviour is not captured asymptotically and points to a non-uniformity in the dispersion relation (4.9).
Two important implications follow from the numerical evidence. First, there exist instances in which the neutral-stability boundaries identified in the asymptotic analysis are sub-dominant relative to high-frequency oscillatory modes that can be observed numerically. For example, in the range
 $-{\textstyle \frac{23}{5}}<\mathscr{C}_{2}<-3$
, over which the small-
 ${\it\delta}$
asymptotics predicts the statically expected exceptional response scenario identified in figure 2(b), the neutral-stability boundary for the direct mode with
 $\overline{Ra}_{1}<0$
is masked by that associated with a high-frequency oscillatory mode revealed numerically. An example of the corresponding neutral curves
 $\overline{Ra}_{1}$
versus
 $k$
for
 $\mathscr{C}_{2}$
in this range is shown in figure 10(a). Second, the high-frequency oscillatory mode persists to the range
 $\mathscr{C}_{2}>-3$
, indicating that instability can exist for both statically stable (
 $\overline{Ra}_{1}>0$
) and statically unstable (
 $\overline{Ra}_{1}<0$
) stratifications; it should be noted that the asymptotics predicts here the statically unexpected exceptional response scenario identified in figure 2(d). An example of the corresponding neutral curves
 $\overline{Ra}_{1}$
versus
 $k$
for
 $\mathscr{C}_{2}$
in this range is shown in figure 10(b). Numerical evidence not presented in detail here indicates that similar implications apply to the scenarios of figures 4(b,d).
Neutral-stability curves
 $\overline{Ra}_{1}$
versus
 $k$
, as calculated from the full numerical model (○ for a direct mode,
 $\times$
for an oscillatory mode) and the asymptotic model (solid curve for a direct mode) for (a)
 $\mathscr{C}_{2}=-4$
and (b)
 $\mathscr{C}_{2}=-1$
. In (a) the asymptotics predicts the scenario identified in figure 2(b), while in (b) the scenario of figure 2(d) is predicted. The asymptotic results are in excellent agreement with the numerical results, although an oscillatory instability with an
 $O(1)$
frequency for
 $\overline{Ra}_{1}<0$
is not captured by the asymptotics. Other parameter values are identical to figure 9.

To sum up, the numerical results for small, but finite,
 ${\it\delta}$
confirm the small-
 ${\it\sigma}$
characteristics resolved asymptotically, especially with respect to direct instabilities. While low-frequency oscillatory modes show good agreement between asymptotic and numerical results, the numerical results, not restricted to the low-frequency limit, also reveal that additional solution structures emerge at an
 $O(1)$
growth rate
 ${\it\sigma}$
for
 $\overline{Ra}_{1}<0$
.