1 Introduction
In the study of turbulent flows the interaction of turbulence with a solid boundary has long been a topic of interest. Uzkan & Reynolds (Reference Uzkan and Reynolds1967) noted that the presence of a boundary acts both directly, in inhibiting the turbulent fluctuations in the vicinity of the boundary, and indirectly, through the production of new turbulence, by assisting in the maintenance of mean velocity gradients. As a result, Uzkan & Reynolds (Reference Uzkan and Reynolds1967) sought to isolate the first, direct, effect on the turbulent fluctuations, in doing so giving rise to the study of the interaction of zero-mean-shear isotropic turbulence with a solid boundary. This simplified interaction benefits from eliminating the effects of mean shear that could mask other more subtle aspects of the interaction. However, nearly 50 years later the study of this problem continues and several issues remain contentious. Here, we report results from experiments using oscillating-grid turbulence to explore the interaction of turbulence with a solid boundary and cast further light on the interaction between zero-mean-shear turbulence and a boundary.
The earliest studies of the interaction of a solid boundary with a zero-mean-shear isotropic turbulent field are by Uzkan & Reynolds (Reference Uzkan and Reynolds1967) and Thomas & Hancock (Reference Thomas and Hancock1977). Both used similar ‘moving belt’ configurations. Here, a turbulent flow in an open channel, generated using a fixed vertical grid positioned normal to the horizontal mean-flow direction, flows over a horizontal wall that moves at the same speed (and in the same direction) as the mean flow. The turbulence adjacent to the moving boundary is free to evolve as it is advected downstream. The boundary-normal root-mean-square (r.m.s.) turbulent velocity,
 $w=(\overline{u_{3}^{\prime 2}})^{1/2}$
, was found to be monotonically reduced in magnitude to zero from its free-stream value over a distance from the boundary of approximately one integral length scale (Thomas & Hancock Reference Thomas and Hancock1977). At low Reynolds number (
 $Re_{T}\equiv \overline{q^{\prime 4}}/\unicode[STIX]{x1D708}\unicode[STIX]{x1D700}\approx 90$
;
 $\overline{q^{\prime 2}}$
denotes turbulent kinetic energy per unit mass,
 $\unicode[STIX]{x1D708}$
denotes kinematic viscosity and
 $\unicode[STIX]{x1D700}$
denotes dissipation per unit mass), Uzkan & Reynolds (Reference Uzkan and Reynolds1967) found that the boundary-tangential r.m.s. turbulent velocity,
 $u=(\overline{u_{1}^{\prime 2}})^{1/2}$
was monotonically reduced by the presence of the wall. In contrast, at higher Reynolds number (
 $Re_{T}\approx 2000$
) Thomas & Hancock (Reference Thomas and Hancock1977) reported a near-boundary increase in
 $u$
relative to its free-stream value as a result of the boundary, that persisted as the flow travelled downstream.
Hunt & Graham (Reference Hunt and Graham1978) used rapid distortion theory (RDT) to attempt to address the differences in observations made, by splitting the region of flow influenced by the boundary into two distinct layers; an inner viscous layer adjacent to the boundary and an outer inviscid layer above, denoted the ‘source region’. Within the source region, RDT predicted that
 $u$
was amplified and
 $w$
was reduced. In contrast, in the inner viscous layer all components of the turbulent velocity were predicted to reduce monotonically to zero (Hunt & Graham Reference Hunt and Graham1978). However, amplification of
 $u$
in the source region was predicted under the assumption that the viscous effects were confined to the viscous sub-layer with small boundary-normal thickness when compared to the integral length scale of turbulence (i.e. at large Reynolds number), such that in the source layer viscous effects could be ignored over short times. This assumption implies that the theory is valid only for short times over which the turbulence does not decay significantly. In addition, nonlinear effects develop over long time periods, such as straining of small eddies by larger eddies near the boundary, leading to a breakdown of the assumptions made in the original RDT. As a consequence, it can be argued that the model is not valid at large times (Perot & Moin Reference Perot and Moin1995; Aronson, Johansson & Löfdahl Reference Aronson, Johansson and Löfdahl1997). Hunt (Reference Hunt1984) proposed a nonlinear correction to the tangential turbulent velocities predicted by Hunt & Graham (Reference Hunt and Graham1978) to account for the straining of small eddies near the boundary. The theory has been proposed to be valid, subject to the nonlinear correction, under the assumption that the mean rate of energy dissipation is approximately constant with height. In addition, enstrophy budgets, estimating the vortical corrections to the original theory, further predict that in the limit of large Reynolds number the theory proposed by Hunt & Graham (Reference Hunt and Graham1978) is applicable even at large times (Magnaudet Reference Magnaudet2003).
Similar results to those proposed by Hunt & Graham (Reference Hunt and Graham1978) and Hunt (Reference Hunt1984) have been reported in experimental studies using oscillating-grid turbulence (OGT). In this case a horizontal grid within a cuboid tank is oscillated vertically at fixed frequency and amplitude. Under ideal conditions, the turbulence produced is statistically stationary, homogeneous and isotropic in planes parallel to the grid, with negligible mean flow (De Silva & Fernando Reference De Silva and Fernando1994). The turbulence is, however, inhomogeneous in planes normal to the grid; that is, the r.m.s. velocity components
 $u$
and
 $w$
decay with increasing distance normal to the grid. Hence, when interacting with a horizontal boundary, the boundary induced effects are superimposed onto pre-existing inhomogeneity in the boundary-normal direction. Measurements of OGT impinging upon a horizontal boundary made by McDougall (Reference McDougall1979) exhibited a monotonic reduction of
 $u$
at low Reynolds number (
 $Re\equiv u\ell /\unicode[STIX]{x1D708}\approx 40$
;
 $\ell$
denotes integral length scale), while Hannoun, Fernando & List (Reference Hannoun, Fernando and List1988) observed amplification of
 $u$
at higher Reynolds number (
 $Re\approx 120$
). Using OGT, measurements showing amplification of tangential turbulent velocities have also been observed at a sharp density interface between two fluids (Brumley & Jirka Reference Brumley and Jirka1987; Kit, Strang & Fernando Reference Kit, Strang and Fernando1997) and at a sediment boundary (Wan Mohtar & Munro Reference Wan Mohtar and Munro2013).
The problem has also been studied using numerical simulation (Biringen & Reynolds Reference Biringen and Reynolds1981; Perot & Moin Reference Perot and Moin1995; Bodart, Cazalbou & Joly Reference Bodart, Cazalbou and Joly2010). Perot & Moin (Reference Perot and Moin1995) used direct numerical simulation (DNS) to study the instantaneous insertion of a boundary into a field of zero-mean, homogeneous, isotropic turbulence. They found that following boundary insertion a peak in
 $u$
was observed that was rapidly dissipated for
 $Re_{T}$
between 50 and 375. The cause of the initial peak in
 $u$
was attributed to the process of rapid boundary insertion, where in order to preserve continuity, suddenly imposing the wall blocking condition (
 $w=0$
) resulted in pressure increases and redistribution of turbulent kinetic energy. The rapid dissipation of the peak in
 $u$
was attributed to viscous damping. Similar results were also reported in the experimental study of Aronson et al. (Reference Aronson, Johansson and Löfdahl1997) using a ‘moving belt’ configuration for
 $Re_{T}$
between 325 and 425 (Aronson et al.
Reference Aronson, Johansson and Löfdahl1997). Most recently Bodart et al. (Reference Bodart, Cazalbou and Joly2010) reported a DNS study of zero-mean-shear turbulence produced in a cubic domain by a random forcing field within a thin horizontal layer equidistant from two opposite, horizontal, boundaries of the cube. The turbulence decayed vertically across the region between the source layer and the boundary, in a manner comparable to OGT. Bodart et al. (Reference Bodart, Cazalbou and Joly2010) reported that
 $u$
was monotonically reduced by the presence of the boundary, but that it attains an approximately constant value across a proportion of the boundary-affected region. (In this study,
 $Re_{T}=100$
at the edge of the source layer.)
The structure of the turbulence in the boundary-affected region is thought to be the result of the interaction of a viscous and a kinematic response. The kinematic condition, often referred to as wall blocking, was the focus of Hunt & Graham’s RDT and is due to the ‘blocking’ of a fluid element as it travels towards a boundary. Hunt & Graham (Reference Hunt and Graham1978) propose that this kinematic condition results in a net transfer of energy from
 $w$
to
 $u$
. Notably, this kinematic condition acts on
 $w$
for distances approximately of order equal to the integral length scale of the turbulence, and so acts at a greater distance from the boundary than the viscous condition acts on all velocity components. This gives rise to the two-layer structure discussed – the viscous sub-layer and outer source layer.
In contrast, Perot & Moin (Reference Perot and Moin1995) argue that the underlying physics is governed by the behaviour of a viscous response. Their discussion focused on an imbalance between ‘splats’ and ‘antisplats’. A splat can be considered to be a conceptualised element of fluid that is blocked as it travels towards the boundary. Conversely a region of fluid moving away from the boundary may be referred to as an ‘antisplat’, which is produced by the collision of fluid elements travelling along the boundary (Chu & Falco Reference Chu and Falco1988). In an inviscid fluid, the blocking of a splat would result in fluid elements that move tangential to the boundary until an antisplat occurred without loss of turbulent kinetic energy, with little overall intercomponent energy transfer. However, in a viscous fluid, energy is dissipated as the fluid element travels along the boundary. This results in less energy input into the antisplat than that of the splat; referred to as ‘splat–antisplat imbalance’ (Perot & Moin Reference Perot and Moin1995). This model suggests there is no significant net energy transfer from
 $w$
to
 $u$
, as energy is dissipated, resulting in no amplification of
 $u$
, in contradiction to the kinematic process outlined in Hunt & Graham (Reference Hunt and Graham1978).
The transport equations for the Reynolds stress tensor are key to understanding energy transfer in a turbulent flow (see Tennekes & Lumley Reference Tennekes and Lumley1972, p. 63). For turbulence interacting with a boundary the pressure–strain term has been found to be critical, and represents intercomponent energy transfer. Previous analyses of the pressure–strain term have indicated that close to the wall energy is transferred from
 $w^{2}$
to
 $u^{2}$
such that there is increasing anisotropy (Perot & Moin Reference Perot and Moin1995; Aronson et al.
Reference Aronson, Johansson and Löfdahl1997; Bodart et al.
Reference Bodart, Cazalbou and Joly2010). However, it has been conjectured that it is unlikely for there to be sufficient intercomponent energy transfer to cause a peak in the
 $u$
due to the increased levels of diffusion and dissipation as the boundary is approached (Perot & Moin Reference Perot and Moin1995; Aronson et al.
Reference Aronson, Johansson and Löfdahl1997). In contrast, further from the wall (but within the source layer) the pressure–strain term has been reported to reverse sign (Perot & Moin Reference Perot and Moin1995; Aronson et al.
Reference Aronson, Johansson and Löfdahl1997; Bodart et al.
Reference Bodart, Cazalbou and Joly2010), indicating a transfer of energy from
 $u^{2}$
to
 $w^{2}$
. Importantly, this energy transfer occurs in a region where
 $u>w$
(and where viscous effects are significantly reduced) and so has previously been described as a ‘return to isotropy’. We stress that, here, ‘return to isotropy’ is used only to describe specifically this intercomponent energy transfer (from
 $u^{2}$
to
 $w^{2}$
, where
 $u>w$
) and does not encompass a temporal evolution in turbulent statistics towards isotropy. This effect has been argued to arise as a result of the blocking condition (Walker, Leighton & Garza-Rios Reference Walker, Leighton and Garza-Rios1996); as the boundary is approached, and
 $w$
is blocked, we observe an increasing anisotropy and it is this anisotropy that drives the energy transfer.
The results of Reynolds stress budgets reported by Bodart et al. (Reference Bodart, Cazalbou and Joly2010) also support the importance of the pressure–strain term. However, Bodart et al. (Reference Bodart, Cazalbou and Joly2010) suggest that energy transfer is not governed by viscous effects and stress anisotropy, but instead by the skewness of the velocity fluctuations normal to the boundary (
 $\overline{u_{3}^{\prime }u_{3}^{\prime }u_{3}^{\prime }}/w^{3}$
), giving rise to a net energy transfer from
 $w^{2}$
to
 $u^{2}$
in the boundary-affected region. Whilst the authors acknowledged the role of viscosity in acting to remove energy from the antisplat generation process, they suggest that this effect is minor in the context of their flow that displays strong inhomogeneity in the boundary-normal direction. A link between energy transfer and skewness of the boundary-normal velocity component was also proposed in the RDT study by Magnaudet (Reference Magnaudet2003). However, an underlying physical mechanism to explain how a far-field inhomogeneity gives rise to a transfer of energy from
 $w^{2}$
to
 $u^{2}$
in the boundary-affected region has not been proposed.
It has also been suggested that Reynolds number effects are significant in determining the statistical spatial structure of
 $u$
and
 $w$
(Hunt & Graham Reference Hunt and Graham1978), although recent studies have not identified a clear dependence on Reynolds number (Perot & Moin Reference Perot and Moin1995; Aronson et al.
Reference Aronson, Johansson and Löfdahl1997). Furthermore, Perot & Moin (Reference Perot and Moin1995) argue – in line with their proposal that viscous effects govern intercomponent energy transfer – that there is no significant Reynolds number dependency. However, the generally moderate range of Reynolds numbers (
 $Re_{T}$
between 50 and 425) used in these studies limit their applicability at higher Reynolds numbers. Hence, it remains unclear what effect, if any, Reynolds number plays in the interaction of zero-mean-shear turbulence with a solid impermeable boundary.
In this paper we study the interaction between oscillating-grid turbulence and a solid, planar boundary positioned below the grid, aligned with its plane parallel to the grid. The turbulent flow produced is homogeneous in planes parallel to the grid, but inhomogeneous in the grid-normal direction, with mean-flow components that are small compared to the fluctuations. Section 2 describes the experimental set-up and the techniques used to measure the flow. In § 3 we present experimental results characterising the turbulence produced in regions away from the boundary and in § 4 describe how the r.m.s. turbulent velocity components are affected by the presence of the boundary. In § 5 we present results describing the turbulent kinetic energy (TKE) in the boundary-affected region, including for the vertical flux of TKE and terms of the transport equations for the Reynolds stress tensor, which provide evidence of the mechanisms governing the interaction. In § 6 we discuss these mechanisms in light of the previously published literature on the interaction of zero-mean-shear turbulence with a solid boundary. Conclusions are made in § 7.
2 Experiments
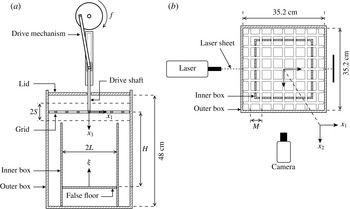
A schematic view of the experimental set-up is shown in figure 1. The experiments were conducted in a transparent acrylic box with internal dimensions
 $35.2~\text{cm}\times 35.2~\text{cm}\times 50~\text{cm}$
, henceforth denoted the ‘outer box’ (see figure 1). A rigid acrylic lid was suspended horizontally 2 cm below the top of the outer box, which was filled with a salt water solution of uniform density
 $\unicode[STIX]{x1D70C}=1.028~\text{g cm}^{-3}$
to the height of the lid’s underside (i.e. the total water depth was 48 cm). The salt used was NaCl. The grid was attached to the base of a stainless steel drive shaft (of 1 cm diameter) and suspended inside the outer box with the plane of the grid horizontal (see figure 1
a). The drive shaft passed through a circular hole of 2.6 cm diameter in the centre of the lid. The vertical oscillatory motion of the shaft and grid was driven by using a cam and linear bearing to convert the rotary motion of a motorised flywheel to reciprocating vertical motion of the drive shaft, as shown in figure 1(a). The frequency of the grid oscillation,
 $f$
, was controlled by using a potentiometer to vary the current across the motor, and was varied between 1.6 Hz and 5.4 Hz. The stroke,
 $S$
, defined as equal to the amplitude of the grid’s motion, was varied by changing the radius of the flywheel; strokes of
 $S=2.5~\text{cm}$
and 3.0 cm were used. These ranges for
 $f$
and
 $S$
are in line with those used in previous OGT studies (Thompson & Turner Reference Thompson and Turner1975; Hopfinger & Toly Reference Hopfinger and Toly1976; McDougall Reference McDougall1979; Hopfinger & Linden Reference Hopfinger and Linden1982; Wan Mohtar & Munro Reference Wan Mohtar and Munro2013).
Sketches showing the key components of the experimental set-up. (a) A side view showing the positioning of the reciprocating drive mechanism, the horizontal grid, the false floor and the inner and outer boxes. (b) A plan view showing the position of the inner box relative to the grid’s mesh, and the position of the camera relative to the vertical laser sheet. Also shown are the coordinate directions
 $(x_{1},x_{2},x_{3})$
and the vertical height normal to the false floor, denoted
 $\unicode[STIX]{x1D709}=H-x_{3}$
.

Two grids were used for this study, henceforth referred to as the coarse and fine grids. Both grids were of stainless steel construction, with a clearance of approximately 0.3 cm between the grid’s perimeter and the internal side walls of the outer box. The coarse grid consisted of an array of
 $7\times 7$
bars, with square cross-section of 1 cm width, and with mesh spacing
 $M=5~\text{cm}$
. Figure 1(b) shows a plan view of the coarse grid, and the corresponding mesh spacing (
 $M$
). This grid type has been widely used in previous OGT studies (Thompson & Turner Reference Thompson and Turner1975; Hopfinger & Toly Reference Hopfinger and Toly1976; Hopfinger & Linden Reference Hopfinger and Linden1982; Nokes Reference Nokes1988). The fine grid consisted of a
 $9\times 9$
array of bars, with square cross-section of 0.6 cm width, and mesh spacing
 $M=3.8$
cm. The corresponding solidities were 36.4 % and 28.7 % for the coarse and fine grids respectively. The edge conditions of both grids were chosen such that tank side walls were planes of symmetry – this condition is known to help reduce the magnitude of secondary flows (De Silva & Fernando Reference De Silva and Fernando1994).
A small degree of secondary mean flow is inherent in OGT experiments. However, the installation of an open-ended ‘inner box’ has previously been shown to reduce the large-scale circulations that give rise to these secondary flows (Hopfinger & Toly Reference Hopfinger and Toly1976; Dickinson & Long Reference Dickinson and Long1983). This approach was adopted here. Two interchangeable inner boxes were used, one for each grid. Each open-ended inner box was fixed centrally on plan at the base of the tank so that the vertical walls were equidistant between the outermost and second-outermost bars of the grid, as shown in figure 1(b) (for the coarse grid). The grid was then positioned so that when at the bottom of its stoke it was 1 cm above the top of the inner box (see figure 1
a). The inner boxes were constructed from 0.5 cm thick transparent acrylic with internal dimensions
 $24.5~\text{cm}\times 24.5~\text{cm}\times 26.5~\text{cm}$
(for the coarse grid) and
 $26.1~\text{cm}\times 26.1~\text{cm}\times 26.5~\text{cm}$
(for the fine grid). We will henceforth let
 $2L$
denote the internal width of the inner box, as shown in figure 1(a). Additional experiments (not reported here) indicated that the inner box reduced, but did not eliminate, the large-scale circulations – a similar effect was reported in the studies by Hopfinger & Toly (Reference Hopfinger and Toly1976) and Dickinson & Long (Reference Dickinson and Long1983). We also stress that the asymmetrical positioning of the grid at the top of the domain did not have a significant effect on the mean flow.
A solid false-floor plate, spanning the interior of the inner tank, was inserted parallel to the grid and at a depth
 $H$
below the grid’s mean position (see figure 1
a). It is known that OGT is anisotropic at distances less than
 $2.5M$
below the grid (Hopfinger & Toly Reference Hopfinger and Toly1976). Hence, values of
 $H$
ranging between
 $4M$
and
 $5.1M$
were used to ensure that the region where the turbulence was affected by the plate – henceforth referred to as the ‘boundary-affected region’ – did not extend into the near-grid, anisotropic region. A tight fit was ensured between the plate and the inner box by use of thin neoprene seals, set into the perimeter of the plate. As a result, the fluid flow between the edge of the plate and the inner tank was negligible.
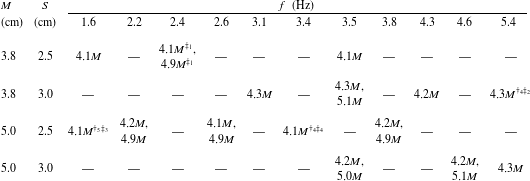
A summary of the experimental conditions considered. Each entry shows the value of
 $H$
(relative to the mesh size,
 $M$
) used for the various combinations of
 $M$
,
 $S$
and
 $f$
considered. Three of the experiments listed were repeated either
 $n=4$
or 5 times, which are indicated by the
 $\dagger _{n}$
superscript. In total 31 experiments were performed. A representative subset of the experiments are used in subsequent sections (to avoid an over saturation of points when plotting data), which we have indicated using the
 $\ddagger _{1}$
,
 $\ddagger _{2}$
,
 $\ddagger _{3}$
,
 $\ddagger _{4}$
superscripts; these four experimental conditions correspond to Reynolds numbers of
 $Re_{G}=2308$
, 6155, 2024 and 4218, respectively.

Here we report results from a total of 31 experiments. Table 1 shows the values of
 $H$
used for each combination of
 $M$
,
 $S$
and
 $f$
considered (see caption for details). The grid Reynolds number (
 $Re_{G}$
) is defined as
 $$\begin{eqnarray}Re_{G}=MSf/\unicode[STIX]{x1D708};\end{eqnarray}$$
varying
 $M$
,
 $S$
and
 $f$
as outlined in table 1, corresponded to
 $Re_{G}$
between 1520 and 8100, which is a relatively broad range in comparison to previous studies using OGT. For example, previous studies of the interaction of OGT with a boundary used
 $Re_{G}$
between 250 and 6660 (McDougall Reference McDougall1979; Brumley & Jirka Reference Brumley and Jirka1987; Hannoun et al.
Reference Hannoun, Fernando and List1988; Kit et al.
Reference Kit, Strang and Fernando1997). Further increases in
 $Re_{G}$
were not possible; proportionately more intense mean flows (in comparison to the magnitude of the fluctuations) are known to arise at higher grid oscillation frequency (McDougall Reference McDougall1979), such that turbulence produced is a poor approximation to zero-mean-shear turbulence.
Measurements of instantaneous fluid velocities were obtained using two-dimensional particle imaging velocimetry (PIV), applied to the vertical plane through the centre of the grid, in the region inside the inner box spanned by the grid and the false floor. Small, neutrally buoyant tracer particles (Pliolite with diameter range 75 to
 $125~\unicode[STIX]{x03BC}\text{m}$
) were added to the water volume and thoroughly stirred. A thin light sheet was used to illuminate the particles located within the central, vertical plane. The light sheet was produced by a 100 Hz pulsed laser (Dantec Dynamics NANO L Power 50–100, Class 4). As the grid oscillated, the motion of the illuminated particles, as they were advected by the turbulent flow, was recorded using a high-speed digital camera positioned to point horizontally into the inner tank’s interior, and aligned perpendicular to the plane of the vertical light sheet (see figure 1
b). The camera’s capture was synchronised with the pulse of the laser, so the images were recorded at 100 frames per second (at
 $1280\times 1024$
pixel resolution). PIV calculations were performed in Digiflow (Dalziel Reference Dalziel2006), using square interrogation windows of
 $13\times 13$
pixels, overlapped to achieve 8 pixel spacing between velocity vectors. This resulted in a physical spacing between velocity vectors of approximately 0.2 cm. Measurements were made only after the grid had been oscillating (at a fixed frequency and stroke) for 15 min to ensure turbulence was fully established. OGT is statistically stationary and so the statistical properties of the flow were analysed using time averages. Hence, in each experiment velocity data were captured for a period of 4 min; analysis of the data showed that the time-averaged mean and r.m.s. velocity components were well converged over this period.
The velocity data were calculated and analysed relative to the right-handed coordinate system
 $(x_{1},x_{2},x_{3})$
; here,
 $x_{3}$
denotes vertical depth below the mid-height of the grid’s oscillation, and
 $(x_{1},x_{2})$
are the horizontal coordinates relative to the centre of the grid (see figure 1). The corresponding velocity components are denoted
 $(u_{1},u_{2},u_{3})$
; the two components measured using the PIV set-up described above are
 $u_{1}(x_{1},x_{3},t)$
and
 $u_{3}(x_{1},x_{3},t)$
, in the central plane at
 $x_{2}=0$
. We use the conventional Reynolds decomposition
 $u_{i}=U_{i}+u_{i}^{\prime }$
, where
 $u_{i}^{\prime }(\boldsymbol{x},t)$
denote the fluctuating components and
 $U_{i}(\boldsymbol{x})=\overline{u_{i}}$
the time-averaged mean components (the overbar notation is used throughout to denote time averaging). In the calculation of second-order quantities, the raw measured values of
 $u_{1}$
and
 $u_{3}$
were used; we note that calculations of power spectra from time series at various points within the flow did not indicate the presence of harmonic-like signatures due to grid forcing in the measured velocity components. We also introduce the coordinate
 $\unicode[STIX]{x1D709}=H-x_{3}$
, which denotes vertical height above the false floor (see figure 1
a). This coordinate is used only for convenience when plotting and comparing data; we stress that all velocities (and derivatives of velocities) were calculated in terms of the right-handed coordinates
 $(x_{1},x_{2},x_{3})$
.
OGT has been used in numerous experimental studies and consistently found to produce turbulence with mean-flow components that are small compared to the fluctuations (McDougall Reference McDougall1979; Hopfinger & Linden Reference Hopfinger and Linden1982; Xuequan & Hopfinger Reference Xuequan and Hopfinger1986; Brumley & Jirka Reference Brumley and Jirka1987; Fernando & De Silva Reference Fernando and De Silva1993). For a grid consisting of square bars, the turbulence produced is well described by the standard model
 $$\begin{eqnarray}\displaystyle & \displaystyle u=C_{1}Sf\left(\frac{x_{3}}{M^{1/2}S^{1/2}}\right)^{-\unicode[STIX]{x1D6FE}}, & \displaystyle\end{eqnarray}$$
 $$\begin{eqnarray}\displaystyle & \displaystyle w=C_{2}u, & \displaystyle\end{eqnarray}$$
 $$\begin{eqnarray}\displaystyle & \displaystyle \overline{\ell }=C_{3}x_{3}, & \displaystyle\end{eqnarray}$$
 $$\begin{eqnarray}\displaystyle & \displaystyle \overline{u_{1}^{\prime }u_{2}^{\prime }}\approx \overline{u_{1}^{\prime }u_{3}^{\prime }}\approx 0, & \displaystyle\end{eqnarray}$$
 $\unicode[STIX]{x1D6FE}\approx 1$
. In the above
 $u\equiv (\overline{u_{1}^{\prime 2}})^{1/2}$
,
 $v\equiv (\overline{u_{2}^{\prime 2}})^{1/2}$
,
 $w\equiv (\overline{u_{3}^{\prime 2}})^{1/2}$
, which are henceforth used to denote time-averaged r.m.s. velocity components. Symmetry means that
 $u\approx v$
is assumed. We stress that the model is only valid for
 $x_{3}\gtrsim 2.5M$
. Previous studies have shown that the coefficients
 $\unicode[STIX]{x1D6FE}$
,
 $C_{1},C_{2}$
and
 $C_{3}$
are sensitive to the experimental configuration used, with values typically reported to be
 $\unicode[STIX]{x1D6FE}=0.8$
–1.5,
 $C_{1}=0.2$
–0.5,
 $C_{2}=1.1$
–1.4 and
 $C_{3}=0.1$
–0.25 (Thompson & Turner Reference Thompson and Turner1975; Hopfinger & Toly Reference Hopfinger and Toly1976; McDougall Reference McDougall1979; Hopfinger & Linden Reference Hopfinger and Linden1982; Atkinson, Damiani & Harleman Reference Atkinson, Damiani and Harleman1987; Nokes Reference Nokes1988; De Silva & Fernando Reference De Silva and Fernando1994; Kit et al.
Reference Kit, Strang and Fernando1997). The validity of (2.2) depends on a number of additional conditions (Fernando & De Silva Reference Fernando and De Silva1993): the grid solidity should be less than 40 %; the grid oscillation frequency should be less than 7 Hz; the grid should be designed to ensure that tank walls act as a plane of symmetry. All of these conditions are satisfied with the current apparatus. Data from preliminary testing of the apparatus (for
 $Re_{G}$
between 2050 and 8100), in the absence of the false-floor plate, indicated good agreement with the standard OGT model (2.2). The spatial structure of OGT of this type is well established and so we omit the presentation of these data here, and instead refer the reader to previous studies for illustrations (see for example Thompson & Turner Reference Thompson and Turner1975; Hopfinger & Toly Reference Hopfinger and Toly1976; Kit et al.
Reference Kit, Strang and Fernando1997).
3 Turbulence measurements within the bulk interior region
We now describe the turbulence measurements obtained from experiments with the false floor installed. Recall, the floor plate was positioned horizontally at a depth
 $H$
(between
 $4M$
and
 $5.1M$
) below the grid’s mean position (see figure 1
a). We show in § 4 that the boundary induced effects are mostly confined to a layer of height
 $\unicode[STIX]{x1D6FF}_{s}$
above the plate, wherein the turbulence is affected by the kinematic blocking condition. At this stage we loosely note that
 $\unicode[STIX]{x1D6FF}_{s}$
is of the order of the integral length scale of the turbulence; we define this relationship more closely in § 4.2. To begin, however, we first describe the spatial structure of the turbulence within the ‘bulk interior’ of the flow, corresponding to the region above the boundary-affected layer (i.e.
 $\unicode[STIX]{x1D709}\geqslant \unicode[STIX]{x1D6FF}_{s}$
) and below the near-grid, anisotropic region (i.e.
 $x_{3}\geqslant 2.5M$
).
We note that previous measurements of OGT have shown a dependence on the grid geometry (De Silva & Fernando Reference De Silva and Fernando1994), characterised by grid mesh size
 $M$
. Slight differences in the turbulence statistics are also observed in the experiments reported here, using mesh sizes
 $M=3.8$
cm and 5.0 cm. Hence, where differences in turbulent statistics were evident between the two grids used, the results have been identified separately.
3.1 Side wall effects
OGT is typically reported to be homogeneous and isotropic in planes parallel to the grid. However, the effect the tank side walls have on the turbulence is not well understood. To assess this effect we consider the degree of isotropy,
 $\langle w/u\rangle _{3}$
, across the horizontal width of the tank, spatially averaged over the vertical direction (between
 $\unicode[STIX]{x1D709}\geqslant \unicode[STIX]{x1D6FF}_{s}$
and
 $x_{3}\geqslant 2.5M$
), where
 $\langle \cdot \rangle _{3}$
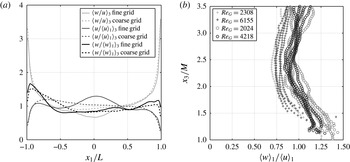
is henceforth used to denote the vertical average over this range. The results obtained are shown in figure 2(a), plotted against the horizontal coordinate
 $x_{1}$
, which has been scaled by the half-width of the inner box (
 $L$
). We stress that the data shown in figure 2(a) are representative of measurements at all depths
 $x_{3}$
within the bulk interior region and that the spatial averaging,
 $\langle \cdot \rangle _{3}$
, has been used here only to reduce minor scatter. The data indicate a slight dependency on the grid used and so have been shown separately – the solid lines correspond to data obtained using the fine grid, the broken lines to data using the coarse grid (see legend). To avoid over saturation, the data in figure 2(a) are profiles obtained by averaging the results from all the experiments performed for each grid type (12 experiments for the fine grid and 19 experiments for the coarse grid), over the range of
 $f$
and
 $S$
considered.
To further assess this effect, we also considered the magnitude of the individual r.m.s. velocity components across the horizontal width of the tank. That is, the measured r.m.s. velocity fields
 $u(x_{1},x_{3})$
and
 $w(x_{1},x_{3})$
were normalised by the corresponding profiles spatially averaged across the horizontal
 $x_{1}$
-direction, here denoted by
 $\langle u\rangle _{1}(x_{3})$
and
 $\langle w\rangle _{1}(x_{3})$
. A feature of this normalisation is to remove the effects of velocity decay in the
 $x_{3}$
-direction. The normalised fields were then spatially averaged in the
 $x_{3}$
-direction (i.e.
 $\langle (u/\langle u\rangle _{1})\rangle _{3}$
and
 $\langle (w/\langle w\rangle _{1})\rangle _{3}$
) to reduce minor scatter. The normalised r.m.s. velocity components are also shown in figure 2(a), also averaged over all experiments (by grid type).
Figure 2(a) shows that the tank side walls have a significant effect, rendering the turbulence anisotropic in regions close to the walls. However, across the central 50 % of the tank’s width, the data indicate that the turbulence is approximately isotropic and homogeneous. Hence, throughout the remainder of this paper our attention is focused on this central region and the side wall (anisotropic) regions are ignored in the calculation of turbulent statistics, so that all spatial averaging in the
 $x_{1}$
-direction (denoted
 $\langle \cdot \rangle _{1}$
) is henceforth taken over the central 50 % region, only. In contrast to the current results, McDougall (Reference McDougall1979) reported significant variations in turbulent velocities across a horizontal plane, even far from the side walls. However, the measurements of McDougall (Reference McDougall1979) were taken at
 $x_{3}=2M$
, in a region in which jets produced by the action of the oscillating grid are known to have not fully broken down (Hopfinger & Toly Reference Hopfinger and Toly1976; Atkinson et al.
Reference Atkinson, Damiani and Harleman1987). To our knowledge, the presence of anisotropic side wall regions has not previously been reported in studies of OGT.
(a) Normalised profiles
 $\langle u/\langle u\rangle _{1}\rangle _{3}$
,
 $\langle w/\langle w\rangle _{1}\rangle _{3}$
(homogeneity) and the isotropy parameter
 $\langle w/u\rangle _{3}$
, each spatially averaged in
 $x_{3}$
and plotted against the horizontal
 $x_{1}$
coordinate, which has been scaled by the half-width of the inner box,
 $L$
. Data obtained using the fine and coarse grids are shown separately (see legend). (b) Measurements of the isotropy parameter
 $\langle w\rangle _{1}/\langle u\rangle _{1}$
plotted against
 $x_{3}/M$
(which, recall, have been spatially averaged across the central 50 % of the inner box’s width). The data shown are from the representative subset of experiments (indicated by the
 $\ddagger$
superscripts in table 1) for
 $Re_{G}=2024$
, 2308, 4218 and 6155 (see legend). For each
 $Re_{G}$
, data from the
 $n$
repeats are shown, where
 $n=2$
, 4 or 5 (see table 1). The data obtained using the coarse and fine grids are shown separately, indicated by the circles and crosses respectively.

3.2 Degree of isotropy
The horizontally averaged isotropy parameter,
 $\langle w\rangle _{1}/\langle u\rangle _{1}$
, is shown in figure 2(b), plotted against
 $x_{3}/M$
, and is approximately constant and close to 1 within the bulk interior region (
 $\unicode[STIX]{x1D709}\geqslant \unicode[STIX]{x1D6FF}_{s}$
,
 $x_{3}\geqslant 2.5M$
). There is a slight dependency on grid type, and so the data obtained using the fine and coarse grids are shown separately (see figure caption). For the coarse grid,
 $\langle w\rangle _{1}/\langle u\rangle _{1}\approx 1$
, however for the fine grid,
 $\langle w\rangle _{1}/\langle u\rangle _{1}<1$
and slowly tend to 1 as
 $x_{3}$
increases. The data do not show any clear dependence on Reynolds number,
 $Re_{G}$
. We note that the magnitudes of these data are slightly lower than in the literature (for example,
 $\langle w\rangle _{1}/\langle u\rangle _{1}\approx 1.1{-}1.4$
in Hopfinger & Toly Reference Hopfinger and Toly1976; Hopfinger & Linden Reference Hopfinger and Linden1982; De Silva & Fernando Reference De Silva and Fernando1994; Kit et al.
Reference Kit, Strang and Fernando1997). This is most likely a result of excluding the anisotropic side wall regions in the current results, where the ratio
 $w/u$
is significantly larger (see figure 2
a).
3.3 Spatial decay of the r.m.s. velocity components
A defining aspect of OGT is the decrease in magnitude of the r.m.s. velocity components with increasing depth below the grid. In § 2 we noted that in the absence of the floor plate the measured r.m.s. velocity components are well described by the standard model (2.2). With the plate inserted, the measurements of
 $u$
and
 $w$
exhibited a similar spatial decay away from the grid and so again we sought to fit to the data power laws of the form
 $$\begin{eqnarray}\displaystyle & \displaystyle u=C_{u}Sf\left(\frac{x_{3}}{M^{1/2}S^{1/2}}\right)^{-\unicode[STIX]{x1D6FE}_{u}}, & \displaystyle\end{eqnarray}$$
 $$\begin{eqnarray}\displaystyle & \displaystyle w=C_{w}Sf\left(\frac{x_{3}}{M^{1/2}S^{1/2}}\right)^{-\unicode[STIX]{x1D6FE}_{w}}, & \displaystyle\end{eqnarray}$$
 $\unicode[STIX]{x1D709}\geqslant \unicode[STIX]{x1D6FF}_{s}$
,
 $x_{3}\geqslant 2.5M$
. For each experiment a single value of each of the coefficients
 $C_{u}$
,
 $C_{w}$
and exponents
 $\unicode[STIX]{x1D6FE}_{u}$
,
 $\unicode[STIX]{x1D6FE}_{w}$
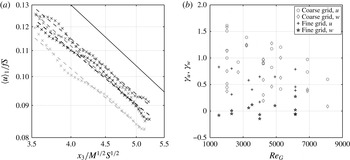
were obtained using a regression best fit. Figure 3(a) shows typical examples of the regressions fits applied to measurements of the r.m.s. velocity component
 $u$
; the results are shown for four separate experiments, but performed under nominally identical conditions with
 $Re_{G}=4218$
. The goodness of fit and degree of scatter evident for these data are representative of all the experiments. A similar goodness of fit (and scatter) were found for the vertical r.m.s. velocity component (
 $w$
). The fitted values of
 $\unicode[STIX]{x1D6FE}_{u}$
and
 $\unicode[STIX]{x1D6FE}_{w}$
, for each of the 31 experiments, are shown in figure 3(b), plotted against corresponding Reynolds number
 $Re_{G}$
. Figure 3(b) indicates that the fitted decay exponents exhibit significant departure in magnitude relative to the idealised model (
 $\unicode[STIX]{x1D6FE}_{u}=\unicode[STIX]{x1D6FE}_{w}=1$
), with no apparent dependence on
 $Re_{G}$
; this effect is most notable for the vertical r.m.s. velocity component, and when the fine grid was used. Moreover, the data in figure 3(b) show that repeating experiments under nominally identical conditions can result in variations in the resulting decay exponent. This is not unexpected; for example, McKenna & McGillis (Reference McKenna and McGillis2004) showed that the magnitude of turbulent fluctuations may vary by as much as 15 % from separate experiments performed under the same conditions.
Plots showing the results of fitting the decay laws in (3.1) to the experimental data. (a) Measurements of
 $u$
(crosses) compared with the corresponding regression best fit of (3.1a
) (broken lines). The results are shown from four separate experiments, but each performed under nominally identical conditions with
 $Re_{G}=4218$
. The fits were performed in the bulk interior region (with
 $x_{3}>2.5M$
and
 $\unicode[STIX]{x1D709}>\unicode[STIX]{x1D6FF}_{s}$
). For comparison, a decay exponent equal to 1 is also shown, by the solid line. (b) The fitted exponents
 $\unicode[STIX]{x1D6FE}_{u}$
,
 $\unicode[STIX]{x1D6FE}_{w}$
from each of the 31 experiments, plotted against grid Reynolds number
 $Re_{G}$
.

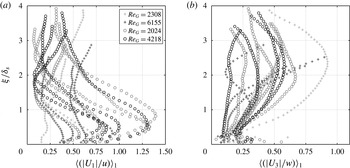
Plots showing the inverse turbulence intensities
 $\langle |U_{1}|/u\rangle _{1}$
and
 $\langle |U_{3}|/w\rangle _{1}$
plotted against height above the plate
 $\unicode[STIX]{x1D709}$
, which has been scaled by the
 $\unicode[STIX]{x1D6FF}_{s}$
, the thickness of the boundary-affected region. The data shown are from the representative subset of experiments (indicated by the
 $\ddagger$
superscripts in table 1) for
 $Re_{G}=2024$
, 2308, 4218 and 6155 (see legend in (a)). For each
 $Re_{G}$
, data from the
 $n$
repeats are shown, where
 $n=2$
, 4 or 5 (see table 1).
3.4 Mean flow
The mean flow is an integral aspect of OGT and, as noted in § 2, the presence of the inner box reduced but did not eliminate the large circulations that give rise to the mean flow. The mean flow within OGT has been studied in detail in numerous previous studies (see for example McDougall Reference McDougall1979; De Silva & Fernando Reference De Silva and Fernando1994; Dohan & Sutherland Reference Dohan and Sutherland2002; McKenna & McGillis Reference McKenna and McGillis2004), and the qualitative characteristics of the mean flow observed with our apparatus are little different to those reported in these studies. In particular, the mean flow is not symmetrical, being most intense close to the grid (and tank walls) and decaying with distance below the grid. Plots showing typical mean-flow fields observed in OGT can be found, for example, in McKenna & McGillis (Reference McKenna and McGillis2004).
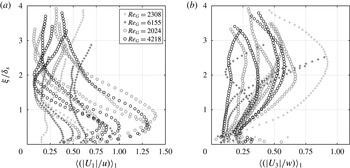
The effect the presence of the floor plate had on the magnitude of the secondary flow was assessed using the inverse turbulence intensities
 $\langle |U_{1}|/u\rangle _{1}$
and
 $\langle |U_{3}|/w\rangle _{1}$
(as previously used by Variano & Cowen Reference Variano and Cowen2008), which are shown in figure 4 plotted against scaled height
 $\unicode[STIX]{x1D709}/\unicode[STIX]{x1D6FF}_{s}$
above the plate. Recall that
 $\unicode[STIX]{x1D6FF}_{s}$
denotes a thin layer adjacent to the plate in which the boundary induced effects, on the turbulence statistics, are mostly confined within. As the plate surface at
 $\unicode[STIX]{x1D709}=0$
is approached, the vertical intensity
 $\langle |U_{3}|/w\rangle _{1}$
is reduced towards zero, whereas the horizontal intensity
 $\langle |U_{1}|/u\rangle _{1}$
typically exhibits an increase to a peak value, before reducing at the boundary. Note that figure 4 indicates that the measured intensities
 $\langle |U_{1}|/u\rangle _{1}$
and
 $\langle |U_{3}|/w\rangle _{1}$
show no apparent dependence on
 $Re_{G}$
, over the range of
 $Re_{G}$
considered. Most importantly, figure 4 shows that in general the turbulence is of comparable or greater magnitude than mean flow components. Although the results indicate the presence of mean shear – such that the turbulence is not strictly zero-mean shear – the levels are sufficiently small in magnitude to allow meaningful comparisons to be made with previous studies based on zero-mean-shear conditions. The small levels of mean shear do result in production of TKE, although we will show in § 5.2 that the level of production is small.
4 Turbulence measurements in the boundary-affected region
We now focus attention on describing the turbulence characteristics (integral length scale and r.m.s. velocity components) in the boundary-affected region and compare our results to those available within the literature. The mechanisms that give rise to these results are explored in the subsequent sections.
4.1 Integral length scales
Estimates for integral length scales were obtained from the velocity measurements by computation of autocorrelation coefficients. We followed the approach used previously by Kit et al. (Reference Kit, Strang and Fernando1997) by defining the integral length scale as the integral of the autocorrelation function of
 $u_{1}^{\prime }(x_{1},x_{3},t)$
, over the spatial lag up to which the autocorrelation function first crosses zero. The autocorrelation function, at spatial lag
 $\unicode[STIX]{x1D712}$
, is defined as
 $$\begin{eqnarray}r_{u}(x_{3},t;\unicode[STIX]{x1D712})=\frac{c_{u}(x_{3},t;\unicode[STIX]{x1D712})}{c_{u}(x_{3},t;\unicode[STIX]{x1D712}=0)},\end{eqnarray}$$
where
 $$\begin{eqnarray}c_{u}(x_{3},t;\unicode[STIX]{x1D712})=\frac{1}{L}\int _{-L/2}^{L/2}u_{1}^{\prime }(x_{1},x_{3},t)u_{1}^{\prime }(x_{1}+\unicode[STIX]{x1D712},x_{3},t)\,\text{d}x_{1}.\end{eqnarray}$$
Recall,
 $L$
denotes the half-width of the inner box. The time-averaged integral length scale is then given by
 $$\begin{eqnarray}\overline{\ell }(x_{3})=\frac{1}{T}\int _{0}^{T}\int _{0}^{\unicode[STIX]{x1D712}_{0}}r_{u}(x_{3},t;\unicode[STIX]{x1D712})\,\text{d}\unicode[STIX]{x1D712}\,\text{d}t,\end{eqnarray}$$
where
 $\unicode[STIX]{x1D712}_{0}$
denotes the spatial lag at which the autocorrelation function first becomes zero and
 $T$
is the sampling period (which, recall, here was 4 min).
In previous studies of the interaction of zero-mean-shear turbulence with a boundary, a reference length scale
 $\ell _{0}$
has been used (Hunt & Graham Reference Hunt and Graham1978; Perot & Moin Reference Perot and Moin1995). In these studies the turbulence beyond a boundary-affected region is homogeneous with a corresponding constant value of integral length scale, and so naturally this far-field integral length scale was used for
 $\ell _{0}$
. The situation is potentially more complex for OGT, as the integral length scale
 $\overline{\ell }$
is expected to depend on
 $x_{3}$
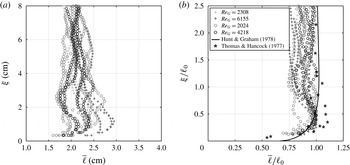
in the far field. Figure 5(a) shows the computed values of
 $\overline{\ell }$
obtained from the current data, which are plotted against height,
 $\unicode[STIX]{x1D709}$
, above the plate. Beyond the boundary-affected region, for
 $\unicode[STIX]{x1D709}>3~\text{cm}$
, the data for
 $\overline{\ell }$
are relatively constant, taking values between 2 and 2.5 cm, but exhibit a significant degree of scatter. The data at heights
 $\unicode[STIX]{x1D709}<3~\text{cm}$
, increase slightly, before rapidly reducing at
 $\unicode[STIX]{x1D709}\approx 0.75~\text{cm}$
. The level of scatter in the data made it difficult to identify a trend for
 $\unicode[STIX]{x1D709}>3~\text{cm}$
. Hence, the approach taken here was to define the reference integral length scale
 $\ell _{0}$
to be the peak value attained by
 $\overline{\ell }$
(in the near-boundary region). This length scale remains physically intuitive; at this distance from the boundary the maximum integral eddy size first feels the effect of the wall. No link between the magnitude of
 $\ell _{0}$
(or
 $\overline{\ell }$
) and Reynolds number
 $Re_{G}$
was observed.
We can more clearly consider the effect of the boundary on the integral length scales by considering the data shown in figure 5(b), of
 $\overline{\ell }/\ell _{0}$
plotted against scaled height
 $\unicode[STIX]{x1D709}/\ell _{0}$
. For
 $\unicode[STIX]{x1D709}<\ell _{0}$
integral length scales increase to a maximum, before reducing rapidly as the boundary is approached. However, the level of increase in
 $\overline{\ell }/\ell _{0}$
varies significantly between experiments and appears slightly larger for the fine grid than the coarse grid and so the data obtained using the coarse and fine grids are shown separately (see figure caption for details). A slight increase in
 $\overline{\ell }$
was also reported in the results of Thomas & Hancock (Reference Thomas and Hancock1977), and these data are also shown in Figure 5(b) (see legend).
(a) Computed values of the time-averaged integral length scale,
 $\overline{\ell }$
, plotted against height
 $\unicode[STIX]{x1D709}$
. (b) The same data but scaled by the reference integral length scale,
 $\ell _{0}$
, from each experiment. The data obtained using the coarse and fine grids are shown separately, indicated by the circles and crosses, respectively. The data shown are from the representative subset of experiments (indicated by the
 $\ddagger$
superscripts in table 1) for
 $Re_{G}=2024$
, 2308, 4218 and 6155 (see legend in (b)). For each
 $Re_{G}$
, data from the
 $n$
repeats are shown, where
 $n=2$
, 4 or 5 (see table 1). Also shown in (b) are corresponding experimental data from Thomas & Hancock (Reference Thomas and Hancock1977) and a prediction based on RDT by Hunt & Graham (Reference Hunt and Graham1978) (see legend).

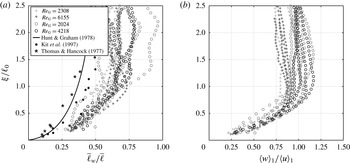
Figure 6(a) shows corresponding measurements of the time-averaged transverse integral length scale,
 $\overline{\ell }_{w}$
, which were obtained using (4.2), with
 $r_{w}$
used in place of
 $r_{u}$
, which is defined using (4.1) with
 $u_{3}^{\prime }$
in place of
 $u_{1}^{\prime }$
. In figure 6(a),
 $\overline{\ell }_{w}$
is scaled by
 $\overline{\ell }$
and plotted against
 $\unicode[STIX]{x1D709}/\ell _{0}$
, and shows that the far-field value of
 $\overline{\ell }_{w}$
is indicative of quasi-isotropic turbulence; recall that for isotropic turbulence
 $\overline{\ell }_{w}/\overline{\ell }=0.5$
(Pope Reference Pope2000).
 $\overline{\ell }_{w}$
deviates from its far-field value at
 $\unicode[STIX]{x1D709}\approx \ell _{0}$
, initially appearing to reduce to zero at the boundary in line with the prediction of inviscid RDT analysis of Hunt & Graham (Reference Hunt and Graham1978) and in approximate agreement with the results of Thomas & Hancock (Reference Thomas and Hancock1977) and Kit et al. (Reference Kit, Strang and Fernando1997) which are also shown in figure 6 (see legend). This reduction is expected at a solid boundary; at a distance
 $\unicode[STIX]{x1D709}<\ell _{0}$
from the boundary, eddies of size greater than
 $\unicode[STIX]{x1D709}$
will have been blocked, such that remaining eddies are of wavenumber
 $k_{w}>\unicode[STIX]{x1D709}^{-1}$
. Note that the rapid reduction in
 $\overline{\ell }_{w}$
within the boundary-affected region as a result of the blocking condition renders the integral length scales anisotropic. In addition, figures 5 and 6(a) indicate that both
 $\overline{\ell }/\ell _{0}$
and
 $\overline{\ell }_{w}/\overline{\ell }$
are independent of Reynolds number, over the Reynolds number range considered.
(a) Computed values of the time-averaged transverse integral length scale,
 $\overline{\ell }_{w}$
, scaled by
 $\overline{\ell }$
and plotted against scaled height
 $\unicode[STIX]{x1D709}/\ell _{0}$
. Also shown are corresponding experimental data from Thomas & Hancock (Reference Thomas and Hancock1977) and Kit et al. (Reference Kit, Strang and Fernando1997), and a prediction based on RDT by Hunt & Graham (Reference Hunt and Graham1978) (see legend). (b) Measurements of the degree of isotropy
 $\langle w\rangle _{1}/\langle u\rangle _{1}$
, plotted against normalised height
 $\unicode[STIX]{x1D709}/\ell _{0}$
. The data obtained using the coarse and fine grids are shown separately, indicated by the circles and crosses, respectively. In both plots the data shown are from the representative subset of experiments (indicated by the
 $\ddagger$
superscripts in table 1) for
 $Re_{G}=2024$
, 2308, 4218 and 6155 (see legend in (a)). For each
 $Re_{G}$
, data from the
 $n$
repeats are shown, where
 $n=2$
, 4 or 5 (see table 1).

4.2 Root-mean-square velocity data
Measured values of the degree of isotropy are shown in figure 6(b), plotted against scaled height
 $\unicode[STIX]{x1D709}/\ell _{0}$
. We note there is no apparent dependence on Reynolds number,
 $Re_{G}$
, but there is a slight dependence on the grid type used, and so the data obtained using coarse and fine grids are shown separately (see figure caption for details). These data can be used as an indicator of the thickness of the boundary-affected region by noting the point at which values deviate from those in the far field. Figure 6(b) shows a rapid increase in anisotropy occurs at
 $\unicode[STIX]{x1D709}/\ell _{0}\approx 1$
, departing from the far-field trend. This is in accordance with the results of the integral length scales shown in figures 5 and 6(a). We therefore conclude that the boundary-affected region extends up to
 $\unicode[STIX]{x1D709}/\ell _{0}\approx 1$
, and henceforth throughout the remainder of this paper assume that the boundary-affected region has thickness
 $\unicode[STIX]{x1D6FF}_{s}=\ell _{0}$
. We also note that the grid Reynolds number is approximately linearly proportional to the turbulent Reynolds number
 $Re\equiv u\overline{\ell }/\unicode[STIX]{x1D708}$
evaluated at a given distance below the grid; at the edge of the boundary-affected region
 $\unicode[STIX]{x1D709}=\unicode[STIX]{x1D6FF}_{s}$
we obtain values of turbulent Reynolds number between 35 and 485.
In order to consider the effect of the boundary on the r.m.s. velocity components for
 $\unicode[STIX]{x1D709}<\unicode[STIX]{x1D6FF}_{s}$
(recalling that for
 $\unicode[STIX]{x1D709}>\unicode[STIX]{x1D6FF}_{s}$
,
 $u$
and
 $w$
decay with increasing
 $x_{3}$
), we normalise results by corresponding values we would expect in the absence of the boundary. The expected values were determined from best fits of the power laws in (3.1), denoted by
 $u_{0}$
and
 $w_{0}$
, applied to the measurements of
 $\langle u\rangle _{1}$
and
 $\langle w\rangle _{1}$
in the region above the boundary-affected layer,
 $\unicode[STIX]{x1D709}>\unicode[STIX]{x1D6FF}_{s}$
(shown in figure 3
a). This method of normalisation is similar to that used by Hannoun et al. (Reference Hannoun, Fernando and List1988) and Kit et al. (Reference Kit, Strang and Fernando1997), who normalise data by local values measured in corresponding experiments conducted in the absence of a boundary.
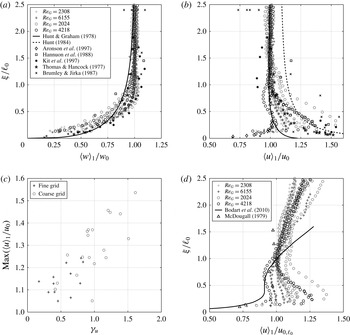
(a,b) Plots showing the scaled r.m.s. velocity components
 $\langle w\rangle _{1}/w_{0}$
and
 $\langle u\rangle _{1}/u_{0}$
, plotted against scaled height
 $\unicode[STIX]{x1D709}/\ell _{0}$
. The data shown are from the representative subset of experiments (indicated by the
 $\ddagger$
superscripts in table 1) for
 $Re_{G}=2024$
, 2308, 4218 and 6155 (see legend in (a), which applies to both plots). For each
 $Re_{G}$
, data from the
 $n$
repeats are shown, where
 $n=2$
, 4 or 5 (see table 1). Also shown are corresponding experimental data (Thomas & Hancock Reference Thomas and Hancock1977; Brumley & Jirka Reference Brumley and Jirka1987; Hannoun et al.
Reference Hannoun, Fernando and List1988; Aronson et al.
Reference Aronson, Johansson and Löfdahl1997; Kit et al.
Reference Kit, Strang and Fernando1997) and predictions based on RDT (Hunt & Graham Reference Hunt and Graham1978; Hunt Reference Hunt1984) (see legend). (c) Plot showing
 $\max (\langle u\rangle _{1}/u_{0})$
for each experiment, plotted against decay exponent
 $\unicode[STIX]{x1D6FE}_{u}$
(from (3.1a
)). Data are shown for all 31 experiments, with the data obtained using the coarse and fine grids shown separately (see legend). (d) Measurements of the r.m.s. velocity component
 $\langle u\rangle _{1}$
, plotted against scaled height
 $\unicode[STIX]{x1D709}/\ell _{0}$
. In this case,
 $\langle u\rangle _{1}$
has been normalised by the value of
 $u_{0}$
evaluated at
 $\unicode[STIX]{x1D709}=\ell _{0}$
, denoted
 $u_{0,\ell _{0}}$
. The data shown are from the representative subset of experiments, with
 $Re_{G}=2024$
, 2308, 4218 and 6155 (see legend). Also shown are corresponding experimental data from McDougall (Reference McDougall1979) and results of simulations by Bodart et al. (Reference Bodart, Cazalbou and Joly2010) (see legend).

Figures 7(a) and 7(b) show measurements of the normalised r.m.s. velocity components
 $\langle w\rangle _{1}/w_{0}$
and
 $\langle u\rangle _{1}/u_{0}$
, plotted against scaled height
 $\unicode[STIX]{x1D709}/\ell _{0}$
. For the boundary-normal component (
 $w$
), shown in figure 7(a), we observe a monotonic reduction of the normalised velocity as the boundary is approached, which is independent of Reynolds number. Quantitative agreement is obtained with a range of studies (see legend) investigating the interaction of zero-mean-shear turbulence (Thomas & Hancock Reference Thomas and Hancock1977; Hunt & Graham Reference Hunt and Graham1978; Brumley & Jirka Reference Brumley and Jirka1987; Hannoun et al.
Reference Hannoun, Fernando and List1988; Kit et al.
Reference Kit, Strang and Fernando1997). We stress that these previous studies cover a range of boundary types (density interface, free surface and solid boundary) and are for turbulence that is homogeneous beyond the boundary-affected region, as well as for spatially decaying turbulence.
In contrast, measurements of the boundary-tangential component (
 $u$
), shown in figure 7(b), exhibit a greater level of scatter and provide a lesser degree of quantitative agreement with previous studies. In the current results values of
 $u$
were amplified within the boundary-affected region, attaining a maximum at
 $\unicode[STIX]{x1D709}/\ell _{0}\approx 0.25$
before rapidly reducing as
 $\unicode[STIX]{x1D709}\rightarrow 0$
. Results show qualitative agreement with a range of studies utilising turbulence that spatially decays in the
 $x_{3}$
direction (Brumley & Jirka Reference Brumley and Jirka1987; Hannoun et al.
Reference Hannoun, Fernando and List1988; Kit et al.
Reference Kit, Strang and Fernando1997). In contrast, although the RDT proposed by Hunt & Graham (Reference Hunt and Graham1978) predicts amplification of the velocity component outside the viscous sub-layer, RDT under-predicts the amplification observed. The modified RDT proposed by Hunt (Reference Hunt1984) provides a better approximation of the amplification observed for the coarse grid. Poor agreement is obtained with the study of Aronson et al. (Reference Aronson, Johansson and Löfdahl1997). However, the results of Thomas & Hancock (Reference Thomas and Hancock1977) and Aronson et al. (Reference Aronson, Johansson and Löfdahl1997) were obtained from studies in which turbulence was homogeneous beyond the boundary-affected region. The results of Thomas & Hancock (Reference Thomas and Hancock1977) display features similar to the current results, however, we note their results have been questioned in light of frictional heating of the apparatus (Aronson et al.
Reference Aronson, Johansson and Löfdahl1997).
We stress that the amplification of
 $\langle u\rangle _{1}/u_{0}$
does not exhibit a clear dependence on Reynolds number, instead figure 7(c) shows that the maximum amplification of
 $\langle u\rangle _{1}/u_{0}$
is weakly correlated with the decay rate of the velocity component
 $\unicode[STIX]{x1D6FE}_{u}$
, which may mask any Reynolds number effects, over the fairly narrow range of Reynolds number considered here. This is an important point and goes some way to address the disparity in results previously reported in the literature. Specifically, the previous studies that have identified
 $u/u_{0}\leqslant 1$
are for the case where the far-field turbulence is homogeneous (Perot & Moin Reference Perot and Moin1995; Aronson et al.
Reference Aronson, Johansson and Löfdahl1997), which correspond to the case
 $\unicode[STIX]{x1D6FE}_{u}=\unicode[STIX]{x1D6FE}_{w}=0$
. In contrast, a number of studies that have predicted
 $u/u_{0}>1$
for
 $\unicode[STIX]{x1D709}<\unicode[STIX]{x1D6FF}_{s}$
are for the case of inhomogeneous far-field turbulence, with
 $\unicode[STIX]{x1D6FE}_{u},\unicode[STIX]{x1D6FE}_{w}\neq 0$
(Brumley & Jirka Reference Brumley and Jirka1987; Hannoun et al.
Reference Hannoun, Fernando and List1988; Kit et al.
Reference Kit, Strang and Fernando1997). As such, these data suggest that the trend of
 $u/u_{0}$
for
 $\unicode[STIX]{x1D709}<\unicode[STIX]{x1D6FF}_{s}$
depends crucially on the nature of the turbulence itself (homogeneous versus inhomogeneous); this effect is considered further in § 5. Note that there is a clear grid dependence in the data shown in figure 7(c), which can be understood by noting that the rate of spatial decay of r.m.s. velocity was lower in experiments using the fine grid than the coarse grid (see § 3.3 and figure 3
b).
In addition to the data normalisation described above using
 $u_{0}$
and
 $w_{0}$
, it is also informative to consider the measurements of
 $\langle u\rangle _{1}$
scaled by the characteristic value of
 $u_{0}$
at the edge of the boundary-affected region, at
 $\unicode[STIX]{x1D709}=\ell _{0}$
, henceforth denoted
 $u_{0,\ell _{0}}$
. Figure 7(d) shows the measurements of
 $\langle u\rangle _{1}$
scaled by
 $u_{0,\ell _{0}}$
, which indicate that, on average,
 $\langle u\rangle _{1}/u_{0,\ell _{0}}\gtrsim 1$
in the region for
 $\unicode[STIX]{x1D709}<\ell _{0}$
, before rapidly reducing as the boundary is approached. Bodart et al. (Reference Bodart, Cazalbou and Joly2010) also presented results using this method of normalisation that showed
 $u$
in the boundary-affected region increasing from the far-field trend and attaining an approximately constant value, before reducing rapidly to zero as the boundary is approached. In plotting the results of Bodart et al. (Reference Bodart, Cazalbou and Joly2010) – shown by the solid line in figure 7(d) – we have assumed that the thickness of the boundary-affected region is
 $\unicode[STIX]{x1D6FF}_{s}\approx \ell _{0}\approx 0.36l_{f}$
(based on their figure 3b), where
 $l_{f}$
denotes the characteristic length scale used by Bodart et al. (Reference Bodart, Cazalbou and Joly2010). Constant values of
 $u$
in the boundary-affected region were also obtained in the results of McDougall (Reference McDougall1979), which are also shown in figure 7(d) (see legend). Note however that given that both the studies of McDougall (Reference McDougall1979) and Bodart et al. (Reference Bodart, Cazalbou and Joly2010) feature
 $u$
decaying spatially with increasing distance normal to the source (in our notation, the
 $x_{3}$
-direction), a tendency for
 $u$
to attain a constant value in the boundary-affected region implies that
 $u$
is amplified relative to the far-field trend. Hence, the results from these studies are in agreement with our results shown in figure 7(b), but opposed to the results of Perot & Moin (Reference Perot and Moin1995) and Aronson et al. (Reference Aronson, Johansson and Löfdahl1997) from homogeneous turbulence.
5 Turbulent kinetic energy in the boundary-affected region
5.1 Turbulent kinetic energy and turbulent kinetic energy flux
We have established that, in the current experiments,
 $\langle u\rangle _{1}/u_{0}>1$
(such that
 $\langle u\rangle _{1}\gtrsim u_{0,\ell _{0}}$
) and
 $\langle w\rangle _{1}/w_{0}<1$
in the boundary-affected region. It is tempting to attribute these results to intercomponent energy transfer from the
 $w^{2}$
component to
 $u^{2}$
component. However, measurements of TKE, here defined as
 $\overline{q^{\prime 2}}=\overline{u_{i}^{\prime }u_{i}^{\prime }}/2\approx (2\overline{u_{1}^{\prime }u_{1}^{\prime }}+\overline{u_{3}^{\prime }u_{3}^{\prime }})/2$
(assuming
 $v\approx u$
), are shown in figure 8, plotted against scale height
 $\unicode[STIX]{x1D709}/\ell _{0}$
. Two methods of normalisation have been used: figure 8(a) shows
 $\langle \overline{q^{\prime 2}}\rangle _{1}$
scaled by
 $\overline{q_{0}^{\prime 2}}$
, which denotes the trend expected in the absence of the boundary, obtained from a best fit applied to the data above the boundary-affected region; figure 8(b) shows
 $\langle \overline{q^{\prime 2}}\rangle _{1}$
scaled by
 $\overline{q_{0,\ell _{0}}^{\prime 2}}$
, which denotes the value of
 $\overline{q_{0}^{\prime 2}}$
evaluated at the edge of the boundary-affected region, at
 $\unicode[STIX]{x1D709}=\ell _{0}$
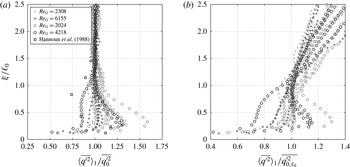
. Crucially, figure 8(a) shows that the values of
 $\langle u\rangle _{1}/u_{0}>1$
observed in figure 7(b) cannot be due only to intercomponent energy redistribution since there is also an increase in TKE within the boundary-affected region relative to the far-field trend. Figure 8(b) shows that on average TKE is in fact approximately constant across the boundary-affected region, but that for some experiments
 $\langle \overline{q^{\prime 2}}\rangle _{1}/\overline{q_{0,\ell _{0}}^{\prime 2}}>1$
. Figure 8 also shows that there is no clear Reynolds number dependency in the data, instead indicating that the TKE is typically higher in the data obtained using the coarse grid, compared to that obtained with the fine grid, which are shown separately (see figure caption for details).
(a) Measurements of TKE
 $\langle \overline{q^{\prime 2}}\rangle _{1}$
, plotted against scaled height
 $\unicode[STIX]{x1D709}/\ell _{0}$
. Here,
 $\langle \overline{q^{\prime 2}}\rangle _{1}$
has been normalised by the decay
 $\overline{q_{0}^{\prime 2}}$
based on the far-field trend. (b) Shows the same data but with
 $\langle \overline{q^{\prime 2}}\rangle _{1}$
scaled by the value of
 $\overline{q_{0}^{\prime 2}}$
at the height
 $\unicode[STIX]{x1D709}/\ell _{0}=1$
, denoted
 $\overline{q_{0,\ell _{0}}^{\prime 2}}$
. The data shown are from the representative subset of experiments (indicated by the
 $\ddagger$
superscripts in table 1) for
 $Re_{G}=2024$
, 2308, 4218 and 6155 (see legend in (a), which applies to both plots). For each
 $Re_{G}$
, data from the
 $n$
repeats are shown, where
 $n=2$
, 4 or 5 (see table 1). Also shown are data taken from Hannoun et al. (Reference Hannoun, Fernando and List1988).

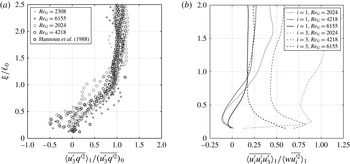
A likely contributory factor to the increase in TKE is a net production or advection of TKE in this region by the mean flow (which is shown to be the case in § 5.2 below), however the small levels of mean flow typically present in OGT suggest that another mechanism may be, at least partially, responsible for this result. We therefore consider the vertical flux of TKE produced by the oscillation of the grid. Measurements of the vertical flux of TKE,
 $\langle \overline{u_{3}^{\prime }q^{\prime 2}}\rangle _{1}$
, are shown in figure 9(a), plotted against scaled height
 $\unicode[STIX]{x1D709}/\ell _{0}$
. The data have been scaled by their expected values in the absence of the boundary, denoted
 $(\overline{u_{3}^{\prime }q^{\prime 2}})_{0}$
, obtained by finding a best fit of the form
 $\langle \overline{u_{3}^{\prime }q^{\prime 2}}\rangle _{1}\propto x_{3}^{-\unicode[STIX]{x1D6FE}}$
applied to the data above the boundary-affected region. This normalisation is in line with the method used in § 4.2. Under idealised conditions one would expect
 $\unicode[STIX]{x1D6FE}=3$
; however, given the deviations in
 $\unicode[STIX]{x1D6FE}_{u}$
and
 $\unicode[STIX]{x1D6FE}_{w}$
from 1, the average of the fitted values for
 $\unicode[STIX]{x1D6FE}$
was 2.4. Hannoun et al. (Reference Hannoun, Fernando and List1988) applied a similar method and reported
 $\langle \overline{u_{3}^{\prime }q^{\prime 2}}\rangle ^{1/3}/u\approx \text{const}$
.
The data in figure 9(a) show a significant reduction in energy flux in the boundary-affected region (
 $\unicode[STIX]{x1D709}/\ell _{0}<1$
) relative to the far-field trend and are in good agreement with measurements reported previously by Hannoun et al. (Reference Hannoun, Fernando and List1988), which are also shown in figure 9(a) (see legend). These results led Hannoun et al. (Reference Hannoun, Fernando and List1988) and Kit et al. (Reference Kit, Strang and Fernando1997) to conclude that the additional energy that would otherwise propagate past the false-floor plate (in its absence) was instead trapped in the boundary-affected region and was the cause of the amplified TKE measured in this region. The current results support this interpretation and indicate that this effect contributes to the observed values of
 $\langle \overline{q^{\prime 2}}\rangle _{1}/\overline{q_{0}^{\prime 2}}>1$
. However, the increase in
 $\langle \overline{q^{\prime 2}}\rangle _{1}/\overline{q_{0,\ell _{0}}^{\prime 2}}>1$
cannot be explained by turbulent transport, since in isolation the vertical flux of kinetic energy by turbulent transport would result in
 $\langle \overline{q^{\prime 2}}\rangle _{1}\approx \overline{q_{0,\ell _{0}}^{\prime 2}}$
; values of
 $\langle \overline{q^{\prime 2}}\rangle _{1}/\overline{q_{0,\ell _{0}}^{\prime 2}}>1$
would cause readjustment of the flow beyond the boundary-affected region and an increase in
 $\overline{q_{0}^{\prime 2}}$
. We stress that this effect is not a Reynolds number effect. Instead, in § 5.2 we show there is a significant increase in advection of
 $u^{2}$
by the mean flow into the central region of the tank for
 $\unicode[STIX]{x1D709}/\ell _{0}<0.3$
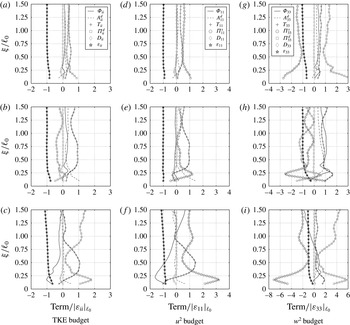
, and that this is a major contributing factor to the increase in TKE over this region.
To better understand the vertical flux of TKE in the boundary-affected region we have decomposed
 $\langle \overline{u_{3}^{\prime }q^{\prime 2}}\rangle _{1}$
into its component
 $\langle \overline{u_{3}^{\prime }u_{1}^{\prime 2}}\rangle _{1}$
,
 $\langle \overline{u_{3}^{\prime 3}}\rangle _{1}$
and in figure 9(b) plotted the correlation coefficients
 $\langle \overline{u_{3}^{\prime }u_{1}^{\prime 2}}\rangle _{1}/\langle wu^{2}\rangle _{1}$
and
 $\langle \overline{u_{3}^{\prime 3}}\rangle _{1}/\langle w^{3}\rangle _{1}$
against scaled height
 $\unicode[STIX]{x1D709}/\ell _{0}$
. We note that, as far as we are aware, these measurements are the first reported of this type for OGT. In figure 9(b) the notation
 $\langle \overline{u_{i}^{\prime }u_{i}^{\prime }u_{3}^{\prime }}\rangle _{1}/\langle w\overline{u_{i}^{\prime 2}}\rangle _{1}$
has been used (with the summation convention dropped) so that the correlation coefficients are given by
 $i=1$
and
 $i=3$
. To avoid oversaturation, the data shown are from only three Reynolds numbers (
 $Re_{G}=2024$
, 4218 and 6153) and each data profile (see figure legend) is an average of measurements taken from four (or five) repeated experiments performed under each of these conditions (see table 1 for details).
(a) Measurements of the vertical flux of TKE,
 $\langle \overline{u_{3}^{\prime }q^{\prime 2}}\rangle _{1}$
, plotted against scaled height
 $\unicode[STIX]{x1D709}/\ell _{0}$
. The data have been normalised by the trend expected in the absence of the floor plate, denoted
 $(\overline{u_{3}^{\prime }q^{\prime 2}})_{0}$
. The data shown are from the representative subset of experiments (indicated by the
 $\ddagger$
superscripts in table 1) for
 $Re_{G}=2024$
, 2308, 4218 and 6155 (see legend). For each
 $Re_{G}$
, data from the
 $n$
repeats are shown, where
 $n=2$
, 4 or 5 (see table 1). Also shown are data taken from Hannoun et al. (Reference Hannoun, Fernando and List1988). (b) Measurements of correlation coefficients
 $\langle \overline{u_{i}^{\prime }u_{i}^{\prime }u_{3}^{\prime }}\rangle _{1}/\langle w\overline{u_{i}^{\prime 2}}\rangle _{1}$
for
 $i=1$
and
 $i=3$
(with the summation convention dropped), plotted against scaled height
 $\unicode[STIX]{x1D709}/\ell _{0}$
. The data shown are from the representative subset of experiments, for
 $Re_{G}=2024$
, 4218 and 6155 (see legend).

The correlation coefficient
 $\langle \overline{u_{3}^{\prime 3}}\rangle _{1}/\langle w^{3}\rangle _{1}$
of the vertical flux of
 $w^{2}$
– which is the ‘skewness’ of
 $u_{3}^{\prime }$
– is shown in figure 9(b) (denoted by the broken lines), and is positive far from the boundary, which indicates a flux of energy away from the grid transported by turbulent fluctuations. As the boundary is approached we observe a gradual increase in magnitude of skewness at
 $\unicode[STIX]{x1D709}/\ell _{0}\approx 0.5$
, with a sharper increase at
 $\unicode[STIX]{x1D709}/\ell _{0}\approx 0.3$
, before attaining a maximum value close to the wall. Here an increasing positive skewness physically represents an increasing imbalance between energy associated with turbulent motions towards the boundary, which are increasingly energetic, relative to the energy of turbulent motions away from the boundary. There are two possible effects that could lead to a relative depletion of energy from the vertical component of the turbulent motions away from the plate. (i) It is possible that there is a net intercomponent energy transfer from
 $w^{2}$
to
 $u^{2}$
at the boundary. (ii) Alternatively, it is possible that energy of turbulent motions near the boundary is depleted by viscous effects (splat–antisplat imbalance). In isolation it is not possible to determine which effect is prevalent in this case.
The correlation coefficient
 $\langle \overline{u_{3}^{\prime }u_{1}^{\prime 2}}\rangle _{1}/wu^{2}$
, of the vertical flux of
 $u^{2}$
, is shown in figure 9(b) (by the solid lines), and is also positive far from the boundary, indicating a flux of energy away from the grid. In contrast to the vertical flux of
 $w^{2}$
, on approach to the boundary the vertical flux of
 $u^{2}$
is small but becomes negative, indicating that there is a small net flux of
 $u^{2}$
away from the boundary associated with antisplats. In light of the flux of
 $w^{2}$
, the negative flux of
 $u^{2}$
appears to suggest that the effect (i) (above) is prevalent at the boundary, such that antisplats have greater horizontal velocities than splats in the near-wall region as a result of intercomponent energy transfer. However, recall that over this region there was also an increase in
 $\langle \overline{q^{\prime 2}}\rangle _{1}/\overline{q_{0,\ell _{0}}^{\prime 2}}$
, shown in figure 8(b), due to advection by the mean flow; this is a major contributing cause to the more energetic antisplats found in the current results. Hence, it appears that the small upwards flux of
 $u^{2}$
observed for
 $\unicode[STIX]{x1D709}<0.5\ell _{0}$
here is not necessarily a result of (i), but is actually a result of a departure from the zero-mean-shear condition. Recall also that in this region
 $u>w$
(see figure 6
b). Hence, as the boundary is approached the vertical flux of TKE is dominated by trends in the vertical flux of
 $\overline{u_{1}^{\prime 2}}$
. Hence, it is this reversing orientation of vertical flux of
 $\langle \overline{u_{3}^{\prime }u_{1}^{\prime 2}}\rangle _{1}$
that results in the small upwards flux of
 $\langle \overline{u_{3}^{\prime }q^{\prime 2}}\rangle _{1}$
close to the boundary.
Overall, as a result of the blocking of the vertical flux of TKE we observe a net flux of energy into the boundary-affected region. This results in values
 $\langle u\rangle _{1}/u_{0}>1$
without the presence of intercomponent energy transfer, since the vertical flux of
 $u^{2}$
that would otherwise arise in the region occupied by the boundary is halted. This will constitute a major factor in the difference in results of
 $u/u_{0}$
and
 $w/w_{0}$
reported in the studies of Perot & Moin (Reference Perot and Moin1995) and Aronson et al. (Reference Aronson, Johansson and Löfdahl1997) when compared to studies utilising OGT; these studies represent fundamentally different conditions. Although we have not considered the transport of TKE by viscous or pressure effects here, they are considered in § 5.2 below and do not invalidate the previous conclusions.
5.2 Reynolds stress and turbulent kinetic energy balances
The steady form of the Reynolds stress transport equations may be written as (see Hinze Reference Hinze1975, p. 323)
 $$\begin{eqnarray}\displaystyle 0 & = & \displaystyle \underbrace{-U_{k}\frac{\unicode[STIX]{x2202}}{\unicode[STIX]{x2202}x_{k}}\overline{u_{i}^{\prime }u_{j}^{\prime }}}_{A_{ij}^{d}}\underbrace{-\overline{u_{j}^{\prime }u_{k}^{\prime }}\frac{\unicode[STIX]{x2202}U_{i}}{\unicode[STIX]{x2202}x_{k}}-\overline{u_{i}^{\prime }u_{k}^{\prime }}\frac{\unicode[STIX]{x2202}U_{j}}{\unicode[STIX]{x2202}x_{k}}}_{\unicode[STIX]{x1D6F7}_{ij}}\underbrace{-\frac{\unicode[STIX]{x2202}}{\unicode[STIX]{x2202}x_{k}}\overline{u_{i}^{\prime }u_{j}^{\prime }u_{k}^{\prime }}}_{T_{ij}}\nonumber\\ \displaystyle & & \displaystyle \underbrace{-\frac{1}{\unicode[STIX]{x1D70C}}\left(\frac{\unicode[STIX]{x2202}}{\unicode[STIX]{x2202}x_{i}}\overline{p^{\prime }u_{j}^{\prime }}+\frac{\unicode[STIX]{x2202}}{\unicode[STIX]{x2202}x_{j}}\overline{p^{\prime }u_{i}^{\prime }}\right)}_{\unicode[STIX]{x1D6F1}_{ij}^{d}}+\underbrace{\frac{1}{\unicode[STIX]{x1D70C}}\overline{p^{\prime }\left(\frac{\unicode[STIX]{x2202}u_{j}^{\prime }}{\unicode[STIX]{x2202}x_{i}}+\frac{\unicode[STIX]{x2202}u_{i}^{\prime }}{\unicode[STIX]{x2202}x_{j}}\right)}}_{\unicode[STIX]{x1D6F1}_{ij}^{s}}+\underbrace{\unicode[STIX]{x1D708}\frac{\unicode[STIX]{x2202}^{2}\overline{u_{i}^{\prime }u_{j}^{\prime }}}{\unicode[STIX]{x2202}x_{k}\unicode[STIX]{x2202}x_{k}}}_{D_{ij}}\underbrace{-2\unicode[STIX]{x1D708}\overline{\frac{\unicode[STIX]{x2202}u_{i}^{\prime }}{\unicode[STIX]{x2202}x_{k}}\frac{\unicode[STIX]{x2202}u_{j}^{\prime }}{\unicode[STIX]{x2202}x_{k}}}}_{\unicode[STIX]{x1D700}_{ij}}.\qquad\end{eqnarray}$$
The terms
 $A_{ij}^{d}$
and
 $\unicode[STIX]{x1D6F7}_{ij}$
denote, respectively, transport and production due to the mean flow;
 $T_{ij}$
and
 $\unicode[STIX]{x1D6F1}_{ij}^{d}$
denote, respectively, transport by velocity and pressure fluctuations;
 $\unicode[STIX]{x1D6F1}_{ij}^{s}$
is the intercomponent energy redistribution due to the correlation between fluctuating strain and pressure fields;
 $D_{ij}$
and
 $\unicode[STIX]{x1D700}_{ij}$
denote molecular diffusion and viscous dissipation. Recall that within the inner box’s central region – the region of interest – the turbulence is approximately homogeneous on horizontal planes and so
 $\overline{u_{i}^{\prime }u_{j}^{\prime }}\approx 0$
for
 $i\neq j$
. Hence, we only consider the transport equations for the Reynolds stresses
 $\overline{u_{1}^{\prime }u_{1}^{\prime }}$
,
 $\overline{u_{2}^{\prime }u_{2}^{\prime }}$
and
 $\overline{u_{3}^{\prime }u_{3}^{\prime }}$
(i.e.
 $u^{2}$
,
 $v^{2}$
and
 $w^{2}$
), and the transport equation for TKE which is obtained from the trace of (5.1) noting that
 $\overline{u_{i}^{\prime }u_{i}^{\prime }}/2=\overline{q^{\prime 2}}$
denotes the TKE. We note that, as far as we are aware, the current results are the first attempt to evaluate (5.1) using data obtained from OGT.
A direct evaluation of (5.1) was not possible, requiring instantaneous measurements of pressure fluctuations and of all three velocity components. Hence, a number of simplifying assumptions were made to allow estimation of certain terms: (i) based on the symmetry of the experimental set-up, the time-averaged statistical properties of the flow were assumed to be symmetric in the
 $x_{1}$
- and
 $x_{2}$
-directions. (ii) The turbulence was assumed to be approximately homogeneous in horizontal planes. (iii) The approximations
 $\overline{(\unicode[STIX]{x2202}u_{1}^{\prime }/\unicode[STIX]{x2202}x_{2})^{2}}\approx 2\overline{(\unicode[STIX]{x2202}u_{1}^{\prime }/\unicode[STIX]{x2202}x_{1})^{2}}$
and
 $\overline{(\unicode[STIX]{x2202}u_{3}^{\prime }/\unicode[STIX]{x2202}x_{2})^{2}}\approx \overline{(\unicode[STIX]{x2202}u_{3}^{\prime }/\unicode[STIX]{x2202}x_{1})^{2}}$
were used in calculation of the dissipation terms – relationships which are known to hold for homogeneous, isotropic turbulence (see Pope Reference Pope2000, p. 134). Under these assumptions, the relevant terms in (5.1) involving velocity components (and derivatives of velocity components) were calculated from the two-dimensional PIV data obtained in the central
 $(x_{1},x_{3})$
-plane. When evaluating the velocity derivatives, the no-slip and impermeability conditions (
 $u_{i}=0$
) were applied at
 $\unicode[STIX]{x1D709}=0$
. We note that limitations in the resolution of the PIV method (a resolution of approximately 0.2 cm) is insufficient to capture all scales of turbulent motion and may lead to underestimation of some terms (primarily the diffusion
 $D_{ij}$
and dissipation
 $\unicode[STIX]{x1D700}_{ij}$
terms) in (5.1).
It was not possible to directly estimate the terms
 $\unicode[STIX]{x1D6F1}_{ij}^{s}$
and
 $\unicode[STIX]{x1D6F1}_{ij}^{d}$
involving pressure fluctuations. These terms were instead estimated from a balance of the remaining terms in (5.1), the approach used previously by Aronson et al. (Reference Aronson, Johansson and Löfdahl1997). Firstly, noting that
 $\unicode[STIX]{x1D6F1}_{ii}^{s}=0$
(by continuity) allows estimation of
 $\unicode[STIX]{x1D6F1}_{ii}^{d}$
from a balance of the remaining terms in the (5.1) for
 $i=j$
. Secondly, using the property that the turbulence is approximately homogeneous in horizontal planes means that
 $\unicode[STIX]{x1D6F1}_{11}^{d}\approx \unicode[STIX]{x1D6F1}_{22}^{d}\approx 0$
and
 $\unicode[STIX]{x1D6F1}_{ii}^{d}\approx \unicode[STIX]{x1D6F1}_{33}^{d}$
, which enables estimation of
 $\unicode[STIX]{x1D6F1}_{11}^{s}$
and
 $\unicode[STIX]{x1D6F1}_{33}^{s}$
from (5.1) for
 $\overline{u_{1}^{\prime }u_{1}^{\prime }}$
and
 $\overline{u_{3}^{\prime }u_{3}^{\prime }}$
.
The scheme outlined above inevitably produced significant scatter in the results. In an effort to reduce scatter we show here the results for three experimental conditions, with
 $Re_{G}=2024$
, 4218 and 6155 (spanning the range of Reynolds numbers considered here). Each experiment was repeated four (or five) times (see table 1) and the results obtained from each were averaged, which are shown in figure 10, plotted against scaled height
 $\unicode[STIX]{x1D709}/\ell _{0}$
. Note also that the data shown are averaged in the
 $x_{1}$
-direction (i.e.
 $\langle \cdot \rangle _{1}$
). In figure 10 the left-hand column of data show terms from the TKE budget equation (
 $\overline{u_{i}^{\prime }u_{i}^{\prime }}$
), while the central and right-hand columns of data show the terms from the
 $u^{2}$
and
 $w^{2}$
budgets. To facilitate comparison, the data have been normalised by the magnitude of the corresponding component of energy dissipation evaluated at the height
 $\unicode[STIX]{x1D709}=\ell _{0}$
(denoted
 $|\unicode[STIX]{x1D700}_{ii}|_{\ell _{0}}$
,
 $|\unicode[STIX]{x1D700}_{11}|_{\ell _{0}}$
,
 $|\unicode[STIX]{x1D700}_{33}|_{\ell _{0}}$
in the caption and figure labels). The top, second and third row of data in figure 10 are for
 $Re_{G}=2024$
, 4218 and 6155, respectively. We now consider separately the data for the budgets for TKE,
 $u^{2}$
and
 $w^{2}$
.
Measurements of terms in the transport equations (5.1) for TKE (a–c), for
 $u^{2}$
(d–f), and for
 $w^{2}$
(g–i). Different symbols have been used to denote each term, which are shown in the legends in the top row of plots. Each term has been spatially averaged in the
 $x_{1}$
-direction (i.e.
 $\langle \cdot \rangle _{1}$
), and has been normalised by the magnitude of the corresponding component of dissipation evaluated at the edge of the boundary-affected region,
 $|\unicode[STIX]{x1D700}_{ij}|_{\ell _{0}}$
. Panels (a,d,g) correspond to a grid Reynolds number of
 $Re_{G}=2024$
, (b,e,h) to
 $Re_{G}=4218$
and (c,f,i) to
 $Re_{G}=6155$
. Recall that
 $\unicode[STIX]{x1D6F1}_{ii}^{s}=0$
by continuity and that
 $\unicode[STIX]{x1D6F1}_{11}^{d}\approx 0$
, since turbulence is approximately homogeneous on horizontal planes.

5.2.1 Terms of the TKE budget
The terms for the TKE budget are shown in figure 10(a–c), at the three Reynolds numbers. Within the boundary-affected region (
 $\unicode[STIX]{x1D709}/\ell _{0}<1$
), but for
 $\unicode[STIX]{x1D709}/\ell _{0}>0.3$
, the data show that the budget is dominated by comparatively high levels of turbulent transport (
 $T_{ii}$
). Over this region
 $T_{ii}$
increases in magnitude, indicating a source of energy in this region. This is a direct result of the blocking of vertical energy flux – note that
 $T_{ii}$
is the derivative of TKE flux previously considered in § 5.1. Across this region dissipation (
 $\unicode[STIX]{x1D700}_{ii}$
) is approximately constant. Hence, it appears that the increase in
 $T_{ii}$
is the primary cause of the increase in
 $\langle \overline{q^{\prime 2}}\rangle _{1}/\overline{q_{0}^{\prime 2}}$
observed over the region
 $0.3<\unicode[STIX]{x1D709}/\ell _{0}<1$
, shown in figure 8(a). In contrast, for
 $\unicode[STIX]{x1D709}/\ell _{0}<0.3$
the data show that
 $T_{ii}$
clearly reduces to approximately zero as the energy flux close to the wall is approximately zero. As a consequence, turbulent transport no longer acts as a source of energy in this near-boundary region.
Within the boundary-affected region we also observe an increase in
 $\unicode[STIX]{x1D6F1}_{ii}^{d}$
for
 $\unicode[STIX]{x1D709}/\ell _{0}<0.3$
, and at the higher two Reynolds numbers the data exhibit a distinct peak before reducing as the boundary is approached. The results for
 $\unicode[STIX]{x1D6F1}_{ii}^{d}$
show good qualitative agreement with data reported in the previous studies by Perot & Moin (Reference Perot and Moin1995) and Bodart et al. (Reference Bodart, Cazalbou and Joly2010). The profile of
 $\unicode[STIX]{x1D6F1}_{ii}^{d}$
across the boundary-affected region indicates that higher instantaneous pressure is correlated with turbulent fluctuations incident towards the boundary; that is, here the turbulence is homogeneous only in planes parallel to the grid, and so
 $\unicode[STIX]{x1D6F1}_{ii}^{d}=\unicode[STIX]{x1D6F1}_{33}^{d}$
(note that in figure 10, the magnitudes of
 $\unicode[STIX]{x1D6F1}_{ii}^{d}$
and
 $\unicode[STIX]{x1D6F1}_{33}^{d}$
are not the same as they have been normalised differently, by
 $|\unicode[STIX]{x1D700}_{ii}|_{\ell _{0}}$
and
 $|\unicode[STIX]{x1D700}_{33}|_{\ell _{0}}$
, respectively). This correlation between high pressure events and fluid elements incident towards the boundary can be understood by considering that splats are more energetic than antisplats, so result in a greater instantaneous pressure. For
 $\unicode[STIX]{x1D709}/\ell _{0}\lesssim 0.2$
, the data for
 $\unicode[STIX]{x1D6F1}_{ii}^{d}$
reduce as the transport of pressure fluctuations by the turbulent velocity must tend to zero at the limit of the wall.
The data for dissipation of TKE (
 $\unicode[STIX]{x1D700}_{ii}$
) show that TKE is lost throughout the domain (due to deformation work done by viscous stresses). Previous studies (using DNS) have suggested that TKE dissipation increases significantly as the boundary is approached (Perot & Moin Reference Perot and Moin1995; Bodart et al.
Reference Bodart, Cazalbou and Joly2010), however, the PIV data reported here did not resolve scales sufficiently close to the boundary to validate this proposal. In addition, figure 10 indicates that the transport of turbulent kinetic energy by viscous diffusion (
 $D_{ii}$
) is negligible beyond the viscous sublayer (
 $\unicode[STIX]{x1D709}/\ell _{0}>0.3$
). However, in previous studies
 $D_{ii}$
has been shown to increase very close to the wall due to the rapid reduction of velocities in this region (Perot & Moin Reference Perot and Moin1995; Bodart et al.
Reference Bodart, Cazalbou and Joly2010). Hence, viscous diffusion provides a source of turbulent kinetic energy to sustain turbulence in the near-wall region, sourced from the outer viscous sub-layer and blocking layer.
The results show that
 $\unicode[STIX]{x1D6F7}_{ii}$
(responsible for extraction of kinetic energy by turbulent fluctuations from the mean flow) is small except for the case
 $Re_{G}=6155$
. That is, for the low and medium Reynolds number cases, the total gain of TKE from the mean flow is negligible. The increase in
 $\unicode[STIX]{x1D6F7}_{ii}$
(for
 $\unicode[STIX]{x1D709}/\ell _{0}<0.6$
) evident at
 $Re_{G}=6155$
, indicate a Reynolds number effect, although it is unclear if this is a result of mechanisms governing the interaction of turbulence with the plate or not. However,
 $A_{ii}^{d}$
(responsible for the transport of kinetic energy by the mean flow) exhibits a significant increase in magnitude for
 $\unicode[STIX]{x1D709}/\ell _{0}<0.25$
; this is most likely a contributing factor to the increase in
 $\langle \overline{q^{\prime 2}}\rangle _{1}/\overline{q_{0,\ell _{0}}^{\prime 2}}$
observed as the boundary is approached (shown previously in figure 8
b), together with the upwards flux of
 $u^{2}$
discussed in § 5.1. We conclude that although the effects of convection and production have not been eliminated in the current apparatus, their effects are comparatively small overall.
5.2.2 Terms of the Reynolds stress budget for
 $u^{2}$

The terms of the transport equation for
 $\overline{u_{1}^{\prime }u_{1}^{\prime }}=u^{2}$
are shown in figure 10(d–f), which exhibit similar traits to the data for the TKE budget (discussed above). The turbulent transport term,
 $T_{11}$
, has a significant effect; note that for turbulence that is approximately homogeneous in horizontal planes,
 $T_{11}\approx \unicode[STIX]{x2202}\overline{u_{1}^{\prime }u_{1}^{\prime }u_{3}^{\prime }}/\unicode[STIX]{x2202}x_{3}$
(i.e. the vertical flux of
 $u^{2}$
), since
 $\unicode[STIX]{x2202}\overline{u_{1}^{\prime }u_{1}^{\prime }u_{1}^{\prime }}/\unicode[STIX]{x2202}x_{1}$
,
 $\unicode[STIX]{x2202}\overline{u_{1}^{\prime }u_{1}^{\prime }u_{2}^{\prime }}/\unicode[STIX]{x2202}x_{2}\approx 0$
. The increase in
 $T_{11}$
evident in figure 10(d–f) for
 $0.3<\unicode[STIX]{x1D709}/\ell _{0}<1$
is due to the presence of the floor plate, which acts to halt the vertical flux of TKE. A similar, but less significant, increase in
 $T_{11}$
was found by Bodart et al. (Reference Bodart, Cazalbou and Joly2010). In contrast, in the studies by Perot & Moin (Reference Perot and Moin1995) and Aronson et al. (Reference Aronson, Johansson and Löfdahl1997) the
 $T_{11}$
term was not a dominant component of the transport equation, however this difference is reconciled due to the homogeneous nature of turbulence in the
 $x_{3}$
-direction used in these studies.
The pressure–strain term,
 $\unicode[STIX]{x1D6F1}_{11}^{s}$
, is also significant. For
 $\unicode[STIX]{x1D709}>\ell _{0}$
,
 $\unicode[STIX]{x1D6F1}_{11}^{s}$
is small and approximately constant, due primarily to the constant degree of isotropy in this region (see figure 6); where the turbulence is approximately isotropic above the boundary-affected region, we expect little net intercomponent energy transfer. However for
 $0.3<\unicode[STIX]{x1D709}/\ell _{0}<1$
, the data for
 $\unicode[STIX]{x1D6F1}_{11}^{s}$
show a gradual and slight reduction, which indicates a reduction in energy transfer from
 $w^{2}$
to
 $u^{2}$
relative to far-field trend. It is worth noting that negative values of
 $\unicode[STIX]{x1D6F1}_{11}^{s}$
would indicate a transfer of energy from the energy rich
 $u^{2}$
component to the energy poor
 $w^{2}$
component, an effect that was observed in the results reported by Perot & Moin (Reference Perot and Moin1995), Aronson et al. (Reference Aronson, Johansson and Löfdahl1997) and Bodart et al. (Reference Bodart, Cazalbou and Joly2010) and has been denoted as a ‘return-to-isotropy’ energy transfer. However, note that for
 $0.3<\unicode[STIX]{x1D709}/\ell _{0}<1$
it is
 $T_{11}$
that represents the dominant source of energy, and so the increased levels of
 $\langle u\rangle _{1}/u_{0}$
observed over this region (see figures 7
b and 7
d) are primarily due to transport processes and not intercomponent redistribution. As a result, we propose that the near-constant values of
 $\langle u\rangle _{1}/u_{0,\ell _{0}}\approx 1$
for
 $\unicode[STIX]{x1D709}<\ell _{0}$
shown in figure 7(d) and reported by McDougall (Reference McDougall1979) and Bodart et al. (Reference Bodart, Cazalbou and Joly2010) are primarily the result of turbulent transport of TKE. In addition, noting that in the study of Bodart et al. (Reference Bodart, Cazalbou and Joly2010) there is no mean flow, we propose that our values of
 $\langle u\rangle _{1}/u_{0,\ell _{0}}>1$
for
 $\unicode[STIX]{x1D709}<\ell _{0}$
(not observed by McDougall Reference McDougall1979; Bodart et al.
Reference Bodart, Cazalbou and Joly2010) are a result of the mean flow present in the current experiment.
For
 $\unicode[STIX]{x1D709}/\ell _{0}<0.3$
the balance is dominated by rapid reduction in
 $T_{11}$
coinciding with an increase in
 $\unicode[STIX]{x1D6F1}_{11}^{s}$
, which signifies that the dominant mechanism governing the budget changes from being turbulent transport to energy redistribution. The significant increase in the pressure–strain term (
 $\unicode[STIX]{x1D6F1}_{11}^{s}$
), forming a positive peak, indicates that energy is transferred from the energy poor
 $w^{2}$
component to the energy rich
 $u^{2}$
component; a peak in
 $\unicode[STIX]{x1D6F1}_{11}^{s}$
close to the wall was also observed in the studies by Perot & Moin (Reference Perot and Moin1995), Aronson et al. (Reference Aronson, Johansson and Löfdahl1997) and Bodart et al. (Reference Bodart, Cazalbou and Joly2010).
5.2.3 Terms of the Reynold stress budget for
$w^{2}$

The terms of the transport equation for
 $\overline{u_{3}^{\prime }u_{3}^{\prime }}=w^{2}$
are shown in figure 10(g–i). For turbulence that is approximately homogeneous in planes parallel to the boundary, the turbulent transport term
 $T_{33}\approx -\unicode[STIX]{x2202}(\overline{u_{3}^{\prime }u_{3}^{\prime }u_{3}^{\prime }})/\unicode[STIX]{x2202}x_{3}$
, which is the gradient of the vertical flux of
 $w^{2}$
, previously considered in § 5.1. In contrast to the observations for
 $T_{11}$
, the data show that
 $T_{33}$
remains approximately constant in the region
 $0.3<\unicode[STIX]{x1D709}/\ell _{0}<1$
, but increases and attains a peak value in the near-boundary region
 $\unicode[STIX]{x1D709}/\ell _{0}<0.3$
, and reduces towards zero as the boundary is approached. A similar near-boundary peak was observed by Perot & Moin (Reference Perot and Moin1995) (for spatially homogeneous turbulence in the far field), but notably not in the study by Bodart et al. (Reference Bodart, Cazalbou and Joly2010), using inhomogeneous turbulent conditions more comparable to those reported here. In contrast to the tangential component, in this case the near-wall peak observed in the current results indicates increasing skewness towards the boundary. This is also the case for the results of Perot & Moin (Reference Perot and Moin1995). We can view this peak as being due to a net diffusion of energy into the near-boundary region, as there is lack of energetic antisplats to transport energy out again.
The key contrasts between the data in the
 $u^{2}$
and
 $w^{2}$
transport equations can be summarised as follows. At the edge of the boundary-affected region the transport equation of
 $u^{2}$
is dominated by changes in
 $T_{11}$
; the blocking condition (
 $w=0$
at
 $\unicode[STIX]{x1D709}=0$
) halts the vertical flux of
 $\overline{u_{1}^{\prime }u_{1}^{\prime }u_{3}^{\prime }}$
towards the boundary, giving rise to observed increase in
 $\langle u\rangle _{1}/u_{0}$
. In contrast, at the edge of the boundary-affected region the transport equation of
 $w^{2}$
is dominated by changes in
 $\unicode[STIX]{x1D6F1}_{33}^{d}$
; changes in
 $T_{33}$
are less significant. This differences arises since at
 $\unicode[STIX]{x1D709}\approx \ell _{0}$
the kinematic blocking condition acts upon
 $w^{2}$
manifesting itself in the pressure field, but does not act directly upon
 $u^{2}$
. We stress that, as far as we are aware, similar conclusions have not previously been proposed.
6 Discussion
In this section we attempt to reconcile the results previously presented to propose the underlying mechanisms governing the interaction of OGT with a solid impermeable boundary. Firstly, the behaviour of energy flux and turbulent transport terms gives us an indication of the role of viscosity in the near-wall behaviour of the turbulence. This aspect of the mechanism can be explained using the splat–antisplat disequilibrium model (see, for example, Perot & Moin Reference Perot and Moin1995). The increasing positive measurements of the skewness in
 $u_{3}^{\prime }$
(henceforth denoted
 $\unicode[STIX]{x1D70E}=\overline{u_{3}^{\prime 3}}/w^{3}$
) for
 $\unicode[STIX]{x1D709}/\ell _{0}<1$
(shown by the broken lines in figure 9
b), indicate that on average motions towards the boundary (splats) are more energetic than motions away from the boundary (antisplats), and this increased skewness occurs over the region
 $0.2\lesssim \unicode[STIX]{x1D709}/\ell _{0}\lesssim 0.5$
, where viscous effects are significant. In addition, positive values of pressure transport (
 $\unicode[STIX]{x1D6F1}_{33}^{d}$
) adjacent to the boundary indicate that over this region there is also a correlation between high instantaneous pressure events and fluid motions incident towards the boundary. This can be interpreted as splats resulting in a greater instantaneous pressure than antisplats on average, which indicates that splats are more energetic than antisplats. Hence, there is greater energy transfer from
 $w^{2}$
to
 $u^{2}$
in the splat process in comparison to the energy transfer from the
 $u^{2}$
to
 $w^{2}$
in the antisplat process. The near-wall (
 $\unicode[STIX]{x1D709}/\ell _{0}\lesssim 0.3$
) peaks in magnitude of
 $\unicode[STIX]{x1D6F1}_{11}^{s}$
and
 $\unicode[STIX]{x1D6F1}_{33}^{s}$
evident in figure 10(d–i) also show this to be the case. This splat–antisplat imbalance increases to a maximum at the edge of the viscous sub-layer, at
 $\unicode[STIX]{x1D709}/\ell _{0}\approx 0.2$
–0.3. This supports the proposal of Perot & Moin (Reference Perot and Moin1995) that this mechanism is, at least in part, driven by the increased dissipation of TKE close to the boundary that results in antisplats of reduced energy relative to splats. Due to the role of enhanced dissipation in this mechanism we expect the mechanism to only be significant in the viscous sub-layer.
However, the behaviour of the pressure–strain term
 $\unicode[STIX]{x1D6F1}_{11}^{s}$
in figure 10(d–f) for
 $\unicode[STIX]{x1D709}/\ell _{0}\gtrsim 0.3$
also indicates the presence of another redistributive energy transfer process. It is known that the pressure–strain term in homogeneous turbulence contributes to the transfer of energy from energy-rich components to energy-poor components (see for example Chung & Kim Reference Chung and Kim1995; Choi & Lumley Reference Choi and Lumley2001). Walker et al. (Reference Walker, Leighton and Garza-Rios1996) proposed that a similar ‘return-to-isotropy’ energy redistribution effect should also be present in the boundary-affected region of the interaction between zero-mean-shear turbulence and a boundary. To support this conclusion in OGT we would expect
 $\unicode[STIX]{x1D6F1}_{11}^{s}$
to be negative for
 $\unicode[STIX]{x1D709}/\ell _{0}<1$
, indicating a transfer of energy from
 $u^{2}$
to
 $w^{2}$
since over this region
 $u>w$
. Note that the intensity of this mechanism in the pressure–strain term should increase as
 $\unicode[STIX]{x1D709}$
reduces due to increasing anisotropy (see figure 6), but may be masked by the viscous effect very close to the wall. This effect is indeed observed in the results of Perot & Moin (Reference Perot and Moin1995), Aronson et al. (Reference Aronson, Johansson and Löfdahl1997) and Bodart et al. (Reference Bodart, Cazalbou and Joly2010). In contrast to previous studies using zero-mean-shear turbulence, note that in the current study since the turbulence is weakly anisotropic for
 $\unicode[STIX]{x1D709}/\ell _{0}>1$
, we observe non-zero values of
 $\unicode[STIX]{x1D6F1}_{11}^{s}$
beyond the boundary-affected region; in figure 10(d–f) we see that for
 $\unicode[STIX]{x1D709}/\ell _{0}>1$
,
 $\unicode[STIX]{x1D6F1}_{11}^{s}$
promotes a transfer from
 $w^{2}$
to
 $u^{2}$
. Disregarding the near-wall peak associated with viscous effects, we see that as the boundary is approached
 $\unicode[STIX]{x1D6F1}_{11}^{s}$
reduces, indicating that the energy transfer from
 $w^{2}$
to
 $u^{2}$
is reduced as the ratio
 $w/u$
reduces from approximately 1 to 0 (indicating increasing anisotropy). This has clear parallels to previous results in zero-mean-shear turbulence that demonstrated a ‘return-to-isotropy’ energy transfer. It is worth noting that this ‘return-to-isotropy’ energy transfer has its root in a kinematic effect, since it is the blocking effect of the wall that results in the reduction of
 $w^{2}$
, causing an increase in anisotropy.
The viscous effects and the ‘return-to-isotropy’ mechanism discussed above do not explain the observations that
 $\langle u\rangle _{1}/u_{0}>1$
over the region
 $\unicode[STIX]{x1D709}/\ell _{0}\gtrsim 0.3$
in figure 7. Recall, however, that the blocking of the vertical energy flux leads to a net transport of
 $u^{2}$
into the boundary-affected region (see figure 9 or figure 10
d–f). Noting that the turbulent energy flux is similar to a diffusive effect in the sense that it transfers energy from an energy-rich region to an energy-poor region, when considered in isolation from other effects the flux would act to increase
 $u$
up to the limit that it was constant across the boundary-affected region, shown in figure 7(d). Hence, given
 $u_{0}$
undergoes a spatial decay based on the far-field trend, this results in
 $u/u_{0}>1$
over
 $\unicode[STIX]{x1D709}/\ell _{0}<1$
. Therefore, crucially it appears that turbulent transport plays a significant role in amplification of the horizontal turbulent velocity component in the boundary-affected region relative to the far-field trend. This mechanism goes some way to explain the disparity of observations of
 $u/u_{0}$
reported in the literature (shown in figure 7
b); studies conducted in homogeneous turbulence are essentially a limiting case of the problem reported here, in the sense that there is no turbulent kinetic energy flux in homogeneous turbulence. Since here it is the kinetic energy flux that is the primary factor in resulting in values of
 $u/u_{0}>1$
, eliminating this effect implies that
 $u/u_{0}\approx 1$
in line with the observations of studies conducted in homogeneous turbulence (Perot & Moin Reference Perot and Moin1995; Aronson et al.
Reference Aronson, Johansson and Löfdahl1997) and the results shown in figure 7(c). An important result of this mechanism is that the use of a zero-mean-shear condition alone is not sufficient to predict the effect of the boundary on turbulent velocity components; inhomogeneity in the
 $x_{3}$
-direction should be considered.
A critical implication of the blocking of the turbulent kinetic energy flux that arises in turbulence that undergoes a spatial decay normal to the boundary is that values of
 $u/u_{0}>1$
and
 $w/w_{0}<1$
(i.e. relative to the far-field trend) can occur in the boundary-affected region in the absence of intercomponent energy transfer from
 $w^{2}$
to
 $u^{2}$
. Note however that our results do not necessarily suggest that intercomponent energy transfer is independent of the spatial decay of turbulent velocities that gives rise to the vertical turbulent kinetic energy flux. For example, consider the hypothetical situation in which we can control the rate of spatial decay of turbulent velocities (
 $\unicode[STIX]{x1D6FE}_{u},\unicode[STIX]{x1D6FE}_{w}$
); increasing
 $\unicode[STIX]{x1D6FE}_{u}$
and
 $\unicode[STIX]{x1D6FE}_{w}$
will intensify the vertical flux of TKE. Since in the boundary-affected region the vertical flux of TKE acts to increase
 $u$
but not
 $w$
(shown in figure 10), increasing
 $\unicode[STIX]{x1D6FE}_{u}$
and
 $\unicode[STIX]{x1D6FE}_{w}$
leads to an increase in anisotropy in the boundary-affected region relative to a smaller value of
 $\unicode[STIX]{x1D6FE}_{u}$
and
 $\unicode[STIX]{x1D6FE}_{w}$
. Hence, this greater anisotropy would promote a stronger ‘return-to-isotropy’ intercomponent energy transfer.
Links between a statistical structure of OGT (spatially decaying with increasing
 $x_{3}$
) and the pressure–strain term have also been proposed in the literature (Magnaudet Reference Magnaudet2003; Bodart et al.
Reference Bodart, Cazalbou and Joly2010), by using skewness (
 $\unicode[STIX]{x1D70E}$
) to describe the
 $x_{3}$
inhomogeneity. Magnaudet (Reference Magnaudet2003) proposed a relationship between the pressure–strain correlation term and turbulent transport by considering the tangential component of the Reynolds stress transport equation for OGT under ideal conditions; namely
 $$\begin{eqnarray}0=T_{11}+\unicode[STIX]{x1D6F1}_{11}^{s}+D_{11}+\unicode[STIX]{x1D700}_{11}.\end{eqnarray}$$
With viscous diffusion taken to be small (which figure 10 shows is valid for
 $\unicode[STIX]{x1D709}/\ell _{0}\gtrsim 0.3$
), the sign of the pressure–strain term depends only upon the relative magnitude of the turbulent transport and dissipation terms. Magnaudet (Reference Magnaudet2003) derived a simple model of the third-order moments present in turbulent transport terms to predict that the sign of the pressure–strain term depends on the skewness of the velocity field. This model assumes that viscous diffusion is small and that dissipation is unaffected by the presence of the boundary. The model is given by
 $$\begin{eqnarray}\unicode[STIX]{x1D6F1}_{11}^{s}=\unicode[STIX]{x1D6F1}_{22}^{s}\approx \unicode[STIX]{x1D700}_{\infty ,0}\left({\textstyle \frac{2}{3}}-\unicode[STIX]{x1D70E}\right)\quad \text{as}~\unicode[STIX]{x1D709}\rightarrow 0,\end{eqnarray}$$
where
 $\unicode[STIX]{x1D700}_{\infty }$
denotes the total dissipation of TKE (
 $\unicode[STIX]{x1D700}_{\infty }=\unicode[STIX]{x1D700}_{ii}/2$
) that would exist if the boundary were absent, and
 $\unicode[STIX]{x1D700}_{\infty ,0}$
is the value at
 $\unicode[STIX]{x1D709}=0$
. The model predicts that at the limit of the wall for
 $\unicode[STIX]{x1D70E}<2/3$
, there is a transfer of energy from the (energy-poor)
 $w^{2}$
to the (energy-rich)
 $u^{2}$
, but that for
 $\unicode[STIX]{x1D70E}>2/3$
the transfer was reversed; a ‘return-to-isotropy’ energy transfer. Given that the model assumes that diffusion (
 $D_{ij}$
) is small and that dissipation (
 $\unicode[STIX]{x1D700}_{ij}$
) is unaffected by the presence of the boundary – which is not valid in the viscous sub-layer, for an impermeable boundary – the model is valid only in the limit of large Reynolds number.
When comparing the model of Magnaudet (Reference Magnaudet2003) to the current results note that for
 $\unicode[STIX]{x1D70E}>2/3$
the prediction of this model is to promote a ‘return-to-isotropy’ energy transfer which is stronger at increasing skewness. Crucially, in regions in which the assumptions made by Magnaudet (Reference Magnaudet2003) are approximately valid, this result is the same as our previous conclusion that as the decay exponents
 $\unicode[STIX]{x1D6FE}_{u}$
and
 $\unicode[STIX]{x1D6FE}_{w}$
increase we observe a stronger ‘return-to-isotropy’ energy transfer. However, our considerations of turbulent transport do not support the concept of a ‘critical skewness’ at
 $\unicode[STIX]{x1D70E}=2/3$
below which the pressure–strain term promotes anisotropy. This difference most likely arises as a consequence of the limitations inherent in the derivation of the model of Magnaudet (Reference Magnaudet2003). In contrast to our conclusion, Bodart et al. (Reference Bodart, Cazalbou and Joly2010) argue that their results invalidate the model proposed by Magnaudet (Reference Magnaudet2003) since their results indicate a near-wall peak in pressure–strain that promotes an energy transfer from the (energy-poor)
 $w^{2}$
to the (energy-rich)
 $u^{2}$
under the condition
 $\unicode[STIX]{x1D70E}\approx 2$
. However, note that the model of Magnaudet (Reference Magnaudet2003) is not valid in the region in which the near-wall peak in pressure–strain reported by Bodart et al. (Reference Bodart, Cazalbou and Joly2010) occurs, since in this region viscous diffusion is not small and dissipation is increased. Values of pressure–strain reported by Bodart et al. (Reference Bodart, Cazalbou and Joly2010) further away from the wall (in regions of small viscous diffusion) do in fact support ‘return-to-isotropy’ energy transfer in agreement with the prediction of the model of Magnaudet (Reference Magnaudet2003) and the current results.
Bodart et al. (Reference Bodart, Cazalbou and Joly2010) also proposed a relationship between skewness and the pressure–strain term. They note that when a fluid element of size
 $\ell$
, with characteristic velocity
 $u_{3}^{\prime }$
, interacts with an impermeable (stationary) boundary, there is a resulting pressure rise of
 $p^{\prime }/\unicode[STIX]{x1D70C}\approx u_{3}^{\prime 2}/2$
and a strain rate of
 $\unicode[STIX]{x2202}u_{3}^{\prime }/\unicode[STIX]{x2202}x_{3}\approx -u_{3}^{\prime }/\ell$
. Hence,
 $$\begin{eqnarray}\overline{\frac{p^{\prime }}{\unicode[STIX]{x1D70C}}\frac{\unicode[STIX]{x2202}u_{3}^{\prime }}{\unicode[STIX]{x2202}x_{3}}}\approx \frac{-\overline{u_{3}^{\prime 3}}}{2\ell }\sim \frac{-\unicode[STIX]{x1D70E}w^{3}}{\ell }.\end{eqnarray}$$
As a result, Bodart et al. (Reference Bodart, Cazalbou and Joly2010) argue that although the transfer of energy in the near-wall region is determined by the effect of splat–antisplat imbalance, that this imbalance is essentially governed by the dissymmetry of the fluctuating field (determined by
 $\unicode[STIX]{x1D70E}$
). They argue that this dissymmetry gives rise to a net redistributive energy transfer and conclude that the, previously discussed, effects of viscosity on splat–antisplat disequilibrium are marginal. However, note that any degree of net intercomponent energy transfer does not appear to be significant; in the results of Bodart et al. (Reference Bodart, Cazalbou and Joly2010),
 $\unicode[STIX]{x1D6F1}_{11}^{s}>|\unicode[STIX]{x1D700}_{11}|$
by a small amount for only a limited region close to the boundary, in line with the results presented here in figure 10(d–f). In addition, the effects of this energy transfer do not appear to be significant enough to cause an increase in the absolute magnitude of
 $u$
in the boundary-affected region; that is, Bodart et al. (Reference Bodart, Cazalbou and Joly2010) observe a monotonic reduction of
 $u$
and recall that we have attributed our values of
 $\langle u\rangle _{1}/u_{0,\ell _{0}}>1$
largely to the effects of advection. Hence, although boundary-normal inhomogeneity may have an effect on intercomponent energy transfer very close to the wall, in the current results any effects appear marginal in light of the transport-based effects on turbulent velocity components in the boundary-affected region.
Finally, we return to a central idea of Hunt & Graham (Reference Hunt and Graham1978); the significant differences found in the results reported in early studies were attributed to Reynolds number effects (Uzkan & Reynolds Reference Uzkan and Reynolds1967; Thomas & Hancock Reference Thomas and Hancock1977). Therefore, the question arises: what, if any, are the Reynolds number effects present in this interaction? In §§ 4 and 5 we were unable to identify a clear link between our results and the Reynolds number across the fairly narrow range of Reynolds numbers achievable with OGT. Other studies using OGT have reported comparable values of
 $\max (u/u_{0})>1$
across a similar range of Reynolds numbers (Brumley & Jirka Reference Brumley and Jirka1987; Hannoun et al.
Reference Hannoun, Fernando and List1988; Kit et al.
Reference Kit, Strang and Fernando1997). In addition, studies of a boundary inserted into a field of established homogeneous turbulence have reported results with
 $\max (u/u_{0})\approx 1$
at long times after boundary insertion, across only a limited range of Reynolds numbers (i.e.
 $Re_{T}\approx 50$
–425 in Perot & Moin Reference Perot and Moin1995; Aronson et al.
Reference Aronson, Johansson and Löfdahl1997). In contrast, Perot & Moin (Reference Perot and Moin1995) identified that terms of the
 $u^{2}$
budget scale on a viscous coordinate system and that the magnitude of the pressure–strain term increased at higher Reynolds numbers. This can be understood by noting that the viscous effects present in the splat–antisplat disequilibrium mechanism will display Reynolds number dependency, since the ratio
 $\unicode[STIX]{x1D6FF}_{v}/\unicode[STIX]{x1D6FF}_{s}$
decreases with increasing Reynolds number (Hunt & Graham Reference Hunt and Graham1978), where
 $\unicode[STIX]{x1D6FF}_{v}$
denotes the thickness of the viscous sub-layer. Hence, although Reynolds number effects are predicted to feature in the interaction, results to support this hypothesis are limited. It is clear that studies across a much broader range of Reynolds numbers are needed to address this issue.
7 Conclusions
We have reported results from an experimental study of the interaction between OGT and a solid boundary (aligned parallel to the grid). The results show that there are three main mechanisms governing the interaction; viscous effects resulting in splat–antisplat disequilibrium; ‘return-to-isotropy’ intercomponent energy transfer; turbulent transport. The results have shown the importance of turbulent transport to this interaction, an aspect that has received little focus in previous studies. In particular, it was the blocking of a vertical TKE flux, away from the grid towards the boundary, that was the dominant feature in producing the observed amplification of the boundary-tangential turbulent velocity component. This is a critical point; previously it has been assumed that the increase in boundary-tangential turbulent velocity component was due primarily to energy transfer from the boundary-normal turbulent velocity component; our results indicate that this is not the case. This mechanism has also gone someway to explain the differences in results previously presented in the literature, by noting that results conducted in otherwise homogeneous turbulence can be viewed as the limiting case at which the effects of the turbulent transport mechanism tend to zero, such that the amplification of the boundary-tangential turbulent velocity component is small.
The results presented here also support other, previously proposed, mechanisms that do act through intercomponent energy transfer; viscous effects resulting in splat–antisplat disequilibrium (Perot & Moin Reference Perot and Moin1995) and stress anisotropy effects (Walker et al.
Reference Walker, Leighton and Garza-Rios1996). Splat–antisplat disequilibrium is a viscous mechanism driven primarily by the dissipation of TKE, as proposed by Perot & Moin (Reference Perot and Moin1995), that dominates the interaction in the viscous sub-layer. This mechanism is characterised by more energetic motions towards the boundary than away, which manifests as an intercomponent energy transfer that promotes anisotropy, described by the pressure–strain correlation term
 $\unicode[STIX]{x1D6F1}_{ij}^{s}$
. Outside the viscous sub-layer
 $\unicode[STIX]{x1D6F1}_{ij}^{s}$
acts to transfer energy from
 $u^{2}$
to
 $w^{2}$
in a so-called ‘return to isotropy’, as proposed by Walker et al. (Reference Walker, Leighton and Garza-Rios1996). This mechanism has its root in a kinematic effect; in the boundary-affected region the blocking of
 $w$
promotes stress anisotropy that promotes the ‘return-to-isotropy’ energy transfer in the boundary-affected region as in elsewhere in the flow. We have also proposed that these mechanisms are not independent of the energy flux mechanism discussed above; we propose that
 $\unicode[STIX]{x1D6F1}_{ij}^{s}$
should promote a stronger ‘return-to-isotropy’ energy transfer mechanism as the degree of inhomogeneity in the boundary-normal direction increases, in line with the prediction of Magnaudet (Reference Magnaudet2003), due to the effects of energy flux towards the boundary. Hence, it is clear that the effect of a solid impermeable boundary on turbulent velocity components in zero-mean-shear turbulence depends critically on the nature of the turbulence (homogeneous versus inhomogeneous).
Acknowledgements
The authors acknowledge J. Meakin and S. Lawton for technical support with the experimental apparatus. M.W.M. acknowledges financial support through an Engineering and Physical Sciences Research Council Studentship (no. 1510466).