1. Introduction
Nonlinear resonant interaction of internal waves is one of the key processes leading to small-scale mixing in the ocean. In particular, the parametric subharmonic instability (PSI) allows the transport of energy from large to smaller scales by giving birth to two secondary subharmonic waves (with wavevector modulus
 ${\it\kappa}_{1}$
and
 ${\it\kappa}_{2}$
) from an initial primary wave (with wavevector modulus
 ${\it\kappa}_{0}$
) (Benielli & Sommeria Reference Benielli and Sommeria1998; Koudella & Staquet Reference Koudella and Staquet2006; Clark & Sutherland Reference Clark and Sutherland2010; Bourget et al.
Reference Bourget, Dauxois, Joubaud and Odier2013; Gayen & Sarkar Reference Gayen and Sarkar2013). Thanks to a new experimental and analysis tool, Bourget et al. (Reference Bourget, Dauxois, Joubaud and Odier2013) have recently shown how the PSI theory developed for plane waves is in good agreement with the experimental observations of the instability of a quasi-monochromatic wave beam. As stressed by Sutherland (Reference Sutherland2013), one challenge is now to determine the range of validity of the theory and in particular the role of the width of the wave beam on the occurrence of the instability. In other words, is the instability affected by the width of the beam? This question is particularly important in the oceanic context where internal waves are known to develop preferentially in the form of finite size beams, for instance waves emitted by the interaction of tide with topography (Dewan et al.
Reference Dewan, Picard, O’Neil, Gardiner, Gibson, Mill, Richards, Kendra and Gallery1998; Lien & Gregg Reference Lien and Gregg2001; Gostiaux & Dauxois Reference Gostiaux and Dauxois2007). Moreover, energy transfer between scales, as well as wave turbulence in oceans, are open questions and a study of the role of the beam width on secondary waves selection in PSI might bring new understanding to these issues.
This is the aim of the present work, combining experimental, numerical and theoretical approaches. Starting with the observation that finite-width beams can inhibit the instability, we continue by studying the effect of the beam width on the selection rules.
2. Experimental and numerical approach
2.1. Experimental set-up
A tank 160 cm large, 17 cm wide is filled with 36 cm of linearly stratified salt water with constant buoyancy frequency
 $N$
. An internal wave of wavelength
 ${\it\lambda}_{0}$
is generated using a wave generator (Gostiaux et al.
Reference Gostiaux, Didelle, Mercier and Dauxois2007; Mercier et al.
Reference Mercier, Martinand, Mathur, Gostiaux, Peacock and Dauxois2010) placed horizontally with a plane wave configuration identical to that used by Bourget et al. (Reference Bourget, Dauxois, Joubaud and Odier2013). Note that to avoid spurious emission of internal waves on the extremities of the moving region, the amplitude of the plates is constant over
 $n$
wavelengths in the central region, while one half-wavelength with a smooth decrease of the amplitude is added on each side. The beam width
 $W=(n+1){\it\lambda}_{0}$
is varied from
 ${\it\lambda}_{0}$
to
 $5{\it\lambda}_{0}$
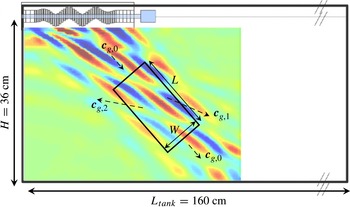
by changing the horizontal extent of the moving part of the wavemaker. A schematic view of the experimental set-up is shown in figure 1. A synthetic schlieren technique (Sutherland et al.
Reference Sutherland, Dalziel, Hughes and Linden1999; Dalziel, Hughes & Sutherland Reference Dalziel, Hughes and Sutherland2000) is used to obtain the two-dimensional instantaneous density gradient field (
 $\tilde{{\it\rho}}_{x}(x,z,t)=\partial _{x}({\it\rho}(x,z,t)-{\it\rho}_{0}(z))$
,
 $\tilde{{\it\rho}}_{z}(x,z,t)=\partial _{z}({\it\rho}(x,z,t)-{\it\rho}_{0}(z))$
) where
 ${\it\rho}(x,z,t)$
and
 ${\it\rho}_{0}(z)$
are the instantaneous and initial fluid densities. Series of experiments are performed varying the horizontal wavenumber
 $\ell _{0}$
, the plate motion amplitude
 $a$
and the frequency
 ${\it\omega}_{0}$
. It results in variations of the vertical wavenumber
 $m_{0}$
according to the dispersion relation
 ${\it\omega}_{0}/N=\ell _{0}/{\it\kappa}_{0}$
, as well as variations of
 ${\it\Psi}_{0}$
, the amplitude of the stream function
 ${\it\psi}$
, which is defined such that
 $\partial _{z}{\it\psi}=-u$
and
 $\partial _{x}{\it\psi}=v$
with
 $u$
and
 $v$
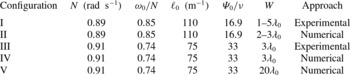
the horizontal and vertical components of the velocity. The parameters used in this article are summarized in table 1. A typical experimental result is presented as background of figure 1.
Sketch of the set-up. Experimentally, the wave generator is lying horizontally at the top of the wave tank. The vertical density gradient field of a typical wave beam generated at the top of the domain and undergoing PSI is presented as background of the figure. The dashed arrows indicate the group velocity of the three wave beams. The tilted rectangle of length
 $L$
and width
 $W$
corresponds to the control area used in the model.

Experimental and numerical parameters, with
 $N$
the buoyancy frequency,
 ${\it\omega}_{0}$
the frequency of the primary wave,
 ${\it\lambda}_{0}$
the wavelength,
 $\ell _{0}$
the horizontal wavenumber,
 ${\it\Psi}_{0}=v_{0}/\ell _{0}$
the experimentally measured amplitude of the stream function in which
 $v_{0}$
is the vertical velocity,
 ${\it\nu}$
the viscosity and
 $W$
the width of the primary beam.

2.2. Numerical method
In addition to the experiments, we performed 2D direct numerical simulations with the finite-elements commercial software Comsol Multiphysics. The simulations solve the incompressible continuity equation, the Navier–Stokes equations for a Newtonian fluid in the Boussinesq approximation and the equation of salinity conservation. All elements are triangular standard Lagrange mesh of type
 $P_{2}{-}P_{3}$
(i.e. quadratic for the pressure field but cubic for the velocity and density fields). The total number of degrees of freedom is larger than 2 million. At each time step, the system is solved with the backward difference formulae (BDF) temporal solver and the sparse direct linear solver PARDISO. The Comsol BDF solver automatically adapts its scheme order between 1 and 5 (see the details in Hindmarsh et al.
Reference Hindmarsh, Brown, Grant, Lee, Serban, Shumaker and Woodward2005): it varies between 1 and 3 during our calculations. Note that no stabilization technique has been used. The Schmidt number, which compares diffusivity of salt and momentum is set to
 $\mathit{Sc}=10$
as a proxy for the value
 $\mathit{Sc}=700$
existing in the laboratory configuration. To prevent the creation of a reflected beam at the bottom of the domain, an attenuation layer is added wherein viscosity and diffusivity of salt increase exponentially with depth. To mimic the wavemaker of the experimental set-up, the horizontal velocity, the vertical velocity and the density are simultaneously imposed at each time step at the top horizontal boundary and correspond to linear gravity waves. The amplitude of the imposed velocities and density is constant over
 $n$
wavelengths in the central region, while one half-wavelength with a smooth decrease of the amplitude is added on each side similar to the experimental configuration. On the left and the bottom of the domain, we impose no stress and no flux and on the right, the pressure anomaly is fixed to zero, with no viscous stress and flux. Note that at time
 $t=0$
, the linear viscous beam is imposed in the bulk. The advantage of the numerical approach is that the beam width can be varied to much larger value than five wavelengths.
2.3. Results
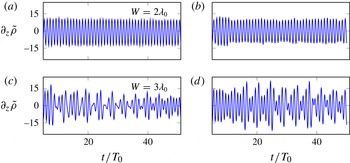
Let us first focus on the experimental and numerical results of configurations I and II. Figures 2(a) and 2(c) present the time evolution of the vertical density gradients measured at a given point in the experiment (configuration I), while figures 2(b) and 2(d) show the same information for the numerical simulation (configuration II). Experimental and numerical results display a good agreement, evidencing the following observation: while for a beam width
 $W=2{\it\lambda}_{0}$
(figure 2
a,b), the regular signal does not show any triadic resonance, in the case where
 $W=3{\it\lambda}_{0}$
(figure 2
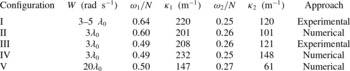
c,d), the instability develops, as emphasized by the modulation of the signal, typical of the apparition of new frequencies in the system. Moreover, frequencies and wavelengths of the secondary waves present a good agreement, as can be seen in table 2. For experiments with
 $W=4{\it\lambda}_{0}$
and
 $5{\it\lambda}_{0}$
(not shown), the instability is observed as well. Experimental and numerical results thus reveal for the first time the critical role of the beam width in the occurrence of the triadic instability.
Time evolution of the amplitude of
 $\partial _{z}\tilde{{\it\rho}}\ (\text{kg}\ \text{m}^{-4})$
4.5 cm below the wavemaker and in the middle of the beam as the width of the beam is increased from
 $W=2{\it\lambda}_{0}$
(a,b) to
 $3{\it\lambda}_{0}$
(c,d) for configurations I–II (
 ${\it\omega}_{0}/N=0.85$
,
 $\ell _{0}=110\ \text{m}^{-1}$
,
 ${\it\psi}_{0}/{\it\nu}=16.9$
). Experimental results are shown in (a,c) and numerical results in (b,d).

Experimental and numerical values of
 ${\it\omega}_{1}$
and
 ${\it\omega}_{2}$
, the frequencies of the secondary waves and
 ${\it\kappa}_{1}$
and
 ${\it\kappa}_{2}$
, the wavevector modulus of the secondary waves.

3. Theory
To understand this observation, it is crucial to realize that the theory of PSI is derived for infinitely extended plane waves, as described by Koudella & Staquet (Reference Koudella and Staquet2006) and Bourget et al. (Reference Bourget, Dauxois, Joubaud and Odier2013). We thus propose to take into account the width of the primary wave beam, the guiding idea being that the two secondary plane waves can exit the spatial extent of the primary wave beam (McEwan & Plumb Reference McEwan and Plumb1977; Gerkema, Staquet & Bouruet-Aubertot Reference Gerkema, Staquet and Bouruet-Aubertot2006). Once they have left this region, they cannot interact any more with the primary plane wave and the energy transfer is broken.
To perform an energy balance, let us define a control area within the primary wave beam as presented by the tilted rectangle in figure 1. For simplicity, we neglect the spatial attenuation of the waves in this area, i.e. the surface energy densities
 $E_{0}$
,
 $E_{1}$
and
 $E_{2}$
of the different waves are considered uniform. Consequently, the temporal variation of the primary plane wave energy in the domain is due to:
-
(i) nonlinear interactions that transfer energy from the primary wave to both secondary waves (denoted
 ${\it\Gamma}_{int}(i,j)$
where
$i$
and
$j$
represent the two other waves of the triad);
-
(ii) viscosity;
-
(iii) incoming and outgoing flux of the primary wave.


For the domain
 $W\times L$
, this can be summarized as
 $$\begin{eqnarray}\frac{\text{d}E_{0}}{\text{d}t}LW={\it\Gamma}_{int}(1,2)-{\it\nu}{\it\kappa}_{0}^{2}E_{0}LW+E_{in}W\boldsymbol{c}_{g,0}-E_{0}W\boldsymbol{c}_{g,0},\end{eqnarray}$$
with
 $E_{in}$
the surface energy injected by the generator and
 $c_{g,0}=(N^{2}-{\it\omega}_{0}^{2})^{1/2}/{\it\kappa}_{0}$
.
Assuming that PSI occurs everywhere in the beam, the outgoing energy flux of the secondary waves through the cross-beam faces with width
 $W$
is compensated by the incoming one. In contrast, since they do not propagate parallel to the primary beam, they exit the control area also from the lateral boundaries without compensation. For the temporal variation of the secondary waves energy in the domain, this leads to
 $$\begin{eqnarray}\frac{\text{d}E_{i}}{\text{d}t}LW={\it\Gamma}_{int}(0,j)-{\it\nu}{\it\kappa}_{i}^{2}E_{i}LW-E_{i}L|\boldsymbol{c}_{g,i}\boldsymbol{\cdot }\boldsymbol{e}_{k_{0}}|,\end{eqnarray}$$
with
 $i=1,2$
,
 $j=2,1$
and the modulus of the group velocity
 $c_{g,i}=(N^{2}-{\it\omega}_{i}^{2})^{1/2}/{\it\kappa}_{i}$
.
The first term represents the interaction with the other plane waves of the triadic resonance while the third one accounts for the energy exiting the control area. As
 $E_{i}\propto {\it\kappa}_{i}^{2}{\it\Psi}_{i}{\it\Psi}_{i}^{\ast }$
, using the infinite width expression (Bourget et al.
Reference Bourget, Dauxois, Joubaud and Odier2013) for the interaction terms, one obtains
 $$\begin{eqnarray}\displaystyle & \displaystyle \frac{\text{d}{\it\Psi}_{0}}{\text{d}t}=-|I_{0}|{\it\Psi}_{1}{\it\Psi}_{2}-\frac{{\it\nu}}{2}{\it\kappa}_{0}^{2}{\it\Psi}_{0}+F, & \displaystyle\end{eqnarray}$$
 $$\begin{eqnarray}\displaystyle & \displaystyle \frac{\text{d}{\it\Psi}_{1}}{\text{d}t}=+|I_{1}|{\it\Psi}_{0}{\it\Psi}_{2}^{\ast }-\left(\frac{{\it\nu}}{2}{\it\kappa}_{1}^{2}+\frac{|\boldsymbol{c}_{g,1}\boldsymbol{\cdot }\boldsymbol{e}_{k_{0}}|}{2W}\right){\it\Psi}_{1}, & \displaystyle\end{eqnarray}$$
 $$\begin{eqnarray}\displaystyle & \displaystyle \frac{\text{d}{\it\Psi}_{2}}{\text{d}t}=+|I_{2}|{\it\Psi}_{0}{\it\Psi}_{1}^{\ast }-\left(\frac{{\it\nu}}{2}{\it\kappa}_{2}^{2}+\frac{|\boldsymbol{c}_{g,2}\boldsymbol{\cdot }\boldsymbol{e}_{k_{0}}|}{2W}\right){\it\Psi}_{2}, & \displaystyle\end{eqnarray}$$
 $I_{i}$
the interaction term defined as follows
 $$\begin{eqnarray}I_{i}=\frac{\ell _{j}m_{r}-m_{j}\ell _{r}}{2{\it\omega}_{i}{\it\kappa}_{i}^{2}}\left[{\it\omega}_{i}({\it\kappa}_{j}^{2}-{\it\kappa}_{r}^{2})+\ell _{i}N^{2}\left(\frac{\ell _{j}}{{\it\omega}_{j}}-\frac{\ell _{r}}{{\it\omega}_{r}}\right)\right]\end{eqnarray}$$
with
 $i,j,r=0,1,2$
and
 $F=\boldsymbol{c}_{g,0}({\it\Psi}_{in}^{\ast }{\it\Psi}_{in}-{\it\Psi}_{0}^{\ast }{\it\Psi}_{0})/(2L{\it\Psi}_{0}^{\ast })$
a forcing term, corresponding to the difference between the incoming energy and the outgoing one for the primary wave.
The solution for
 ${\it\Psi}_{1}$
and
 ${\it\Psi}_{2}$
can be easily obtained with the hypothesis
 ${\it\Psi}_{0}$
constant. One finds exponentially growing solutions with growth rate
 $$\begin{eqnarray}{\it\sigma}_{\pm }=-{\textstyle \frac{1}{4}}\left({\it\Sigma}_{1}+{\it\Sigma}_{2}\right)\pm \sqrt{{\textstyle \frac{1}{16}}\left({\it\Sigma}_{1}-{\it\Sigma}_{2}\right)^{2}+|I_{1}|\,|I_{2}|\,|{\it\Psi}_{0}|^{2}},\end{eqnarray}$$
where
 ${\it\Sigma}_{i}={\it\nu}{\it\kappa}_{i}^{2}+{\it\sigma}_{adv}({\it\kappa}_{i})$
and
 ${\it\sigma}_{adv}({\it\kappa}_{i})=|\boldsymbol{c}_{g,i}\boldsymbol{\cdot }\boldsymbol{e}_{k_{0}}|/W$
, the inverse of an advection time since it characterizes the transport of the secondary waves energy out of the interaction region. The viscous part of the expression of
 ${\it\Sigma}_{i}$
is similar to the expression obtained by McEwan & Plumb (Reference McEwan and Plumb1977) in the limit of large Prandtl number.
Cases with large
 ${\it\sigma}_{adv}$
values will present a very strong finite-width effect. Three parameters impact the value of the growth rate.
-
(a) The width
$W$
of the beam. The term
${\it\sigma}_{adv}$
varies like the inverse of
$W$
, thus the growth rate is decreased when the beam is narrow. In contrast, when
$W$
goes to infinity,
${\it\sigma}_{adv}$
vanishes and the growth rate of the original theory (Bourget et al.
Reference Bourget, Dauxois, Joubaud and Odier2013) is recovered. -
(b) The amplitude of the group velocities of the secondary waves. When the modulus of the secondary wavevector
${\it\kappa}_{i}$
is small, the group velocity increases and the secondary waves exit the primary wave beam more rapidly. So there is less time for them to grow in amplitude. In addition,
${\it\sigma}_{adv}$
is weaker for low stratification
$N$
(small group velocity) at
${\it\kappa}$
and
${\it\omega}$
fixed, which implies a stronger instability in the oceans where
$N$
is weak compared with laboratory conditions. -
(c) The direction of the group velocity of each wave of the triad. When the secondary waves are almost perpendicular to the primary plane wave, they leave the interaction area quickly, which does not favour the instability. To summarize, this finite-width effect is stronger when the group velocity of the secondary wave is aligned with
$\boldsymbol{k}_{\mathbf{0}}$
.


For configurations I and II presented in figure 2, the above model predicts that the growth rate is an increasing function of
 $W$
. For an infinitely wide wave beam, the instability occurs for any value of the amplitude (see appendix A). In contrast, for finite-width beams, a non-vanishing threshold appears. For example, for
 $W=2{\it\lambda}_{0}$
, the maximum growth rate becomes negative for
 ${\it\Psi}_{0}/{\it\nu}<4.4$
. Moreover, during the finite duration of the experiment, even if the instability occurs, the amplitude of the two secondary waves might be too small to be detected. For example, we can define a detection criterion by requiring that for the secondary waves to be detected, the duration of the experiment must exceed three times the inverse of the growth rate. With this criterion, in the case of an infinitely wide wave beam, the instability can only be observed during the experiment if
 ${\it\Psi}_{0}/{\it\nu}>1.6$
whereas for
 $W=2{\it\lambda}_{0}$
, the threshold is five times higher,
 ${\it\Psi}_{0}/{\it\nu}>8.5$
. Interestingly, this value of amplitude threshold has the same order of magnitude as the imposed amplitude in configurations I and II, notwithstanding the simplifying hypothesis made by neglecting spatial attenuation in the longitudinal (viscous decay) and transversal (imposed wave beam shape) direction of the primary wave. Therefore, the above model gives an explanation why the instability occurs in these two configurations only for
 $W$
larger than
 $3{\it\lambda}_{0}$
.
This new analysis reveals a dramatic effect on the development of the triad instability which has been totally overlooked before. When the beam gets narrower, the PSI cut-off, initially due only to viscosity, is displaced towards a larger forcing amplitude so that at a given amplitude, the instability can be completely suppressed by decreasing the beam width.
4. Selection of the triad
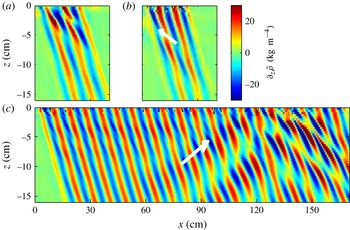
We will now show that the finite-width effect can also result in a specific triad selection. To do that, we focus on the results for another set of parameters (configurations III–V, see table 1), this case is therefore different from the previous one. Experimental and numerical wavefields (respectively, configurations III and IV) presented in figure 3(a,b) are in good agreement. As underlined by Bourget et al. (Reference Bourget, Dauxois, Joubaud and Odier2013), the theoretical prediction for an infinite primary plane wave is that for this set of parameters (configurations III–IV), the wavelength of one of the secondary waves generated by the instability is larger than the primary wavelength, while the other one is smaller (see table 2). In this case, the energetic transfer will occur towards larger and smaller scales simultaneously. However, this prediction was not verified and a different type of triad was observed experimentally in Bourget et al. (Reference Bourget, Dauxois, Joubaud and Odier2013), with transfer to smaller scales only. This difference between the prediction and the observations can again be traced back to the finite width of the wave beam. To demonstrate that, we rely on numerical results since the experimental set-up cannot generate plane waves with a beam size larger than
 $6{\it\lambda}_{0}$
. Note that we have performed numerical simulations for
 $6{\it\lambda}_{0}$
(yielding similar results as for
 $3{\it\lambda}_{0}$
) and
 $10{\it\lambda}_{0}$
(yielding similar results as for
 $20{\it\lambda}_{0}$
). Therefore, we do not show these results here and focus only on the extreme cases
 $3{\it\lambda}_{0}$
and
 $20{\it\lambda}_{0}$
. Figure 3(c) shows the results of configuration V, i.e. for the same parameters but for a significantly wider beam (
 $20{\it\lambda}_{0}$
). The primary wave beam is still unstable, but the secondary waves look quite different compared with the results for
 $W=3{\it\lambda}_{0}$
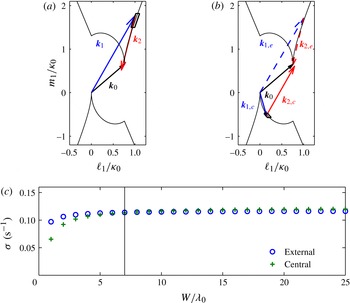
. To quantify the differences, a temporal Hilbert transform (Mercier, Garnier & Dauxois Reference Mercier, Garnier and Dauxois2008) and a spatial Fourier transform are used to measure the different wavevectors present in the numerical density gradient fields. These vectors are shown in figure 4(a,b). In addition, the curves in these figures represent the location of the tip of all possible wavevectors
 $\boldsymbol{k}_{1}$
satisfying the theoretical resonance conditions with a growth rate possessing a positive real part. A clear difference between the two cases is visible. For
 $W=3{\it\lambda}_{0}$
, a single triad is observed and its secondary wavevectors
 $\boldsymbol{k}_{1}$
belongs to an external branch of the theoretical resonance loci (
 $\ell _{1}>\ell _{0}$
). The wavelengths of both secondary waves are smaller than the primary wavelength. For
 $W=20{\it\lambda}_{0}$
, two different triads are measured. The first (dashed vectors), with secondary vector
 $\boldsymbol{k}_{1,e}$
lying on an external branch (hence, the subscript ‘
 $e$
’), is similar to that found for smaller
 $W$
. For the second (solid vectors), its secondary vector
 $\boldsymbol{k}_{1,c}$
is located in the central region of the theoretical loci curve (
 $0<\ell _{1}<\ell _{0}$
). In this case, one secondary wave has a larger wavelength than the primary wave and the other a smaller one.
Vertical density gradient fields for configurations III–V (
 ${\it\omega}_{0}/N=0.74$
,
 $\ell _{0}=75\ \text{m}^{-1}$
,
 ${\it\psi}_{0}/{\it\nu}=33$
): (a) experiments with
 $W=3{\it\lambda}_{0}$
; (b) simulations with
 $W=3{\it\lambda}_{0}$
; (c) simulations with
 $W=20{\it\lambda}_{0}$
. The two vectors represent the direction of the group velocity for one of the two secondary plane waves.

(a) The three arrows are the measurements of the three wavevectors for the numerical case
 $W=3{\it\lambda}_{0}$
. (b) The five arrows are the measurements of the wavevectors for the numerical case
 $W=20{\it\lambda}_{0}$
. In (a) and (b), the dark solid line represents the theoretical resonance loci for the secondary wavevector
 $\boldsymbol{k}_{1}$
for a given
 $\boldsymbol{k}_{0}$
and the rectangles represent the most unstable mode for the present finite-width model. (c) Evolution of the growth rate computed from (3.7) as a function of the width of the beam, computed using the finite-size model. The transition between the external and central triad configurations is obtained around
 $W=7{\it\lambda}_{0}$
(vertical line).

These observations can be explained by the finite-width theoretical approach presented previously: the predicted evolution of the maximum value of the growth rate as a function of
 $W$
is shown in figure 4(c). The growth rates were computed separately for the external (
 $\circ$
symbols) and central (
 $+$
symbols) cases. A transition between the two possible triads is predicted around
 $W_{c}=7{\it\lambda}_{0}$
. For
 $W<W_{c}$
, the most unstable triad is on the external branch. The corresponding predicted location of the tip of wavevector
 $\boldsymbol{k}_{1}$
is displayed as a rectangle in figure 4(a), showing a very good agreement with the numerical observation. For this narrow beam, this agreement extends as well to the experimental data. In contrast, for wide enough beams, i.e. above the threshold
 $W_{c}$
, in spite of the fact that
 $\boldsymbol{k}_{1,c}$
is almost perpendicular to
 $\boldsymbol{k}_{0}$
(a condition enhancing the value of
 ${\it\sigma}_{adv}$
), the secondary waves have time to grow before leaving the interaction area. Consequently, the central triad becomes dominant when increasing the beam width. In the time evolution of the numerical experiment, this triad appears first, the result derived for infinitely wide beams is thus recovered. At a later time, it is followed by the second triad. Our numerical results confirm that the width of the beam changes the selection of the triad. This new effect explains why energy transfer is mainly towards smaller scales for narrow beams.
5. Oceanic case
This new finite-width theory is therefore of importance when considering internal wave beams from in situ observations of the ocean (Dewan et al. Reference Dewan, Picard, O’Neil, Gardiner, Gibson, Mill, Richards, Kendra and Gallery1998; Lien & Gregg Reference Lien and Gregg2001; Gostiaux & Dauxois Reference Gostiaux and Dauxois2007). In the ocean, since the wavelengths are larger by several orders of magnitude, the Reynolds number is much larger than in the experiments and consequently viscous effects can be safely neglected. Consequently, the beam width is the dominating control parameter for the growth rate. We will focus on equatorial regions, for which the background rotation has no effect.
For example, we consider a primary beam with the following typical parameters:
-
(a)
${\it\omega}_{0}=1.4\times 10^{-4}\ \text{rad}\ \text{s}^{-1}$
, which corresponds to the diurnal M2 tide period; -
(b)
${\it\lambda}_{0}=100\ \text{m}$
, which corresponds to field measurements in Kaena Ridge, Hawaii (Sun & Pinkel Reference Sun and Pinkel2013); -
(c)
$N=1.12\times 10^{-3}\ \text{rad}\ \text{s}^{-1}$
; this value of the buoyancy frequency allows a propagation angle of
${\it\theta}=7^{\circ }$
which is close to oceanic observations; -
(d) the Froude number
$\mathit{Fr}=u_{0}m_{0}/(2{\rm\pi}N)=0.035$
(Gayen & Sarkar Reference Gayen and Sarkar2013) which allows us to estimate
${\it\Psi}_{0}$
; -
(e) the vertical component of the Coriolis force is ignored and the Coriolis parameter
$f$
is set to zero.







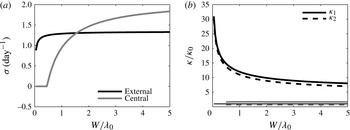
Figure 5(a) shows the evolution of the growth rate as a function of the width of the beam. With the chosen parameters, the transition between the external and central triad configurations is obtained around
 $W=1.5{\it\lambda}_{0}$
. Figure 5(b) presents the evolution of the modulus of the secondary wavevectors for the external case (black lines) and the central case (grey lines) as a function of the width of the primary beam. For example for a narrow beam
 $W=1{\it\lambda}_{0}$
, the maximum of growth rate is obtained on the external branch (5
a) and PSI enables a transfer to smaller scales:
 ${\it\kappa}_{1}=12{\it\kappa}_{0},\ {\it\kappa}_{2}=11{\it\kappa}_{0}$
(figure 5
b). This behaviour corresponds to simulations (Gerkema et al.
Reference Gerkema, Staquet and Bouruet-Aubertot2006; Gayen & Sarkar Reference Gayen and Sarkar2013) and to oceanic observations (McKinnon et al.
Reference McKinnon, Alford, Sun, Pinkel, Zhao and Klymak2012). Moreover, the value of the growth rate predicted by the model (
 ${\it\sigma}=1.2\ \text{day}^{-1}$
) gives a value which has the right order of magnitude when compared with numerical values,
 $0.5\ \text{day}^{-1}$
(Gerkema et al.
Reference Gerkema, Staquet and Bouruet-Aubertot2006) or
 $0.66\ \text{day}^{-1}$
(Gayen & Sarkar Reference Gayen and Sarkar2013), and with oceanic measurements, from 0.2 to
 $0.5\ \text{day}^{-1}$
(McKinnon et al.
Reference McKinnon, Alford, Sun, Pinkel, Zhao and Klymak2012). In contrast for a larger beam, the instability enables transfer to both larger and smaller scales (
 ${\it\kappa}_{1}=1.7{\it\kappa}_{0},\ {\it\kappa}_{2}=0.7{\it\kappa}_{0}$
) which corresponds to the infinitely wide theory prediction.
(a) Evolution of the growth rate computed from (3.7) as a function of the width of the beam, computed using the finite-size model in an oceanic case (
 $N=1.12\times 10^{-3}\ \text{rad}\ \text{s}^{-1}$
,
 ${\it\omega}_{0}/N=0.125$
,
 ${\it\lambda}_{0}=100\ \text{m}$
,
 $f=0$
). The transition between the external and central triad configurations is obtained around
 $W=1.5{\it\lambda}_{0}$
. (b) Evolution of the modulus of the secondary wavevectors for the external case in black and the central case in grey as a function of the width of the beam. The horizontal thin black line represents
 ${\it\kappa}/{\it\kappa}_{0}=1$
.

This transition depends on the amplitude of the stream function
 ${\it\Psi}_{0}$
. For example, for
 ${\it\Psi}_{0}$
three times larger, the transition is obtained for
 $W=0.55{\it\lambda}_{0}$
. In contrast, for
 ${\it\Psi}_{0}$
three times smaller, the transition is obtained for
 $W=4.5{\it\lambda}_{0}$
. Thus, the transition between the two behaviours appears for
 $W$
close to the typical width of an oceanic beam. Consequently, the finite width of the beam can have a notable impact on the selection of the triad in oceanic cases and provides an explanation for the predominance of energy transfer to smaller scales for oceanic narrow beams.
6. Conclusion
We have shown theoretically, numerically and experimentally that the width of the internal wave beam is a key element in PSI. This feature had been totally overlooked previously, despite its dramatic consequences on the triad selection mechanism. The subharmonic plane waves that are theoretically unstable can only extract energy from the primary wave if they do not leave the primary beam too quickly. This finite-width mechanism has two opposite consequences on the wave energy dissipation: it introduces a PSI threshold (reducing transfer and therefore dissipation), but when PSI is present it enhances the transfer towards small wavelengths, more affected by dissipation. A complete theoretical study of the impact of the envelope on the PSI will be a timely achievement. We are aware of a recent work about the weakly nonlinear asymptotic analysis of the problem by Karimi & Akylas (Reference Karimi and Akylas2014).
It has not escaped our attention that the Coriolis force will significantly modify the prediction. Indeed, the group velocity for inertia–gravity waves, which is proportional to
 $\sqrt{({\it\omega}^{2}-f^{2})\cdot (N^{2}-{\it\omega}^{2})}/({\it\omega}{\it\kappa})$
, decreases with the Coriolis parameter
 $f$
(Gill Reference Gill1982). The rotation reducing the ability of subharmonic waves to escape, it seriously reinforces the instability. At the critical latitude, the group velocity vanishing, one should even recover the theoretical prediction for plane waves.
Finally, from a more fundamental point of view, such a mechanism modifies significantly the transfer of energy between scales and must be taken into account in all analyses (Caillol & Zeitlin Reference Caillol and Zeitlin2000; Lvov et al. Reference Lvov, Polzin, Tabak and Yokoyama2010; Lvov, Polzin & Yokoyama Reference Lvov, Polzin and Yokoyama2012) of wave turbulence, in which infinitely wide plane waves are until now the common theoretical objects, but not appropriate for careful predictions.
Acknowledgements
We thank P. Meunier for insightful discussions. This work has been partially supported by the ONLITUR grant (ANR-2011-BS04-006-01) and achieved thanks to the resources of PSMN from ENS de Lyon. M.L.B. acknowledges financial support from the European Commission, Research Executive Agency, Marie Curie Actions (project FP7-PEOPLE-2011-IOF-298238).
Appendix A. Is there an amplitude threshold in resonant triadic instability for an infinitely wide wave beam?
The expression (3.7) shows that, to obtain a strictly positive growth rate, the amplitude of the stream function has to be larger than
 $$\begin{eqnarray}|{\it\Psi}_{s}(l_{1},m_{1})|=\frac{{\it\nu}}{2}\sqrt{\frac{{\it\kappa}_{1}^{2}{\it\kappa}_{2}^{2}}{I_{1}I_{2}}},\end{eqnarray}$$
with
 $I_{1}$
and
 $I_{2}$
defined in (3.6). This expression has already been reported in Koudella & Staquet (Reference Koudella and Staquet2006) and Bourget et al. (Reference Bourget, Dauxois, Joubaud and Odier2013) with minor typos in the latter case. What has been overlooked is that the PSI threshold is the global minimum of this function (A 1) of several variables.
In this appendix, we study the behaviour of
 ${\it\Psi}_{s}$
when
 $\boldsymbol{k}_{1}$
tends to
 $\boldsymbol{k}_{0}$
, which is the most unstable case for small values of the amplitude. In this case, we assume
 $$\begin{eqnarray}\displaystyle \ell _{1} & = & \displaystyle \ell _{0}(1+{\it\mu}_{0}{\it\epsilon}^{{\it\alpha}}),\end{eqnarray}$$
 $$\begin{eqnarray}\displaystyle m_{1} & = & \displaystyle m_{0}(1+{\it\epsilon}),\end{eqnarray}$$
 ${\it\epsilon}=o(1)$
,
 ${\it\alpha}\geqslant 1$
and
 ${\it\epsilon}$
and
 ${\it\mu}_{0}$
are positive.
Using the temporal and spatial resonance conditions and the dispersion relation of internal waves, we obtain the relation
 $$\begin{eqnarray}\frac{m_{0}^{6}}{{\it\kappa}_{0}^{6}}\left({\it\epsilon}^{4}-2{\it\mu}_{0}{\it\epsilon}^{3+{\it\alpha}}+o({\it\epsilon}^{2{\it\alpha}})\right)={\it\mu}_{0}^{2}{\it\epsilon}^{2{\it\alpha}}.\end{eqnarray}$$
To solve this equation, there are a priori two different solutions for
 ${\it\alpha}$
:
-
(a)
$3+{\it\alpha}=2{\it\alpha}$
leading to
${\it\alpha}=3$
; however, this value makes it possible to balance terms at order
${\it\epsilon}^{6}$
but not the lower-order term
${\it\epsilon}^{4}$
, so this value
${\it\alpha}=3$
is therefore not acceptable; -
(b)
$4=2{\it\alpha}$
leading to
${\it\alpha}=2$
; in that case, the lowest order terms can be balanced and one obtains
${\it\mu}_{0}=(m_{0}/{\it\kappa}_{0})^{3}$
.


Finally, we obtain
 $$\begin{eqnarray}\ell _{1}=\ell _{0}(1+{\it\mu}_{0}{\it\epsilon}^{2})\quad \text{and}\quad \ell _{2}=-{\it\mu}_{0}\ell _{0}{\it\epsilon}^{2}\end{eqnarray}$$
 $$\begin{eqnarray}m_{1}=m_{0}(1+{\it\epsilon})\quad \text{and}\quad m_{2}=-m_{0}{\it\epsilon}.\end{eqnarray}$$
With these relations, it can be shown that
 $$\begin{eqnarray}I_{1}=-\ell _{0}m_{0}{\it\epsilon}+o({\it\epsilon})\quad \text{and}\quad I_{2}=-\ell _{0}m_{0}+o(1),\end{eqnarray}$$
which means that
 $$\begin{eqnarray}|{\it\Psi}_{s}|=\frac{{\it\nu}}{2}\frac{N}{{\it\omega}_{0}}\sqrt{{\it\epsilon}}+o({\it\epsilon}^{1/2}).\end{eqnarray}$$
Therefore, the minimum of the positive expression (A 1) is zero. Consequently, there is no threshold for an infinitely wide wave beam.