



1. Introduction
In situ energy harvesting in pipes could power sensors and actuators that improve efficiency and/or production in oil wells (Rester et al. Reference Rester, Thomas, Hilten and Vidrine1999; Sharma et al. Reference Sharma2002; Wood, Arellano & Lorenzo Reference Wood, Arellano and Lorenzo2013) and irrigation systems (Bastiaanssen, Molden & Makin Reference Bastiaanssen, Molden and Makin2000; Zhou et al. Reference Zhou, Huang, Li and Zhu2014). They require power levels  $O(10^{-3}\text {--}10^1)\ \textrm {W}$ dependent on data rates and system architecture (Moschitta & Neri Reference Moschitta and Neri2014). While turbines can achieve such power levels (Tong Reference Tong2010), they are susceptible to wear and friction within their bearing assemblies, and not favourable alternatives for decades of use without maintenance (Guo et al. Reference Guo, Watson, Tavner and Xiang2009; Doll, Kotzalas & Kang Reference Doll, Kotzalas and Kang2010; Tong Reference Tong2010). Hydrokinetic energy harvesters based on flow-induced vibration (FIV) avoid the use of bearings or gears altogether, shifting the primary failure to structural fatigue. Flow-induced vibration devices with power outputs of
 $O(10^{-7}\text {--}10^{4})\ \textrm {W}$ (Bernitsas et al. Reference Bernitsas, Raghavan, Ben-Simon and Garcia2008; Zhu Reference Zhu and Tan2011) and decades of maintenance-free operation may be feasible if designed to maintain internal stresses within material fatigue limits.
Flow-induced vibration in these devices is driven by fluid–structure interaction (FSI) instabilities that provide high amplitude, oscillatory forces on a responsive structure. One such instability is aeroelastic flutter, which relies on a positive feedback between the natural modes of a vibrating structure and aerodynamic forces. Flow energy harvester devices developed by the authors and collaborators have focused on flutter instabilities in an internal flow geometry (Sherrit et al. Reference Sherrit2014; Lee et al. Reference Lee, Sherrit, Tosi, Walkemeyer and Colonius2015, Reference Lee, Sherrit, Tosi and Colonius2016). After a number of design iterations (Sherrit et al. Reference Sherrit2014; Lee et al. Reference Lee, Sherrit, Tosi and Colonius2016), a device employing a flextensional transducer (figure 1), where a cantilever exposed to the flow is mounted on a flexure containing piezoelectric elements, was found to provide a number of advantages in terms of power output and longevity. This paper aims to analyse the associated FSI mechanisms taking place in this and similar devices; the resulting model could be used as a basis for design, geometry and scaling of devices in the future.
Illustration of flow path and relevant geometry. Values and units are listed in table 5. (a) Axial cross-section of flow geometry illustrating flow path. (b) Cut section a-a.

The stability of an elastic member within a constant channel, or as part of the channel, has been studied analytically, via reduced models, and numerically for many decades (Johansson Reference Johansson1959; Miller Reference Miller1960; Inada & Hayama Reference Inada and Hayama1988, Reference Inada and Hayama1990; Nagakura & Kaneko Reference Nagakura and Kaneko1991; Gurugubelli, Jaiman & Khoo Reference Gurugubelli, Jaiman and Khoo2014; Cisonni et al. Reference Cisonni, Lucey, Elliott and Heil2017). A number of other applications fall under this canonical problem, including wind instruments (Backus Reference Backus1963; Sommerfeldt & Strong Reference Sommerfeldt and Strong1988), human snoring (Balint & Lucey Reference Balint and Lucey2005; Tetlow & Lucey Reference Tetlow and Lucey2009) or vocalization (Tian et al. Reference Tian, Dai, Luo, Doyle and Rousseau2014), enhanced heat transfer systems (Shoele & Mittal Reference Shoele and Mittal2016; Hidalgo, Jha & Glezer Reference Hidalgo, Jha and Glezer2015). Modelling the structure displacement, velocities and fluid forces approximated via simplified equations of motion appear as early as the 1960's (Johansson Reference Johansson1959; Miller Reference Miller1960), where the divergence instability in channels within nuclear reactor cooling systems is addressed. More recent work has taken an inviscid approach to understanding the onset of flutter in a symmetric channel (Guo & Paidoussis Reference Guo and Paidoussis2000). Other similar formulations include a vortex sheet model to calculate flutter boundary (Alben Reference Alben2015), and a plane wake vortex sheet model in unconfined flows (Alben Reference Alben2008). The latter was extended to asymmetric channel flow to account for the effects of channel confinement (Shoele & Mittal Reference Shoele and Mittal2016). Viscous formulations that account for the flow rate modulation due to change in the channel geometry were also devised and progressed at around the same time (Nagakura & Kaneko Reference Nagakura and Kaneko1991; Païdoussis Reference Païdoussis2003; Wu & Kaneko Reference Wu and Kaneko2005). These employed fluid force terms applied to an elastic beam in channel flow had originally been devised for rigid plates in converging or diverging channels (Inada & Hayama Reference Inada and Hayama1988). This framework was also extended to cylindrical constant channels (Fujita & Shintani Reference Fujita and Shintani1999, Reference Fujita and Shintani2001, Reference Fujita and Shintani2007). More recently, methods that include viscosity in compressible and incompressible potential flow have been devised to interrogate the confined beam flutter stability problem, also considering the addition of beam tension (Jaiman, Parmar & Gurugubelli Reference Jaiman, Parmar and Gurugubelli2014).
The two-dimensional viscous flow problem has also been explored numerically to define the flutter boundary dependence on the fluid-to-structure mass ratio and Reynolds number for a relatively flexible cantilever (and a two-cantilever system) within a confined channel (Gurugubelli et al. Reference Gurugubelli, Jaiman and Khoo2014; Gurugubelli & Jaiman Reference Gurugubelli and Jaiman2019), as well as its dependence on throat-to-beam length ratio and Reynolds number (Cisonni et al. Reference Cisonni, Lucey, Elliott and Heil2017). Two-dimensional channel geometries with small throat-to-beam length ratios have also been modelled and results tested against numerical simulations for a constant channel over a range of Reynolds numbers, geometry and material parameters (Tosi & Colonius Reference Tosi and Colonius2019). This model, devised by the authors, has failed to correctly predict experimentally observed flutter onset of the flextensional device. In the present paper, we extend the model formulation to account for the three-dimensional effect from lateral beam confinement. The importance of considering the full geometry becomes apparent, for example, when comparing two-dimensional flag flutter to that of flutter in spanwise confined flags (Doaré, Sauzade & Eloy Reference Doaré, Sauzade and Eloy2011a; Doaré et al. Reference Doaré, Mano, Carlos and Ludena2011b).
The remainder of the paper is structured as follows. We define the details of the flextensional flow energy harvester in § 2. In § 3 we present experiments that first characterize the flextensional properties as a function of set-screw torque, then the flutter boundary as a function of flow rate. A numerical simulation of the system, presented in § 4, is used to obtain insights into three-dimensional aspects of the flow field and the relevant fluid–structure mechanisms driving flutter. Those insights guide the model derived in § 5, which is based on the modulation of the channel flow rate by the beam displacement and velocity, and predicts the flutter instability onset flow rate, frequency and mode shapes near the plane-asymmetric diffuser separation angle of  ${\approx }7^{\circ }$.
2. Flextensional flow energy harvester
We begin by defining the design of the energy harvester that is tested experimentally, then simulated and modelled in subsequent sections.
2.1. Device description
A flow energy harvester based on flextensional actuators (figure 1) converts the motion of a cantilever excited by the flow into electricity via piezoelectric crystals (Lee et al. Reference Lee, Sherrit, Tosi, Walkemeyer and Colonius2015). Flextensional structures are designed as actuators that convert compressive piezoelectric stresses to flexural displacements; here the device is used in reverse as a transducer to generate compressive piezoelectric stresses from flexure displacements. This produces more energy for the same displacement as compared with a piezoelectric bimorph transducer (Sherrit et al. Reference Sherrit2014, Reference Sherrit, Lee, Walkemeyer, Winn, Tosi and Colonius2015).
As seen in figure 1, the flexure supports two piezoelectric stacks (PZT 1 shown, with a symmetric PZT 2) through a centre mount that is attached to the fixed base with a set screw. Torque applied to the set screw pre-stresses the stacks, and changes the dynamical (and static) properties of the flexure. By adding or removing torque to the set screw  $\tau _S$, the effective stiffness
 $k_0$, damping
 $c_0$ and mass
 $m_0$ of the flexure can be altered. The measurement of flexure properties is discussed in § 2.2. Table 1 lists the relevant dimensional parameters to define the fluid-structure flextensional harvester system.
Table of fluid–structure dimensional parameters.

The device works on the premise that flow can interact and excite the beam structure. In our experiments, the flow path begins from a round pipe inlet into the test section. The flow impinges on the fixed base and is directed onto the top and bottom paths, as illustrated in figure 1. The beam is centred along the channel, such that the flow path is symmetric. The figure illustrates the top channel, with dimensions listed in table 5 in the appendix. The flow is converging for  $L_2 \approx 0.1 L$ along
 $x$ until it bypasses the constriction at the throat
 $\bar {h}$, and expands in a planar,
 $\theta = 19^{\circ }$ diffuser for
 ${\approx }0.7 L$. In the remaining
 $0.2 L$, the diffuser tapers off into
 ${<}1^{\circ }$ exit at the end of the beam. The total expansion is
 ${\approx }15:1$ from
 $\bar {h}$. Our flowing experiments are carried out in air.
The flexure and the beam are made of a single aluminium stock, and comprise the moving structure. The fixed base is fastened with screws to both the test section and the flexure. The flexure behaves like a translational spring that transfers motion from the beam surface normal direction into compression and expansion of the piezoelectric stacks. The pre-stress from the set screw and centre mount ensure that the piezoelectric elements are always in compression: as the flexure moves above the channel centreline, the bottom stack is compressed, and the top stack pre-stress is released, although maintained positive, and vice versa when the beam moves below the channel centreline. The up and down motion gives rise to two voltage signals that are  $180^{\circ }$ out of phase. Vacuum grease and rubber inserts are used to seal and restrain the flow path to that shown in figure 1. An electrical fitting is used to connect the piezoelectric stacks to the data acquisition card on the outside of the test section.
The piezoelectric stacks are composed of multiple thin, alternately poled, piezoelectric layers ‘stacked’, or mechanically connected in series and electrically in parallel. They operate in what is known as the 33 mode, where the applied force is parallel to the poling direction. When a resistor is placed in parallel with the stack, its response to a step input force is that of an RC circuit with the capacitor having an initial voltage equivalent to the open circuit step-force voltage. The voltage  $V(t)$ is measured across the resistor
 $R_e$ and is given by
 $V(t) = V_{in}\exp (-t/R_e C^*_p).$ If the time constant
 $\tau = R_e C^*_p$ is large enough, the system will act as a low-pass filter and any oscillating voltage upstream of the resistor (opposite to ground) at a frequency
 $f_{res}$ that satisfies
 \begin{equation} \omega_{{res}} \gg \frac{1}{\tau } = \omega_c \end{equation}
will not pass through the resistor. Hence, the voltage output will be measured as if the system was an open circuit. We implement this circuit and choose an  $R_e$ large enough such that the resonances of the structure satisfy condition (2.1). Specifically, we expect the stacks to act as strain gauges for high enough frequencies, where the output oscillating voltage is proportional to the flextensional displacement.
The combination of the flow path, the structure, the piezoelectric elements and the electronics comprise the flow energy harvester design. In our current work, we are particularly interested in the coupling between the flextensional and beam structure to the flow path in the channel.
2.2. Flextensional and beam parameters
Figure 2 divides the flow energy harvester into two distinct parts: the flextensional dynamics on the left, which provides the boundary condition for the flow-driven beam dynamics on the right.
Illustration cantilever beam in a converging-diverging channel geometry (b) with a simple harmonic boundary condition (a).

Informed by finite element results of the flexture (Tosi Reference Tosi2019), a damped harmonic oscillator can be used to capture the flextensional fundamental mode dynamics. In particular,
 \begin{equation} \frac{m_0}{b} \ddot{\bar{a}} + \frac{c_0}{b}\dot{\bar{a}} + \frac{k_0}{b} \bar{a} = f_r, \end{equation}
where  ${m_0}/{b}$,
 ${c_0}/{b}$ and
 ${k_0}/{b}$ are the flexure mass, damping and stiffness constants per unit span, and
 $\bar {a}$ is the displacement of the flextensional boundary. The force
 $f_r$ is equivalent to the total force per unit span acting on the flexure interface to the cantilever. It can be defined as the integrated pressure difference between top and bottom channels over the beam length,
 \begin{equation} f_r = \int_0^L \Delta P \,{\textrm{d}\kern0.06em x}. \end{equation}
Here  $\Delta P = P^{{bot}} - P^{{top}}$, and
 $P^{{bot}}(x,t)$ and
 $P^{{top}}(x,t)$ are the pressures acting on the bottom and top of the beam, per superscript. Values for
 $m_0$,
 $c_0$ and
 $k_0$ are inferred from measurements of the actual device in § 3.1.
The goal of our work is to understand the flutter instability when the system is near zero displacement. Hence, to describe the beam motion in transverse vibration, we consider the undamped, Euler–Bernoulli (EB) beam equation per unit span (Inman Reference Inman2008),
 \begin{equation} \rho_s h_b \frac{\partial^2}{\partial t^2} \delta(x,t) + \frac{\partial^2}{ \partial x^2} \left( \frac{E I}{b} \frac{\partial^2 }{\partial x^2} \delta(x,t) \right) = \Delta P, \end{equation}
where  $I$ is the area moment of inertia in (D2). The beam is moving at its leading edge and free at its trailing edge, so the boundary conditions are
 \begin{equation} \delta(0,t) = \bar{a}, \quad \frac{\partial }{ \partial x} \delta(0,t) = 0, \quad \frac{\partial^2 }{\partial x^2} \delta(L,t)= 0, \quad \frac{\partial^3 }{\partial x^3} \delta(L,t)= 0. \end{equation}
Equation (2.4) and data (2.5a–d) assume that the beam is thin relative to its length ( $L\gg h_b$); that the rotational inertia is negligible; and that beam extension and shear displacement are negligible when compared with the transverse displacement (the beam is inextensible). It follows that flow shear stresses do not impact the motion of the elastic member. Furthermore, the amplitude of oscillation is small relative to the beam length (
 $\| \delta \|_{\infty } \ll L$) such that
 $x$ is equivalent to the Lagrangian coordinate of the beam. These simplifications are consistent with our system near the zero displacement equilibrium.
Though (2.4) is undamped, external damping due to the fluid (i.e. Rayleigh damping) is accounted for within the pressure terms on its right-hand side. Internal damping (i.e. internal to the solid), however, is not accounted for within our equations of motion. A range of internal material damping formulations exist for a beam (Banks & Inman Reference Banks and Inman1991). Typically a strain-rate proportional form (Kelvin–Voigt) is used but time- or spatial-hysteretic formulations have also been deemed appropriate for certain materials and configurations. Yet material coefficients corresponding to any of the aforementioned formulations are difficult to obtain and require specialized experimental equipment. The effect of neglecting internal material damping results in underestimating the energy dissipated by the beam structure, leaving modes associated with the flexible beam specially susceptible to instabilities. However, the experimental results in § 3.2.1 show that the flextensional rigid-body (RB) motion at the cantilever base is responsible for the flutter bifurcation observed, rendering the flutter stability boundary observed largely independent of the beam modes. However, this limitation of the present model should be noted if it is generalized to designs that rely on significant beam bending. Results are verified and discussed in more detail within the numerical simulation and modelling in §§ 4.2 and 5.5, respectively.
In considering the flow separately in the top and bottom channels, we write the geometrical constraint
 \begin{equation} \delta(x,t) = \delta^{{top}}(x,t) ={-}\delta^{{bot}}(x,t). \end{equation}
Furthermore, we define  $\delta = L \delta ^*$,
 $t = ( L/U_c ) t^*$,
 $f_r = \rho _f U_c^2 L f_r^*$ and
 $\Delta P = \rho _f U_c^2 \Delta P^*$, where the superscript
 $*$ represents non-dimensional quantities. The non-dimensionalization of (2.2) and (2.4) as such yields the fluid–structure non-dimensional groups in table 2. A gap-to-length ratio
 $\hat {h} = \bar {h}/L$ arises in dimensional analysis when we define a second length scale
 $\bar {h}$ associated with the channel geometry
 $h_0 = \bar {h}h_0^*$, as does the beam width-to-length ratio
 $\hat {b} = b/L$. The relevant fluid-only dimensional groups depend on the form of the pressure term, as related to the velocity field.
Table of fluid–structure non-dimensional parameters for flextensional boundary and cantilevered beam.

This model is intended to describe the initial, small displacement behaviour of the fluid–structure system as a function of fluid/structure parameters, and is appropriate for the stability analyses that follow in § 5.
3. Experiments
From the design and parameter definitions in the previous section, we first experimentally measure the flextensional boundary parameter values in § 3.1, then quantify the dynamics of the device as a function of flow rate in § 3.2. Rather than a complete experimental characterization of the dynamics however, three settings are selected (and measured) instead, i.e. baseline, high and low set-screw torque values (shown in table 3), to span a range of flextensional mass, stiffness and damping properties for comparison with the numerical simulation and modelling results in §§ 4 and 5, respectively.
Table of calculated mean flextensional (Flex.) properties.

3.1. Flexure characterization
Two experiments are carried out to quantify  $m_0$,
 $c_0$ and
 $k_0$, all in still air at standard pressure and temperature (STP). First, the flexure stiffness
 $k_{0}$ is characterized through a static measurement of force
 $F_a$ for displacement
 $\bar {a}$,
 \begin{equation} k_0 = \frac{b f_r}{\bar{a}} = \frac{F_a}{\bar{a}}, \end{equation}
derived from the steady equation (2.2). The second experiment measures the voltage output of the PZT stacks when the flextensional fundamental mode is excited. This is done with an impulse force at the  $x=0$ location (figure 1). With the damped resonant frequency
 $\omega$ and exponential decay rate
 $\zeta$ measured from PZT voltage outputs, the solution to the homogeneous equation (2.2) (
 $f_r = 0$) is used to map the dynamic voltage response to parameter properties as
 \begin{gather} m_0 = \frac{k_0}{\omega^2 + \zeta^2}, \end{gather}
 \begin{gather} c_0 = 2 \zeta m_0. \end{gather}
Equations (3.1), (3.2) and (3.3) allow us to map experimentally measured quantities  $F_a$,
 $\zeta$, and
 $\omega$ onto
 $k_0$,
 $c_0$ and
 $m_0$.
3.2. Flow experiments
Next, the flextensional energy harvester is tested in flowing conditions to quantify the critical properties at the flutter instability, which encompass those properties at or near the quasi-stable point where the systems transition from the stable equilibrium into flutter and vice versa. Parameters are systematically varied in two ways: first, the set-screw torque  $\tau _S$ sets the structural parameters of the flextensional corresponding to the boundary conditions in figure 2 and to values in table 3. Second, for any of the three set-screw settings (i.e. flextensional settings 1, 2 and 3), an experiment is run where the flow rate is first increased past the critical point, where the stable equilibrium to flutter transition is observed; then decreased past the fold point where the flutter transition to a stable equilibrium is observed. This topology holds true for all three settings tested. The dynamics of the flowing system are assessed by measuring the voltage output from each piezoelectric stack, and by processing video images of the beam displacement. In the increasing flow rate branch, the critical point is described by the critical flow rate
 $Q_{{cr}}$ where the system is not longer stable, and the critical frequency
 $f_{{cr}}$, corresponding to the dominant oscillatory frequency at the nearest point
 $Q \geq Q_{{cr}}$ where self-sustained oscillations can be observed in the measured outputs. The fold point in the decreasing flow rate branch is characterized by the fold flow rate
 $Q_{{r}}$. This data provides quantitative values by which we can compare numerical and analytical results in the subsequent sections.
Two output data products are extracted from experiments: PZT voltages and beam displacement videos. The voltage data set is processed through peak extraction to obtain average amplitudes over the relevant time series, and fast Fourier transformed using Welch's method to obtain the signal frequency response corresponding to the highest peak. No other processing technique or filtering was applied to the voltage signals, as the system is responding to oscillatory forcing that satisfies condition (2.1). The video data set is decomposed and processed to characterize predominant vibration modes and their amplitudes. From the video, the transverse displacement of a section of the elastic beam is measured using edge-detection through a Canny filter (Canny Reference Canny1986) for the top and bottom edges of the beam. The precision per-pixel is  ${\approx }0.15\ \textrm {mm}$ or
 ${\approx }0.4\,\%$ of the beam length. The extracted edges are averaged to estimate the beam centreline displacement. The resulting space–time series is processed using the spectral proper orthogonal decomposition (SPOD), which allows the most energetic mode shapes at each frequency to be robustly extracted (Schmidt, Colonius & Bres Reference Schmidt, Colonius and Bres2017; Towne, Schmidt & Colonius Reference Towne, Schmidt and Colonius2018). Further details of the SPOD applied here are given in Appendix C. In subsequent results, frequencies are labelled as
 $f$ with subscript 1 representing that of the highest power spectral density (PSD) value, and subsequent peaks following numerically.
3.2.1. Experimental results
The video and voltage data sets are processed for the three flextensional settings over air flow rates ranging from 5 to  $500\ \textrm {L}\ \textrm {min}^{-1}$. The dynamics observed as the flow rate increases are consistent for all three flextensional settings: small decaying beam displacement and voltage amplitude behaviour prevails until a critical flow rate is reached. At the critical flow rate, both the beam and PZT voltage amplitudes significantly increase and display self-sustaining oscillations (i.e. limit cycle).
Figure 3 shows a representative example for flextensional setting 1 when the system has reached the self-sustained oscillation regime. The data set is at flow rate  $Q = 246\ \textrm {L}\ \textrm {min}^{-1}$,
 $38\ \textrm {L}\ \textrm {min}^{-1}$ above the flextensional setting 1 critical flow rate of
 $208\ \textrm {L}\ \textrm {min}^{-1}$. The spectrum shows a clear peak at
 $f_1 = 197\ \textrm {Hz}$, and the corresponding mode contains more than 99 % of the variance in the PSD of the beam displacement. The phase diagram shows a limit-cycle behaviour and the mode shape resembles the RB motion of the cantilever base, denoting excitation of the flexure itself. Given the predicted cantilever fundamental mode frequency of 346 Hz from classical EB beam theory for clamped-free cantilever boundary conditions (shown in Appendix D), we can reasonably associate the second peak at
 $f_2 = 341\ \textrm {Hz}$ to the beam fundamental mode. This is further validated from the mode shape shown: though the extracted transverse displacement data does not reach the cantilever base, the mode shape monotonically decreases as
 $x/L$ decreases without the appearance of a fixed node. The illustrated mode shape also contains over 99 % of the variance of the signal at
 $f_2$. The phase diagram shows behaviour typical of a lightly damped resonance, where the mode amplitude and velocity are perturbed around their equilibrium points through sporadic forcing (Schmidt et al. Reference Schmidt, Schmid, Towne and Lele2018). The remaining peaks shown in the power spectrum plot are harmonics of
 $f_1$. Similar behaviour was observed for the flextensional settings 2 and 3 results, where
 $f_2 \approx 341\ \textrm {Hz}$ appears in all three settings.
Representative SPOD data for flextensional setting 1 showing self-sustained oscillating regime of mode 1 and under-damped regime of mode 2. (a) Trace of cross-spectral density matrices at discrete frequencies. (b) Phase diagram for mode 1. (c) Phase diagram for mode 2. (d) Spectral proper orthogonal decomposition mode shape for mode 1. (e) Spectral proper orthogonal decomposition mode shape for mode 2.

Figures 4 and 5 display the dominant mode (mode 1) amplitude and frequency, respectively, as a function of flow rate for all three flextensional settings. The amplitudes are obtained by projecting the beam transverse position space–time series onto the two most energetic spatial SPOD modes of  $f_1$ and
 $f_2$, per the method described in the appendix. The mean and standard deviation (markers and error bars, respectively) of the resulting modal amplitude time series corresponding to the highest PSD frequency are plotted in figure 4. To look for hysteresis, tests are carried out by first increasing and then decreasing the flow rate. Plots in figure 4 show that the primary mode amplitude remains small (lightly damped resonance) until a critical flow rate
 $Q_{{cr}}$ is reached, which demarcates a transition to a high amplitude, limit-cycle regime. Increasing the flow rate beyond
 $Q_{{cr}}$, however, does not significantly increase the resulting amplitude. A slight amplitude decrease is sometimes seen at the highest flow rates, corresponding to the point when the beam appears to collide with the throat. As the flow rate is decreased through
 $Q_{{cr}}$, a hysteresis loop becomes evident in all three flextensional settings, with its size (
 $\Delta Q = Q_{{cr}} - Q_{{r}}$) varying between each setting. The system recovers the small amplitude regime at
 $Q < Q_{{r}} < Q_{{cr}}$, where
 $Q_{{r}}$ is the fold flow rate. This hysteresis suggests that the system is undergoing a subcritical Hopf bifurcation at
 $Q_{{cr}}$, giving rise to the bi-stable region captured in the data. All three frequency responses in figure 5 appear constant until
 $Q_{{cr}}$ is reached, at which point the frequencies tend to increase slightly with increasing flow rate. The hysteretic behaviour is most pronounced in the frequency data from setting 2. Critical and fold properties for the observed bifurcation are summarized in table 4.
Video data set showing mode 1 amplitude vs. flow rate for all flextensional settings. (a) Flextensional 1. (b) Flextensional 2. (c) Flextensional 3.

Video data set showing mode 1 frequency response vs. flow rate for all flextensional settings. (a) Flextensional 1. (b) Flextensional 2. (c) Flextensional 3.

Table of critical and restoring (fold) values for Flex. settings.

Analogous amplitude and frequency plots for the PZT voltage are shown in figures 6 and 7, respectively, with critical and hysteresis results in agreement with video displacement data. One discrepancy however, is observed in the flextensional setting 3 frequency data. Specifically, the plot shows the beam fundamental frequency as dominant until  $Q_{{cr}}$, at which point the voltage response frequency is double that of the video displacement frequency in figure 5. This effect is caused by lightly pre-stressed piezoelectric elements, as this flexure configuration represents conditions with the least amount of torque applied on the set screw. The phenomenology is as follows: once the oscillation reaches the full extension at either the top or bottom of the flextensional stroke, the decompressed stack looses contact with the flexure structure. This in turn causes a strong response that flips the sign of the voltage output, and appears as a frequency doubling through the discrete Fourier transform. The nonlinear loss-of-contact behaviour has been observed by Sherrit et al. (Reference Sherrit, Frankovich, Bao and Tucker2009) as flextensional actuators loose their bond between stacks and the flexure. Voltage amplitudes are also notably lower in flexure setting 3 than the other two flexure configurations.
Plots of PZT 1 voltage amplitude vs. flow rate for all flextensional settings. (a) Flextensional 1. (b) Flextensional 2. (c) Flextensional 3.

Plots of PZT 1 voltage PSD primary frequency (frequency associated with largest PSD amplitude peak) vs. flow rate for all flextensional settings. (a) Flextensional 1. (b) Flextensional 2. (c) Flextensional 3.

Given the observed  $Q_{{cr}}$ values in table 4, it is plausible that throat velocities may reach a considerable fraction of the sound speed when operating in air. In Appendix B we estimate the Mach number at the channel throat
 $\mathcal {M}_{{t}}$. We discuss the potential limitations of the incompressible flow assumption made in the subsequent simulation section next.
4. Numerical simulations
Experimental results from the previous section show a rich set of dynamics and different regimes consistent with a subcritical Hopf bifurcation. In this section we use two-way coupled numerical simulations of a beam in the converging-diverging channel in order to investigate the three-dimensional flow field and provide insights into the flow patterns and instability mechanisms that drive the bifurcation. Experimental results also point us primarily to explore the flextensional mode dynamics, the only one that reaches the limit cycle, for which the beam is essentially in RB motion. We thus consider a rigid beam that is allowed to oscillate, via the lumped parameter model, using the experimentally measured values for mass, stiffness and damping ratios for flextensional setting 1. We further discuss the validity of the RB approximation below as well as in § 5.
4.1. Numerical method
Our simulations are based on the lattice Boltzmann method (LBM), which originates from kinetic theory and, thus, evolves discretized particle distribution functions (populations)  $f_i(\boldsymbol {x},t)$, which are associated with discrete velocities
 $\boldsymbol {c}_i, i=1,\ldots ,Q$ and designed to recover the macroscopic Navier–Stokes equations (NSE) in the hydrodynamic limit. By organizing the set of discrete velocities into a regular lattice, LBM eventually reduces to a simple, efficient and scalable stream-and-collide algorithm with the additional advantage of exact propagation and local nonlinearity, which is incorporated through the collision operator. In recent years, LBM has made significant progress and early stability issues of the classical lattice Bhatnagar–Gross–Krook (LBGK) model have been overcome. While on one hand explicit turbulence models have shown success for turbulent flows (Chen et al. Reference Chen, Kandasamy, Orszag, Shock, Succi and Yakhot2003; Malaspinas & Sagaut Reference Malaspinas and Sagaut2012), the class of parameter-free entropic lattice Boltzmann schemes (ELBM) have shown accurate and robust solutions for both resolved and under-resolved simulations for laminar, transitional as well fully turbulent flows (Bösch, Chikatamarla & Karlin Reference Bösch, Chikatamarla and Karlin2015a,Reference Bösch, Chikatamarla and Karlinb; Dorschner et al. Reference Dorschner, Bösch, Chikatamarla, Boulouchos and Karlin2016a; Dorschner, Chikatamarla & Karlin Reference Dorschner, Chikatamarla and Karlin2017b). In particular, we use the multi-relaxation time variant of ELBM (KBC) (Karlin, Bösch & Chikatamarla Reference Karlin, Bösch and Chikatamarla2014), which exploits the high dimensionality of the kinetic system and chooses the relaxation of higher-order, non-hydrodynamic moments such that the entropy of the post-collision state is maximized. The KBC model has been discussed in various contributions and we will restrict ourselves to the main steps in case of isothermal flow using the standard
 $D3Q27$ lattice.
We start from the general lattice Boltzmann equation for the population  $f_i(\boldsymbol {x},t )$, i.e.
 \begin{equation} f_i(\boldsymbol{x}+\boldsymbol{c_i}, t+1)=f_i^{\prime} = (1-\beta)f_i(\boldsymbol{x},t) + \beta f_i^{{mirr}}(\boldsymbol{x},t), \end{equation}
where the streaming step is indicated by the left-hand side and the post-collision state  $f^\prime _i$ on the right-hand side is given by a convex-linear combination of
 $f_i(\boldsymbol {x},t)$ and a mirror state
 $f_i^{{mirr}}(\boldsymbol {x},t)$. We use natural moments to represent the population as a sum of the kinetic part
 $k_i$, the shear part
 $s_i$ and the remaining higher-order moments
 $h_i$,
 \begin{equation} f_i = k_i + s_i + h_i. \end{equation}
The mirror state can thus be represented as
 \begin{equation} f_i^{{mirr}} = k_i + \left( 2 s_i^{eq} -s_i \right) + \left( \left(1 - \gamma\right) h_i + \gamma h_i^{eq}\right), \end{equation}
where  $s_i^{eq}$ and
 $h_i^{eq}$ denote
 $s_i$ and
 $h_i$ evaluated at equilibrium.
The equilibrium distribution function  $f^{eq}$ is defined as the minimum of the entropy function
 \begin{equation} H(\,f) = \sum_{i=1}^Q f_i \ln \left( \frac{f_i}{W_i} \right) , \end{equation}
subject to the local conservation laws for mass and momentum
 \begin{equation} \sum_{i=1}^Q \{ 1, \boldsymbol{c_i} \} f_i = \{ \rho, \rho \boldsymbol{u} \}, \end{equation}
and the weights  $W_i$ are lattice-specific constants. By minimizing the
 $H$-function in the post-collision state one obtains the relaxation parameter
 \begin{equation} \gamma = \frac{1}{\beta} - \left( 2 - \frac{1}{\beta}\right) \frac{\left\langle \Delta s | \Delta h\right\rangle}{\left\langle \Delta h | \Delta h\right\rangle }, \end{equation}
where  $\Delta s_i = s_i - s_i^{{eq}}$ and
 $\Delta h_i=h_i-h_i^{{eq}}$ are the deviation from equilibrium and the entropic scalar product is defined as
 $\left \langle X | Y \right \rangle = \sum _i (X_i Y_i / f_i^{{eq}})$. The KBC model recovers the NSE in the hydrodynamic limit for which the viscosity is related to the parameter
 $\beta$ as
 \begin{equation} \nu=c_s^2 \left( \frac{1}{2\beta}- \frac{1}{2}\right), \end{equation}
where  $c_s=1/\sqrt {3}$ is the lattice speed of sound.
Finally, to include two-way coupling of the fluid with the cantilever beam, we follow the procedure as outlined in Dorschner et al. (Reference Dorschner, Chikatamarla, Bösch and Karlin2015); Dorschner, Chikatamarla & Karlin (Reference Dorschner, Chikatamarla and Karlin2017a, Reference Dorschner, Chikatamarla and Karlin2018), using second-order Grad boundary conditions to account for the momentum transfer from the fluid onto the beam and vice versa. The beam velocity, needed to prescribe the boundary conditions, is obtained by solving Newton's equations of motions using an Euler integration and the fluid force is evaluated by the Galilean invariant momentum exchange method (see Wen, Zhang & Fang Reference Wen, Zhang and Fang2015). This procedure has been validated extensively for various test cases for one- and two-way coupled simulations as well as fully coupled FSI problems involving deforming geometries.
4.2. Simulation of the flow energy harvester
The simulation of the full flextensional energy harvester is a challenging task due to the complex interaction of various physical mechanisms. We keep the geometry of the fluid channel path identical to the experimental set-up apart from the diffuser exit, which is a sharp edge in the simulation but smoothed in the experiment. In figure 8 the numerical set-up is shown. As noted in § 2.2, the flexure itself is modelled by a harmonic oscillator to which a rigid cantilever beam is attached. In the simulations, this is realized by elastically translating boundary conditions of the beam. The mass, stiffness and damping ratio of the harmonic oscillator are prescribed in the simulations according to the experimental measurements of flextensional setting 1 in table 3.
Instantaneous snapshot of the computational set-up for  $Q=208\ \textrm {L}\ \textrm {min}^{-1}$, showing a slice of velocity magnitude. Exemplary observer points are indicated by the red spheres.

Regarding the RB approximation, as discussed in §§ 2 and 3, we refrain from modelling the beam bending since the most energetic observed mode is primarily a RB motion of the entire flexure, and where the damping of the structure as a whole is well approximated by a second-order damped harmonic oscillator. We preformed precursor simulations that included elasticity of the beam but neglected internal damping, and these confirmed the model predictions discussed in § 5, namely that higher-order oscillatory beam modes do become unstable in the absence of internal damping. Based on the experiments, these results are known to be unphysical and we therefore focus our attention on predicting critical properties of the first, primarily rigid, flextensional based mode. As discussed in Appendix B, we do not account for compressibility and treat the fluid as an incompressible fluid. Our simulations are carried out on a uniform Cartesian mesh (with  $\varDelta =1$ and
 $\Delta t=1$ in lattice units), where we resolve the beam with roughly
 $250$ lattice points. All other dimensions follow from the experimental set-up and a snapshot of the computational domain is shown in figure 8. Further, the inflow velocity is conservatively set to
 $u=0.0075$ (in lattice units) to avoid any compressibility effects. The Reynolds number is set to
 $Re_h = u_t \bar {h}/\nu \approx 5200$, which is chosen such that it is high enough to account for viscous effects but low enough to provide sufficient resolution for all pertinent flow scales. To that end, convergence of the critical flow rates was verified with coarser meshes. An advantage of the current LBM formulation is that sufficient resolution can be verified by looking at the space–time dependent relaxation parameter
 $\gamma$ for the higher-order moments. In the fully resolved case, the relaxation parameter tends to its limiting value
 $\gamma _{{lim}}=2$, corresponding to the classical LBGK model (Bösch et al. Reference Bösch, Chikatamarla and Karlin2015a). Any deviation from 2 is an indication of under-resolution (Dorschner et al. Reference Dorschner, Frapolli, Chikatamarla and Karlin2016b,Reference Dorschner, Bösch, Chikatamarla, Boulouchos and Karlina). In the current simulation,
 $\gamma$ has an phase-averaged value of
 $\approx 1.9$, indicating negligible under-resolution. Furthermore, the agreement with experiments gives us confidence that all pertinent mechanisms are captured by our simulations.
Figure 9 shows the evolution of the velocity magnitude in the mid-plane of the domain for one representative cycle. In the beginning of each cycle for a phase angle  $\varphi =0$, the beam displacement is zero and two symmetric jets on the top and bottom of the beam structure. Note also that residual turbulence from the previous cycle is visible in the bottom half of the diffuser. Subsequently, for
 $\varphi =0.125$, the beam moves downward, leading to an increase of mass flow through the upper diffuser channel until the mass flow through the bottom channel almost ceases at
 $\varphi =0.25$. Consequently, the upper jet amplifies and penetrates deeper into the diffuser until it eventually breaks up into turbulence beyond the beam. The maximum penetration of the jet into the diffuser is reached at
 $\varphi =0.25$. Notably, the jet does not penetrate much beyond the length of the beam, where it is then expanding into the bottom half of the domain and rapidly broken up into finer-scale turbulence. During its upward motion beyond
 $\varphi =0.25$, the upper jet weakens whereas the mass flow rate through the bottom half of the domain gradually increases. Finally, at
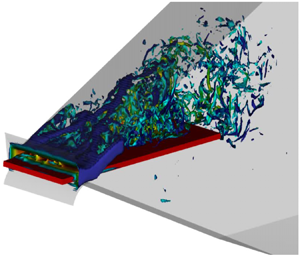
 $\varphi =0.5$, the process repeats in a symmetric fashion for the bottom half of the channel. In figure 10 vorticity isosurfaces coloured by velocity magnitude are shown for the first half of the oscillation period. The behaviour is analogous to what was observed for the velocity magnitude. However, we can additionally observe the effect of spanwise confinement. Starting from a phase angle of
 $\varphi =0.25$, one can observe vortical structures attaching to the side and upper walls of the diffuser geometry. Downstream of the throat, a large lambda-type vortex structure is formed on the upper diffuser wall due to vortex rollup from both sides of the beam. Consequently, most vorticity is confined in the centre region of the beam, whereas only negligible vorticity is found in regions close to the diffuser side walls and downstream of the throat.
Flow evolution for one period of the energy harvester, showing a slice of velocity magnitude.

Flow evolution for half a period of the energy harvester, showing isosurfaces of vorticity coloured by velocity magnitude and zoomed into the diffuser region.

To assess the predictive capabilities and validity of our computational model, we run a series of simulations for flow rates in the range of  $Q=100$ to
 $300\ \textrm {L}\ \textrm {min}^{-1}$ and record the time evolution of the beam displacement. This allows us to obtain an estimate of the critical flow rate at which the beam starts to exhibit self-sustained oscillations. As shown in figure 11, the critical flow rates as computed by our simulations agree well with the experiments.
Beam oscillation amplitude as a function of the flow rate for the experiments as well as the numerical simulations.

Note that in the simulation it is not possible to fully resolve the thin fluid layer between beam and the throat for the experimental geometry. This is due to the fact that in our experiments, and as indicated in figure 4, the beam oscillation amplitude becomes large and sometimes collides with the wall (see error bars). Such collisions are not explicitly modelled in our numerical model. However, since we are only interested in the onset of self-sustained oscillation, we stop the simulation once the beam displacement reaches the height of the throat. In addition to recording the oscillation amplitude for various flow rates, we also probe the hysteresis behaviour of the system to access the bifurcation type. To that end, the simulation of  $Q=208\ \textrm {L}\ \textrm {min}^{-1}$ is restarted and the flow rate reduced. As shown in figure 11, we observe a pronounced hysteresis behaviour, again indicative of a subcritical Hopf bifurcation, which is in agreement with the experimental findings. The hysteresis is, however, more pronounced in the simulations. One potential explanation comes from the perturbation and noise inherent in our experiments (i.e. collision of the beam with the channel wall), which would tend to push the beam states from the stable limit-cycle basin of attraction to that of the stable equilibrium earlier (i.e. at a higher flow rate than the fold point), resulting in a smaller experimental hysteresis loop. In figure 12 the evolution of the beam displacement as well as the PSD is shown for the critical flow rate of
 $Q=208\ \textrm {L}\ \textrm {min}^{-1}$. As expected, the beam displacement undergoes exponential growth and, from the PSD, oscillates near the natural frequency of the flexure. Once again, this is consistent with what is observed in the experiment.
Evolution of the beam displacement and its PSD.

In addition to the temporal evolution of the beam displacement, three observer probes were placed within the domain. In particular, the probes were placed in the vicinity of the throat, near the trailing edge of the beam as well as in the far field of the diffuser (see figure 8). The evolution of the streamwise velocity for all three probes is depicted in figure 13. Probe 1, located near the throat, shows periodic behaviour with a largely constant amplitude and only a slight decrease in amplitude as the oscillation amplitude of the beam increases due to an increase of the throat gap. A different picture is drawn for the two probes downstream. It is apparent that the amplitude in the initial phase ( $t/T_b< 17$) remains relatively low and increases noticeably afterwards. This is due to the increasing penetration depth of the jet, which eventually reaches the probe location. In addition, the magnitude of the streamwise velocity rapidly decreases as it is diffused further downstream and diminishes to roughly
 $20\,\%$ for probe
 $2$. It is further instructive to look at the PSD plots of the observer probes in figure 14. It is noticeable that the most dominant frequency for probe 1 is the beam frequency, whereas further downstream its first harmonic becomes increasingly larger and eventually dominates. This can be explained by the fact that further downstream there is the coupling between jets in the lower as well as in the upper half of the domain, i.e. the probes feel the influence of both jets, thus doubling the dominant frequency.
Evolution of the streamwise velocity profile for three probes.

Plot of normalized PSD of pressure for the observer points.

Moreover, we measure the phase-averaged profile at  $\varphi =0$ of the spanwise velocity in a cross-section near the throat, as shown in figure 15. The profile is symmetric and linear to a good approximation for most of the span. One can also see the effect of spanwise vortices, which are forming due to spanwise confinement at the edge of the beam. This will be used later as an input and validation of the model assumptions in § 5.
Spanwise velocity profile. (a) Location of the phase-averaging plane. (b) Phase-averaged spanwise velocity profile.

Finally, having an indication of how the flow evolves within the internal flow energy harvester helps support our conjecture that the main driving factor of the instabilities arising in the flow originates from its modulation due to the confinement in the channel throat. This is evidenced by the flow field in figures 9 and 10 where there are no significant flow structures that appear able to drive the instabilities in the wake of the beam. Further validation is presented next, where we devise a reduced-order model that accounts for this modulation phenomenon as the only source of the instability.
5. Model
Armed with insights from our numerical simulations, we reduce the fluid–structure equations of motion to terms that are relevant when considering the flow modulation at the channel throat. In this section we develop an incompressible fluid–structure model that captures the dynamics of the confined flow as the beam oscillates. In particular, we formulate the forces on the beam as a function of the channel area as modulated through the beam motion. The coupled equations of motion, once derived and linearized, represent the modulation of the flow rates through beam motion and confinement. The model presented is an extension of a viscous, quasi-one-dimensional model (Inada & Hayama Reference Inada and Hayama1988, Reference Inada and Hayama1990; Nagakura & Kaneko Reference Nagakura and Kaneko1991; Fujita & Shintani Reference Fujita and Shintani1999, Reference Fujita and Shintani2001, Reference Fujita and Shintani2007; Tosi & Colonius Reference Tosi and Colonius2019), where here we include the effect of flow in the spanwise direction as an additional state solved through a spanwise momentum equation. The structure model is extended to include a moving beam boundary condition to account for the motion of the flextensional transducer. The solid equations are defined in § 2.2 with the appropriate coupling to the fluid pressure. We begin by defining the pressure in terms of flow properties and channel geometry.
5.1. Fluid equations of motion
We consider a three-dimensional control volume analysis of the half-span section of the channel in order to obtain an expression that contains the  $\boldsymbol {\hat {z}}$ momentum terms. (If the total span is considered, the spanwise flow rates are cancelled in momentum conservation because of the symmetry of the flow in the problem.) We would like to obtain an expression of the local pressure to quantify the fluid force onto the flextensional structure. Figure 16 illustrates the control volume boundaries as a section of the diagram in figure 2, with only half of the channel demarcating the control surfaces in
 $\boldsymbol {\hat {z}}$. The surface normal vectors are
 \begin{equation} \left[ \boldsymbol{n}_1 \cdots \boldsymbol{n}_6 \right] = \begin{bmatrix} 1 & -1 & -\dfrac{\textrm{d}h_0}{\textrm{d}\kern0.06em x} & \dfrac{\textrm{d}\delta}{\textrm{d}\kern0.06em x} & 0 & 0 \\ 0 & 0 & 1 & -1 & 0 & 0 \\ 0 & 0 & 0 & 0 & 1 & -1 \end{bmatrix}. \end{equation}
We assume the beam is rigid in  $z$, such that
 $\delta = \delta (x,t)$. Solid walls are in
 $\boldsymbol {n}_3$ and
 $\boldsymbol {n}_4$, with
 $\boldsymbol {n}_1$,
 $\boldsymbol {n}_2$,
 $\boldsymbol {n}_5$ and
 $\boldsymbol {n}_6$ representing free surfaces.
Three-dimensional control volume illustration for the spanwise quasi-1-D leakage flow model. (a) Projection view of channel control volume. (b) Front view of channel control volume.

We apply mass and momentum conservation to this control volume under the simplifying assumptions of constant fluid density and a gradually varying channel in the streamwise direction,  $h_0'^2 \ll 1$ and
 $\delta '^2 \ll 1$, such that
 $\sqrt {1 + h_0'^2} \approx 1$ and
 $\sqrt {1 + \delta '^2} \approx 1$ for
 $x \in [0,L]$. Starting with mass conservation and the three-dimensional velocity vector
 $\boldsymbol {u} = [ u, v, w ]^{\textrm {T}}$, we have
 \begin{equation} \frac{\partial }{\partial t} \left( \int_0^{b/2} \int_{\delta}^{h_0}\,{\textrm{d}y}\,\textrm{d}z \right) + \frac{\partial}{\partial x} \left( \int_0^{b/2} \int_{\delta}^{h_0} u\,{\textrm{d}y}\,\textrm{d}z \right) + \left. \int_{\delta}^{h_0} w \,{\textrm{d}y} \right|_{z=b/2} = 0. \end{equation}
Integrating in  $z$ leads to
 \begin{equation} \frac{\partial Q_x}{\partial x} + \frac{2}{b} \left. Q_z \right|_{z = b/2} = \frac{\partial \delta}{\partial t}, \end{equation}
where
 \begin{equation} Q_x = \int_{\delta}^{h_0} u \,{\textrm{d}y}, \quad Q_z = \int_{\delta}^{h_0} w \,{\textrm{d}y} \end{equation}
are the flow rates per unit length in the streamwise and spanwise directions, respectively. In a similar manner, the momentum equations in  $\boldsymbol {\hat {x}}$ can be obtained as
 \begin{align} &\frac{\partial }{\partial t} \left( \int_0^{b/2} Q_x\,\textrm{d}z \right) + \int_0^{b/2} \frac{\partial \mathcal{N}_x}{ \partial x} \,\textrm{d}z + \left. \mathcal{N}_{xz} \right|_{z = b/2} \nonumber\\ &\quad ={-}\frac{1}{\rho_f} \left\{ \int_0^{b/2} \left[ \frac{\partial}{ \partial x} \left( \int_{\delta}^{h_0} P\, {\textrm{d}y} \right) - h_0' P |_{y=h_0} + \frac{\partial \delta}{\partial x} P |_{y=\delta} \right] \,\textrm{d}z - F_{{visc},x} \right\}, \end{align}
and in  $\boldsymbol {\hat {z}}$ as
 \begin{align} &\frac{\partial }{\partial t} \left( \int_0^{b/2} Q_z \,\textrm{d}z \right) + \frac{\partial }{ \partial x} \left( \int_0^{b/2} \mathcal{N}_{xz} \,\textrm{d}z \right) + \left. \mathcal{N}_{z} \right|_{z = b/2}\nonumber\\ &\quad = \int_{\delta}^{h_0} \left( P|_{z=b/2} - P|_{z=0} \right) \,{\textrm{d}y} - F_{{visc,z}}, \end{align}
where the advection terms are given by
 \begin{equation} \mathcal{N}_x = \int_{\delta}^{h_0} u^2\, {\textrm{d}y}, \quad \mathcal{N}_{z} = \int_{\delta}^{h_0} w^2 \,{\textrm{d}y}, \quad \mathcal{N}_{xz} = \int_{\delta}^{h_0} u w \,{\textrm{d}y}. \end{equation}
The goal of this analysis is to obtain an expression for the pressure as a function of  $\delta$,
 $Q_x$ and
 $Q_z$. To make further progress, we must find a closure for the advection terms
 $\mathcal {N}_x$,
 $\mathcal {N}_z$ and
 $\mathcal {N}_{xz}$, along with
 $F_{{visc,x}}$ and
 $F_{{visc,z}}$ in terms of those variables. Similarly, we must also relate the local pressure values in
 $y$ and
 $z$ to the integrated pressure over the same dimensions.
We consider the infinitesimal NSE in three dimensions non-dimensionalized similar to lubrication theory (Kundu, Cohen & Dowling Reference Kundu, Cohen and Dowling2012),
 \begin{align} \left. \begin{gathered} x^* = \frac{x}{L} , \quad y^* = \frac{y}{\bar{h}} , \quad z^* = \frac{y}{b} , \quad u^* = \frac{u}{U_c} , \quad v^* = \frac{L}{\bar{h} U_c} v , \quad w^* = \frac{w}{U_c} \varepsilon_b , \quad t^* = \frac{U_c}{L} t,\\ P^* = \frac{P}{P_{{in}}}, \quad \hat{h} = \frac{\bar{h}}{L}, \quad \varepsilon_b = \frac{b}{L}, \quad Re_L = \frac{\rho_f U_c L}{\mu_f}, \quad \varLambda = \frac{\mu_f L U_c}{ P_{{in}} \bar{h}^2}. \end{gathered} \!\right\} \end{align}
Here  $P_{{in}}$ is a constant reference pressure upstream of the channel as defined in (5.21). For
 $\hat {h} \rightarrow 0$, the NSE are well approximated by
 \begin{equation} \left. \begin{gathered} 0 ={-}\frac{1}{\varLambda} \frac{\partial P^*}{\partial x^*} + \frac{\partial^2 u^*}{\partial y^{*2}},\\ 0 ={-}\frac{1}{\varLambda} \frac{\partial P^*}{\partial y^*} ,\\ 0 ={-}\frac{1}{\varLambda} \frac{\partial P^*}{\partial z^*} + \varepsilon_b^2 \frac{\partial^2 w^*}{\partial y^{*2}}. \end{gathered} \right\} \end{equation}
To obtain a simple expression for the flow velocities, we first assume that the flow remains largely one-dimensional in  $x$ for
 $u$ and
 $v$, and recover the quasi-one-dimensional parabolic profile of
 $u^* = u^*(y^*(x^*),t^*)$, with
 $v \approx 0$. Next we assume that any
 ${\partial P^*}/{\partial z^*}$ is due to the motion of the channel walls, and that no time-averaged net pressure gradient exists in
 $z$. It follows that, due to the symmetry of the geometry in figure 16,
 $w^* |_{z = 0} = 0$ and
 $w^*$ odd in
 $z = [-({b}/{2}),{b}/{2} ]$ with
 $P^*$ symmetric in the same
 $z^*$ interval. If
 ${\partial P^*}/{\partial z^* } \neq 0$ and
 $P^* = P^*(x,z,t)$, the spanwise component in (5.9) can be integrated twice (with the no-slip conditions) to also recover a parabolic profile of
 $w^*$ in
 $y^*$. Combined with a linear function in
 $z^*$, the one of lowest order that satisfies the specified symmetries, we assume a functional form for the spanwise velocity profile as
 \begin{equation} w^*(x^*,y^*,z^*,t) \sim z^* \left(\frac{\delta(x^*,t^*) }{\bar{h}}- y^* \right) \left(\frac{h_0(x^*) }{\bar{h}} - y^*\right). \end{equation}
As a first check to the conjecture that  $w^* \sim z^*$, we consult the numerical simulation results and compute the phase-averaged
 $w$ at
 $\varphi =0$ near the throat as indicated in figure 15(a). Figure 15(b) shows that
 $w$ is linear to good approximation for most of the beam span. The deviation from the linear profile can be attributed to the channel spanwise confinement and the associated vortices forming at the corners of the beam edge. Even considering those effects, the linear approximation appears to be a reasonable trade-off between accuracy and simplicity. With an expression for
 $w^*$ as a function of
 $y^*$,
 $\mathcal {N}_z$ and
 $F_{{visc,z}}$ can be defined in terms of
 $Q_z$,
 \begin{equation} \mathcal{N}_z = \xi_z \frac{Q_z^2}{h_0 - \delta}, \quad F_{{visc,z}} ={-}12 \mu_f \frac{ Q_z }{\left( h_0 - \delta \right)^2}, \end{equation}
with the latter taking the form for a Newtonian fluid. Here  $\zeta _z = 6/5$.
The remaining advection terms in (5.7a–c) can be defined in terms of  $Q_x$ and
 $Q_z$,
 \begin{equation} \mathcal{N}_{x} = \xi_x \frac{Q_x^2}{h_0 - \delta}, \quad \mathcal{N}_{xz} = \xi_{xz} \frac{Q_x Q_z}{h_0 - \delta}, \end{equation}
where  $\xi _{x}$ and
 $\xi _{xz}$ are a constant profile ‘shape factor’ for axial and axial-spanwise cross-coupling velocities. Here
 $F_{{visc,x}}$ takes the form (Tosi & Colonius Reference Tosi and Colonius2019)
 \begin{equation} F_{{visc,x}} ={-} \frac{f(Q_x)}{4} \frac{Q_x^2}{\left(h_0 - \delta \right)^2}, \end{equation}
where the Fanning friction factor,  $\,f$,
 \begin{equation} f = \begin{cases} 48 Re_h^{{-}1} & \text{if } Re_h < 1000, \\ 0.26 Re_h^{{-}0.24} & \text{if } Re_h \geq 1000, \end{cases} \end{equation}
with  $Re_h = \hat {h} Re_L$. We model the profile shape factor as
 \begin{equation} \mathcal{\xi}_x = \mathcal{\xi}_{xz} = \begin{cases} 6/5 & \text{if } Re_h < 1000, \\ 1 & \text{if } Re_h \geq 1000, \end{cases} \end{equation}
where the laminar value ( $Re_h < 1000$) coincides with the lubrication theory frictional result (Kundu et al. Reference Kundu, Cohen and Dowling2012; Tosi & Colonius Reference Tosi and Colonius2019), and the turbulent case follows from the blunted mean velocity profile in the outer region and neglects the thin inner region.
Next, we define the relation between evaluated and integrated  $P$ and
 $Q_z$ in
 $y$ and
 $z$. Substituting the form in (5.10) into the spanwise component of (5.9), we ascertain that
 $P^* \propto z^{*2}$. We keep integrated
 $z$ quantities as model variables, normalizing them such that they represent the spatial average of
 $P$ and
 $Q_z$ over
 $z = [0, {b}/{2}]$,
 \begin{equation} \bar{P} = \frac{2}{b} \int_0^{b/2} P \,\textrm{d}z, \quad \bar{Q}_z = \frac{2}{b} \int_0^{b/2} Q_z \,\textrm{d}z. \end{equation}
With the definition of  $w$ from
 $w^*$ in (5.8) and (5.10), along with the definitions immediately above, we have
 \begin{equation} \left. P \right|_{z = 0} = \frac{3}{2} \bar{P}, \quad \left. Q_z \right|_{z = b/2} = 2 \bar{Q}_z. \end{equation}
Mass conservation in (5.3), and axial and spanwise momentum, (5.5) and (5.6), can now be simplified to
 \begin{gather} \frac{\partial Q_x}{\partial x} + \frac{4}{b} \bar{Q}_z= \frac{\partial \delta}{\partial t}, \end{gather}
 \begin{gather} \frac{\partial Q_x }{\partial t} + \frac{\partial }{ \partial x} \left( \xi_x \frac{Q_x^2}{h_0 - \delta} \right) + 4 \xi_{xz} \frac{Q_x \bar{Q}_z}{b \left(h_0 - \delta \right)} ={-}\frac{1}{\rho_f} \frac{\partial \bar{P} }{ \partial x} \left( h_0 - \delta \right) + F_{{visc,x}}, \end{gather}
 \begin{gather} \frac{\partial \bar{Q}_z }{\partial t} + \frac{\partial }{\partial x} \left( \xi_{xz} \frac{ Q_x \bar{Q}_z }{h_0 - \delta } \right) + 8 \xi_z \frac{ \bar{Q}_z^2 }{b \left( h_0 - \delta \right)}\nonumber\\ ={-}\frac{2 \left( h_0 - \delta \right)}{ b \rho_f}\left( P|_{z = b/2} - \frac{3}{2} \bar{P} \right) - \frac{12 \mu_f}{\rho_f} \frac{ \bar{Q}_z }{\left( h_0 - \delta \right)^2}. \end{gather}
Equations (5.18), (5.19) and (5.20) comprise the fluid equations of motion that describe the averaged spanwise local pressure in  $x$ as a function of the passage shape and dynamics. Pressure boundary conditions are required to solve them uniquely. Based on leakage flow instability work (Inada & Hayama Reference Inada and Hayama1988, Reference Inada and Hayama1990; Nagakura & Kaneko Reference Nagakura and Kaneko1991; Tosi & Colonius Reference Tosi and Colonius2019),
 \begin{equation} \left. \begin{gathered} \bar{P}(t)|_{x=0} = P_{{in}} - \frac{\zeta_{{in}}}{2} \rho_f \left[ \left( \frac{Q_x}{h_0 - \delta} \right)^2 \right]_{x=0},\\ \bar{P}(t)|_{x=L} = P_{{out}} + \frac{\zeta_{{out}}}{2} \rho_f \left[ \left( \frac{Q_x}{h_0 - \delta} \right)^2 \right]_{x=L}, \end{gathered} \right\} \end{equation}
where  $\zeta _{{in}} \geq 1$ and
 $\zeta _{{out}} \geq 0$ are loss coefficients, and the departure from equality represents non-isentropic processes. Here
 $P_{{in}}$ and
 $P_{{out}}$ are constants. The boundary value for
 $P|_{z=b/2}$ appears explicitly in (5.20), and is an additional boundary condition needed for the control volume in figure 16. We maintain the same form to define the pressure at the edge surface
 $z = b/2$,
 \begin{equation} P(x,t)|_{z=b/2} = p_0(x) + \frac{\zeta_{{out,z}}}{2} \rho_f \left( \frac{2 \bar{Q}_z(x,t)}{h_0 - \delta} \right)^2 . \end{equation}
Equation (5.22) states that when  $\bar {Q}_z = 0$, the pressure at the boundary is the steady pressure of the two-dimensional channel
 $p_0$. This is consistent with the assumption that no time-averaged net pressure gradient exists in
 $z$, used to obtain
 $w^*$. The pressure loss coefficient is
 $\zeta _{{out,z}} \geq 0$, and it can be used to account for any pressure losses in the movement of the flow between top and bottom channels via surface 5 in figure 16.
5.2. Linearized model
The goal of this model is to predict the linear stability (i.e. flutter boundary) of an equilibrium beam shape  $\delta _0(x)$, as a function of parameters in table 1. We begin this process by expanding the dependent variables about their respective equilibrium values in a small parameter,
 $\varepsilon$, representing the amplitude of the beam displacement. That is, we take
 \begin{equation} \left. \begin{gathered} \delta(x,t) = \delta_0(x) + \varepsilon \delta_1(x,t) + \ldots, \\ \bar{P}(x,t) = p_0(x) + \varepsilon p_1(x,t) + \ldots, \\ Q_x(x,t) = q_{x0}(x) + \varepsilon q_{x1}(x,t) + \ldots, \\ \bar{Q}_z(x,t) = q_{z0}(x) + \varepsilon q_{z1}(x,t) + \ldots, \end{gathered} \right\} \end{equation}
as well as the linearized friction factor
 \begin{equation} f(Q_x) \approx f(q_{x0}) + (Q_x - q_{x0}) \left[ \frac{\mathrm{d} f}{\mathrm{d} Q_x} \right]_{Q_x = q_{x0}} + \ldots\nonumber\\ \approx f_0 + \varepsilon \eta q_{x1}(x,t) + \ldots, \end{equation}
determined from laminar and turbulent relations in (5.13) and (5.14). At zeroth order of  $\varepsilon$, we obtain a differential equation describing the equilibrium beam shape
 \begin{equation} \frac{EI}{b} \frac{\mathrm{d}^4}{\textrm{d}\kern0.06em x^4} \delta_0(x) = p_0^{{bot}} - p_0^{{top}}, \end{equation}
with an homogeneous and elastic boundary condition
 \begin{equation} \frac{k_0}{b} \delta_0(0) = \int_0^L \left( p_0^{{bot}} - p_0^{{top}} \right)\,{\textrm{d}\kern0.06em x}. \end{equation}
Once again, the superscripts ‘top’ and ‘bot’ refer to parameters associated with  $h_0^{{top}}$ and
 $h_0^{{bot}}$ as the channel shapes above and below the beam, respectively. Substituting the expansions into (5.18), (5.19) and (5.20), and applying
 $q_{z0}(x) = 0$, we recover the same steady pressure and flow rate equations as those in Tosi & Colonius (Reference Tosi and Colonius2019),
 \begin{gather} p_0(x) = {P_{{in}}} - {\rho}_{f} q_{x0}^2 \left( \frac{ {f}_{0} }{4} \int_{0}^{ {x}} \frac{\textrm{d}\kern0.06em {x_2}}{{h_e\left( {x_2}\right)}^3} - {\xi_x} \int_{h_e(0)}^{ h_e(x)} \frac{\textrm{d} h_e}{h_e^3} + \frac{ {\zeta_{ {in}}}}{2 {h_e\left(0\right)}^2} \right), \end{gather}
 \begin{gather} q_{x0} = \left( \frac{ {P_{{in}}} - {P_{{out}}}}{ {\rho}_{f} \left[ \dfrac{ \zeta_{{out}}} {2 h_e\left(L\right)^2} + \dfrac{ \zeta_{{in}}} {2 h_e\left(0\right)^2} - {\xi_x} \left(\displaystyle\int_{h_e(0)}^{h_e(L)} \dfrac{\textrm{d} h_e}{h_e^3} \right) + \dfrac{f_{0}}{4} \left(\displaystyle\int_{0}^{L} \dfrac{\textrm{d}\kern0.06em {x_2}}{{h_e \left( {x_2}\right)}^3} \right) \right] } \right)^{{1}/{2}}, \end{gather}
where  $h_e(x) = h_0(x) - \delta _0 (x)$ is the equilibrium channel height. The linear order terms are
 \begin{gather} q_{x1} = \int_0^x \dot{\delta_1}\,\textrm{d}\kern0.06em x_1 - \frac{4}{b} \int_0^x q_{z1}\,\textrm{d}\kern0.06em x_1 + q_{x1}(0,t), \end{gather}
 \begin{gather} \dot{q}_{x1} + 2\xi_x q_{x0} \frac{\partial}{\partial x} \left( \frac{q_{x1}}{h_0} \right) + \frac{q_{x0}}{2 h_0^2}\left( \lambda_0 + \frac{\eta}{2}q_{x0} \right) q_{x1}\nonumber\\ = \xi_x \frac{q_{x0}^2}{h_0^2} \frac{\partial \delta_1}{\partial x} - \frac{3 }{\rho_f} \frac{\partial p_0 }{\partial x} \delta_1 - 4\xi_{xz}\frac{q_{x0}}{b h_0} q_{z1} - \frac{h_0}{\rho_f} \frac{\partial p_1}{\partial x}, \end{gather}
 \begin{gather} \dot{q}_{z1} + \xi_{xz} q_{x0} \frac{\partial}{\partial x} \left( \frac{q_{z1}}{h_0} \right) + \frac{12 \mu }{\rho_f h_0^2} q_{z1} = \frac{h_0}{3 \rho_f} p_1. \end{gather}
Manipulation is required to obtain an expression for  $p_1$ as a function of
 $\delta _1$,
 $q_{z1}$ and their derivatives. Though it is not useful to show the full form of such an expression because of its length and complexity, the following are the steps carried out in the MATLAB symbolic engine to obtain it: first we differentiate in
 $x$ (5.30), then substitute (5.29) into that result. Next, we solve (5.31) for
 $\dot {q}_{z1}$ and substitute the resulting expression into the previous result for the combined set of equations. We can then separate the pressure dependent terms as
 \begin{equation} \frac{\partial^2 p_1}{\partial x^2} + \left( \frac{h_0'}{h_0} \right) \frac{\partial p_1}{\partial x} - \frac{12}{b^2} p_1 = r(x,t), \end{equation}
where we have an inhomogeneous differential equation for  $p_1$ with the right-hand side
 $r(x,t)$ as a forcing term containing
 $\delta _1$ and its derivatives, along with
 $q_{z1}$ and its derivatives. Equation (5.32) cannot be solved analytically for arbitrary forms of
 $h_0$. Two solvable forms of
 $h_0$ are for constant and linear channels. For each of those cases, (5.32) can be solved with the variation of parameter method. The fundamental solutions are found by solving the homogeneous problem (
 $r(x,t) = 0$), then convolved in the variation of parameters integral to obtain the particular solution. Respective coefficients are found by equating the linearly superimposed homogeneous and particular pressure solutions to the linearized pressure boundary conditions at
 $x = 0$ and
 $x = L$,
 \begin{gather} p_1(0,t) = \frac{2 \left( {P_{{in}}} - p_{0}\!\left(0\right) \right) }{h_e\left(0\right)} \delta_{1}\left(0,t\right) - {\zeta_{{in}}} \frac{{\rho}_{f}\, q_{x0} }{{h_e\left(0\right)}^2} q_{x1}\left(0,t\right), \end{gather}
 \begin{gather} p_1(L,t) = \frac{2 \left( {P_{{out}}} - p_{0}\left(L\right) \right)}{{h_e\left(L\right)}} \delta_{1}\left(L,t\right) + {\zeta_{{out}}} \frac{ {\rho}_{f} q_{x0} }{{h_e\left(L\right)}^2} q_{x1}\left(L,t\right). \end{gather}
Fundamental solutions for a constant channel are two real exponential functions, while those of a linear channel are a set of modified Bessel functions.
Once  $p_1$ is defined, two other relations are needed to complete the fluid system of equations. First, the time evolution of the boundary forcing flow rate
 $q_{x1}(0,t)$ in (5.29) must be defined. This is done by substituting
 $p_1$ into (5.32) evaluated at
 $x=0$, and solving for
 $\dot {q}_{x1}(0,t)$ in terms of
 $\delta _1$,
 $q_{z1}$ and their derivatives. Last, the time evolution of
 $q_{z1}$ is obtained by substituting
 $p_1$ into (5.31) and also solving for
 $\dot {q}_{z1}$ in terms of
 $\delta _1$,
 $q_{z1}$ and their derivatives.
Next we collect and equate coefficients to linear order in  $\varepsilon$ for the beam,
 \begin{equation} \rho_s h_b\frac{\partial^2 \delta_1}{\partial t^2} + \frac{EI}{b}\frac{\partial^4 \delta_1}{\partial x^4} = p_1^{{bot}} - p_1^{{top}}, \end{equation}
together with an homogeneous and elastic boundary condition,
 \begin{equation} \frac{m_0}{b} \ddot{\delta}_1(0,t) + \frac{c_0}{b} \dot{\delta}_1(0,t) + \frac{k_0}{b} \delta_1(0,t) = \int_0^L \left( p_1^{{bot}} - p_1^{{top}} \right)\,{\textrm{d}\kern0.06em x}. \end{equation}
To numerically solve the linear system of PDEs given by (5.29) to (5.36), we expand the first-order beam displacement in a series of basis functions
 \begin{equation} \delta_1(x,t) = \sum_{i=0}^{n} a_i(t) g_i(x), \end{equation}
where
 \begin{equation} g_i(x) = \begin{cases} 1 & \text{for } i = 0 ,\\ \phi_i(x) & \text{for } i = [1, n], \end{cases} \end{equation}
and  $\phi _i(x)$, defined in (D3), are solutions of the homogeneous (unforced) beam equation in the domain
 $x \in [0,L]$. The constant
 $g_0=1$ base accounts for the elastic boundary condition via (5.36). Because
 $\phi _i$ does not enforce the boundary values for
 $q_{z1}$ at
 $x = 0$ and
 $x = L$, we seek another basis expansion that does. Specifically,
 $q_{z1}|_{x = 0,L}$ are determined by (5.31) when evaluated at
 $x = 0$ and
 $x = L$, with the pressure boundary condition at
 $x=0$ and
 $x=L$ in (5.33) and (5.34) applied,
 \begin{equation} \left. \dot{q}_{z1} \right|_{x=0,L} = \left. \frac{h_0}{3 \rho_f} p_1 \right|_{x=0,L} - \xi_{xz} \left. q_{x0} \frac{\partial}{\partial x} \left( \frac{q_{z1}}{h_0} \right) \right|_{x = 0,L} - \left. \frac{12 \mu }{\rho_f h_0^2} q_{z1}\right|_{x=0,L}. \end{equation}
We use the linear superposition of solutions that satisfy the inhomogeneous boundary conditions, but homogeneous equation, and those that satisfy the homogeneous boundary condition, but inhomogeneous problem to solve the full inhomogeneous boundary value problem. A sine series expansion, truncated at  $m$ terms, is chosen for the latter since homogeneous Dirichlet boundaries are present. Hence, for the expansion
 \begin{equation} q_{z1}(x,t) = \sum_{i=0}^{m} \tilde{q}_{i}(t) \psi_i(x), \end{equation}
we have
 \begin{equation} \psi_i(x) = \begin{cases} \left( 1 - \dfrac{x}{L} \right) & \text{for } i = 0, \\ \tilde{\psi}_i(x) & \text{for } i = [1, m-1], \\ \left( \dfrac{x}{L} \right) & \text{for } i = m, \end{cases} \end{equation}
where
 \begin{equation} \tilde{\psi}_i(x) = \sin\left( \frac{\textrm{i} {\rm \pi}x }{L} \right) \end{equation}
for  $i \in \mathbb {Z} : [0,m]$.
5.3. Fluid–structure equations for symmetric channels
The model developed includes the analytical formulation of distinct constant or linear top and bottom channel geometries. Here we write the coupled equations for a symmetric channel relevant to the flextensional geometry in figure 1. We would like to understand the dynamics around the equilibrium  $\delta _0 = 0$, which is a solution to (5.25) and (5.26) when
 $p_0^{{top}} = p_0^{{bot}}$. Two formulations of the structure are considered. For the EB beam formulation, we apply the expansion of
 $\delta _1$ in
 $g_i(x)$ and
 $q_{z1}$ in
 $\psi _i(x)$ via steps in § 5.2 to obtain the fluid–structure coupled equations,
 \begin{align} &\sum_{i = 0}^{n} \left( M_{{s} i}(x) \ddot{a}_i(t) + C_{{s} i }(x) \dot{a}_i(t) + K_{{s} i }(x) a_i(t) \right)\nonumber\\ &\quad ={-} 2T_{{f}}(x) q_{x1}(0,t) - 2\sum_{i = 0}^{n} \left( M_{{f} i}(x) \ddot{a}_i(t) + C_{{f} i}(x) \dot{a}_i(t) + K_{{f} i}(x) a_i(t) \right)\nonumber\\ &\qquad - 2\sum_{i = 0}^{m} H_{{f} i}(x) \tilde{q}_{i}(t), \end{align}
with  $M_{{s} i }$,
 $C_{{s} i }$,
 $K_{{s} i }$ defined in the appendix by (E2), (E3) and (E4), respectively. Coefficients
 $T_{{f}}$,
 $M_{{f} i}$,
 $C_{{f} i}$,
 $K_{{f} i }$ and
 $H_{{f} i }$ are obtained through (5.35) for
 $i = [1,n]$, and (5.36) for
 $i=0$ (i.e. boundary term), both via procedures in § 5.2 to solve for
 $p_1$. In the RB beam formulation,
 $\delta = \delta (t)$, and only (5.36) for
 $i=0$ boundary term is considered in (5.43).
The dynamics of the axial boundary flow rate are given by
 \begin{equation} \dot{q}_{x1}(0,t) = G_{{q}} q_{x1}(0,t) + \sum_{i = 0}^{n} \left( B_{{q} i} \ddot{a}_i(t) + D_{{q} i} \dot{a}_i(t) + E_{{q} i} a_i(t) \right) + \sum_{i = 0}^{m} H_{{q} i} \tilde{q}_{i}(t), \end{equation}
and the spanwise boundary flow rate dynamics as
 \begin{align} \sum_{i = 0}^{m}\dot{\tilde{q}}_{i}(t) \psi_i(x) &= \tilde{G}_{{q}}(x) q_{x1}(0,t) + \sum_{i = 0}^{n} \left( \tilde{B}_{{q} i}(x) \ddot{a}_i(t) + \tilde{D}_{{q} i}(x) \dot{a}_i(t) + \tilde{E}_{{q} i}(x) a_i(t) \right)\nonumber\\ &\quad + \sum_{i = 0}^{m} \tilde{H}_{{q} i}(x) \tilde{q}_{i}(t). \end{align}
Coefficients for  $a_i$,
 $\dot {a}_i$,
 $q_{x1}(0,t)$ and
 $\tilde {q}_{i}$ in (5.44) are determined following steps in § 5.2 for (5.32). Coefficients in (5.45) are produced from (5.39) evaluated at
 $x = 0$ and
 $x = L$ for the boundary terms at
 $i = 0$ and
 $i = m$, respectively, and from (5.31) for
 $i = [1,m-1]$. We obtain the semi-continuous system in time via projection of (5.43) and (5.45) onto test unctions. For the EB formulation, we write the solution vector as
 \begin{equation} \boldsymbol{x} = \left[ a_0 \quad a_1 \quad \ldots \quad a_n \quad \dot{a}_0 \quad {\dot a}_1 \quad \ldots \quad {\dot a}_n \quad q_{x1}(0,t) \quad \tilde{q}_{0} \quad \tilde{q}_{1}\quad \ldots \quad \tilde{q}_{m} \right]^{\textrm{T}}, \end{equation}
and the resulting ordinary differential equation system is
 \begin{equation} \dot{\boldsymbol{x}} = \boldsymbol{A} \boldsymbol{x}. \end{equation}
The entries of  $\boldsymbol {A}$ and the projection test functions are given in the appendix. The eigenvalues and eigenvectors of
 $\boldsymbol {A}$ are computed to determine the flutter boundary for the coupled FSI system. For the RB formulation, components of
 $\boldsymbol {x}$,
 $a_i$ and
 $\dot {a}_i$ for
 $i = [1,n]$ are removed since the beam motion is driven by the boundary equation only.
5.4. Modelling flow separation
Results from numerical simulations in § 4.2 show the flow is separated from the top wall as it enters the diffusing part of the channel. In order to account for flow separation within the model framework, we conjecture that the pressure distribution over the beam surface behaves approximately as that of an attached flow within a plane-asymmetric diffuser of angle  $\alpha _{{m}}$. High Reynolds number numerical and experimental studies of plane-asymmetric diffusers suggest that flow separation from the diffusing wall happens for
 $\alpha _{{m}} \gtrsim 7^{\circ }$, and is independent of Reynolds number for turbulent flows (Kaltenbach et al. Reference Kaltenbach, Fatica, Mittal, Lund and Moin1999; Lan, Armaly & Drallmeier Reference Lan, Armaly and Drallmeier2009; Törnblom, Lindgren & Johansson Reference Törnblom, Lindgren and Johansson2009; Chandavari & Palekar Reference Chandavari and Palekar2014). Hence, we solve (5.47) for the simplified geometry in figure 17.
Illustration of spanwise quasi-1-D geometry for comparison to experimental results.

To summarize, the separation bubble over the diffusing channel walls effectively serve as a secondary diffuser boundary at an effective expansion angle of  $\alpha _m < \theta$. The pressure distribution on the beam surface behaves as if the flow had been attached and expanded at
 $\alpha _m$. At the end of the effective diffuser expansion (
 $x=L$), we assume that the outlet boundary pressure variation behaves as an abrupt expansion at the outlet, where
 $\zeta _{{out}} = 1$.
5.5. Model-experiment comparison
We now use the model to assess critical parameters at the onset of flutter. Critical flow rates and frequencies are calculated over integer values of  $\alpha _m = [1\text {--}8]^{\circ }$ for the flexible EB and RB beam formulations. As in precursor numerical simulations, the EB modelled cantilever modes are quickly (or immediately) unstable once flowing in the absence of internal material damping terms. This unphysical behaviour precludes their direct comparison to experimental results (i.e. mode 2 in figure 3). However, the EB model still allows us to extract the flexure/flextensional mode where damping has been accounted and experimentally measured, and compare its critical flow rate, frequency and corresponding shape to those observed experimentally (i.e. mode 1 in figure 3). Hence, only the primary flexure mode is considered for comparison in the EB formulation.
Beginning with critical flow rates, figure 18 shows their calculated values for the EB and RB model formulations compared with experimental values for the three flextensional settings. The corresponding critical frequencies are shown in figure 19. Both model critical flow rate trends are convex, with  $\alpha _{{m}} \approx 4^{\circ }$ representing the least stable configuration over the diffuser angles tested. For flextensional setting 2,
 $\alpha _{{m}} = 1^{\circ }$ critical values are not shown as the mode was stable for tested flow rates (
 $[0\text {--}500]\ \textrm {L}\ \textrm {min}^{-1}$). Though EB model critical flow rate values tend to be higher than those predicted by the RB model, they are close to one another at
 $\alpha _{{m}} > 3^{\circ }$. Both EB and RB model predictions match experimental critical flow rates near
 $\alpha _m \approx 7^{\circ }$ for all three flextensional settings. This suggests that the critical diffuser angle for plane-asymmetric diffusers may be dictating the flow expansion and pressure distribution over the flow energy harvester channel. Critical frequency trends in figure 19 are largely constant, with a slight increase as
 $\alpha _{{m}}$ increases in both EB and RB models. Predicted frequency values are also close between both model formulations and to those observed experimentally.
Flutter boundary defined by critical flow rate vs. diffuser expansion angle for all three flextensional settings. (a) Flex. 1. (b) Flex. 2. (c) Flex. 3.

Frequencies at critical flow rates vs. diffuser expansion angle for all three flextensional settings. (a) Flex. 1. (b) Flex. 2. (c) Flex. 3.

Figure 20 shows the unstable EB flexure eigenvectors and experimental SPOD modes closest to the flutter bifurcation point for each of the three flextensional settings. Predicted EB model mode shapes are similar to SPOD modes for flextensional settings 1 and 2, but captures only the RB motion, missing the beam shape for flextensional setting 3. The primary motion seen in the modes shown is associated with the translation of the flextensional boundary condition, and are largely captured by the RB formulation.
Mode shape comparison between EB model and experimental SPOD results. (a) Flex. 1. (b) Flex. 2. (c) Flex. 3.

6. Conclusions
This paper explored the fluid–structure instability that drives the dynamics of a flextensional based flow energy harvester. In particular, we sought to elucidate the mechanisms that drive the system into flutter, which represents the transition between low and high power extraction regimes for the device.
First, we experimentally assessed the dynamics of the flextensional based flow energy harvester in air flow. Experiments characterized the device's mechanical properties, then appraised the system dynamics in flowing conditions. Critical flow rates and frequencies were measured for three different flextensional settings, with self-sustaining oscillations reached in the flextensional mode (translational motion at the base of the beam) in all three cases tested. Hysteresis was observed as the flow rate direction is reversed, indicating a bi-stable region and a subcritical Hopf bifurcation at the critical point, also in all three settings.
Numerical simulations were then carried out in three-dimensions to characterize the flow field and edify the experimentally observed flutter. Structure equations for a rigid beam were coupled with a lattice-Boltzmann flow solver to characterize the motion of the flextensional base, and any ensuing coherent structures within the velocity field. The incompressible formulation of flow equations and RB structure were able to replicate the critical point and the bi-stable region of the subcritical Hopf bifurcation. Results showed that the flow rate modulation due to confinement at the channel throat largely drives the velocity fluctuations observed at downstream stations. They pointed at a confinement based instability where flow compressibility does not play a significant role.
Finally, an incompressible quasi-one-dimensional fluid–structure model based on flow rate modulation due to confinement in the axial and spanwise directions was developed. Flow equations were derived for small throat-to-beam length ratios and defined the pressure on the structure surface as a function of beam displacement and velocity. Results showed that the flutter onset is captured for a linear diffuser channel, matching experimental values near the typical separation angle for plane-asymmetric diffusers of  $7^{\circ }$. The resulting model mode shapes agreed well with experimental SPOD modes for two of the three flextensinal settings tested, with all three capturing the primary base translation motion.
We believe that this work provides tantalizing evidence that the positive feedback between beam displacement (and velocity) and the flow modulation due to confinement is likely the dominant mechanism that drives the flutter instability within the flextensional flow energy harvester system. Flow compressibility and beam flexibility do not appear to significantly impact the fluid–structure dynamics on the current design. Agreement between model-predicted critical properties and experimental results suggest that the framework developed can be used to assess not only future flow energy harvester designs, but fluid–structure systems where small throat-to-beam lengths dominate the dynamics.
Acknowledgements
The authors would like to acknowledge the help, insight and facilities support of S. Sherrit, H.J. Lee and Y. Bar-Cohen at the Jet Propulsion Laboratory.
Funding
We would like to acknowledge Bosch Energy Research Network (BERN) grant 13.01.CC17, the Stanback Space Innovation Program and the NASA Jet Propulsion Laboratory for their support of this research. B.D. also gratefully acknowledges the support of SNF under the grant no. P2EZP2_178436.
Declaration of interests
The authors report no conflict of interest.
Appendix A. Dimension, material and measurement tables
Table 5 shows dimensions associated with the flextensional design highlighted in figure 1.
Table of flow path parameter dimensions illustrated in figure 1.

Material and electrical properties for flexure and PZT stacks are shown in tables 6 and 7.

Table of relevant piezoelectric stack properties.

Results from the static displacement force and dynamic tests for three flextensional configurations are shown in tables 8 and 9.
Table of mean force (N) at different displacement values for three flexure settings, with a linear best fit slope describing the stiffness  $k_0$
 $(\textrm {N}\ \textrm {m}^{-1})$.

Table of experimental flexure values for flexure dynamic test.

Appendix B. Compressibility at critical flow rates
Given  $Q_{{cr}}$ results in table 10, it is plausible that throat velocities may reach a considerable fraction of the sound speed. To assess whether the critical flow rates may present compressible effects, we estimate the Mach number at the channel throat
 $\mathcal {M}_{{t}}$. Assuming the flow accelerates isentropically over the converging section of the flow path in figure 1 (
 $x \le L_2$), we take isentropic relations for stagnation (subscript
 ${o}$) and throat (subscript
 ${t}$) quantities,
 \begin{gather} \frac{T_o}{T_{t}} = 1 + \frac{\gamma_g - 1 }{2} \mathcal{M}_{{t}}^2, \end{gather}
 \begin{gather} \frac{\rho_o}{\rho_{t}} = \left( 1 + \frac{\gamma_g - 1 }{2} \mathcal{M}_{{t}}^2 \right)^{{1}/({\gamma_g - 1})}, \end{gather}
 \begin{gather} \mathcal{M}_{{t}} = \frac{U_{{cr}}} {\sqrt{\gamma_{{g}} R_{{g}} T_{{t}}}}, \end{gather}
where  $R_{{g}}$ is the specific gas constant,
 $\gamma _{{g}}$ is the ratio of specific heats,
 $T$ is the temperature and
 $\rho$ is the density. With the definition of the critical mass flow rates as
 \begin{equation} \dot{m}_{{cr}} = \rho_{{STP}} Q_{{cr}} = \rho_t A_{{t}} U_{{cr}}, \end{equation}
we can combine (B1), (B2) and (B3) to represent an implicit relation between the fluid flow properties and  $\mathcal {M}_{{t}}$ valid for
 $\mathcal {M}_{{t}} \le 1$,
 \begin{equation} \frac{\dot{m}_{{cr}}}{\sqrt{\dfrac{\gamma_g R_g T_o}{1 + \dfrac{\gamma_g - 1 }{2} \mathcal{M}_{{t}}^2}} \mathcal{M}_{{t}} A_{{t}} } = \frac{\rho_o}{\left( 1 + \dfrac{\gamma_g - 1 }{2} \mathcal{M}_{{t}}^2 \right)^{{1}/({\gamma_g - 1})}}. \end{equation}
Values for  $T_o = T_{{STP}} = 295\ (\textrm {K})$,
 $\rho _o = \rho _{{STP}} = 1.20\ (\textrm {kg}\ \textrm {m}^{-3})$,
 $R_{{g}} = 287.0\ (\textrm {kg}\ \textrm {J}^{-1}\ \textrm {K}^{-1})$,
 $\gamma _{{g}} = 1.40$ (per Moran & Shapiro Reference Moran and Shapiro2004) and
 \begin{equation} A_{t} = b_1 (2 \bar{h} + h_b) - b h_b \end{equation}
as the throat flow area. Table 10 lists results of  $\mathcal {M}_{{t}}$ in the three flextensional settings.
Table of critical values for flexure settings listed.

The chocked flow rate is  $Q_{{ch}} \approx 267\ (\textrm {L}\ \textrm {min}^{-1})$ for flow path with dimensions in table 5. Here
 $\mathcal {M}_{{t}}$ values suggest that flextensional settings 2 and 3 are chocked, while flextensinal setting 1 is not. The possibility of having
 $Q_{{cr}} > Q_{{ch}}$ for the former two settings is due to the increase in stagnation pressure downstream of the needle valve: the flow meter measurements represent a mass flow rate rather than a purely volumetric one. Since the flow control (needle) valve is upstream of the flow meter and the test section, by further opening the valve, the upstream flowing and stagnation pressures are increased, which in turn increase the density at the throat and allows for the higher mass flow rate through the system. This happens despite the volumetric flow rate remaining constant in the choked condition.
Appendix C. Spectral proper orthogonal decomposition
To define the SPOD, we choose the transverse displacement  $\delta$ as the primary quantity to characterize the fluid–structure system dynamics. The inertial coordinate
 $x$ spans the length of the beam, with
 $y$ displacement at discrete
 $x_i$ (
 $i \in \mathbb {Z}: [1,p]$) and time
 $t_j$ (
 $j \in \mathbb {Z}: [1,n]$ ) as
 $\delta (x_i,t_j) = \delta ^{(j)}_i$. We define the data matrix
 $\boldsymbol {X}$,
 \begin{equation} \boldsymbol{X} = \begin{bmatrix} \delta_1^{(1)} & \delta_1^{(j)} & \ldots & \delta_1^{(n)} \\ \delta_i^{(1)} & \delta_i^{(j)} & \ldots & \delta_i^{(n)} \\ \vdots & \vdots & \ddots & \vdots \\ \delta_p^{(1)} & \delta_p^{(j)} & \ldots & \delta_p^{(n)} \end{bmatrix} \in \mathbb{R}^{p\times n}. \end{equation}
The rows of  $\boldsymbol {X}$ are measurements of points along the beam, and the columns are the time series for each point with size
 $\Delta t$.
Assuming that the system is stationary and consistent with the procedure in Towne et al. (Reference Towne, Schmidt and Colonius2018) and Schmidt & Towne (Reference Schmidt and Towne2019), the discrete Fourier transform of each row of our  $\boldsymbol {X}$ is carried out using Welch's method (Welch Reference Welch1967). In the procedure, each discrete time series is segmented into 50 % overlapping blocks of size
 $n_f \le n$, Fourier transformed, and assembled into a Fourier domain data matrix
 $\tilde {\boldsymbol {X}}_{f_l}$ at each discrete frequency
 $f_l$,
 \begin{equation} \tilde{\boldsymbol{X}}_{f_l} = \begin{bmatrix} \tilde{\delta}_1^{(1)} & \tilde{\delta}_1^{(k)} & \ldots & \tilde{\delta}_1^{(N)} \\ \tilde{\delta}_i^{(1)} & \tilde{\delta}_i^{(k)} & \ldots & \tilde{\delta}_i^{(N)} \\ \vdots & \vdots & \ddots & \vdots \\ \tilde{\delta}_p^{(1)} & \tilde{\delta}_p^{(k)} & \ldots & \tilde{\delta}_p^{(N)} \end{bmatrix}_{f_l} \in \mathbb{C}^{p \times N} , \end{equation}
where  $l \in \mathbb {Z}: [1,n_f]$,
 $N \ge 1 \in \mathbb {Z}$ is the total number of blocks in Welch's method,
 $k \in \mathbb {Z}: [1,N]$ is a Fourier realization of the data and block number index. Elements in
 $\tilde {\boldsymbol {X}}_{f_l}$ are
 \begin{equation} \tilde{\delta}_{i}^{(k)} = \frac{1}{\sqrt{n_f}} \sum_{j = ({n_f}/{2})\left( k - 1 \right) + 1}^{({n_f}/{2})\left( k + 1 \right)} \delta_{i}^{(j)} \exp\left({-2 {\rm \pi}\sqrt{-1} \left( l - 1 \right) \frac{j - 1}{ n_f } }\right), \end{equation}
for a rectangular windowing function, and discrete frequencies
 \begin{equation} f_l = \begin{cases} \dfrac{l-1}{n_f \Delta t} & \text{for } l \le n_f/2, \\ \dfrac{l-1-n_f}{n_f \Delta t} & \text{for } l > n_f/2. \end{cases} \end{equation}
We build the cross-spectral density matrix at each  $f_l$,
 \begin{equation} \tilde{\boldsymbol{S}}_{f_l} = \frac{\Delta t}{n_f N} \tilde{\boldsymbol{X}}_{f_l} \tilde{\boldsymbol{X}}_{f_l}^* \in \mathbb{C}^{p \times p}, \end{equation}
where  $\tilde {\boldsymbol {X}}_{f_l}^*$ is the conjugate transpose of
 $\tilde {\boldsymbol {X}}_{f_l}$ and
 $\Delta t$ is the time increment for the series. Here
 $\tilde {\boldsymbol {S}}_{f_l}$ is Hermitian and represents the cross-correlation of measurement
 $i$ Fourier coefficients with all other measurements, averaged over all realizations. We can eigendecompose
 $\tilde {\boldsymbol {S}}_l$,
 \begin{equation} \tilde{\boldsymbol{S}}_l = \hat{\boldsymbol{U}}_l \boldsymbol{ \varSigma}_l \hat{\boldsymbol{U}}_l^*, \end{equation}
where  $\hat {\boldsymbol {U}}_l$ is unitary (along with its conjugate transpose
 $\hat {\boldsymbol {U}}_l^*$) and its columns
 $(\hat {\boldsymbol {u}}_i)_l$ are orthonormal eigenvectors of
 $\tilde {\boldsymbol {S}}_l$. Here
 $\boldsymbol {\varSigma }_l \in \mathbb {R}^{p \times p}$ is a diagonal matrix with its entries as the eigenvalues
 $(\sigma _i)_l$ in descending order. We can interpret
 $(\sigma _i)_l$ as the amount of energy its pair
 $(\hat {\boldsymbol {u}}_i)_l$ contains at
 $f_l$. The cross-spectral density at each
 $f_l$ is tensor invariant
 $\textrm {tr}( \hat {\boldsymbol {S}}_l) = \text {tr} ( \boldsymbol {\varSigma }_l )$, and represents the total energy at each frequency. The fraction of energy each mode contains is
 \begin{equation} \left(\hat{\sigma}_i\right)_l = \frac{ \left( \sigma_i \right)_l }{\text{tr}( \hat{\boldsymbol{\varSigma}}_l)}. \end{equation}
The system may be reduced further if a single  $(\hat {\sigma }_i)_l$,
 $(\hat {\boldsymbol {u}}_i)_l$ pair contains most of the energy at these peak frequencies. In systems where both hold true, it is often useful to understand the dynamics of these predominant modes. Frequencies where
 $\text {tr}(\hat {\boldsymbol {\varSigma }}_l)$ peaks indicate periodic behaviour, but do not discern between the periodic oscillations characteristic of a limit cycle, or intermittent periodic behaviour associated with a stochastically forced under-damped system. However, the SPOD modes provide a means to filter the original time domain data and discern those states exactly. Schmidt et al. (Reference Schmidt, Colonius and Bres2017) first explored this by projecting time domain pressure data onto the leading SPOD modes to find intermittent behaviour of noise in a turbulent jet. Here, we would like to do the same by projecting the time domain beam displacement data onto the leading SPOD beam shapes.
Suppose the system has  $m < n_f$ peak frequencies in
 $\text {tr}(\hat {\boldsymbol {\varSigma }}_l)$. To explore the time behaviour of the most energetic modes at each peak frequency, we build a basis,
 \begin{equation} \hat{\boldsymbol{\varPhi}} = \left[ \left(\hat{\boldsymbol{u}}_1\right)_{1}, \ldots, \left(\hat{\boldsymbol{u}}_1\right)_{m} \right] \in \mathbb{C}^{ p \times m}, \end{equation}
where subscript 1 in  $\hat {\boldsymbol {u}}_1$ indicates the leading mode. We would like to approximate the time domain data
 $\boldsymbol {X}$ as
 \begin{equation} \boldsymbol{X} \approx \hat{\boldsymbol{\varPhi}}\boldsymbol{A}, \end{equation}
where  $\boldsymbol {A}$ is the matrix with coefficients of each basis (rows) in
 $\hat {\boldsymbol {\varPhi }}$ over time (columns). To solve for
 $\boldsymbol {A}$,
 \begin{equation} \boldsymbol{A} = \left( \hat{\boldsymbol{\varPhi}}^* \hat{\boldsymbol{\varPhi}} \right)^{{-}1} \hat{\boldsymbol{\varPhi}}^* \boldsymbol{X}, \end{equation}
where  $\hat {\boldsymbol {\varPhi }}^*$ is the conjugate transpose of
 $\hat {\boldsymbol {\varPhi }}$. The columns of
 $\hat {\boldsymbol {\varPhi }}$ are not orthogonal, and
 $( \hat {\boldsymbol {\varPhi }}^* \hat {\boldsymbol {\varPhi }} )^{-1}$ accounts for the cross-coupling between the modes. By construction, modes are orthonormal within a single frequency, but not across frequencies when only considering the spatial norm. (Modes across frequencies are orthogonal in the temporal sense. However, if the spatial modes are considered in the projection framework here, they are not orthogonal in that the norm
 $(\boldsymbol {\hat {u}}_1)_i^* (\boldsymbol {\hat {u}}_1)_j \neq 0$ for
 $i \neq j$.)
The map between  $\boldsymbol {A}$ and
 $\boldsymbol {X}$ is, in essence, a spatial filter that when applied to the time domain data elucidates how each shape
 $\hat {\boldsymbol {u}}_1$ behaves in time. With
 $\boldsymbol {X}$ built as transverse displacement
 $\delta _p^{(j)}$, each basis in
 $\hat {\boldsymbol {\varPhi }}$ represents a beam mode shape and the columns of
 $\boldsymbol {A}$ their amplitudes at a particular instance in time.
Since  $\boldsymbol {A}$ represents beam displacement over time, the velocity of each shape can be defined as
 ${\mathrm {d} \boldsymbol {A}}/{\mathrm {d} t}$ and estimated through a discrete time derivative for the data set. We can access a two-dimensional phase-portrait of each mode, and discern their individual dynamics: periodic orbits will be closed orbits (donut shape), while amplifier states as points clumped around the origin, as the mode is perturbed stochastically, but decays back to its equilibrium.
Appendix D. Euler–Bernoulli beam fundamental frequency
From classical EB beam theory, we can calculate the theoretical clamped-free beam frequencies as
 \begin{equation} f_i = \frac{\left( \beta_i L \right)^2}{2 {\rm \pi}L^2} \sqrt{\frac{E I}{\rho_s b h_b}}. \end{equation}
Here  $I$ is the square cross-section moment of inertia for the beam in three dimensions,
 \begin{equation} I = \frac{h_b^3 b}{12}. \end{equation}
The eigenfunctions  $\phi _k$,
 $k \in \mathbb {Z}:[1,\infty ]$, when subject to the clamped-free boundary conditions, are
 \begin{align} \phi_k(x)=\cosh\left(\beta_k x\right) - \cos\left(\beta_k x\right) + \left[ \frac{ \cos\left(\beta_k {L}\right) + \cosh\left(\beta_k {L}\right)}{\sin\left(\beta_k {L}\right) + \sinh\left(\beta_k {L}\right)} \right] \left( \sin\left(\beta_k x\right) - \sinh\left(\beta_k\, x \right) \right), \end{align}
with the characteristic equation
 \begin{equation} \cosh \left(\beta_k L \right) \cos \left(\beta_k L \right) + 1 = 0. \end{equation}
The first six corresponding eigenvalues are listed in table 11.
Table of solutions to the characteristic equation for clamped-free EB beam.

Appendix E. Fluid–structure coefficients
 \begin{align} \boldsymbol{A} = \begin{bmatrix} 0 & \boldsymbol{1} & 0 & 0 \\ M^{{-}1} K & M^{{-}1} C & M^{{-}1} T & M^{{-}1} H \\ E_{{q}} + B_{{q}} (M^{{-}1} K) & D_{{q}} + B_{{q}} (M^{{-}1} C) & G_{{q}} + B_{{q}} (M^{{-}1} T ) & H_{{q}} + B_{{q}} (M^{{-}1} H ) \\ \tilde{E}_{{q}} + \tilde{B}_{{q}} (M^{{-}1} K) & \tilde{D}_{{q}} + \tilde{B}_{{q}} (M^{{-}1} C) & \tilde{G}_{{q}} + \tilde{B}_{{q}} (M^{{-}1} T ) & \tilde{H}_{{q}} + \tilde{B}_{{q}} (M^{{-}1} H ) \end{bmatrix}, \end{align}
where
 \begin{gather} {M}_{{s} i} = \begin{cases} \dfrac{m_0}{b} & \text{for } i = 0, \\ \rho_s h_b g_i(x) & \text{for } i = [1, n], \end{cases} \end{gather}
 \begin{gather} {C}_{{s} i} = \begin{cases} \dfrac{c_0}{b} & \text{for } i = 0, \\ 0 & \text{for } i = [1, n], \end{cases} \end{gather}
 \begin{gather} {K}_{{s} i} = \begin{cases} \dfrac{k_0}{b} & \text{for } i = 0, \\ \dfrac{E I}{b} \dfrac{\mathrm{d}^4}{\textrm{d}\kern0.06em x^4} g_i(x) & \text{for } i = [1, n], \end{cases} \end{gather}
and
 \begin{align} \left. \begin{gathered} M_{ji} = \int_0^L\left( M_{{s} i}(x) + 2M_{{f} i}(x) \right) g'_j(x)\,{\textrm{d}\kern0.06em x}, \quad C_{ji} ={-}\int_0^L\left( C_{{s} i}(x) + 2C_{{f} i}(x) \right) g'_j(x)\,{\textrm{d}\kern0.06em x}, \\ K_{ji} ={-}\int_0^L\left( K_{{s} i}(x) + 2K_{{f} i}(x) \right) g'_j(x)\, {\textrm{d}\kern0.06em x}, \end{gathered} \right\} \end{align}
exist in  $\mathbb {R}^{n+1 \times n+1}$,
 \begin{equation} T_j ={-}2\int_0^L T_{{f}}(x) g'_j(x) \,{\textrm{d}\kern0.06em x} \end{equation}
exists in  $\mathbb {R}^{n+1 \times 1}$, and
 \begin{equation} H_{ji} ={-}2\int_0^L H_{{f} i}(x) g'_j(x) \,{\textrm{d}\kern0.06em x} \end{equation}
exists in  $\mathbb {R}^{n+1 \times m+1}$. The test functions are
 \begin{equation} g'_i(x) = \begin{cases} \delta(x) & \text{for } i = 0, \\ \phi_i(x) & \text{for } i = [1, n], \end{cases} \end{equation}
where  $\delta$ is the Dirac delta function and
 $\phi _i$ is defined in (D3). Coefficients for the spanwise terms
 \begin{equation} \left. \begin{gathered} \tilde{B}_{{q} ji} = N_{ji} \int_0^L B_{{q} i}(x) \psi'_j(x) \,{\textrm{d}\kern0.06em x}, \quad \tilde{D}_{{q} ji} = N_{ji} \int_0^L D_{{q} i}(x) \psi'_j(x) \,{\textrm{d}\kern0.06em x}, \\ \tilde{E}_{{q} ji} = N_{ji} \int_0^L E_{{q} i}(x) \psi'_j(x) \,{\textrm{d}\kern0.06em x}, \quad \tilde{G}_{{q} ji} = N_{ji} \int_0^L G_{{q} i}(x) \psi'_j(x) \,{\textrm{d}\kern0.06em x}, \\ \tilde{H}_{{q} ji} = N_{ji} \int_0^L H_{{q} i}(x) \psi'_j(x) \,{\textrm{d}\kern0.06em x}, \quad N_{ji} = \left(\int_0^L \psi'_i(x) \psi'_j(x) \,{\textrm{d}\kern0.06em x} \right)^{{-}1}. \end{gathered} \right\} \end{equation}
The test functions are
 \begin{equation} \psi'_i(x) = \begin{cases} \delta(x) & \text{for } i = 0, \\ \tilde{\psi}_i(x) & \text{for } i = [1, m-1], \\ \delta(x-L) & \text{for } i = m, \end{cases} \end{equation}
where  $\delta$ is the Dirac delta function and
 $\tilde {\psi }$ is defined in (5.42).



