1. Introduction
Particle migration in laminar channel flows has been intensively studied because of its importance in many academic and industrial fields. In particular, cross-stream migration due to inertia or viscoelasticity of suspending fluids has gathered considerable attention as a basis for passive separation and sorting of biological cells and microparticles in microfluidic devices (Di Carlo et al. Reference Di Carlo, Irima, Tompkins and Toner2007; Leshansky et al. Reference Leshansky, Bransky, Korin and Dinnar2007). Under the effects of inertia or viscoelasticity, suspended particles migrate laterally towards specific positions in the channel cross-section, depending on the flow condition and channel geometry (Matel & Toner Reference Matel and Toner2014; Zhou & Papautsky Reference Zhou and Papautsky2020). If the focusing positions and/or cross-stream migration velocities can be controlled by the size, shape and deformability of the suspended particles, this phenomena can be used for particle separation and sorting in label-free and external field-free ways using microchannels of simple geometry. To this end, extensive studies have been conducted to develop novel microfluidic devices suitable for target cells as well as to understand the underlying mechanisms of particle migration (e.g. Di Carlo Reference Di Carlo2009; Zhang et al. Reference Zhang, Yan, Yuan, Alici, Nguyen, Warkiani and Li2016; Stoecklein & Di Carlo Reference Stoecklein and Di Carlo2019; Razavi Bazaz et al. Reference Razavi Bazaz, Mashhadian, Ehsani, Saha, Krüger and Warkiani2020; Tang et al. Reference Tang, Zhu, Jiang, Zhu, Yang and Xiang2020; Kalyan et al. Reference Kalyan, Torabi, Khoo, Sung, Choi, Wang, Treutler, Kim and Hur2021; Lee, Kim & Yang Reference Lee, Kim and Yang2023; Zhang et al. Reference Zhang2024). However, the fundamentals of particle migration under the effects of inertia and fluid viscoelasticity, and their interplay have not been fully understood. In the present study, focusing on the combined effects of inertia and fluid viscoelasticity, we experimentally and numerically investigate the inertial migration of rigid spherical particles in viscoelastic fluids flowing through a straight channel with square cross-sections. To avoid complications arising from interparticle interactions such as excluded-volume effects (Kazerooni et al. Reference Kazerooni, Fornari, Hussong and Brandt2017), hydrodynamic repulsive motion between neighbouring particles (Udono Reference Udono2020) and their train formation (Matas et al. Reference Matas, Glezer, Guazzelli and Morris2004a ; Humphry et al. Reference Humphry, Kulkarni, Weitz, Morris and Stone2010; Hur, Tse & Di Carlo Reference Hur, Tse and Di Carlo2010; Kahkeshani, Haddadi & Di Carlo Reference Kahkeshani, Haddadi and Di Carlo2016; Del Guidice et al. Reference Del Giudice, D’Avino, Greco, Maffettone and Shen2018; D’Avino & Maffettone Reference D’Avino and Maffettone2020; Hu et al. Reference Hu, Lin, Lin, Zhu and Yu2022), we consider dilute suspensions in which such interactions can be neglected.
Inertial migration was first reported by Segré & Silberberg (Reference Segré and Silberberg1961) for neutrally buoyant spherical particles suspended in circular tube flows of a Newtonian fluid. They observed that suspended particles migrate laterally towards an annulus whose radius is 0.6 times as large as the tube radius at relatively low Reynolds numbers (
 $\textit{Re}$
) (Segré & Silberberg Reference Segré and Silberberg1961, Reference Segré and Silberberg1962). This phenomenon, referred to as the Segré–Silberberg (SS) effect, is caused by the presence of lifts due to inertia, and the particle focusing annulus is called the SS annulus (Matas, Morris & Guazzelli Reference Matas, Morris and Guazzelli2004b
). Subsequent theoretical studies elucidated that the inertial lifts consist mainly of a shear gradient-induced lift acting in the higher shear direction (i.e. towards the tube wall) and a wall effect acting in the direction away from the tube wall (Ho & Leal Reference Ho and Leal1974; Schonberg & Hinch Reference Schonberg and Hinch1989; Asmolov Reference Asmolov1999). The balance between these two competing lifts determines the radius of the SS annulus (Matas, Morris & Guazzelli Reference Matas, Morris and Guazzelli2009). In channels with rectangular cross-sections, which are commonly used in microfluidics, suspended particles migrate towards a discrete set of equilibrium positions in the channel cross-section (Di Carlo et al. Reference Di Carlo, Irima, Tompkins and Toner2007; Bhagat, Kuntaegowdanahalli & Papautsky Reference Bhagat, Kuntaegowdanahalli and Papautsky2008; Kim & Yoo Reference Kim and Yoo2008; Di Carlo et al. Reference Di Carlo, Edd, Humphry, Stone and Toner2009). This property is beneficial for the design of cell separation devices. Several experimental and numerical studies reported two-phase properties of the inertial migration of spherical particles in square channel flows; in the first phase, they rather rapidly migrate mostly in the radial direction towards a ring, and then in the second stage, they move slowly along the ring towards four points located near the centre of the channel faces (Choi, Seo & Lee Reference Choi, Seo and Lee2011; Abbas et al. Reference Abbas, Magaud, Gao and Geoffroy2014; Nakagawa et al. Reference Nakagawa, Yabu, Otomo, Kase, Makino, Itano and Sugihara-Seki2015). This ring of the focusing particles corresponds to the SS annulus, so that it is termed the pseudo Segré–Silberberg (pSS) ring, and the final focusing position is termed the channel face equilibrium position or the midline equilibrium position (MEP) (Miura, Itano & Sugihara-Seki Reference Miura, Itano and Sugihara-Seki2014; Shichi et al. Reference Shichi, Yamashita, Seki, Itano and Sugihara-Seki2017; Yu et al. Reference Yu, Wang, Lin and Hu2019). The final focusing on the MEP in square channel flows can be explained by a balance between two major lifts due to inertia; the shear gradient-induced lift in the direction towards higher shear and the wall effect away from the channel wall (Matas, Morris & Guazzelli Reference Matas, Morris and Guazzelli2004c
). The contours of the shear rate
 $|\dot {\gamma }|$
for the pressure-driven flow through a square channel and approximate directions of the shear gradient
 $-\boldsymbol{\nabla }|\dot {\gamma }|$
in the first quadrant of the cross-section are plotted in figures 1(a) and (b), respectively. Because the shear gradient-induced lift exerts from lower shear to higher shear, their directions are nearly opposite to the arrows in figure 1(b), which are mostly outward in the radial direction and away from the diagonal (i.e. towards the
 $y$
,
 $z$
axes (midlines)) in the azimuthal direction. This lift is dominant in the region apart from the channel wall, while the wall effect is superposed near the channel wall. The radial component of the lift is larger than the azimuthal component for most of the cross-section, and thus, suspended particles first move in an approximately radial direction towards the pSS ring, where the resultant lift normal to the ring vanishes. The particles then move slowly along the pSS ring due to the azimuthal component of the shear gradient-induced lift towards the midline until reaching the midline at the MEP.
(a) The contours of the shear rate
 $|\dot {\gamma }|$
in the square cross-section of a pressure-driven flow of a Newtonian fluid without suspended particles, (b) approximate directions of
 $-\boldsymbol{\nabla }|\dot {\gamma }|$
in the first quadrant of the cross-section, and (c) the profile of the shear rate along the diagonal (dashed line in panel b). The shear rate is normalised by
 $2U_{max}^*/D^*$
, where
 $U_{max}^*$
is the maximum flow velocity. The cross-mark represents the location of the maximum shear rate on the diagonal.

Particle focusing on the MEP can be observed for rather small particle-to-channel width ratios (blockage ratios) and relatively low
 $\textit{Re}$
. The blockage ratio is defined as
 $\kappa =d^*/D^*$
, where
 $d^*$
and
 $D^*$
represent the diameter of the spherical particles and the width of the channel, respectively. In this paper, the dimensional quantities are denoted by a superscript
 $*$
. The Reynolds number is defined as
 $Re=\rho ^*U^*D^*/\mu ^*$
, where
 $\rho ^*$
and
 $\mu ^*$
respectively represent the density and viscosity of the fluid and
 $U^*$
is the average flow velocity. The particle Reynolds number is defined as
 $Re_p=Re\times \kappa ^2$
. In the cases of
 $\kappa \gtrapprox 0.2$
and/or
 $Re\gtrapprox 200$
, other types of particle focusing patterns emerge in square channel flows of Newtonian fluids, depending on
 $\kappa$
and
 $\textit{Re}$
(Prohm & Stark Reference Prohm and Stark2014; Miura et al. Reference Miura, Itano and Sugihara-Seki2014).
Particle migration in viscoelastic fluids has also long been studied. Mason and his coworkers observed complex behaviours of particles suspended in viscoelastic fluids, depending on the fluid rheology; rigid spherical particles migrate inward in highly elastic fluids flowing through a circular tube, whereas the migration direction is inverted in a predominantly shear-thinning fluid (Karnis & Mason Reference Karnis and Mason1966; Gauthier, Goldsmith & Mason Reference Gauthier, Goldsmith and Mason1971). Recent microfluidic studies also reported various intricate phenomena of particle migration in viscoelastic fluids related to shear-thinning effects and secondary flows, and these effects tend to weaken the effect of fluid elasticity (for details, see review articles on viscoelastic microfluidics such as D’Avino & Maffettone (Reference D’Avino and Maffettone2015), D’Avino et al. (Reference D’Avino, Greco and Maffettone2017), Lu et al. (Reference Lu, Liu, Hu and Xuan2017), Yuan et al. (Reference Yuan, Zhao, Yan, Tang, Alici, Zhang and Li2018), Zhou & Papautsky (Reference Zhou and Papautsky2020) and the references therein). Thus, to simplify the problem, the present study mainly considers the effect of fluid elasticity on the inertial migration of particles when the fluid viscosity is nearly constant and secondary flow is almost negligible. In the experiments, the present study uses dilute aqueous solutions of polyvinylpyrrolidone (PVP), a biocompatible polymer, whose viscosity is almost independent of the shear rate. For viscoelastic fluids, the Weissenberg number
 ${W\hspace {-1pt}i}=\lambda ^*U^*\!/\!D^*$
, qualifying the ratio of elastic force to viscous force, is added as an important parameter controlling the particle migration behaviour, where
 $\lambda ^*$
represents the relaxation time of the fluid. The ratio between
 $W\hspace {-1pt}i$
and
 $\textit{Re}$
gives the elasticity number
 ${\textit{El}}={W\hspace {-1pt}i}\!/\!Re=\lambda ^*\mu ^*\!/\kern-1pt(\rho ^*D^{*2})$
, which depends only on the channel dimension and fluid properties.
Most previous studies on the particle cross-stream migration under the effect of fluid elasticity have mainly investigated the cases of negligible inertia and non-negligible but small inertia. In general, the lift due to the fluid elasticity originates from the normal stress differences. Specifically, the first normal stress difference
 $N_1$
, which is defined as the difference between the streamwise normal stress and the transverse normal stress in the shear direction, is dominant when the secondary flow can be neglected. In curvilinear shear flow,
 $N_1$
, representing a tension in the streamwise direction, gives a rise to a volume force termed the hoop stress acting on the fluid in the direction of the curvature (Steinberg Reference Steinberg2021). In the case of negligible inertia and small blockage ratios, Ho & Leal (Reference Ho and Leal1976) theoretically indicated that the fluid elasticity-induced lift drives a spherical particle towards the lower shear region when suspended in two-dimensional (2-D) unidirectional shear flow of a second-order fluid. Based on their result of the tension proportional to the square of the shear rate, they explained that bowed streamlines on both sides of a particle suspended in a flow with a shear gradient such as a Poiseuille flow generate a lift in the direction of decreasing shear. This explanation is in line with a previous study by Karnis & Mason (Reference Karnis and Mason1966), who reported that spherical particles in viscoelastic fluids flowing through circular tubes migrate towards the tube centreline at very low
 $\textit{Re}$
. This inward migration of suspended particles was accounted for by larger lift towards the tube centreline than that towards the tube wall because of increasing normal stress with increasing radial distance from the centreline.
The fluid elasticity-induced lift exerting in the direction of lower shear is also consistent with the experimental results in microfluidics. Leshansky et al. (Reference Leshansky, Bransky, Korin and Dinnar2007) observed that spherical particles suspended in 8 wt % PVP solutions flowing through a nearly 2-D channel (a rectangular channel with a large aspect ratio
 $\approx 22$
) migrate towards the middle plane of the channel. In addition, they demonstrated that the width of the particle distribution can be controlled by varying the particle size and altering the elasticity and/or viscosity of the suspending medium. In square channel flows, spherical particles in 8 wt % PVP solutions were reported to focus near four corners as well as the centre of the cross-section at very low
 $\textit{Re}$
(Yang et al. Reference Yang, Lee, Ahn, Kang, Shim, Lee, Hyun and Kim2012; Seo, Kang & Lee Reference Seo, Kang and Lee2014). The middle plane of the 2-D channel and the centre and four corners in the square cross-section correspond to the lowest shear regions; as seen from figure 1(c), there is a position of maximum shear midway between the centre and the corner along the diagonal, and the minimum shear attains at the centre and four corners. Approximate directions of decreasing shear are represented by arrows in figure 1(b). Here, we refer to the particle focusing position at the centre as the axial equilibrium position (AEP) and near the corners as the corner equilibrium position (CEP). In the case of negligible inertia for square channel flows, focusing on the closest CEP or AEP depending on the particle’s initial position was also reported for numerical simulations when the second normal stress difference was negligible (Villone et al. Reference Villone, D’Avino, Hulsen, Greco and Maffettone2013).
When the inertia is not negligible in square channel flows, an increase in wall effect, acting in the direction away from the channel wall, diminishes the particle focusing near the corners (CEP) (Yang et al. Reference Yang, Kim, Lee, Lee and Kim2011; Seo et al. Reference Seo, Kang and Lee2014; Kim & Kim Reference Kim and Kim2016). As a result, suspended particles achieve a single-position focusing near the channel centreline (AEP). This transition from five-position focusing to one-position focusing by increasing the flow rate was also shown by numerical studies (Raoufi et al. Reference Raoufi, Mashhadian, Niazmand, Asadnia, Razmjou and Warkiani2019). The single-position focusing holds great potential for application such as flow cytometry (Del Guidice et al. Reference Del Guidice, Romeo, D’Avino, Greco, Netti and Maffettone2013).
To realise a high throughput in microfluidic devices, however, the effect of inertia increases with increasing
 $\textit{Re}$
. Since the inertial lift due to the shear gradient is directed nearly opposite to the lift due to the fluid elasticity as noted above, the particle migration behaviour in viscoelastic fluids at finite
 $\textit{Re}$
should be largely affected by the interplay between inertia and elasticity. There are few previous studies on the particle migration in viscoelastic fluids at larger
 $\textit{Re}$
, with the exception of a few studies. Lim et al. (Reference Lim, Ober, Edd, Desai, Neal, Bong, Doyle, McKinley and Toner2014) performed an experimental study employing hyaluronic acid solutions in which suspended particles in a square channel flow migrate towards the channel centreline over a wide range of Reynolds numbers
 $10\leqslant Re \leqslant 10^4$
at
 ${\textit{El}}\sim 0.1$
. Li, McKinley & Ardekani (Reference Li, McKinley and Ardekani2015) numerically simulated the migration of a spherical particle located on the midline of the square cross-section of the channel at lower
 $\textit{El}$
. Their results based on the Oldroyd-B model showed that particle focusing on the channel centre occurs in flows with strong elasticity and weak inertia, and that there exists a critical elasticity number
 $\textit{El}$
(
 $\sim \textit {O}(0.01)$
) above which the particle migrates to the centre. The Oldroyd-B model, which has a parameter
 $\beta$
, the ratio of the solvent viscosity to the total viscosity, in addition to
 $\textit{Re}$
and
 $W\hspace {-1pt}i$
(or
 $\textit{El}$
), is often used for polymer solutions. Li et al. (Reference Li, McKinley and Ardekani2015) adopted
 $\beta =0.1$
. Yu et al. (Reference Yu, Wang, Lin and Hu2019) performed numerical computations of trajectories of a spherical particle in square channel flows of an Oldroyd-B model at
 $\beta =0.5$
in the ranges of
 $\widehat {Re}$
up to 100 and
 $\widehat {{W\hspace {-1pt}i}}$
up to 1.5. Here, the hat indicates that the parameter is defined in terms of maximum flow velocity rather than average flow velocity. Note that
 $Re\approx \widehat {Re}/2.1$
and
 ${W\hspace {-1pt}i}\approx \widehat {{W\hspace {-1pt}i}}/2.1$
for Newtonian fluids. Showing the existence of an equilibrium position on the diagonal (named here diagonal equilibrium position, DEP) and its coexistence with the MEP or the CEP, they illustrated a map of the particle focusing pattern as a function of
 $\textit{Re}$
and
 $\textit{El}$
at
 $\kappa =0.15$
. It was demonstrated that, as the fluid elasticity increases at finite and constant
 $\textit{Re}$
, particle focusing emerges successively from the MEP to the DEP and then to the CEP and the AEP (Yu et al. Reference Yu, Wang, Lin and Hu2019). Hu et al. (Reference Hu, Lin, Zhu, Yu, Lin and Li2024) reported a similar conclusion for a numerical study of ellipsoidal particles suspended in a square channel flow of Oldroyd-B fluids at
 $\kappa =0.2$
.
In our previous study (Yokoyama et al. Reference Yokoyama, Yamashita, Higashi, Miki, Itano and Sugihara-Seki2021), we experimentally and numerically investigated the inertial focusing of spherical particles in viscoelastic fluids flowing through square channels at
 $Re=50$
and
 $\kappa =0.15$
. Micro-scale experiments using dilute PVP aqueous solutions reported for the first time the observation of the particle focusing on four points of the DEP and that, as the PVP concentration increases, the focusing position transitions from the MEP to the DEP, with a bistable state of the MEP and DEP in between. The PVP concentrations were so low that we could not measure the relaxation time of the PVP solutions using a rotational rheometer. Thus, although the Weissenberg number was unknown for each case, numerical computations based on the finitely extensible nonlinear elastic-Peterlin (FENE-P) model qualitatively reproduced these focusing patterns under the assumption that
 $W\hspace {-1pt}i$
increases with increasing PVP concentration. Additionally, subtracting the lift on a particle at finite
 $W\hspace {-1pt}i$
from that at
 ${W\hspace {-1pt}i}=0$
located at the same position, we evaluated approximately the lift due to the fluid elasticity, and found that the distribution of the estimated lift in the channel cross-section is similar to that due to
 $N_1$
except near the channel wall. The direction of the lift is inward in the radial direction and towards the diagonal in the azimuthal direction in the region apart from the channel wall. Note that
 $N_1\propto |\dot {\gamma }|^\alpha$
(
 $1\lt \alpha \leqslant 2$
) (Leshansky et al. Reference Leshansky, Bransky, Korin and Dinnar2007) and
 $-\boldsymbol{\nabla }|\dot {\gamma }|^\alpha$
is parallel to
 $-\boldsymbol{\nabla }|\dot {\gamma }|$
, it is reasonable that this direction agrees with the arrows in figure 1(b), which represent the decreasing shear directions. Thus, it was shown that the fluid elasticity-induced lift exerting in the direction towards lower shear, which was derived theoretically in 2-D unidirectional shear flow of a second-order fluid for small blockage ratios with negligible inertia (Ho & Leal Reference Ho and Leal1976), is approximately valid in the case of finite blockage ratios and finite
 $\textit{Re}$
in square channel flows at least at relatively small
 $W\hspace {-1pt}i$
. Furthermore, the analysis of the conformation tensor demonstrated that outward lift exerts on a particle close to the channel wall, due to the polymer elongation in the region between the particle and the channel wall. This lift was termed the wall-induced elastic lift and the transition of the particle focusing pattern observed experimentally and numerically was accounted for by the competition between the lift due to
 $N_1$
and the wall-induced elastic lift.
In the inertial migration, the interplay between inertia and fluid elasticity is unclear yet. In this paper, both experiments and numerical simulations where characteristic parameters are systematically varied are performed, and the variation of lift due to the rheological characteristics of the working fluids is investigated. This study presents a variety of focusing patterns of particles, caused by the interplay between the inertial lift and fluid elasticity-induced lift. In the experiments, our previous study (Yokoyama et al. Reference Yokoyama, Yamashita, Higashi, Miki, Itano and Sugihara-Seki2021) is extended to wider ranges of PVP concentration
 $\phi$
(
 $=0$
–
 $4.0$
wt %) and
 $\textit{Re}$
(
 $=1$
–
 $100$
). The PVP concentration was still lower than that in other previous studies (Leshansky et al. Reference Leshansky, Bransky, Korin and Dinnar2007; Yang et al. Reference Yang, Kim, Lee, Lee and Kim2011; Del Guidice et al. Reference Del Guidice, Romeo, D’Avino, Greco, Netti and Maffettone2013; Seo et al. Reference Seo, Kang and Lee2014), but the relaxation time could be successfully measured using an extensional rheometry, which enabled the evaluation of
 $W\hspace {-1pt}i$
and
 $\textit{El}$
. The obtained focusing patterns of the particles are illustrated as a function of
 $\textit{Re}$
and
 $\textit{El}$
. Along with the MEP, DEP, CEP and AEP, we have newly found the presence of an intermediate equilibrium position (IEP); particles are focused on eight points located at intermediate positions between the MEP and DEP, symmetric with respect to the midline. Furthermore, the experiments have demonstrated the presence of new bistable states such as the DEP and the AEP or IEP, in addition to the DEP and MEP already reported in Yu et al. (Reference Yu, Wang, Lin and Hu2019) and Yokoyama et al. (Reference Yokoyama, Yamashita, Higashi, Miki, Itano and Sugihara-Seki2021), and the CEP and AEP reported previously (Yang et al. Reference Yang, Kim, Lee, Lee and Kim2011; Kim et al. Reference Kim, Ahn, Lee and Kim2012; Seo et al. Reference Seo, Kang and Lee2014; Kim & Kim Reference Kim and Kim2016). In particular, as the PVP concentration increases from 0 at a constant
 $\textit{Re}$
(
 $=20$
), the particle focusing position shifts successively from the MEP to the IEP, then the DEP, the DEP and AEP, and the AEP alone. Numerical simulations using the FENE-P model are performed with rheologically measured values of the PVP solutions (
 $\textit{Re}$
,
 $\textit{El}$
and
 $\beta$
). The numerical simulations successfully reproduced these focusing patterns observed in the experiments with similar rheological parameters. The numerically obtained lift map for each case is used to account for the particle focusing pattern and its transition. The effect of the fluid elasticity on the inertial focusing is discussed in terms of the fluid elasticity-induced lift due to
 $N_1$
and the wall-induced elastic lift.
This paper is organised as follows. Section 2 describes the experimental method used to observe particles suspended in a square channel flow of PVP aqueous solutions, and outlines the numerical method for calculating the net lift acting on a particle in a viscoelastic flow based on the FENE-P model. In § 3 we present various particle distributions in the channel cross-section, provide numerical results corresponding to the experimental observations, and compare these results with findings from other studies. Finally, § 4 concludes the paper by summarising the main results.
(a) Viscosity and (b) relaxation time of PVP solutions measured using a rotational rheometer (Haake Mars III) and dripping-onto-substrate capillary break-up extensional rheometry (CaBER-DoS), respectively (all experiments performed at 22
 $^\circ$
C).

2. Material and methods
2.1. Experimental methods
Spherical polystyrene particles (Thermo Scientific) with a mean diameter
 $d^*=60$
 $\unicode{x03BC}$
m (
 $59.6\pm 0.8$
 $\unicode{x03BC}$
m) were suspended at volume fractions of
 $0.003$
–
 $0.01$
% in aqueous solutions of PVP. The volume fraction of the particles is so low that hydrodynamic interactions between particles can be neglected. The solutions contain PVP (
 ${Mw}=360$
kDa, Tokyo Chemical Industry) at the concentrations of
 $\phi =0$
–
 $4.0$
wt %, and the density was adjusted to the particle density
 $\rho ^*=1.05\times 10^3$
kg m
 $^{-3}$
by adding sodium chloride. The viscosity
 $\mu ^*$
and relaxation time
 $\lambda ^*$
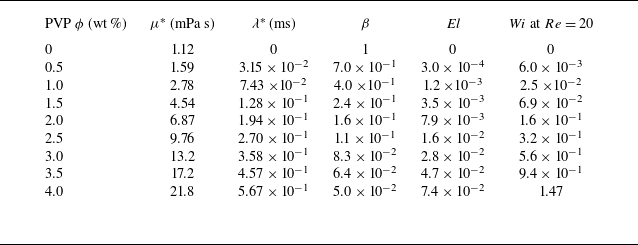
of the solutions were measured, using a rotational rheometer (HAAKE MARS III) and a dripping-onto-substrate capillary breakup extensional rheometry (CaBER-DoS) (Dinic, Jimenez & Sharma Reference Dinic, Jimenez and Sharma2017; Sur & Rothstein Reference Sur and Rothstein2018; Franco-Gómez et al. Reference Franco-Gómez, Onuki, Yokoyama, Nagatsu and Tagawa2021; Rubio et al. Reference Rubio, Vega, Gaán-Calvo and Montanero2022), respectively (figure 2). As shown in figure 2, the viscosities are nearly constant, independent of the shear rate, i.e. the shear thinning is not clearly seen. This is because the dilute PVP aqueous solutions were used. The relaxation times are so small that the viscoelastic property is weak. The rheological data are summarised in table 1.
Viscosity
 $\mu ^*$
, relaxation time
 $\lambda ^*$
, viscosity ratio
 $\beta$
, elasticity number
 $\textit{El}$
and Weissenberg number
 $W\hspace {-1pt}i$
(at
 $Re=20$
) of PVP aqueous solutions at 22
 $^\circ$
C.

(a) Experimental set-up, (b) a typical image, (c) superimposition of particle positions, and (d) PDFs of particles in the channel cross-section.

Figure 3(a) shows the experimental set-up. A syringe pump (Nexus 6000, ISIS) was used to infuse the suspension through a straight glass tube (VitroCom) with a square cross-section of width
 $D^*=400$
 $\unicode{x03BC}$
m and various lengths
 $L^*$
(
 $=20$
–
 $600$
mm). The glass tube was immersed in a tank filled with the suspending fluid, in order to match the refractive index of the inside and outside of the tube. The cross-section of the channel
 $1$
–
 $2$
mm upstream of the outlet was illuminated with an LED light (U-technology UFLS-751) and imaged from the downstream side along the centre axis of the channel using a high-speed camera (Photron FASTCAM mini AX100, Nova S12) equipped with a long-working-distance objective (Olympus SLMPLN 20
 $\times$
) at a frame rate of
 $50$
–
 $13$
 $600$
frames/s. As the volume fraction of the particles is low, they appear individually on the images (figure 3
b). The images obtained were analysed with the public domain software ImageJ (NIH, USA) to yield the position of each particle centre in the cross-section. The pixel size was typically
 $\approx 0.995$
 $\unicode{x03BC}$
m pixel–1. In each experiment, the positions of more than 300 particles were detected to obtain the distribution of the particles in the cross-section by superimposition and their probability densities (figures 3
c and 3
d).
In the present study, the blockage ratio was
 $\kappa =d^*/D^*=0.15$
. The Reynolds number ranged from 1 to 100, corresponding to a particle Reynolds number (
 $=Re\times \kappa ^2$
) from 0.02 to 2.25. The PVP concentration
 $\phi =0$
–
 $4.0$
wt % corresponds to an elasticity number ranging from 0 to 0.07 (table 1).
2.2. Numerical methods
Numerical computations were performed based on the FENE-P model to find the lift distribution and the focusing positions, which are sinks of the vector field of the lift. The governing equations non-dimensionalised by the mean flow velocity and the channel width are written as
 \begin{align} \boldsymbol{\nabla } \boldsymbol{\cdot }\boldsymbol{u} = 0 , \\[-29pt] \nonumber \end{align}
 \begin{align} \frac {\partial \boldsymbol{u}}{\partial t}+(\boldsymbol{u} \boldsymbol{\cdot } \boldsymbol{\nabla })\boldsymbol{u} = -\boldsymbol{\nabla }p+\frac {\beta }{Re}{\nabla} ^2\boldsymbol{u}+ \boldsymbol{\nabla } \boldsymbol{\cdot }\unicode{x1D64F}_p+\boldsymbol{f}_{\!\textit{IB}}-G\boldsymbol{e}_x {,} \\[9pt] \nonumber \end{align}
where
 $\boldsymbol{u}$
,
 $p$
and
 $\unicode{x1D64F}_p$
are respectively the flow velocity, the pressure and the viscoelastic stress tensor derived from the polymers. Here, the
 $x$
axis is taken along the centreline of the channel, and the
 $y$
and
 $z$
axes normal to the side walls. In (2.2),
 $1/Re$
is the dimensionless total shear viscosity and the ratio of the solvent viscosity to the zero shear rate viscosity of the solution is expressed by
 $\beta$
. The interaction between the inertial particles and the fluid flow is modelled by the volume force
 $\boldsymbol{f}_{\!\textit{IB}}$
according to the immersed boundary method (Kajishima et al. Reference Kajishima, Takiguchi, Hamasaki and Miyake2001). The flow is driven by the mean pressure gradient
 $-G\boldsymbol{e}_x$
, so that the volume flux is constant. The magnitude of the mean pressure gradient
 $G$
is dynamically determined by the parameter adaptive control, and it is almost constant in the final steady states.
The viscoelastic stress tensor
 $\unicode{x1D64F}_p$
is modelled by the FENE-P model to mimic the viscoelastic properties of the PVP aqueous solution (Purnode & Crochet Reference Purnode and Crochet1998), though the shear thinning is not clear in the dilute PVP aqueous solutions as shown in figure 2(a). In fact, the numerical results shown below will be independent of the selection of the FENE-P model because the sensitivity of the flow fields to the selection of constitutive models is known to be small for small
 ${W\hspace {-1pt}i}\leqslant 0.32$
(see, for example, Herrchen & Öttinger Reference Herrchen and Öttinger1997; Peng et al. Reference Peng, Tang, Li, Zhang and Yu2023; John et al. Reference John, Poole, Kowalski and Fonte2024). Among the constitutive models, the FENE-P model is widely used in numerical simulations of viscoelastic shear flows due to its relative simplicity and accuracy in predicting macroscopic properties of dilute polymer solutions (Yamani & McKinley Reference Yamani and McKinley2023).
In this paper,
 $\unicode{x1D64F}_p$
is given by the positive-definite symmetric conformation tensor
 $\unicode{x1D63E}$
as
 \begin{equation} \unicode{x1D64F}_p = -\frac {1-\beta }{Re{W\hspace {-1pt}i}}\left [ \unicode{x1D644}-\frac { \unicode{x1D63E}}{1-\textit{tr}( \unicode{x1D63E}\kern1.5pt)/l^2} \right ] , \end{equation}
and the time evolution of
 $\unicode{x1D63E}$
is given as
 \begin{equation} \frac {\partial\kern-1pt\unicode{x1D63E}}{\partial t} = -(\boldsymbol{u}\boldsymbol {\cdot }\boldsymbol{\nabla }) \unicode{x1D63E}+ \unicode{x1D63E}\boldsymbol {\cdot }\boldsymbol{\nabla }\boldsymbol{u}+(\boldsymbol{\nabla }\boldsymbol{u})^T\boldsymbol {\cdot }\unicode{x1D63E}+\frac {1}{{W\hspace {-1pt}i}}\left [ \unicode{x1D644}-\frac { \unicode{x1D63E}}{1-\textit{tr}( \unicode{x1D63E}\kern1.5pt)/l^2} \right ] . \end{equation}
Here, the maximal length of the polymers normalised by their equilibrium length
 $l$
is set to be 100. As noted below, the numerical results presented in this paper are hardly affected by the value of
 $l$
, as long as
 $l$
is larger than about 15. The square-root symmetric tensor
 $\unicode{x1D63D}$
instead of
 $\unicode{x1D63E}= \unicode{x1D63D}^2$
is employed for numerical stability (Balci et al. Reference Balci, Thomases, Renardy and Doering2011), and then the governing equation of
 $\unicode{x1D63D}$
is written as
 \begin{equation} \frac {\partial\kern-1pt\unicode{x1D63D}}{\partial t} = -(\boldsymbol{u}\boldsymbol {\cdot }\boldsymbol{\nabla }) \unicode{x1D63D}+ \unicode{x1D63D}\boldsymbol {\cdot }\boldsymbol{\nabla }\boldsymbol{u}+ \unicode{x1D63C}\boldsymbol {\cdot }\unicode{x1D63D}+\frac {1}{2{W\hspace {-1pt}i}}\left [ \unicode{x1D63D}^{-1}-\frac { \unicode{x1D63D}}{1-\textit{tr}( \unicode{x1D63D}^2)/l^2} \right ] {,} \end{equation}
where
 $\unicode{x1D63C}$
is the antisymmetric tensor that satisfies
 $\unicode{x1D63C}\boldsymbol{\cdot }\unicode{x1D63D}+ \unicode{x1D63D}\boldsymbol{\cdot }\unicode{x1D63C}=(\boldsymbol{\nabla }\boldsymbol{u})^T\boldsymbol{\cdot }\unicode{x1D63D}- \unicode{x1D63D} \boldsymbol{\cdot }\boldsymbol{\nabla }\boldsymbol{u}$
.
These governing equations (2.1)–(2.3) and (2.5) are numerically integrated by a fractional-step method (see Kajishima et al. (Reference Kajishima, Takiguchi, Hamasaki and Miyake2001) for details of the numerical method) with time increment
 $\Delta t=10^{-4}$
. The spatial derivatives are evaluated by the fourth-order central difference with
 $\Delta x=\Delta y=\Delta z=1/128$
. The Poisson equation for the pressure is solved by the biconjugate gradient stabilised (BiCGSTAB) method. The periodic boundary condition was used in the streamwise direction (the
 $x$
direction) with a period length
 $L_x=2$
.
To evaluate the lift acting on the rigid particle, we consider the case that the particle is fixed in the lateral direction (the
 $y$
and
 $z$
directions) while they travel in the streamwise direction (the
 $x$
direction) and rotate freely. Thus, we have equations for the streamwise velocity
 $U_C$
of the centre of mass of the particle
 $\boldsymbol{x}_C$
and the angular velocity
 $\boldsymbol{\varOmega }_C$
as
 \begin{equation} \frac {\pi }{6}\kappa ^3\frac {{\rm d}U_C}{{\rm d}t} = \int ({-}f_{\textit{IB}x}){\rm d}V ,\quad \frac {\pi }{60}\kappa ^5\frac {\rm d\boldsymbol{\varOmega }_C}{{\rm d}t} = \int (\boldsymbol{x}-\boldsymbol{x}_C)\times ({-}\boldsymbol{f}_{\!\textit{IB}}){\rm d}V . \end{equation}
The lift acting on the particles is given by
 \begin{equation} \boldsymbol{F} = (F_y, F_z) ,\quad F_i = \int ({-}f_{\textit{IB}i}){\rm d}V ,\quad i=y, z . \end{equation}
The lift
 $\boldsymbol{F}$
is non-dimensionalised by
 $\rho ^*U^{*2}D^{*2}$
in this formulation.
Corresponding to our experiments at
 $Re=20$
, we performed computations for
 $\kappa =0.15$
,
 ${\textit{El}}=0$
–
 $0.016$
and
 ${W\hspace {-1pt}i}=0$
–
 $0.32$
(see table 1). Here, we note that the dimensionless lateral flow velocity is smaller than
 $10^{-6}$
in the absence of the particle in the parameter ranges examined, and the secondary flow is negligible. Thus, the lift due to the flow--particle interactions solely determines the lateral motion of the particle and equilibrium positions in the cross-section of the channel.
The appropriateness of the grid spacing and the periodic boundary length was verified. We compared the lift force acting on the particle at
 $(y,z)=(0.17,0.17)$
in the simulation when
 $Re=20$
and
 ${\textit{El}}=0.016$
for grid spacings of 1/128 and 1/192. The former is
 $3.675\times 10^{-4}$
while the latter is
 $3.574\times 10^{-4}$
, and the difference is smaller than 3 % (see figure S1 in the supplementary material is available at https://doi.org/10.1017/jfm.2025.10744). The periodic length
 $L_x=2$
was determined based on the error assessment of the numerical computation as noted in Yokoyama et al. (Reference Yokoyama, Yamashita, Higashi, Miki, Itano and Sugihara-Seki2021).
With regard to the maximum polymer length
 $l$
, it is not straightforward to estimate the value of
 $l$
. One estimate is provided by a microscopic formula (Clasen et al. Reference Clasen, Plog, Kulicke, Owens, Macosko, Scriven, Verani and McKinley2006), which gives
 $l$
for the PVP solution as larger than about 25 when the physical properties of the polymers are adopted from the literature (Abdel Azim et al. Reference Abdel Azim, Tenhu, Maerta and Sundholm1992; Kamli, Guettari & Tajouri Reference Kamli, Guettari and Tajouri2023). Because the PVP solutions used in the present experiments were dilute, we consider that
 $l$
could be even larger. Therefore, we chose to set
 $l=100$
. The value of
 $l$
has little effect on the flow field as far as
 $\textit{tr}( \unicode{x1D63E}\kern1.5pt)\ll l^2$
. From the results of the computation we found that the maximal values of
 $\textit{tr}( \unicode{x1D63E}\kern1.5pt)$
for
 ${\textit{El}}=0.0003$
and 0.016 at
 $Re=20$
are approximately 3 and 20, respectively. This implies that the condition of maximum
 $\textit{tr}( \unicode{x1D63E}\kern1.5pt)\ll l^2$
is satisfied in the whole parameter range. This indicates that the rheological characteristics of the fluid do not depend on the detailed value of
 $l$
as far as
 $l$
is set to be much larger than about 15 in the current computation. In fact, the difference in lift force acting on the particle at
 $(y,z)=(0.17,0.17)$
for a simulation in which having
 $Re=20$
and
 ${\textit{El}}=0.016$
is 4 % between
 $l=25$
and
 $l=100$
, but is 20 % between
 $l=10$
and
 $l=100$
. Thus, the present choice of
 $l=100$
well represents the PVP rheological property in the FENE-P model.
3. Results and discussion
3.1. Experimental results
As representative examples of the experimental results for small inertia and finite elasticity of suspending fluids, figure 4 shows the development of the particle distribution along the streamwise direction from the channel inlet for
 $\phi =4.0$
wt % at
 $Re=1$
and
 $10$
. Each dot represents the position of the particle centre in the channel cross-section. Note that figure 4 displays the superimposed particle positions instead of the snapshot. The cumulative particle distribution for lager
 $L^*/D^*$
corresponds to that in a cross-section located farther downstream from the inlet. At
 $Re=1$
shown in figure 4(a), suspended particles are widely dispersed in the most upstream cross-section, moving inward towards the centre except near the diagonals and finally focusing at four points near the corners (CEP) as well as the centre (AEP) in the most downstream cross-section. This focusing pattern is consistent with that reported by Seo et al. (Reference Seo, Kang and Lee2014) for spherical particles suspended in PVP solutions at
 $\phi =8.0$
wt % and
 $Re=0.55$
and
 $1.11$
(
 $\kappa =0.1,0.17$
). As noted in the introduction, particle focusing on these locations can be accounted for if the fluid elasticity-induced lift is directed to the lower shear region (figure 1
b). At
 $Re=10$
shown in figure 4(b), suspended particles move inward and eventually solely focus on the channel centre (AEP). The focusing on the CEP shown in figure 4(a) disappears owing to enhanced wall effects directed away from the channel wall. This single-position focusing due to the synergetic effect of inertia and fluid elasticity is termed elasto-inertial focusing (Yang et al. Reference Yang, Kim, Lee, Lee and Kim2011).
Distributions of particles at (a)
 $Re=1$
and (b)
 $Re=10$
for various
 $L^*\!/\!D^*$
at
 $\phi =4.0$
wt % and
 $\kappa =0.15$
. The particles positions are superimposed in each figure.

Figure 5(a–g) illustrates the inertial migration of particles at a finite
 $\textit{Re}$
(
 $=20$
) for various PVP concentrations of
 $\phi =0$
–
 $3.0$
wt % (
 ${\textit{El}}=0$
–
 $0.028$
,
 ${W\hspace {-1pt}i}=0$
–
 $0.56$
). Figure 5(h) shows probability density functions (PDFs) of more than 300 particles in the most downstream cross-section (
 $L^*/D^*=1500$
) for each
 $\phi$
. Figure 5(a) represents the case in a Newtonian fluid. Suspended particles are dispersed with relatively higher concentrations near a ring (pSS ring) in the most upstream cross-section, and further downstream they are first aligned along the pSS ring and then gradually migrate to four points near the centre of the channel faces (MEP). These developments of the particle distribution agree with previous experimental results observed in Newtonian fluids at relatively low
 $\textit{Re}$
, though the particle focusing in the present study at
 $Re=20$
is slower than that reported at higher
 $\textit{Re}$
(Shichi et al. Reference Shichi, Yamashita, Seki, Itano and Sugihara-Seki2017).
(a–g) Distributions of particles for
 $L^*\!/\!D^*=50$
–
 $1500$
at (a)
 $\phi =0$
, (b) 0.5 wt %, (c) 1.0 wt %, (d) 1.5 wt %, (e) 2.0 wt %, (f) 2.5 wt % and (g) 3.0 wt %. (h) Probability density functions for
 $L^*\!/\!D^*=1500$
. Here
 $\kappa =0.15$
and
 $Re=20$
.

For
 $\phi =0.5$
wt % shown in figure 5(b), suspended particles are fairly widely dispersed in the most upstream cross-section, but remain mostly distributed along the pSS ring even in the most downstream cross-section. Probability densities in the most downstream cross-section (
 $L^*/D^*=1500$
) in figure 5(h) indicate that particles show higher concentrations near eight points on the pSS ring (circles in figure 5
b), located slightly off the midlines and symmetric with respect to the midlines. In addition, the probability densities on the midlines and the diagonals in the most downstream cross-section are smaller than those in the second most downstream cross-section (
 $L^*/D^*=750$
). If the channel is long enough, particles are expected to focus on these points. Thus, this position is named the IEP. The present numerical simulation has reproduced this focusing pattern with parameter values comparable to this experimental condition, as shown below.
At
 $\phi =1.0$
–
 $2.0$
wt % shown in figure 5(c–e), particles approach the pSS ring as they move downstream, and eventually focus near four points located on the diagonals (DEP), with the final positions closer to the centre for larger
 $\phi$
. At
 $\phi =2.5$
wt % shown in figure 5( f), the centre in the cross-section (AEP) is added as the final focusing position. At
 $\phi =3.0$
wt % in figure 5(g), particles migrate monotonically towards the AEP.
The probability densities of particles shown in figure 5(h) indicate that an increase in PVP concentration transitions the final focusing positions of particles from the MEP to the IEP, the DEP and then to the AEP. There are several important features observed in the particle distributions and the probability densities. Firstly, the inertial migration in PVP solutions also exhibit two-phase properties, similar to that in Newtonian fluids. In the first phase they rapidly migrate towards the pSS ring and in the second phase they slowly move along the pSS ring towards stable equilibrium positions. The stable equilibrium positions on the pSS ring are the MEP in figures 5(a), the IEP in figure 5(b) and the DEP in figure 5(c–e). Secondly, as
 $\phi$
increases, the final focusing positions shift from the midline to the diagonal in the azimuthal direction, such as from the MEP, to the IEP and then the DEP (figure 5
a–c), and then move in the radial direction towards the channel centre (AEP), as shown in figure 5(c–g). This transition is understood from an increase in the fluid elasticity-induced lift due to the first normal stress difference
 $N_1$
, which exerts in the direction towards the diagonal and inward in the square cross-section, as discussed above (figure 1
b). For particles located near the channel wall, the fluid elasticity also generates outward lift (wall-induced elastic lift), due to polymer elongation upstream between the particle and the channel wall. The competition between the lift due to
 $N_1$
directed mostly inward and the wall-induced elastic lift directed mostly outward is associated with the tendency for the equilibrium positions to change only in the azimuthal direction not in the radial direction for small
 $\phi$
(figure 5
a–c), as discussed below. This feature is also reproduced by the present numerical simulation. Thirdly, the presence of the IEP is observed for the first time in the viscoelastic flow in the present study. Our previous study (Yokoyama et al. Reference Yokoyama, Yamashita, Higashi, Miki, Itano and Sugihara-Seki2021) reported the presence of a MEP and DEP coexistence state at higher
 $\textit{Re}$
(
 $=50$
) between the MEP focusing and DEP focusing. As shown below in figures 6 and 7, this is also true in the present study. At lower
 $\textit{Re}$
(
 $=20$
), however, instead of this bistable state, a new state where only the IEP is stable emerges. In these transition states, the lift on the pSS ring is so small that the particle migration in the second phase is extremely slow, which is shown below for the present numerical simulation. As a result, long distances from the channel inlet are necessary for particles to focus on stable equilibrium positions. This is the reason why particles are observed to be aligned along almost the entire pSS ring even in the most downstream cross-section (figure 5
b). Lastly, another coexistence state of the DEP and AEP is observed at
 $\phi =2.5$
wt %. This state appears between the DEP focusing (figure 5
e) and the AEP focusing (figure 5
g).
Figure 6 shows the particle distributions observed at various
 $\textit{Re}$
and
 $\phi$
in the most downstream cross-section (
 $L^*\!/\!D^*=1500$
). Let us see the variation of the particle focusing pattern with
 $\textit{Re}$
for each
 $\phi$
. For
 $\phi =0$
, the suspending fluid is a Newtonian fluid. In Newtonian fluids, no lift acts on spherical particles when the inertia is negligible . Thus, at low
 $\textit{Re}$
, the migration of particles is so slow that they are rather widely dispersed with higher concentrations along the pSS ring even at
 $L^*\!/\!D^*=1500$
. Increasing
 $\textit{Re}$
intensifies focusing on four points of the MEP due to an increase in inertial lift, which agrees with previous studies (Shichi et al. Reference Shichi, Yamashita, Seki, Itano and Sugihara-Seki2017).
Distributions of particles for various
 $\phi$
and
 $\textit{Re}$
(
 $\kappa =0.15$
,
 $L^*\!/\!D^*=1500$
). Probability density functions for (a)
 $\phi =0.5$
wt %,
 $Re=1$
, (b)
 $\phi =0.5$
wt %,
 $Re=10$
, (c)
 $\phi =1$
wt %,
 $Re=40$
, (d)
 $\phi =1.5$
wt %,
 $Re=60$
, (e)
 $\phi =2$
wt %,
 $Re=60$
, (f)
 $\phi =2.5$
wt %,
 $Re=60$
, (g)
 $\phi =2.5$
wt %,
 $Re=70$
and (h)
 $\phi =2.5$
wt %,
 $Re=100$
.

For
 $\phi =0.5$
wt %, a slight effect of fluid elasticity can be seen at low
 $\textit{Re}$
, where particles are nearly aligned along the pSS ring. Although it is difficult to specify the locations of higher concentrations at
 $Re=1$
(figure 6
a), probability densities show a higher concentration near intermediate positions located between the diagonal and midline (IEP) in the range of
 $5\leqslant Re\leqslant 25$
, as already seen in figure 5(b) at
 $Re=20$
. As
 $\textit{Re}$
increases, the locations of higher concentration move from the diagonal to the midline (see figure 6(b) at
 $Re=10$
and figure 5(b) at
 $Re=20$
), until at
 $Re=30$
particles are focused near the midlines (MEP). At larger
 $\textit{Re}$
(
 $\geqslant 40$
), the particle focusing positions are readily seen to be the MEP.
For low
 $\phi$
(
 $0\lt \phi \leqslant 2$
wt %), particles are focused on four points of the DEP at
 $\textit{Re}$
lower than a certain critical
 $\textit{Re}$
,
 $Re_1$
, and the MEP at
 $\textit{Re}$
higher than another critical
 $\textit{Re}$
,
 $Re_2$
. In the range of
 $\textit{Re}$
between
 $Re_1$
and
 $Re_2$
, the final particle focusing positions are eight points of the IEP for
 $\phi =0.5$
wt %. For
 $\phi =1.0$
–
 $2.0$
wt %, both of
 $Re_1$
and
 $Re_2$
increase with increasing
 $\phi$
, and at
 $\textit{Re}$
between these two values, particles show higher concentrations both near the diagonal and near the midline (see figures 6
d and 6
e), suggesting a bistable state of the DEP and MEP.
The variation of the particle distribution observed for
 $\phi =2.5$
wt % is quite unique. Focusing on four points of the DEP is observed in the
 $\textit{Re}$
range from 30 to 60 (see figure 6(f) at
 $Re=60$
), below which particles are focused on the AEP as well, representing a bistable state of the DEP and AEP. At very low
 $\textit{Re}$
(
 $\leqslant 5$
), particles are solely focused on the AEP. On the other hand, above this range (
 $Re\gt 60$
), particles are focused on four points of the DEP and eight points of the IEP, for a total of twelve points, representing another bistable state of the DEP and IEP (see figure 6
g). In this bistable state, an increase in
 $\textit{Re}$
weakens focusing on the DEP and strengthens focusing on the IEP, until only a few particles are seen near the diagonals at
 $Re\geqslant 90$
(see figure 6(h) at
 $Re=100$
).
Particle focusing patterns; type (A): circles, type (B): inverted triangles, type (C): diamonds, type (D): asterisks, type (E): pentagons, type (F): crosses, type (G): squares and type (H): triangles. Filled marks represent the case where particles are focused or nearly focused on equilibrium positions, and open marks represent the case where the focusing pattern is inferred from PDFs. Here
 $\kappa =0.15$
and
 $L^*\!/\!D^*=1500$
.

For
 $\phi \geqslant 3.0$
wt %, experiments at larger
 $\textit{Re}$
could not be carried out owing to limitations of the experimental equipment caused by increased solution viscosity and, hence, pressure. At
 $Re=1$
, particles are solely focused on the AEP for
 $\phi =3.0$
wt %, but on four points near the corners (CEP) as well for
 $\phi =3.5$
and
 $4.0$
wt %. At
 $Re\geqslant 5$
, particles show a single focusing on the AEP except for the cases of
 $\phi =3.0$
wt % at
 $Re\geqslant 40$
. In the excluded cases, particles are focused on four points of the DEP as well.
The particle focusing patterns observed experimentally at
 $L^*\!/\!D^*=1500$
are summarised as a function of
 $\textit{Re}$
and
 $\textit{El}$
(lower abscissa) or PVP concentration
 $\phi$
(upper abscissa) in figure 7. As schematically shown in figure 7, eight different focusing patterns are obtained (labelled A--H), depending on the number and positions of the particle focusing: (A) four points of the MEP, (B) eight points of the IEP, (C) four points of the DEP, (D) four points of the DEP and the AEP (a total of five points), (E) single point of the AEP, (F) four points of the CEP and the AEP (a total of five points), (G) four points of the DEP and four points of the MEP (a total of eight points) and (H) four points of the DEP and eight points of the IEP (a total of twelve points). Except for types (D) and (F), filled marks in figure 7 represent the case where particles are focused or nearly focused on equilibrium positions, and open marks represent the case where focusing is not sufficient and the focusing pattern is inferred from probability densities. Two open marks are superposed in two cases of
 $\phi =0.5$
wt %,
 $Re=1$
and
 $\phi =2.5$
wt %,
 $Re=90$
, where it is difficult to identify the focusing pattern, as noted above.
In figure 7, inertia is dominant and fluid elasticity is small in the upper left, whereas in the lower right, fluid elasticity is dominant and inertia is small. From the top left to the bottom right, the particle focusing pattern is seen to shift approximately in the order of the type (A), (C), (E), and (F). Between types (A) and (C), type (B) emerges at low
 $\textit{Re}$
and
 $\phi$
, whereas type (G) appears at higher
 $\textit{Re}$
and
 $\phi$
, and type (H) at even higher
 $\textit{Re}$
and
 $\phi$
. Between types (C) and (E), type (D) appears. In types (B), (G) and (H), very small lifts on the pSS ring (see figure 9(c) for type (B)) cause very slow motion of particles in the second phase, resulting in their alignment almost all around the pSS ring even in the most downstream cross-section of the experiments. Therefore, the focusing patterns are unclear and inferred from PDFs.
3.2. Numerical results
Table 1 summarises the parameter values obtained from the measurements of the viscosity and relaxation time of the PVP solutions used in the experiments. Using these values, we conducted numerical computations of the lift acting on a spherical particle in square channel flows of a FENE-P model, corresponding to the experiments for various PVP concentrations
 $\phi$
at
 $Re=20$
and
 $\kappa =0.15$
, shown in figure 5.
Figures 8(a) and 8(b) plot the radial component of lift
 $F_r$
acting on the particle placed on the midline (the
 $y$
axis) and the diagonal. Note that
 $F_r=F_y$
on the
 $y$
axis. The lift in Newtonian flows is directed outward, i.e.
 $F_r\gt 0$
near the channel centre, while
 $F_r\lt 0$
near the channel wall (Di Carlo et al. Reference Di Carlo, Edd, Humphry, Stone and Toner2009; Nakagawa et al. Reference Nakagawa, Yabu, Otomo, Kase, Makino, Itano and Sugihara-Seki2015). As
 $\phi$
(or
 $\textit{El}$
) increases,
 $F_r$
decreases except on the diagonal near the channel wall, i.e. corners, which is due to increasing fluid elasticity-induced lift (see the introduction). In the range
 $0\lt \phi \leqslant 1$
wt % (
 $0\lt {\textit{El}}\leqslant 0.0012$
), the
 $F_r$
curves nearly overlap and the zeros of
 $F_r$
move only slightly. Note that these zeros correspond to the MEP (figure 8
a) and the DEP (figure 8
b) because
 $F_\theta =0$
on these lines. As
 $\phi$
(or
 $\textit{El}$
) increases further,
 $F_r$
continues to decrease except near the corners where
 $F_r$
increases significantly. For
 $\phi =2.2$
wt % (
 ${\textit{El}}=0.01$
),
 $F_r$
remains close to 0 at
 $0\leqslant r\lessapprox 0.2$
both on the midline and the diagonal. Beyond this value (
 $\phi \gt 2.2$
wt %,
 ${\textit{El}}\gt 0.01$
),
 $F_r$
becomes negative except near the corners, leading to the disappearance of the MEP and DEP. Instead, the channel centre (AEP) becomes a stable equilibrium position, and another focusing position (CEP) appears near the corner outside of the saddle position where the particle almost touches the two walls.
Numerical results for the radial component of the lift exerted on the particle located (a) on the midline and (b) on the diagonal. The azimuthal component of the lift on the particle located (c) on the line
 $z=y\tan (\pi /8)$
. Here
 $\kappa =0.15$
and
 $Re=20$
.

Similarly, figure 8(c) plots the azimuthal component of lift
 $F_\theta$
acting on the particle placed on a line of
 $z=y\tan (\pi /8)$
. The lift in Newtonian flows is directed away from the diagonal, i.e. towards the midline (
 $F_\theta \lt 0$
in figure 8
c), in a region apart from the channel wall, as noted in the introduction. Near the channel wall, it is directed in the opposite direction (
 $F_\theta \gt 0$
in figure 8
c) and
 $F_\theta$
has a zero midway between the channel centre and the wall. As
 $\phi$
(or
 $\textit{El}$
) increases,
 $F_\theta$
increases monotonically, which is due to increasing fluid elasticity-induced lift (see the introduction), and the zeros of
 $F_\theta$
approach the origin. Between
 $\phi =1.0$
wt % (
 ${\textit{El}}=0.0012$
) and 1.5 wt % (
 ${\textit{El}}=0.0035$
), these zeros vanish; above this value,
 $F_\theta \gt 0$
on the entire line of
 $z=y\tan (\pi /8)$
and the lift acts towards the diagonal. This is the case where the fluid elasticity-induced lift exceeds the inertial lift in the azimuthal direction.
Most of the above mentioned properties of
 $F_r$
and
 $F_\theta$
in figure 8 at
 $Re=20$
are commonly seen at
 $Re=50$
(Yokoyama et al. Reference Yokoyama, Yamashita, Higashi, Miki, Itano and Sugihara-Seki2021). Additionally, it may be interesting to note that four more features of the lift are seen in figure 8. Firstly, near the channel centre (
 $r\lessapprox 0.1$
),
 $F_r$
on the midline and
 $F_r$
on the diagonal are very close to each other and
 $F_\theta$
is nearly equal to zero. This is explained from the fact that the flow field is almost axisymmetric in the region far apart from the channel wall. Secondly, for
 $\phi \leqslant 1$
wt %, an increase in
 $\phi$
decreases zeros of
 $F_r$
only slightly (figures 8
a and 8
b), whereas it decreases zeros of
 $F_\theta$
significantly (figure 8(c)). This feature is related to the tendency experimentally observed for the equilibrium positions to move only in the azimuthal direction not in the radial direction for small
 $\phi$
(figure 5
a–c). Thirdly, for
 $\phi =2.2$
wt %,
 $F_r$
is negative on the entire midline (figure 8
a), whereas
 $F_r$
on the diagonal changes its sign three times between the centre and the corner, i.e.
 $F_r$
has three zeros on the diagonal (inset of figure 8
b). Fourthly, this implies that at approximately this
 $\phi$
(
 $=2.2$
wt %), the fluid elasticity-induced lift exceeds the inertial lift in the radial direction. It is interesting that this occurs at higher
 $\phi$
in the radial direction than in the azimuthal direction. Thus, it is suggested that the fluid elasticity-induced lift has a larger azimuthal component than the radial component, compared with the inertial lift.
The distributions of lift in the cross-section and trajectories of particles as well as equilibrium positions are shown in figure 9. The top half of each plot is a lift map, where each arrow represents the direction of the lift acting on a particle located at the arrow’s origin and the magnitude is shown by the colour. The solid line represents the contour of
 $F_r=0$
, and the dashed line the contours of
 $F_\theta =0$
. For low
 $\phi$
, the contour of
 $F_r=0$
(
 $r$
nullcline) forms a closed loop around the centre, whereas the contours of
 $F_\theta =0$
consist of the midlines (the
 $y$
and
 $z$
axes), the diagonals and a closed loop. Although all the contours of
 $F_\theta =0$
are nullclines, here we refer only to the closed loop as
 $\theta$
nullcline for convenience because
 $F_\theta$
is always 0 on the midlines and the diagonals.
Numerical results of lifts, equilibrium positions, nullclines (
 $r$
nullcline: solid lines,
 $\theta$
nullcline: dashed lines) and particle trajectories for (a)
 $\phi =0$
(
 ${\textit{El}}=0$
,
 $\beta =1$
), (b) 0.5 wt % (
 ${\textit{El}}=0.0003$
,
 $\beta =0.7$
), (c) 0.85 wt % (
 ${\textit{El}}=0.00085$
,
 $\beta =0.47$
), (d) 1.0 wt % (
 ${\textit{El}}=0.0012$
,
 $\beta =0.4$
), (e) 1.5 wt % (
 ${\textit{El}}=0.0035$
,
 $\beta =0.24$
), (f) 2.0 wt % (
 ${\textit{El}}=0.0079$
,
 $\beta =0.16$
), (g) 2.2 wt % (
 ${\textit{El}}=0.01$
,
 $\beta =0.14$
) and (h) 2.5 wt % (
 ${\textit{El}}=0.016$
,
 $\beta =0.11$
). Here
 $\kappa =0.15$
and
 $Re=20$
.

The bottom half of figure 9 shows the trajectories of the particle centre starting from various positions (cross-marks), projected on the cross-section. The magnitude of the lift along the trajectories is indicated by the colour. The trajectories of the particles and their colour in figure 9(a–e) highlight distinct features of the two-phase properties of the inertial migration. In the first phase they mainly migrate in the radial direction towards the pSS ring under the lift
 $\sim \textit {O}(10^{-4})$
and in the second phase they migrate along the pSS ring under the small lift
 $\sim \textit {O}(10^{-5})$
or less, except for the case in figure 9(e). If these lifts are balanced with the Stokes drag, the migration velocities are estimated to be
 $\sim \textit {O}(10^{-3})$
and
 $\textit {O}(10^{-4})$
or less, respectively. In addition, figure 9(a–e) shows that the pSS ring is located very close to the
 $r$
nullcline. When the
 $r$
and
 $\theta$
nullclines are close to each other, as in figure 9(c), the lift on the pSS ring is extremely small (
 $\sim \textit {O}(10^{-6})$
), resulting in very small migration velocities (
 $\sim \textit {O}(10^{-5})$
). This explains the experimentally obtained distribution of particles in figure 5(b) and the experimental difficulty in identifying the type (B) focusing pattern in figure 7. On the other hand, when the
 $\theta$
nullcline is absent as in figure 9(e), the lift on the pSS ring is
 $\sim \textit {O}(10^{-4})$
or less, which remains slightly smaller than that in the first phase. In the cases with larger
 $\phi$
(figure 9
f–h), the trajectories exhibit characteristics different from those described earlier. There is no distinct second phase, which is shown in figure 9(a–e), and the trajectories do not form the pSS ring.
In figure 9, stable, saddle and unstable equilibrium positions are also displayed, and the focusing positions observed experimentally correspond to the stable equilibrium positions. The intersections between the zero contours of
 $F_r$
and
 $F_\theta$
represent the equilibrium positions where lift vanishes; the intersection between the
 $r$
nullcline and the midlines corresponds to the MEP, and that between the
 $r$
nullcline and the diagonal corresponds to the DEP. From the symmetry, the channel centre is always an equilibrium position (AEP). The lift directions around the channel centre together with the particle trajectories indicate that the AEP is an unstable equilibrium position in figure 9(a–f) (
 ${\textit{El}}=0$
–
 $0.0079$
), while it is a stable equilibrium position in figures 9(g) and 9(h) (
 ${\textit{El}}=0.01,0.016$
). From these results along with
 $F_r$
curves in figures 8(a) and 8(b), the critical
 $\textit{El}$
is estimated to be
 $\approx 0.01$
. The present experiments shown in figure 7 confirm this critical
 $\textit{El}$
(
 $\sim 0.01$
) from boundaries between type (C) and (E) or (D). In addition, this value is equal to that obtained by previous numerical studies (Li et al. Reference Li, McKinley and Ardekani2015; Yu et al. Reference Yu, Wang, Lin and Hu2019). In their studies, numerically obtained critical
 $\textit{El}$
is explained from a balance between the inertial lift and the elasticity-induced lift. We discuss this issue below.
Figure 9(a) shows the case of a Newtonian fluid, where the
 $\theta$
nullcline is located outside of the
 $r$
nullcline (Yamashita, Itano & Sugihara-Seki Reference Yamashita, Itano and Sugihara-Seki2019). Here
 $F_r$
is positive inside the
 $r$
nullcline, whereas
 $F_r$
is negative outside of it. Similarly,
 $F_\theta$
is negative inside the
 $\theta$
nullcline, whereas
 $F_\theta$
is positive outside of it in
 $0\lt \theta \lt \pi /4$
, and vice versa in
 $\pi /4\lt \theta \lt \pi /2$
. The direction of the lift in the region away from the channel wall, outward and towards the midline, coincides with that of the shear gradient-induced lift, in the direction of increasing shear as mentioned in the introduction. In figure 9(a) (
 $\phi =0$
), since the MEP and DEP are located inside the
 $\theta$
nullcline where
 $F_\theta$
is directed towards the midline, the MEP is a stable equilibrium position while the DEP is a saddle point. This predicts that particles focus on the MEP, corresponding to the type (A) focusing pattern. This focusing pattern agrees with the present experiment for
 $\phi =0$
(figure 5
a) and previous studies for spherical particles in Newtonian fluids (Di Carlo et al. Reference Di Carlo, Irima, Tompkins and Toner2007, Reference Di Carlo, Edd, Humphry, Stone and Toner2009; Choi et al. Reference Choi, Seo and Lee2011; Miura et al. Reference Miura, Itano and Sugihara-Seki2014; Nakagawa et al. Reference Nakagawa, Yabu, Otomo, Kase, Makino, Itano and Sugihara-Seki2015; Shichi et al. Reference Shichi, Yamashita, Seki, Itano and Sugihara-Seki2017).
Figure 9(a–e) shows that, as
 $\phi$
increases, an increase in fluid elasticity moves the
 $\theta$
nullcline inward, whereas the
 $r$
nullcline located inside the
 $\theta$
nullcline at
 $\phi =0$
does not largely change its position. These features are consistent with the lift profiles in figure 8, where the zeros of the
 $F_r$
curves,
 $r$
nullclines, hardly move and the zeros of
 $F_\theta$
curves,
 $\theta$
nullclines, shift inwards for
 $\phi \leqslant 1$
wt %. Since the
 $\theta$
nullcline approaches closer to the
 $r$
nullcline along the midline than along the diagonal (see figure 9
b), these two nullclines cross near the midline (see figure 9
c). Thus, a pair of intersections representing another equilibrium position emerges near the midline as shown in figure 9(c). This new equilibrium position corresponds to the IEP. In figure 9(c) (
 $\phi =0.85$
wt %) the lift map indicates that the IEP is stable, but the MEP is changed to be a saddle point, representing the type (B) focusing pattern. This focusing pattern agrees with the experiment for
 $\phi =0.5$
wt %, showing particle focusing on eight points of the IEP (figure 5
b), though the present numerical simulation for
 $\phi =0.5$
wt % (figure 9
b) predicts that the MEP remains stable. In the numerical simulation,
 $\phi$
needs to be slightly larger for the IEP to appear. A further increase in
 $\phi$
(
 $\geqslant 1.0$
wt %) moves the
 $\theta$
nullcline even closer to the channel centre so that the
 $\theta$
nullcline is completely inside the
 $r$
nullcline as in figure 9(d) (
 $\phi =1.0$
wt %), and then the
 $\theta$
nullcline vanishes as seen in figure 9(e) (
 $\phi =1.5$
wt %). In these cases, the MEP is a saddle point while the DEP is stable, corresponding to the type (C) focusing pattern. This focusing pattern agrees with the experiments for
 $\phi =1.0$
and 1.5 wt % shown in figures 5(c) and 5(d).
The transition of the particle focusing from four points of the MEP to four points of the DEP with increasing
 $\phi$
is due to the immobility of the
 $r$
nullcline and the shrinkage of the
 $\theta$
nullcline (see figure 9
a–e). This tendency was also observed at
 $Re=50$
in our previous study (Yokoyama et al. Reference Yokoyama, Yamashita, Higashi, Miki, Itano and Sugihara-Seki2021). In that study, the conformation tensor and the force distribution on the particle surface demonstrated that, when a particle is located near the channel wall, enhanced polymer elongation observed upstream of the particle between the particle and the channel wall generates lift exerting outward (i.e. wall-induced elastic lift). Since this outward lift increases with increasing fluid elasticity, an increase in the inward lift induced by
 $N_1$
is nearly cancelled, resulting in the immobility of the
 $r$
nullcline. In the present study, polymer elongation is also observed at similar locations at
 $Re=20$
, which supports the above explanation to the nearly immobile feature of the
 $r$
nullcline seen in figure 9(a–e). On the other hand, at
 $Re=50$
, the
 $\theta$
nullcline crosses the
 $r$
nullcline near the diagonal rather than near the midline in the transition between types (A) and (C), leading to the appearance of a pair of intersections near the diagonal (Yokoyama et al. Reference Yokoyama, Yamashita, Higashi, Miki, Itano and Sugihara-Seki2021). These intersections represent saddle points and the DEP is changed to be stable. Thus, at
 $Re=50$
, particles are predicted to focus on both the MEP and DEP (the type (G) focusing pattern). This focusing pattern is also consistent with the present experimental results at
 $Re\approx 50$
shown in figure 7.
In figure 9(a–e) the
 $r$
nullcline moves slightly closer to the channel centre with increasing
 $\phi$
. After vanishing the
 $\theta$
nullcline, however, the
 $r$
nullcline moves inward rather rapidly, as seen in figure 9(f–h). While the
 $r$
nullcline remains as a closed loop, a stable equilibrium position is the DEP (figure 9
f,
 $\phi =2.0$
wt %). This focusing pattern (type (C)) accords to the experiment for
 $\phi =2.0$
wt % shown in figure 5(e). As
 $\phi$
increases further, the
 $r$
nullcline continues to approach the channel centre, but closer to the centre along the midline than along the diagonal, as may be inferred from the
 $r$
-nullcline shape in figure 9(f) and
 $F_r$
curves in figures 8(a) and 8(b). Thus, after
 $F_r$
becomes negative near the channel centre, the region of
 $F_r\gt 0$
remains near the diagonals for a while (see the
 $F_r$
curve for
 $\phi =2.2$
wt % in the inset of figure 8
b), that appears as the formation of four small closed loops of the
 $F_r=0$
contour near the diagonals in figure 9(g). In this case,
 $F_r$
is negative in the whole cross-section except for inside these small loops. Along the diagonal,
 $F_r$
becomes zero at two locations near the channel centre, as already seen in figure 8(b). The particle focusing pattern in this case corresponds to type (D), in agreement with the experiment for
 $\phi =2.5$
wt % (figure 5
f). In the numerical simulation, we obtain the type (D) focusing pattern for slightly smaller
 $\phi$
(
 $=2.2$
wt %) and, for
 $\phi \geqslant 2.5$
wt %, the numerical simulation predicts that particles focus on the AEP (figure 9
h).
A rather rapid shrinkage of the
 $r$
nullcline with increasing
 $\phi$
(figure 9
e–g) can result from a larger increase in the inward lift due to
 $N_1$
compared with an increase in the wall-induced elastic lift, directed outward. In the case of low
 $\phi$
, these two lifts increase comparably so that the increments following an increase in
 $\phi$
balance near the
 $r$
nullcline (Yokoyama et al. Reference Yokoyama, Yamashita, Higashi, Miki, Itano and Sugihara-Seki2021). This leads to the nearly unmoving
 $r$
nullcline for low
 $\phi$
(figure 9
a–e). However, for larger
 $\phi$
, as the
 $r$
nullcline approaches the channel centre, i.e. away from the wall, the wall-induced elastic lift quickly decays and the inward lift due to
 $N_1$
becomes dominant. As a result, the
 $r$
nullcline approaches the channel centre rather rapidly in figure 9(e–g) as
 $\phi$
increases.
We note here that, in figure 9(f–h), there are tiny regions of outward lift near the corners, which become larger with increasing
 $\phi$
. Particles located in these regions are expected to approach the corner, implying the presence of the CEP. However, in the present experiments we have not observed such particles at
 $Re=20$
. One of the reasons is that the area of these regions is so small that few particles are located there. When the area becomes sufficiently large for larger
 $\phi$
and a certain number of particles enter there, particle focusing on the CEP could be observed experimentally. Another reason is that the corners of the cross-section of the channel experimentally used are rounded, rather than sharply angled, as seen in figure 2(b), so that lift acting on the particles located near the corner can be different from the numerical computation that assumes sharp corners.
The particle focusing patterns shown in figure 9 were obtained using the FENE-P model for
 $\kappa =0.15$
,
 $Re=20$
and
 $l=100$
with
 $\textit{El}$
and
 $\beta$
from table 1. These patterns can be compared with the numerical results in Yu et al. (Reference Yu, Wang, Lin and Hu2019), who adopted the Oldroyd-B model with
 $\kappa =0.15$
,
 $\widehat {Re}=1$
–
 $100$
,
 ${\textit{El}}=2\times 10^{-4}$
–
 $1$
and
 $\beta =0.5$
. Note that in the limit of the maximum polymer length
 $l\rightarrow \infty$
, the FENE-P model coincides with the Oldroyd-B model. At
 $\widehat {Re}=50$
(
 $Re\approx 24$
), figure 5 in their paper indicates that the focusing patterns obtained with the Oldroyd-B model are four points of the MEP at
 ${\textit{El}}=0.0002$
, four points of the DEP at
 ${\textit{El}}=0.005$
, four points of the DEP and four points of the CEP to give a total of eight points at
 ${\textit{El}}=0.01$
, and the AEP and four points of the CEP to give a total of five points at
 ${\textit{El}}=0.02$
. These focusing patterns are consistent with the present numerical results with comparable
 $\textit{El}$
at
 $Re=20$
such as in figures 9(b) (
 ${\textit{El}}=0.0003$
), 9(e) (
 ${\textit{El}}=0.0035$
), 9(f) (
 ${\textit{El}}=0.0079$
) and 9(h) (
 ${\textit{El}}=0.016$
), though the values of
 $\beta$
are smaller than 0.5 except for the case in figure 9(b) in the present computation. These similarities between the Oldroyd-B model and the FENE-P model are reasonable, considering the maximum
 $\textit{tr}( \unicode{x1D63E}\kern1.5pt)\ll l^2$
in the whole parameter range of the present study. Furthermore, the ratio
 ${W\hspace {-1pt}i}/l\leqslant 3.2\times 10^{-3}\ll 1$
(see table 1) also rationalises the similarities, as a recent study showed that for steady shear flow of the FENE-P model, the effect of finite extensibility of the polymer chains becomes significant when
 ${W\hspace {-1pt}i}/l\gtrapprox 1$
(Yamani & McKinley Reference Yamani and McKinley2023). However, there are some differences in the transition states; the bistable state of the DEP and MEP (type (G)) is obtained at
 ${\textit{El}}=0.001$
(figure 7 in Yu et al. Reference Yu, Wang, Lin and Hu2019) instead of the sole focusing on the IEP (type (B)) in the present study as shown in figure 9(c), and type (D) as shown in figure 9(g) is absent in their study. In these transition states, subtle differences of lifts resulting from the difference in parameter values or viscoelastic models could affect the
 $r$
nullcline and
 $\theta$
nullcline, which can change the particle focusing pattern.
The present experimental and numerical results indicate that the channel centre is unstable for
 ${\textit{El}}\lessapprox 0.01$
and it is stable for
 ${\textit{El}}\gtrapprox 0.01$
at low
 $\textit{Re}$
(figures 7–9). If the lift acting on the particle is expressed as the summation of the inertial lift
 $F_{Ir}$
and the fluid elasticity-induced lift
 $F_{Er}$
such as
 $F_r=F_{Ir}+F_{Er}$
, this result implies that
 $F_r\gt 0$
for
 ${\textit{El}}\lessapprox 0.01$
,
 $F_r\lt 0$
for
 ${\textit{El}}\gtrapprox 0.01$
and that
 $F_r=F_{Ir}+F_{Er}\approx 0$
at
 ${\textit{El}}=0.01$
near the channel centre. Note that
 $F_r\approx |\boldsymbol{F}|$
, since
 $F_\theta \approx 0$
near the centre (figure 8
c). According to Di Carlo et al. (Reference Di Carlo, Edd, Humphry, Stone and Toner2009), the inertial lift can be expressed in a dimensional form as
 \begin{equation} F_{Ir}^* = f_{{\kern-1pt}I}\kern-1pt\rho ^*U^{*2}d^{*2}\kappa = f_{{\kern-.5pt}I}\kern-.5pt\mu ^*U^*d^*Re_p {,} \end{equation}
where
 $f_I$
is a dimensionless function of the particle position. On the other hand, the radial component of the fluid elasticity-induced lift due to
 $N_1^*$
can be expressed in terms of a dimensionless coefficient
 $f_E$
as
 \begin{equation} F_{Er}^* = f_Ed^{*3}\frac {\partial N_1^*}{\partial r^*} \end{equation}
(Tehrani Reference Tehrani1996). Since
 $N_1^*=2\mu ^*(1-\beta )\lambda ^*\dot {\gamma }^{*2}$
for a Poiseuille flow of Boger fluids (James Reference James2009), we have
 \begin{equation} F_{Er}^* = f_{{\kern-.5pt}E}\mu ^*U^*d^*{W\hspace {-1pt}i}\kappa ^21024(1-\beta )\frac {r^*}{D^*} . \end{equation}
Then,
 $F_r^*=F_{Ir}^*+F_{Er}^*\approx 0$
leads to
 \begin{equation} F_r^* = \mu ^*U^*d^*Re_p\left [ f_I+1024f_E{\textit{El}}(1-\beta )\frac {r^*}{D^*} \right ] \approx 0 \end{equation}
near the channel centre. From the numerically obtained curve of
 $F_r$
on the diagonal for
 $\phi =0$
, the dash-dotted line in figure 8(b) gives
 $f_I=F_{Ir}^*/\rho ^*U^{*2}d^{*2}\kappa \approx 1.1r^*/D^*$
. Inserting
 ${\textit{El}}=0.01$
and
 $\beta =0.14$
(
 $\phi =2.2$
wt %) into (3.4), we have
 $f_E\approx -0.125$
. Thus, it is concluded that the fluid elasticity-induced lift near the channel centre is given by (3.3) with this value. Furthermore, if we rewrite (3.3) as
 \begin{equation} F_{Er}^* = \widetilde {f}_E\rho ^*U_{max}^{*2}d^{*2}\kappa {\textit{El}}(1-\beta )\frac {r^*}{D^*} \hspace {10pt}(\widetilde {f}_E\equiv 256f_E) , \end{equation}
then, comparison with (3.1) in Li et al. (Reference Li, McKinley and Ardekani2015) derived from Ho & Leal (Reference Ho and Leal1976) for a second-order fluid gives
 \begin{equation} \widetilde {f}_E = -\frac {40}{3}\pi . \end{equation}
The present value
 $\widetilde {f}_E=-32$
is comparable to (3.6). The slight difference is acceptable, considering that Ho & Leal (Reference Ho and Leal1976) treated a small particle in a 2-D shear flow.
Hitherto, the effect of the elasticity number
 $\textit{El}$
on particle focusing behaviour has mainly been studied. Here, the effect of the viscosity ratio
 $\beta$
is briefly considered. Figure 10 shows the lift map, equilibrium positions, nullclines and particle trajectories at various
 $\beta$
for
 ${\textit{El}}=0.0003$
and
 $0.0012$
. The cases of
 $\beta =0.7$
in figure 10(a) and
 $\beta =0.4$
in figure 10(b) represent those of
 $\phi =0.5$
wt % and 1.0 wt %, respectively (table 1). Figures 10(a) and 10(b) both indicate that, as
 $\beta$
decreases, the closed loop of the
 $\theta$
nullcline gradually shrinks, enhancing the effect of fluid elasticity. In figure 10(a) the stability of equilibrium positions is unchanged, whereas, in figure 10(b), stable equilibrium positions transition from the MEP, to the IEP and then the DEP, with decreasing
 $\beta$
. Thus, when
 $\phi$
increases, both increasing
 $\textit{El}$
and decreasing
 $\beta$
intensify the effect of fluid elasticity. It seems that
 $\textit{El}$
affects the migration behaviours more significantly than
 $\beta$
, as far as the parameter range examined, but
 $\beta$
could change the stability of equilibrium positions when close to the transition state, as shown in figure 10(b).
Effects of the viscosity ratio
 $\beta$
: numerical results of lifts, equilibrium positions,
 $r$
nullcline (solid lines),
 $\theta$
nullcline (dashed lines) and particle trajectories at
 $Re=20$
for (a)
 ${\textit{El}}=0.0003$
and (b)
 ${\textit{El}}=0.0012$
.

4. Conclusions
In the present study we have experimentally and numerically investigated the inertial migration of neutrally buoyant spherical particles in viscoelastic fluids flowing through square channels. In the experiments, using dilute aqueous solutions of PVP with various concentrations that have nearly constant viscosities irrespective of the shear rate, we measured the distribution of particles in downstream cross-sections for
 $\textit{Re}$
up to 100 and
 $\textit{El}$
up to 0.07 (or the PVP concentration up to 4 wt %) at
 $\kappa =0.15$
. Depending on
 $\textit{Re}$
and
 $\textit{El}$
(PVP concentration), there are a variety of particle focusing patterns and equilibrium positions. In addition to the MEP, DEP, CEP and AEP, this study demonstrates the presence of a new equilibrium position located at an intermediate position between the midline and the diagonal (IEP) and several types of multistable states of different equilibrium positions. As the fluid elasticity increases at a constant
 $\textit{Re}$
(
 $=20$
), the focusing positions of particles shift from the midline (MEP) to the diagonal (DEP) in the azimuthal direction first and then inward in the radial direction to the channel centre (AEP). The AEP becomes stable for
 ${\textit{El}}\gtrapprox 0.01$
. The present study is the first to experimentally substantiate the critical
 $\textit{Re}$
above which the AEP is stable. Numerical simulations based on the FENE-P model reproduced successfully these focusing patterns with the parameter values equal or close to the rheological measurements. To the best of the authors’ knowledge, such agreements between the numerical and experimental results have been rarely reported, because viscoelastic fluids generally have complex rheological properties and, thus, viscoelastic flows are substantially complicated. As far as the parameter range studied, the PVP solutions are well modelled by the FENE-P fluid with the elasticity number
 $\textit{El}$
and the viscosity ratio
 $\beta$
estimated from the rheological measurements. Quantitative comparison between the experimental and numerical results is further required, and it is our future work to evaluate the rheological properties of the PVP solutions in more detail and incorporate them into the numerical model, which is quite challenging (Dubief, Terrapon & Hof Reference Dubief, Terrapon and Hof2023). The present study shows that an increase in the PVP concentration intensifies the effect of fluid elasticity by increasing
 $\textit{El}$
and decreasing
 $\beta$
, and the transitions of particle focusing patterns can be accounted for by a competition between the inertial lift and the fluid elasticity-induced lift, which is composed of that due to
 $N_1$
, directed towards the lower shear, and the wall-induced elastic lift, generated by the elongation of polymers in the region between the particle and the channel wall. In particular, the experimentally observed stability of the AEP is well reproduced by numerical simulations, and based on this result, a quantitative expression of the elasticity-induced lift is presented near the channel centre. This study provides a concrete example showing that particle focusing in viscoelastic fluids can be well described by the lift due to the fluid elasticity when shear thinning and secondary flow are weak, and elucidating the effect of fluid elasticity on the suspended particle focusing presents the potential to understand the effects of shear thinning (thickening) and secondary flow by isolating the effect of fluid elasticity from complicated behaviours in viscoelastic fluids. It helps to disentangle the complex dynamics of the viscoelastic flows.
Supplementary material
Supplementary material is available at https://doi.org/10.1017/jfm.2025.10744.
Acknowledgements
The authors are grateful to Mr T. Nakata for his technical assistance with the experiment. The numerical computation was carried out using large-scale computer systems at Research Institute for Information Technology, Kyushu University, and at the Cybermedia Center, Osaka University. The viscosity of the PVP solutions was measured using a rheometer at ORIST (Osaka Research Institute of Industrial Science and Technology).
Funding
This research was partially supported by JSPS KAKENHI Grant Numbers JP20H02072 and JP24K00809.
Declaration of interests
The authors report no conflict of interest.