

1 Introduction
Shock wave/boundary-layer interaction (SWBLI) is a fundamental flow phenomenon that is observed in many practical situations (Chapman, Kuehn & Larson Reference Chapman, Kuehn and Larson1958; Babinsky & Harvey Reference Babinsky and Harvey2011). It has the potential to lead to serious problems for a hypersonic vehicle, including a loss of control authority, peaks in surface heat transfer and an adverse structural response induced by unsteadiness (Gaitonde Reference Gaitonde2015). Therefore, accurate predictions of SWBLI are of vital importance to the design of hypersonic systems.
SWBLI can be effectively studied with various canonical configurations, including compression ramps, shock impingement on flat plates, double wedges and double cones. Among these geometries, a double cone is regarded as an important building block that has been extensively investigated by means of experimental and numerical techniques. In fact, a remarkable number of different flow phenomena can occur in double-cone flows, including shock interactions, boundary-layer separation, shear-layer instabilities and Görtler-like vortices, depending upon the flow conditions, which can be further complicated by real gas effects at high enthalpies.
Over the past two decades, a series of double-cone experiments has been conducted in the LENS I reflected shock tunnel and LENS XX expansion tunnel at the Calspan University of Buffalo Research Center over a range of Mach and Reynolds numbers and total enthalpies in air, nitrogen and oxygen (Holden & Wadhams Reference Holden and Wadhams2003; Holden, Wadhams & Maclean Reference Holden, Wadhams and Maclean2008; Holden et al. Reference Holden, Wadhams, Maclean and Dufrene2015). Surface pressure and heat flux measurements were obtained. These experiments have been widely used for computational fluid dynamic (CFD) code validation. Numerical simulations were presented by Gaitonde, Canupp & Holden (Reference Gaitonde, Canupp and Holden2002), Nompelis, Candler & Holden (Reference Nompelis, Candler and Holden2003), Druguet, Candler & Nompelis (Reference Druguet, Candler and Nompelis2005), Knight et al. (Reference Knight, Longo, Drikakis, Gaitonde, Lani, Nompelis, Reimann and Walpot2012), Hao, Wang & Lee (Reference Hao, Wang and Lee2017) and Tumuklu, Theofilis & Levin (Reference Tumuklu, Theofilis and Levin2018). In these studies, good agreement with the experimental data was obtained for low- to moderate-enthalpy flows without evident molecular dissociation, whereas large discrepancies were found at high enthalpies in the presence of significant thermochemical non-equilibrium. For some cases at relatively large Reynolds numbers, numerical simulations predicted unsteady flows (Knight et al. Reference Knight, Longo, Drikakis, Gaitonde, Lani, Nompelis, Reimann and Walpot2012), in contrast to the experiments in which the flow fields were observed to be steady. Currently, the causes of these discrepancies are still not fully clarified, which indicates that many aspects of hypersonic double-cone flows remain to be understood.
In most investigations of hypersonic double-cone flows, the first cone has a sharp nose. For practical applications, the leading-edge regions of hypersonic vehicles are generally blunted to reduce aerodynamic heating. It is therefore of interest to understand how the double-cone flows are influenced by leading-edge bluntness. However, there have been few studies addressing this problem. Experimentally, Holden (Reference Holden2000) found that with a large nose radius, the separation region stretched from the nose region of the first cone to the shoulder of the second cone. In contrast, a well-defined region of attached flow on both cone surfaces was obtained for smaller nose radii. Until now, the underlying physical mechanisms have remained unclear.
In the literature, the effects of leading-edge bluntness on SWBLI have been studied for hypersonic compression ramp flows and shock impingement on a flat plate. In the theoretical and experimental studies of Holden (Reference Holden1970, Reference Holden1971) for hypersonic compression ramp flows, it was found that the separation region length first increased with increasing nose radius and then decreased. Similar trends were also observed in the numerical simulations of John & Kulkarni (Reference John and Kulkarni2014). The critical radius corresponding to the maximum extent of separation was shown to be associated with the transition of the entropy layer swallowing position from the undisturbed region upstream of separation to the interaction region. A similar trend was found for the hypersonic separated flow induced by an impinging shock on a flat plate (Borovoy et al. Reference Borovoy, Egorov, Skuratov and Struminskaya2013; Sriram et al. Reference Sriram, Srinath, Devaraj and Jagadeesh2016). Chuvakhov et al. (Reference Chuvakhov, Borovoy, Egorov, Radchenko, Olivier and Roghelia2017) found that both the maximum Stanton numbers in the reattachment region and the amplitude of spanwise oscillations of the Stanton number induced by Görtler-like vortices decreased significantly with small leading-edge bluntness. Recently, Khraibut, Gai & Neely (Reference Khraibut, Gai and Neely2019) investigated the effect of bluntness on hypersonic laminar leading-edge separation and found that a large nose radius increased the size of the separation region.
In this study, hypersonic flows over a canonical  $25{-}55^{\circ }$ double-cone configuration with various nose radii are numerically simulated to investigate the influence of leading-edge bluntness. This paper is organized as follows. The geometric configuration and flow conditions are presented in § 2, followed by a description of the physical models and numerical methods in § 3. In § 4, the effect of leading-edge bluntness on hypersonic double-cone flows is demonstrated. The numerical data are then analysed and interpreted in terms of the triple-deck formulation to explain the observed flow phenomena. Next, real gas effects are examined with additional simulations at a higher total enthalpy. A comparison with existing experimental data is also made. Finally, conclusions are given in § 5.
2 Geometric configuration and flow conditions
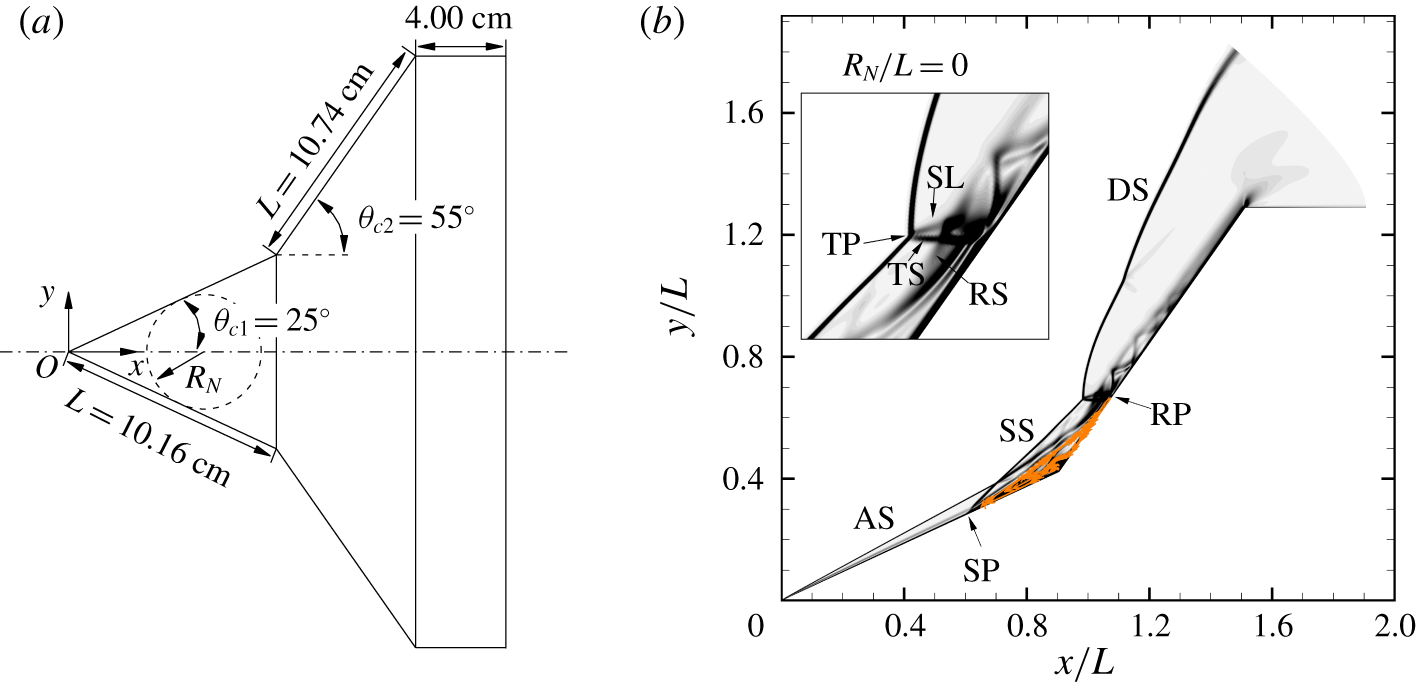
The sharp double-cone geometry, as illustrated in figure 1(a), has two equal-length conical sections  $(L=10.16~\text{cm})$ with semi-angles of 25 and
 $55^{\circ }$. The geometric configuration replicates the experimental model tested in the LENS I and LENS XX tunnels. Leading-edge radii considered in this study range from 0.254 to 4.738 cm
 $(0.025\leqslant R_{N}/L\leqslant 0.466)$. Note that the upper limit corresponds to the largest allowable radius such that the point of tangency of the spherical nose and the first cone is located at the hinge (i.e. the junction of the first and second cone surfaces). The coordinate system is constructed with the origin located at the nose of the sharp double cone, the
 $x$-axis coincident with the cone axis and the
 $y$-axis pointing in the radial direction.
Figure 1(b) shows the flow structure over the sharp double-cone configuration. The attached shock (AS) emanating from the leading edge of the first cone interacts with the detached shock (DS) induced by the second cone at the triple point (TP) to form a transmitted shock (TS) and a slip line (SL). The TS impinges on the surface and creates a strong adverse pressure gradient and results in a separated flow region. Beneath the primary vortex, a secondary bubble can be observed. The separation region further induces a separation shock (SS) and a reattachment shock (RS), which in turn alter the location of the TP and the strength of shock interaction. Downstream of the shock impingement point, an underexpanded supersonic jet with a series of compression and expansion waves develops between the SL and the second cone. Essentially, the flow structure resembles Edney’s type IV shock interaction (Edney Reference Edney1968; Olejniczak, Wright & Candler Reference Olejniczak, Wright and Candler1997).
The free-stream conditions taken from an ongoing blunted double-cone experimental study of Holden et al. (Reference Holden, Wadhams, Maclean, Dufrene and Carr2018) are given as follows:  $u_{\infty }=3000~\text{m}~\text{s}^{-1}$,
 $\unicode[STIX]{x1D70C}_{\infty }=0.75\times 10^{-3}~\text{kg}~\text{m}^{-3}$, and
 $T_{\infty }=230~\text{K}$. The test gas is air in the thermochemical equilibrium state. The mass fractions of
 $\text{N}_{2}$ and
 $\text{O}_{2}$ are 0.765 and 0.235, respectively. These conditions correspond to a Mach number of 9.87 and a unit Reynolds number of
 $1.5\times 10^{5}~\text{m}^{-1}$. Fully laminar flows are expected based on the relatively low Reynolds number (e.g.
 $Re_{L}=1.524\times 10^{4}$). The surface is assumed to be non-catalytic with a fixed temperature at 300 K. Due to the relatively low total enthalpy of
 $h_{0}=5~\text{MJ}~\text{kg}^{-1}$, air chemistry is expected to be insignificant; however, it is still critical to account for the effect of vibrational relaxation. In fact, Hao & Wen (Reference Hao and Wen2018a) demonstrated that assuming a vibrationally frozen flow led to a substantial increase in the length of the separation region for a double-cone flow at
 $5~\text{MJ}~\text{kg}^{-1}$. In addition, real gas effects will be examined through additional simulations by elevating
 $u_{\infty }$ and
 $T_{\infty }$ such that
 $h_{0}$ is increased to
 $13~\text{MJ}~\text{kg}^{-1}$ without changing
 $Re_{L}$.
(a) Schematic of the double-cone configuration with leading-edge bluntness. The spherical nose is tangent to the first cone. (b) Schematic of the flow structure over the sharp double-cone configuration (baseline case). AS: attached shock; DS: detached shock; SS: separation shock; RS: reattachment shock; TS: transmitted shock; SL: slip line; SP: separation point; RP: reattachment point; TP: triple point.

3 Computational details
3.1 Physical models
In this study, a two-temperature model is used to consider thermochemical non-equilibrium effects. It is assumed that the translational and rotational energy modes are in equilibrium, corresponding to a translational–rotational temperature  $T_{tr}$. The vibrational energy of molecules and the electronic excitation energy are described by a vibrational–electronic temperature
 $T_{ve}$. The harmonic oscillator model is used to evaluate the vibrational energy, and only the first two levels are considered for the electronic energy. The vibrational–electronic energy of the mixture can be evaluated by
 $$\begin{eqnarray}e_{ve}=\mathop{\sum }_{s=mol}\frac{R_{s}\unicode[STIX]{x1D703}_{v,s}}{\exp (\unicode[STIX]{x1D703}_{v,s}/T_{ve})-1}+\mathop{\sum }_{s}\frac{g_{1,s}R_{s}\unicode[STIX]{x1D703}_{e,s}}{g_{0,s}\exp (\unicode[STIX]{x1D703}_{e,s}/T_{ve})+g_{1,s}},\end{eqnarray}$$
where mol denotes molecular species,  $R_{s}$ is the species gas constant,
 $\unicode[STIX]{x1D703}_{v,s}$ and
 $\unicode[STIX]{x1D703}_{e,s}$ are the characteristic vibrational and electronic temperature of species
 $s$ and
 $g_{0,s}$ and
 $g_{1,s}$ are the degeneracies of the ground and first electronic levels of species
 $s$.
Park’s 1990 chemical reaction model (Park Reference Park1990), including five neutral species (N, O,  $\text{N}_{2}$,
 $\text{O}_{2}$, NO), is used to obtain the equilibrium rate coefficients. The energy transfer between the translational mode of heavy particles and the vibrational mode of molecules is modelled using the Landau–Teller formulation (Vincenti & Kruger Reference Vincenti and Kruger1965). The vibrational relaxation times are calculated via the Millikan & White (Reference Millikan and White1963) expression with the parameters given by Hash et al. (Reference Hash, Olejniczak, Wright, Prabhu, Pulsonetti, Hollis, Gnoffo, Barnhardt, Nompelis and Candler2007). Park’s high-temperature correction (Park Reference Park1990) is also introduced to avoid the underprediction of the relaxation times at high temperatures. To consider the vibration–dissociation coupling effects, the geometry average of
 $T_{tr}$ and
 $T_{ve}$ with
 $1/2$ power is taken as the controlling temperature for dissociation reactions induced by heavy particle impacts. The non-preferential model (Gnoffo, Gupta & Shinn Reference Gnoffo, Gupta and Shinn1989) is employed to calculate the added or removed vibrational energy due to recombination and dissociation, which assumes that molecules are created or destroyed at the average vibrational energy.
The viscous stresses are modelled assuming a Newtonian fluid with Stokes’ hypothesis. Heat fluxes are calculated using Fourier’s law for all the energy modes. The species mass diffusion fluxes are modelled according to the modified Fick’s law (Sutton & Gnoffo Reference Sutton and Gnoffo1998) to ensure that the sum of diffusion fluxes is zero. The transport properties of the gas mixture are calculated using Gupta’s mixing rule (Gupta et al. Reference Gupta, Yos, Thompson and Lee1990) with the collision integral data given by Wright et al. (Reference Wright, Bose, Palmer and Levin2005).
3.2 Numerical methods
The numerical simulations in this study are performed using a multi-block parallel finite-volume CFD code called PHAROS (Hao, Wang & Lee Reference Hao, Wang and Lee2016), which has been successfully applied to thermochemical non-equilibrium flows over capsule, double-cone, hollow-cylinder/flare and double-wedge configurations (Hao, Wang & Lee Reference Hao, Wang and Lee2018; Hao & Wen Reference Hao and Wen2018b; Hao, Wen & Wang Reference Hao, Wen and Wang2019).
The inviscid fluxes are calculated using the modified Steger–Warming scheme (MacCormack Reference MacCormack2014), which can capture strong shocks stably while maintaining sufficient viscous resolution in boundary layers. The scheme is then extended to a higher order by the monotone upstream-centred schemes for conservation law reconstruction (van Leer Reference van Leer1979). The viscous fluxes are calculated using a second-order central difference. An implicit line relaxation method (Wright, Candler & Bose Reference Wright, Candler and Bose1998) is utilized for time integration.
The flows are assumed to be axisymmetric, which means that the formation of streamwise vortices in the separation region and near the reattachment point due to intrinsic and Görtler instabilities (Sidharth et al. Reference Sidharth, Dwivedi, Candler and Nichols2018) is beyond the scope of this study. Flow bifurcation into three-dimensional structures will be addressed in the future.
Computational meshes are constructed with 1024 and 512 nodes in the axial and radial directions, respectively. Hao et al. (Reference Hao, Wang and Lee2017) provided a complete description of the grid-independence study for the double-cone simulations. The normal spacing at the surfaces is set to  $1\times 10^{-7}~\text{m}$ to ensure that the grid Reynolds number has an order of magnitude of one. The simulations in the present study are run with a constant Courant–Friedrichs–Lewy number equal to
 $10^{3}$. Convergence is attained under the criteria that the
 $\text{L}_{2}$ norm of the density residual achieves an eight orders of magnitude reduction, and surface pressure and heat flux distributions remain unchanged. All the simulations are initialized using the free-stream conditions. Additional time-accurate simulations with different initialization methods were also performed to ensure that there was no dual state near the critical nose radius.
4 Results and discussion
4.1 Effect of leading-edge bluntness
The evolution of the flow structures with different nose radii can be seen from the contours of the density gradient magnitude as plotted in figure 2. The sharp double-cone result is also shown here as a reference. One can readily determine the extent of the separation region from the roots of SS and RS and the shear layer bridging the separation and reattachment points. The shock structure and the size of the separation region remain largely unchanged for  $R_{N}/L<0.1$. For
 $R_{N}/L=0.1$, the separation region is significantly enlarged such that the separation point is shifted close to the nose region. Meanwhile, the reattachment point is pushed downstream towards the expansion corner. As the nose radius is further increased, the flow structure is similar to that for
 $R_{N}/L=0.1$. The separation point starts to move downstream in accordance with the movement of the juncture of the spherical nose and the first cone, while the reattachment point moves upstream. Eventually, for the limiting case (i.e.
 $R_{N}/L=0.466$), the shock interaction has become so weak that one can hardly distinguish the TS from the numerical schlieren image.
Numerical schlieren images of flow over spherically blunted double cones with  $R_{N}/L=0$, 0.05, 0.075, 0.1, 0.125, 0.2, 0.25, 0.35 and 0.466. The separation and reattachment points are marked with arrows.

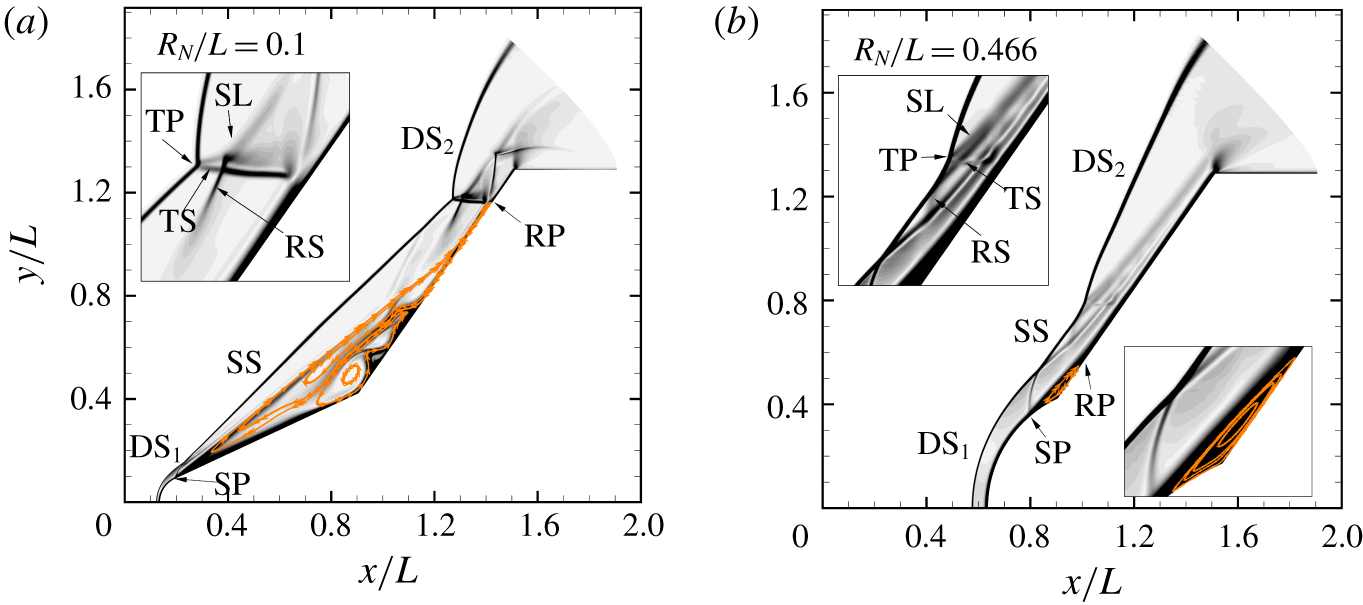
To closely examine the flow structures over the spherically blunted double cones, detailed numerical schlieren images with streamlines superimposed for two typical cases are shown in figure 3. For  $R_{N}/L=0.1$, a detached shock
 $(\text{DS}_{1})$ is formed in front of the blunted nose, which interacts with the shock induced by the separation region to generate a SS. Since the separation point is very close to the nose region, the SS and
 $\text{DS}_{2}$ induced by the second cone intersect at a higher location compared with that in the sharp double-cone case, causing the reattachment point to move downstream. Nevertheless, the shock structure still resembles Edney’s type IV interaction. Inside the separation region, there are multiple separation bubbles. For
 $R_{N}/L=0.466$, the separation bubble located in the vicinity of the hinge has become smaller than that for the baseline case. In this circumstance, the SS is joined by an RS before interacting with the
 $\text{DS}_{2}$.
Detailed numerical schlieren images with streamlines superimposed for (a)  $R_{N}/L=0.1$ and (b)
 $R_{N}/L=0.466$.

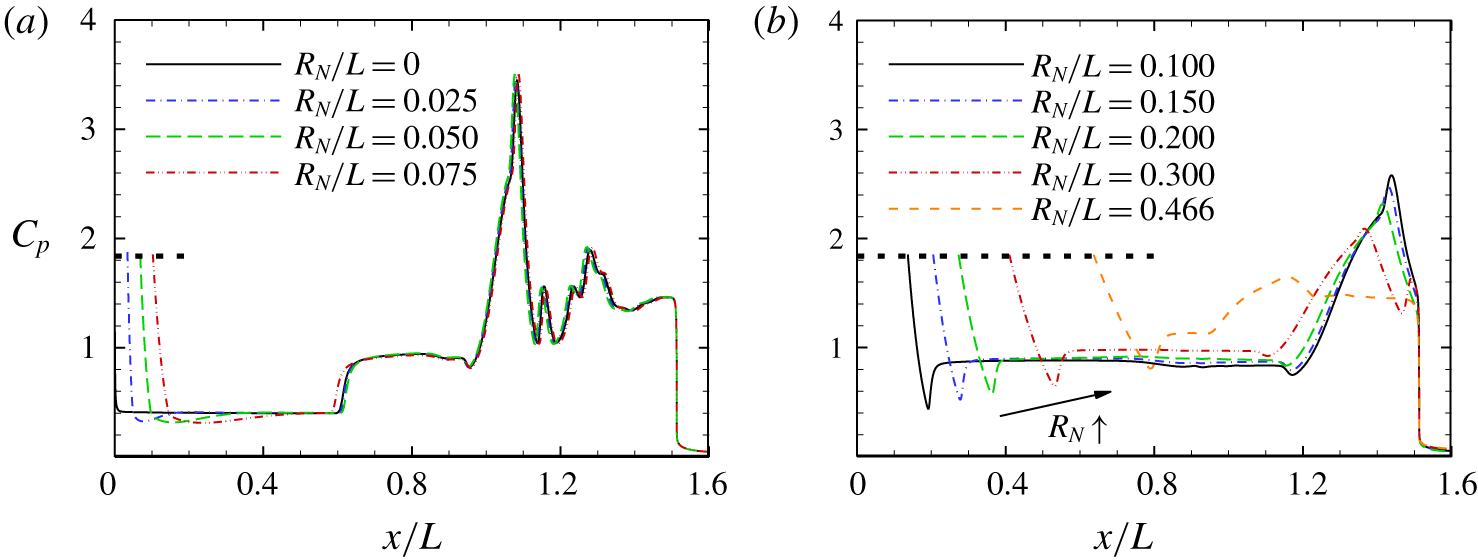
The effect of leading-edge bluntness on the surface pressure coefficient is shown in figure 4. The horizontal dashed lines denote the stagnation value behind a normal shock at the free-stream Mach number calculated using the Rayleigh pitot tube formula (Anderson Reference Anderson2006). The computed stagnation pressures for different nose radii under consideration agree well with the theoretical results. For clarity, the distributions for the nose radii below and above the critical value are plotted separately.
For the sharp double cone, the surface pressure drops rapidly downstream of the leading edge and approaches a constant value corresponding to the conical solution. The sudden rise in pressure near  $x/L=0.6$ indicates the beginning of flow separation. After separation, the pressure enters a plateau and then reaches the peak associated with the impingement of TS on the second cone. There is a ‘dip’ between the plateau and the peak, which is caused by the secondary separation bubble near the hinge (see figure 1b). Similar distributions have been observed and reported by Smith & Khorrami (Reference Smith and Khorrami1991), Korolev, Gajjar & Ruban (Reference Korolev, Gajjar and Ruban2002) and Khraibut et al. (Reference Khraibut, Gai, Brown and Neely2017) for SWBLI over various configurations. Downstream of the peak, the pressure decreases and oscillates on the second cone as a consequence of the compression and expansion waves developing in the supersonic jet.
Regarding relatively small bluntness (i.e.  $R_{N}/L<0.1$), the pressure distributions are quite close to the baseline result downstream of the nose region. On the first cone prior to separation, a region where the pressure is lower than the cone value can be observed. This is caused by the pressure overexpansion near the juncture of the spherical nose and the first cone, which is typical in supersonic flows over a spherically blunted cone (Blick & Francis Reference Blick and Francis1966). As the nose radius is increased, the location at which the pressure recovers from the overexpanded value to the conical pressure moves downstream.
For  $R_{N}/L=0.1$, the extent of the pressure plateau dramatically expands as expected due to the sudden increase of the separation bubble. The location of the peak pressure also moves downstream in accordance with the shift of TS (see figure 2). Meanwhile, the peak value is significantly reduced by 26.6 % because of weakened shock interaction. As the nose radius is further increased, the extent of the pressure plateau starts to decrease, accompanied by a slightly increasing plateau magnitude. Correspondingly, the peak location moves upstream with a reduction in its value.
Effect of leading-edge bluntness on the surface pressure coefficient for (a)  $R_{N}/L<0.1$ and (b)
 $R_{N}/L\geqslant 0.1$. The horizontal dashed lines indicate the stagnation value behind a normal shock calculated using the Rayleigh pitot tube formula (Anderson Reference Anderson2006).

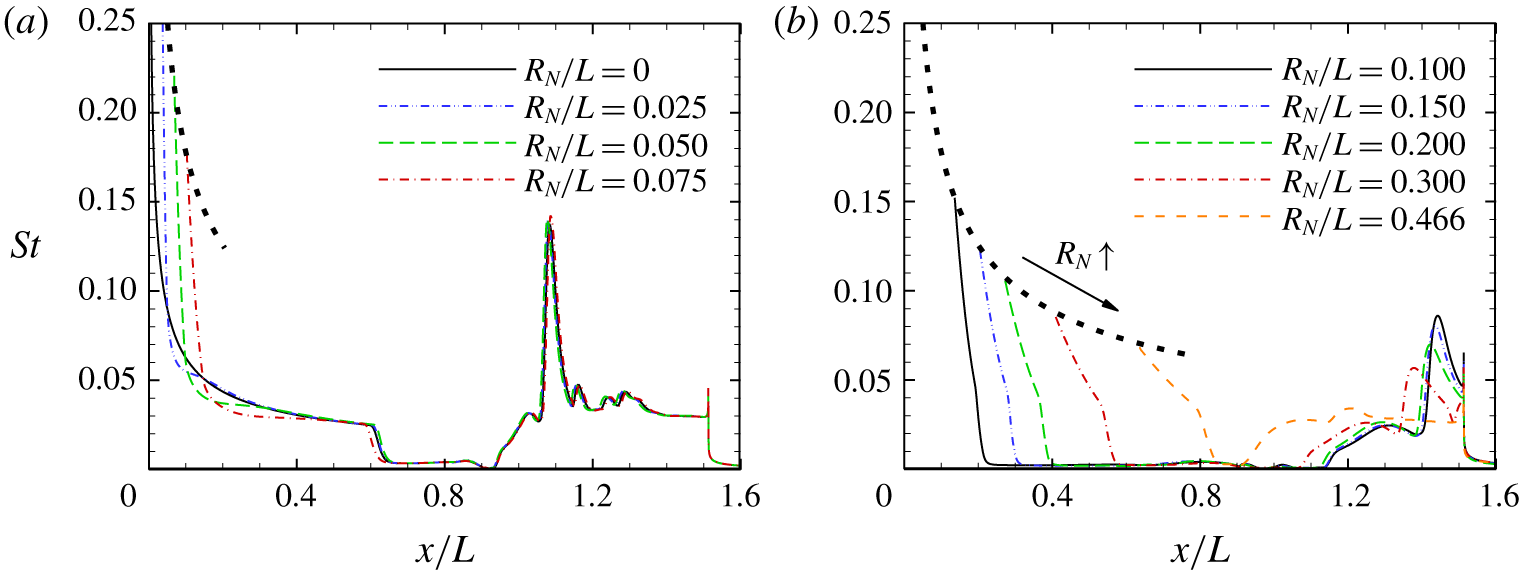
Figure 5 shows the non-dimensional surface heat flux distributions for different nose radii in terms of the Stanton number, defined as  $St=q_{w}/0.5\unicode[STIX]{x1D70C}_{\infty }u_{\infty }^{3}$, where
 $q_{w}$ is the convective heat flux at the wall combining the contributions from all the internal energy modes. As predicted by the self-similar theory (Anderson Reference Anderson2006), the stagnation heat flux varies inversely with the square root of the nose radius. The dashed curves are plotted accordingly, with
 $St$ varying inversely with
 $R_{N}^{1/2}$. The computed stagnation heating values are approximately located on the dashed curves, indicating the accuracy of current simulations. Again, the results are similar for cases with small leading-edge bluntness. The sudden drop in surface heating on the first cone is associated with flow separation, and the peak heating is due to shock impingement. Across the critical nose radius, the length of the separation region is significantly increased, and the peak heat flux on the second cone is reduced by 39.5 %.
Effect of leading-edge bluntness on surface Stanton number for (a)  $R_{N}/L<0.1$ and (b)
 $R_{N}/L\geqslant 0.1$. The dashed curves vary inversely with the square root of the nose radius.

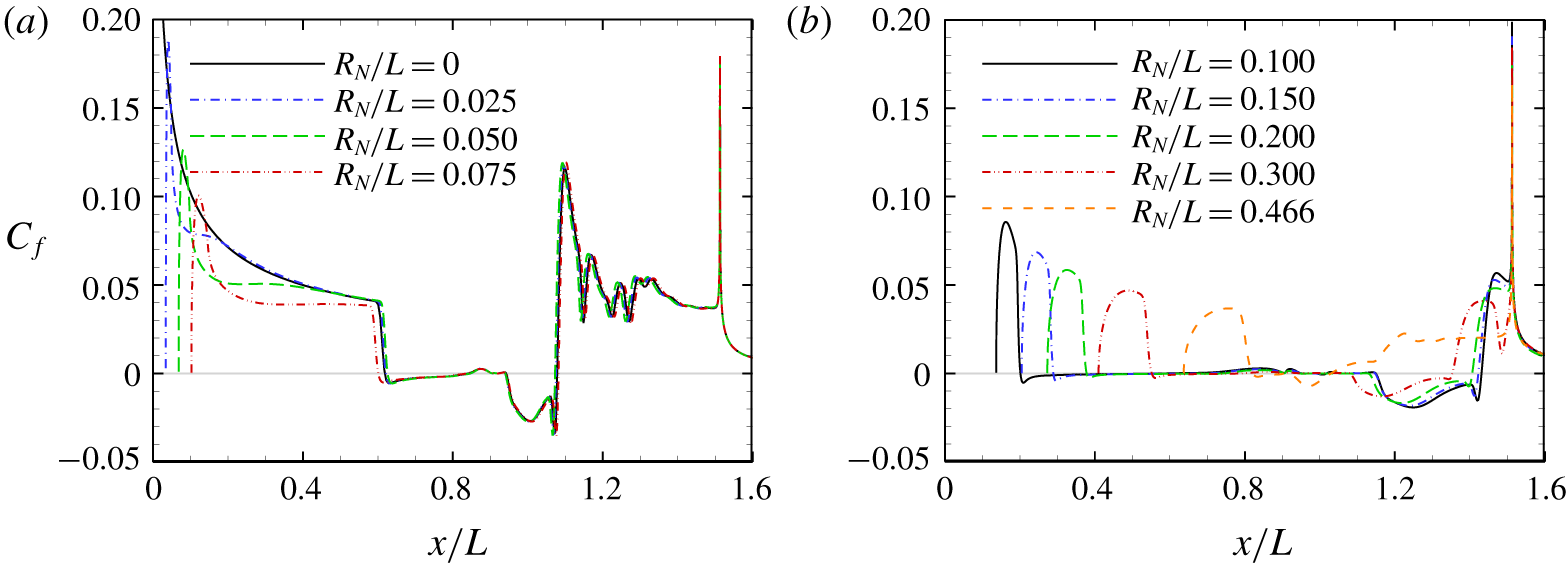
The distributions of skin friction coefficients defined as  $C_{f}=\unicode[STIX]{x1D70F}_{w}/0.5\unicode[STIX]{x1D70C}_{\infty }u_{\infty }^{2}$ are shown in figure 6 for different nose radii. The locations of the separation and reattachment points can be determined by the points at which the skin friction crosses zero. For relatively small bluntness (i.e.
 $R_{N}/L<0.1$), a significant reduction in skin friction can be observed on the first cone, which is caused by the entropy layer swallowing and the pressure overexpansion. The separation region dramatically grows for
 $R_{N}/L=0.1$ and decreases as the nose radius is further increased.
Effect of leading-edge bluntness on skin friction coefficient for (a)  $R_{N}/L<0.1$ and (b)
 $R_{N}/L\geqslant 0.1$. The horizontal lines denote
 $C_{f}=0$.

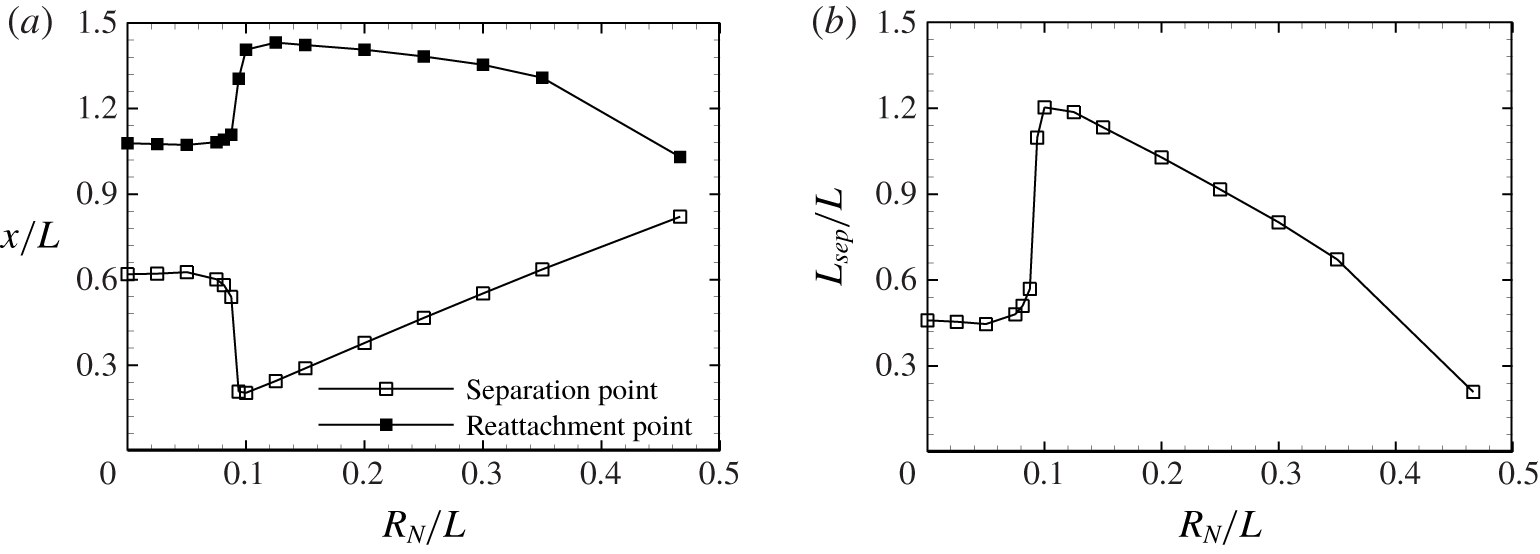
Figure 7(a) presents the locations of the separation and reattachment points for different nose radii. For small leading-edge bluntness, the locations are almost unchanged. Across a critical value between  $R_{N}/L=0.075$ and 0.1, the separation point suddenly moves upstream, while the reattachment point moves downstream. Then, the location of the separation point
 $(x_{sep})$ varies linearly with the nose radii, whereas the variation of the reattachment point
 $(x_{reatt})$ is nonlinear due to the curvature of
 $\text{DS}_{2}$. The effect of leading-edge bluntness on the length of the separation region, defined as the axial distance between the separation and reattachment points
 $(L_{sep}=x_{reatt}-x_{sep})$, is further shown in figure 7(b). Clearly, there is a critical value between
 $R_{N}/L=0.075$ and 0.1, across which the length of the separation region is increased by a factor of 2.6. Three additional cases are further considered to narrow down the critical nose radius to
 $0.0875<R_{N}/L<0.09375$. One can also see that beyond a certain nose radius, the separation region is smaller than the baseline result.
Effect of leading-edge bluntness on (a) locations of separation and reattachment points and (b) length of separation region.

4.2 Scaling of the length of the separation region
To understand the behaviour of the separation region length with increasing leading-edge bluntness, the numerical data are expressed in terms of the triple-deck formulation developed by Davis & Sturtevant (Reference Davis and Sturtevant2000) for hypersonic double-wedge flows. According to Neiland (Reference Neiland1969) and Stewartson & Williams (Reference Stewartson and Williams1969), the boundary layers upstream of and through the separation can be divided into three decks, including a viscous lower deck, an inviscid and rotational middle deck and an inviscid and irrotational upper deck. The flow structure downstream of separation was later described by five decks, where the lower deck prior to separation became a thin incompressible layer containing the dividing streamline (Neiland Reference Neiland1971; Stewartson & Williams Reference Stewartson and Williams1973). Then, the velocity in the shear layer was expressed using the flow at separation. Based on a momentum balance between shear forces acting on the dividing streamline and the pressure at reattachment, a linear relationship between the length of the separation region and reattachment pressure ratio can be established as
 $$\begin{eqnarray}L_{sep}\propto \left(\frac{\unicode[STIX]{x1D707}_{w}T_{w}^{1/2}}{\unicode[STIX]{x1D70F}_{w}^{2}}\right)_{\!1}\frac{(p_{3}-p_{2})^{3/2}}{p_{1}^{1/2}},\end{eqnarray}$$
where subscript  $w$ denotes quantities at the wall of the model,
 $\unicode[STIX]{x1D70F}_{w}$ and
 $p_{1}$ are the surface shear stress and pressure evaluated upstream of the separation, respectively,
 $p_{2}$ is the pressure behind the separation shock and
 $p_{3}$ is the reattachment pressure. Given that the wall temperature is set to a constant value and the viscosity is largely determined by the wall temperature without significant chemical reaction, the length of the separation region is inversely proportional to the square of
 $\unicode[STIX]{x1D70F}_{w}$ upstream of separation.
Under the assumption of a compressible Blasius solution, the following equation was obtained by Davis & Sturtevant (Reference Davis and Sturtevant2000)
 $$\begin{eqnarray}\frac{L_{sep}}{x_{1}}\propto \left(\frac{\unicode[STIX]{x1D6EC}}{\unicode[STIX]{x1D6FE}^{3/2}M^{3}}\right)_{\!1}\left(\frac{p_{3}-p_{2}}{p_{1}}\right)^{3/2},\end{eqnarray}$$
where  $\unicode[STIX]{x1D6FE}$ and
 $M$ are the specific heat ratio and incoming Mach number upstream of separation, respectively;
 $\unicode[STIX]{x1D6EC}$ describes the effect of the wall-to-edge temperature ratio on skin friction,
 $$\begin{eqnarray}\unicode[STIX]{x1D6EC}=\left(\frac{\unicode[STIX]{x1D707}_{w}}{\unicode[STIX]{x1D707}^{\ast }}\right)\left(\frac{T^{\ast }}{T_{e}}\right)\left(\frac{T_{w}}{T_{e}}\right)^{1/2},\end{eqnarray}$$
where subscripts  $e$ and
 $\ast$ denote quantities at the edge of the boundary layer and those evaluated at a reference temperature. As demonstrated by Swantek (Reference Swantek2012), this relationship also holds for hypersonic double-cone flows. However, due to the non-uniformity of supersonic flows over a cone and the vorticity interaction between the entropy layer and the boundary layer, it is cumbersome to determine the edge of the boundary layer. Instead, the quantities immediately behind the shock are used here.
According to the scaling in (4.2), mechanisms for the behaviours occurring from  $R_{N}/L=0$ to 0.1 can be divided into those arising upstream and downstream of separation. Note that the reattachment pressure is mainly determined by an inviscid dynamics. As long as the shock strength is unchanged,
 $p_{3}$ would be unaffected. Hence, one can speculate that the dominant mechanism stems from the upstream influence. In this section, a number of hypersonic flows over spherically blunted cones (i.e. only the first cone) with
 $R_{N}/L$ ranging from 0.025 to 0.1 are performed. The flow profiles normal to the surface at a specific location
 $x/L=0.619$ corresponding to the separation point for the baseline case are extracted to evaluate the upstream influence.
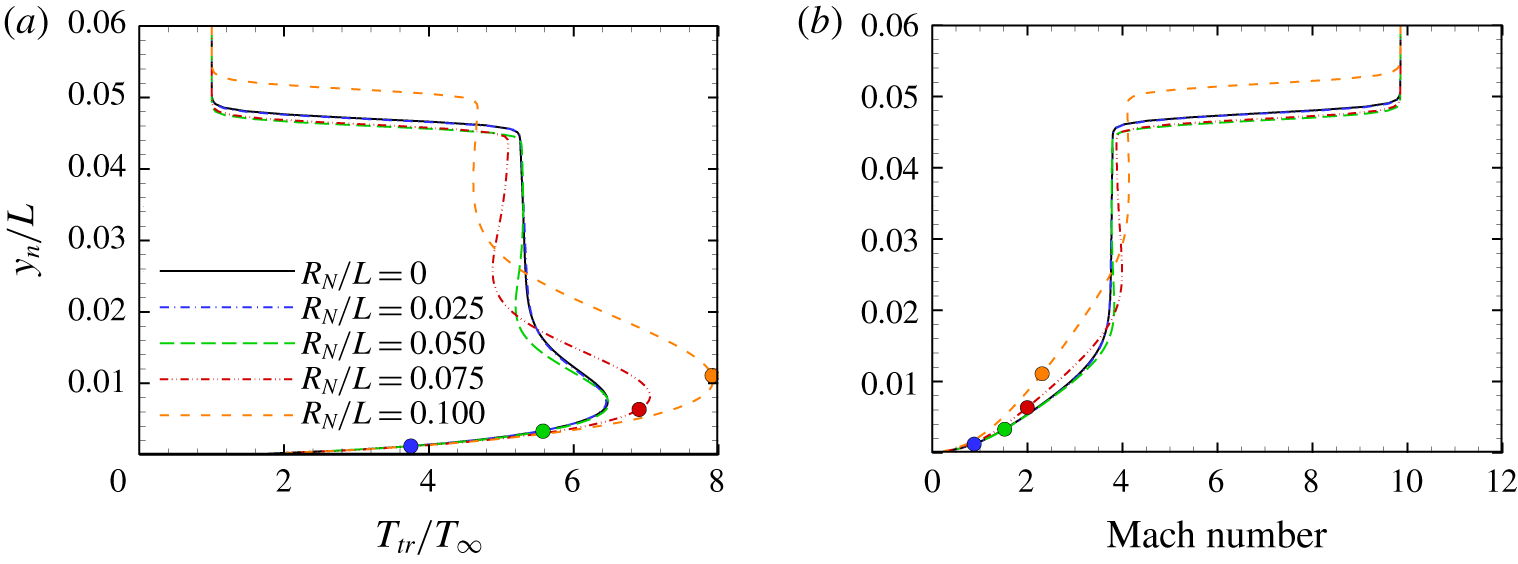
Figure 8(a) shows the wall-normal distributions of the translational–rotational temperature at  $x/L=0.619$ for different nose radii. The sharp-cone result is also plotted. As the nose radius is increased, two major features can be identified. First, the temperature peak due to viscous dissipation is elevated, which is caused by the entropy layer swallowing by the boundary layer. If the entropy layer thickness is sufficiently large, the properties both at the edge and within the boundary layer would be altered. Here, the entropy layer thicknesses are denoted by the coloured circles. The entropy layer is determined as the streamline passing through the point on the bow shock at a height equal to the nose radius. Evidently, the temperature peak is influenced by the high-temperature fluid in the entropy layer, which has passed across the stronger portion of
 $\text{DS}_{1}$. Second, the shock strength is weakened. This is another typical feature occurring in supersonic flows over spherically blunted cones. In fact, the strength of
 $\text{DS}_{1}$ is weakened by the expansion wave emanating from the overexpanded region (see figure 4). The wall-normal distributions of the Mach number at
 $x/L=0.619$ for different nose radii are plotted in figure 8(b). For a large nose radius, the Mach number outside the boundary layer is increased due to shock weakening. Meanwhile, the Mach number in the boundary layer is reduced by the entropy layer interaction.
Wall-normal distributions at  $x/L=0.619$ obtained from spherically blunted cone simulations with different nose radii: (a) translational–rotational temperature and (b) Mach number. The corresponding entropy layer thickness for each nose radius is denoted by a different coloured circle.

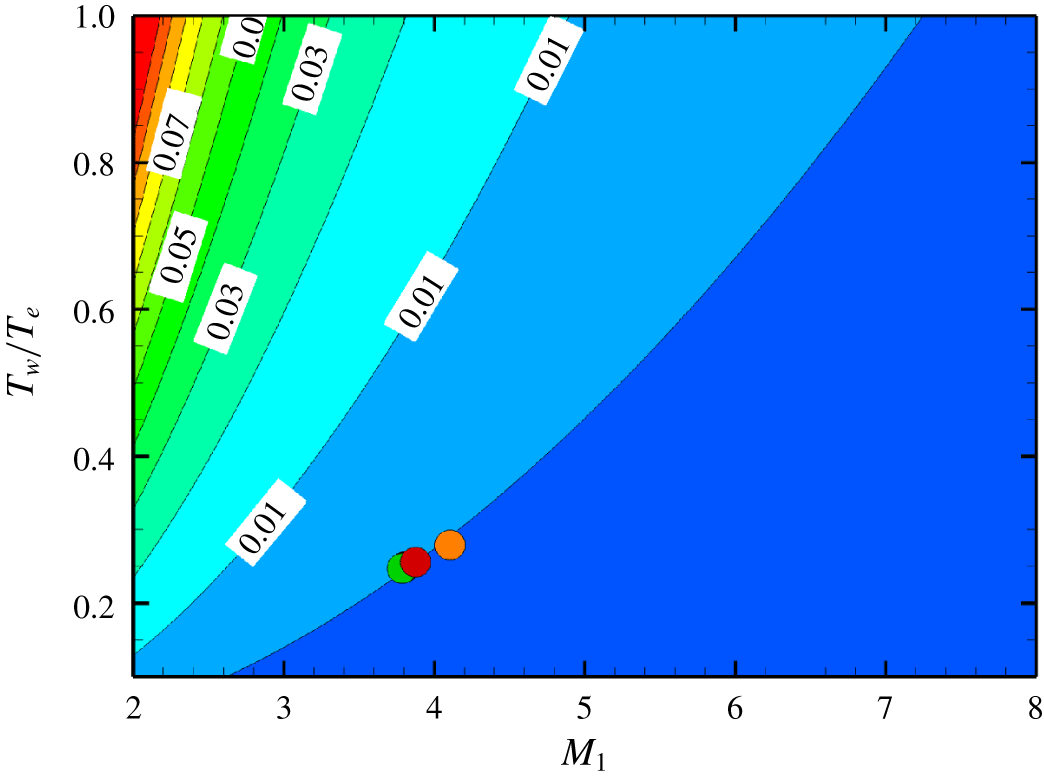
With the obtained flow quantities, the upstream influence can be evaluated. Figure 9 shows the contour of the combined scaling factor  $\unicode[STIX]{x1D6EC}_{1}/M_{1}^{3}$ in (4.2) as a function of Mach number and wall-to-edge temperature ratio. Interestingly, all the circles corresponding to different nose radii are approximately located on an isoline, which indicates that the change in shock strength has little effect on the scaling factor. However, one must note that (4.2) assumes a compressible Blasius solution, such that the influence of the entropy layer swallowing and the pressure overexpansion on the skin friction cannot be reflected.
Contour of the combined scaling factor  $\unicode[STIX]{x1D6EC}_{1}/M_{1}^{3}$ as a function of the wall-to-edge temperature ratio and Mach number.

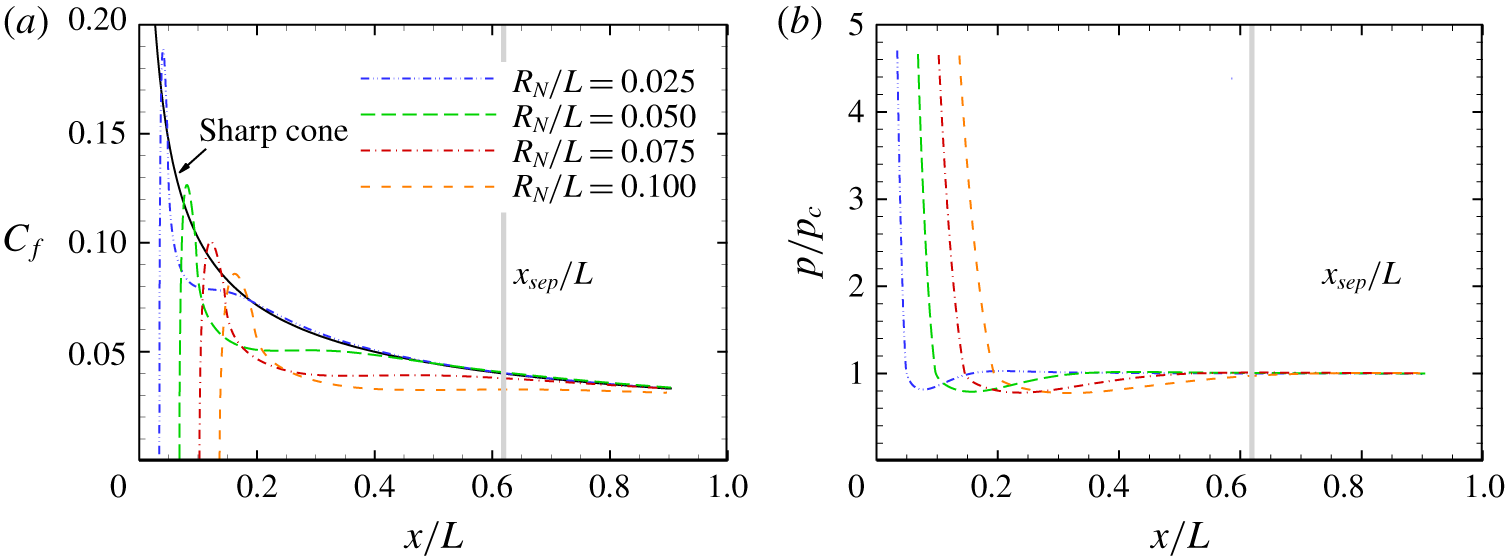
Figure 10(a) shows the distributions of skin friction coefficient obtained from the spherically blunted cone (i.e. only the first cone) simulations with different nose radii. The sharp cone result is also plotted as a reference. As mentioned before, the significant reduction in skin friction on the cone surface is due to the entropy layer swallowing and the pressure overexpansion. On the one hand, a higher temperature in the boundary layer leads to a lower density, which thickens the boundary layer and reduces the skin friction. On the other hand, the skin friction is further reduced by the flow expansion and the adverse pressure gradient in the pressure overexpansion region. Both the mechanisms can make the boundary layer more vulnerable to flow separation.
Figure 10(b) shows the surface pressure distributions normalized by the conical value  $p_{c}$ for different nose radii. Note that
 $p_{c}$ is the pressure at the surface of a sharp cone obtained from inviscid theory. As mentioned before, pressure overexpansion occurs near the juncture of the spherical nose and the first cone. With increasing leading-edge bluntness, the end of the overexpanded region moves downstream. For
 $R_{N}/L=0.1$,
 $p/p_{c}$ is equal to 0.973 at
 $x/L=0.619$, which implies that the pressure overexpansion region has just merged this location. In contrast, the corresponding
 $\unicode[STIX]{x1D70F}_{w}$ is decreased by 18.3 % compared with the sharp-cone value, indicating that the reduction is mainly caused by the entropy layer swallowing at this location. Consequently, the combined scaling factor,
 $\unicode[STIX]{x1D707}_{w}T_{w}^{1/2}/\unicode[STIX]{x1D70F}_{w}^{2}$ in (4.1), is increased by 49.7 %. It is indicated that the entropy layer swallowing tends to increase the length of the separation region by altering the boundary-layer profiles. A similar influence trend has been reported by John & Kulkarni (Reference John and Kulkarni2014) for SWBLI over compression ramps with leading-edge bluntness. However, the increase in the length of the separation region due to entropy layer swallowing is only moderate compared with that observed in figure 7. In other words, the length of the separation region will be estimated to only increase by 49.7 % in the absence of the pressure overexpansion.
Therefore, it can be speculated that the major mechanism comes from the pressure overexpansion. With increasing leading-edge bluntness, the end of the pressure overexpansion region moves downstream until reaching a critical nose radius, beyond which the pressure recovery point  $(p/p_{c}=1)$ reaches the separated flow region. In this case, the skin friction upstream of separation is further reduced and the overexpanded pressure can no longer resist the adverse pressure gradient induced by shock impingement. Consequently, the separation point is pushed upstream until the high pressure in the nose region rebalances the pressure difference.
Distributions of (a) skin friction coefficient and (b) surface pressure obtained from spherically blunted cone simulations with different nose radii. The grey lines indicate the location of the separation point for the sharp double-cone case.

4.3 Estimation of critical radius
The analysis based on the triple-deck formulation reveals that the sudden enlargement of the separation region across a certain nose radius results from the interaction between the pressure overexpansion and flow separation regions. This mechanism is unique to SWBLI over double cones and double wedges. In fact, depending on whether the body to be blunted is slender or not, the flow may undergo either underexpansion or overexpansion downstream of the spherical nose. For SWBLI over compression ramps, the pressure underexpansion region reaches the separation bubble as the nose radius is increased to a certain level, corresponding to the inverse variation of the separation region length as reported by Holden (Reference Holden1970, Reference Holden1971) and John & Kulkarni (Reference John and Kulkarni2014).
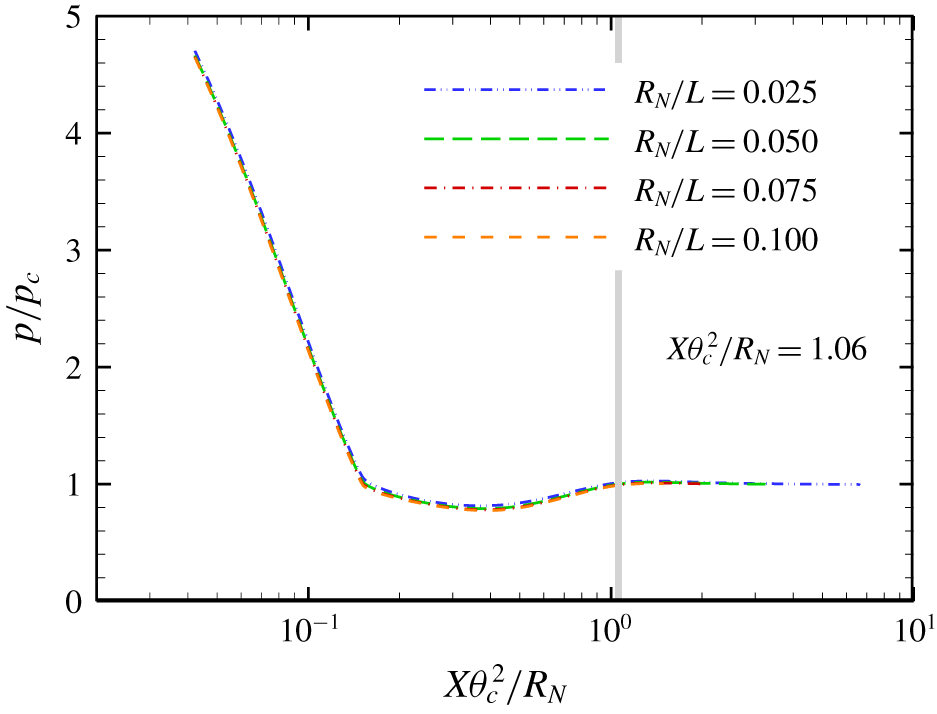
From an experimental point of view, an estimation of the critical radius could be helpful to predict whether the configuration supports a well-defined region of attached flow on both cone surfaces. It is well established that the pressure distributions over spherically blunted cones can be reduced in terms of the axial similarity parameter  $X\unicode[STIX]{x1D703}_{c}^{2}/R_{N}$, where
 $X$ is the axial distance from the nose and
 $\unicode[STIX]{x1D703}_{c}$ is the cone angle in radians (Bertin Reference Bertin1994). As shown in figure 11, the pressure distributions normalized by the conical value for different nose radii are almost overlapped when plotted against the similarity parameter. According to the pressure correlations of Blick & Francis (Reference Blick and Francis1966), the pressure recovery point can be estimated by
 $X\unicode[STIX]{x1D703}_{c}^{2}/R_{N}=1.06$. Then, the critical radius is solved by assuming that the locations of the pressure recovery point and the separation point for the baseline case coincide with each other,
 $$\begin{eqnarray}1.06R_{Nc}/\unicode[STIX]{x1D703}_{c1}^{2}+R_{Nc}(1/\sin \unicode[STIX]{x1D703}_{c1}-1)=x_{s}.\end{eqnarray}$$
For the flow conditions considered in this study, the critical radius is  $R_{Nc}/L=0.089$, which agrees well with the numerical result (between
 $R_{N}/L=0.0875$ and 0.09375).
Surface pressure distributions obtained from spherically blunted cone simulations with different nose radii as a function of the axial similarity parameter  $X\unicode[STIX]{x1D703}_{c}^{2}/R_{N}$. The grey line indicates the location of the pressure recovery point.

4.4 Real gas effects
To investigate the real gas effects on hypersonic flows over spherically blunted double cones, additional simulations are performed at a higher total enthalpy of  $13~\text{MJ}~\text{kg}^{-1}$. The flow conditions also correspond to those in the ongoing double-cone experiments of Holden et al. (Reference Holden, Wadhams, Maclean, Dufrene and Carr2018). Notably, the Reynolds number remained unchanged, and the Mach number slightly increased from 9.87 to 11.76.
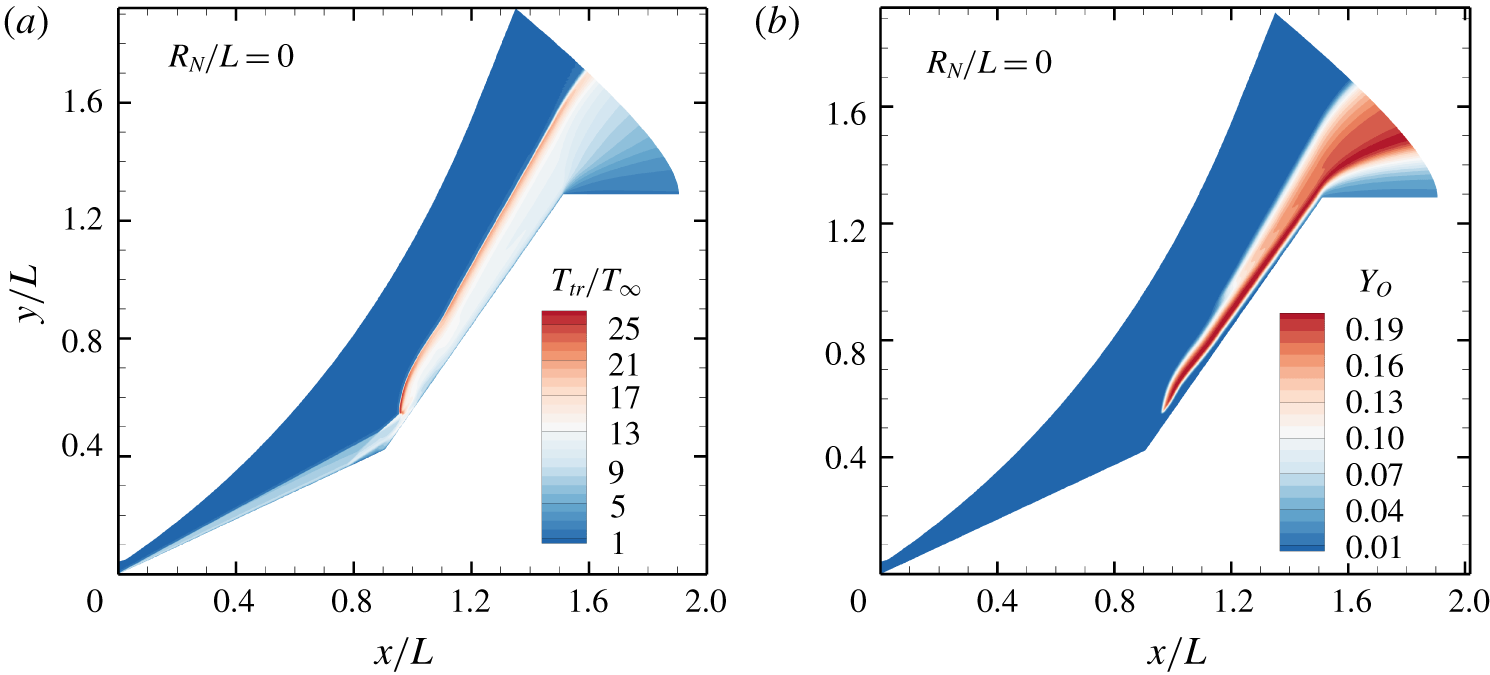
Figure 12 shows the contours of the translational–rotational temperature and the mass fraction of atomic oxygen for the sharp double-cone case. The highest translational–rotational temperature is approximately 12 000 K immediately behind the bow shock near the triple point, whereas the largest mass fraction of atomic oxygen is approximately 0.2 occurring further downstream. There is no obvious dissociation of molecular nitrogen.
Contours of (a) the translational–rotational temperature and (b) the mass fraction of atomic oxygen.

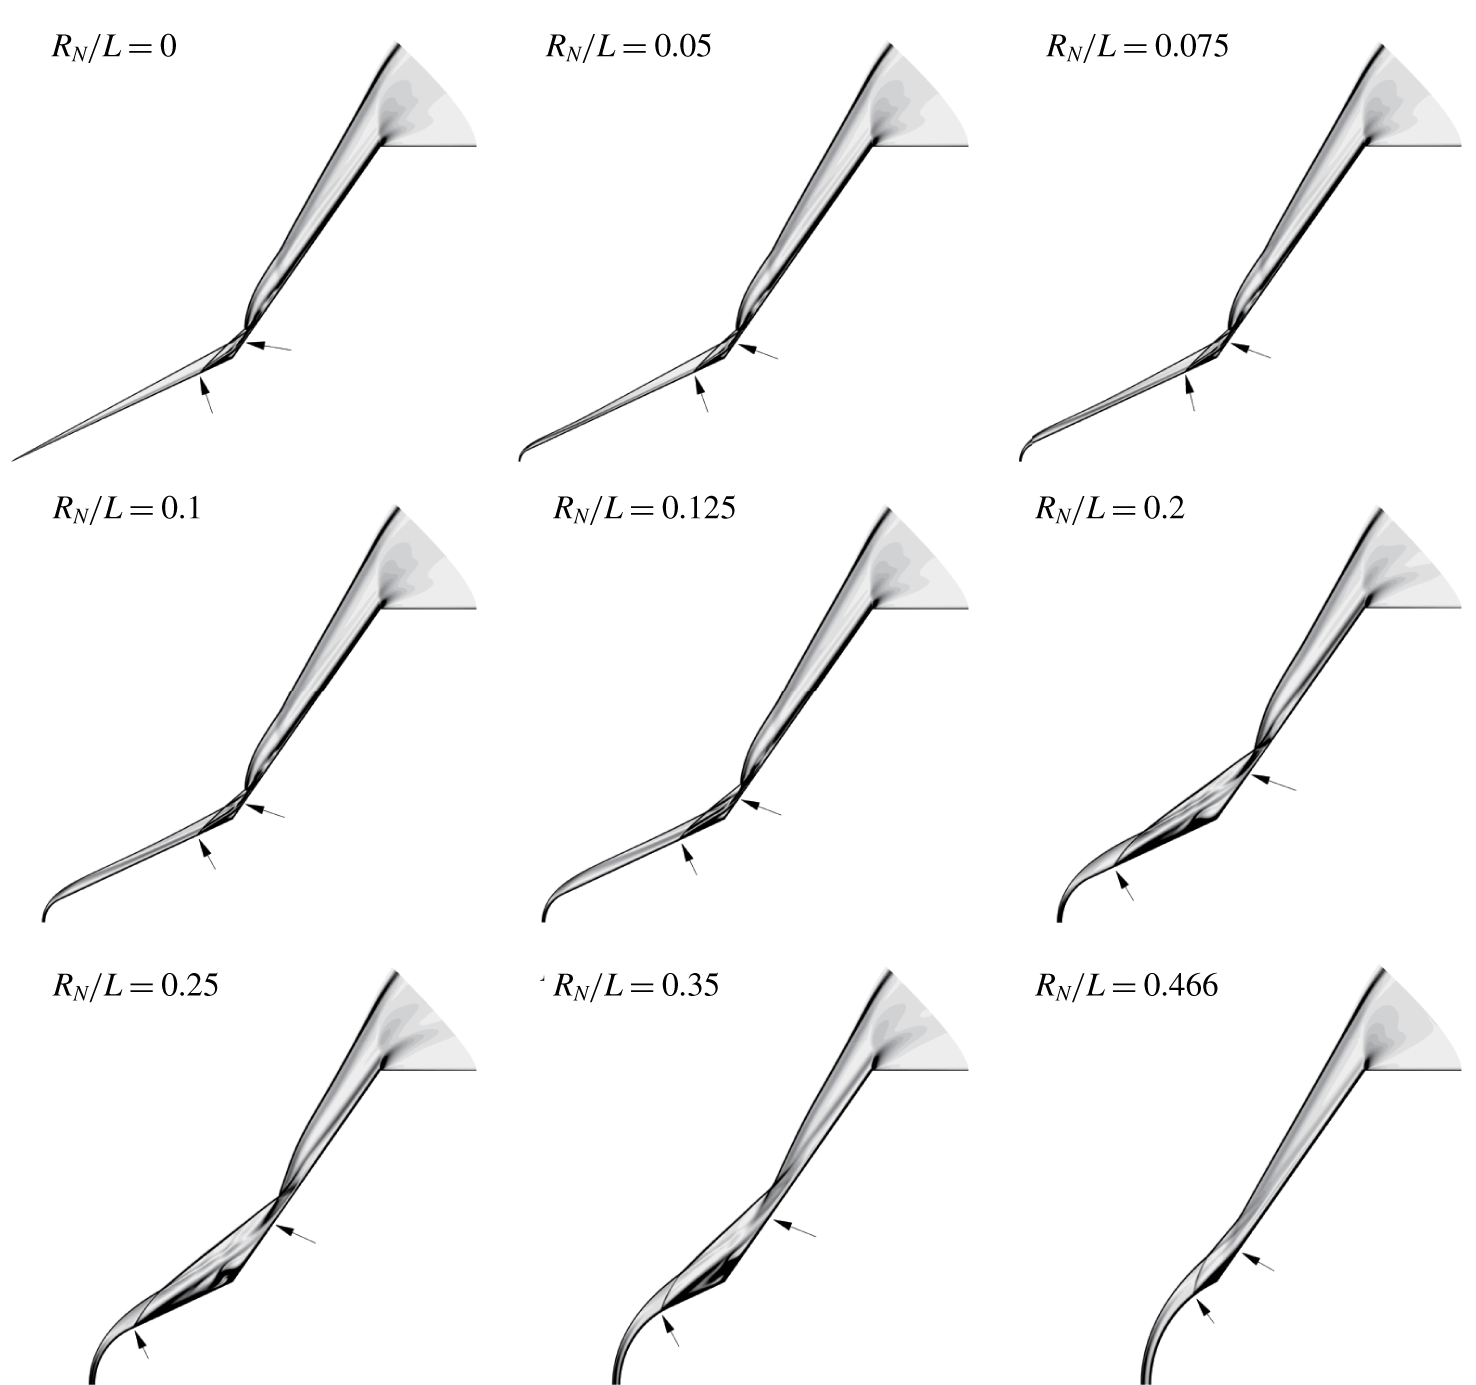
Figure 13 shows the contours of the density gradient magnitude for different nose radii at  $13~\text{MJ}~\text{kg}^{-1}$. According to the current estimation formula (4.4), the critical radius is
 $R_{Nc}/L=0.113$, which is larger than that for the
 $5~\text{MJ}~\text{kg}^{-1}$ case. This is because the size of the separation region is reduced by the presence of air chemistry. Dissociation absorbs a large amount of the translational energy of the gas and thus decreases the post-shock
 $T_{tr}$. Since the pressure is almost unaffected, the post-shock mixture density increases, leading to a smaller shock standoff distance, a weaker shock interaction strength, and a reduced separation bubble.
As expected, the flow structure remains largely unchanged for  $R_{N}/L\leqslant 0.1$, and the separation region increases dramatically beyond the critical value; however, the enlargement of the separation bubble is more moderate compared with the
 $5~\text{MJ}~\text{kg}^{-1}$ case. Intermediate states (e.g.
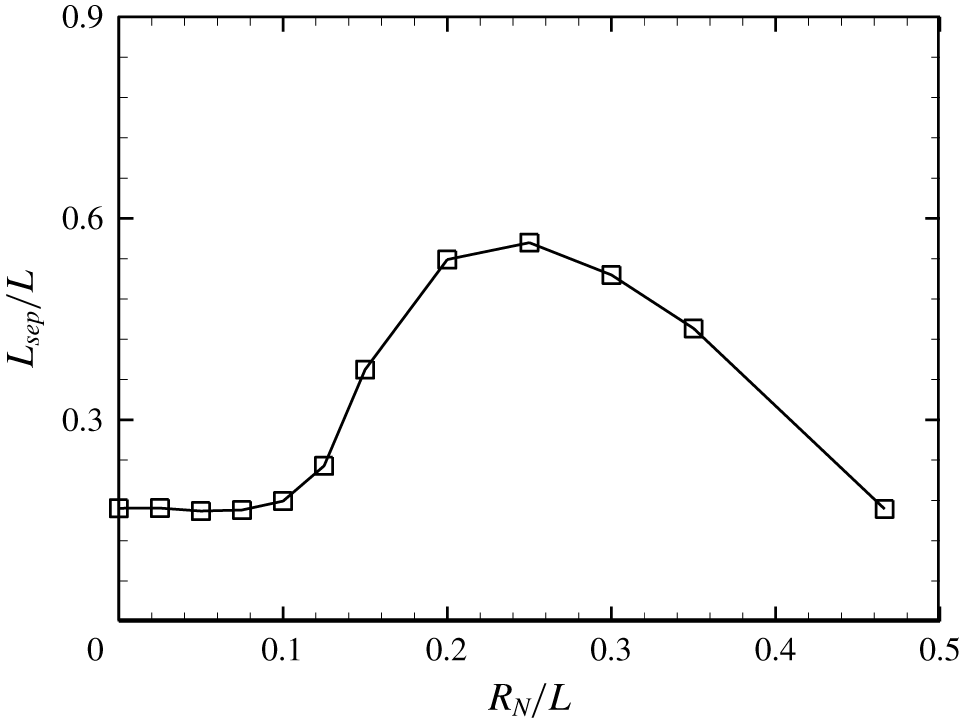
 $R_{N}/L=0.2$) can be observed where the separation point is located on the first cone instead of the juncture near the nose region. This phenomenon can be clearly seen in figure 14, which shows the variation of the separation region length with nose radius at
 $13~\text{MJ}~\text{kg}^{-1}$. The maximum length occurring at
 $R_{N}/L=0.25$ is larger than that for the sharp-nose case by a factor of 3.35. Nevertheless, the estimated critical radius still provides a good prediction, beyond which the separation bubble starts to grow. As the nose radius is further increased, the separation region shrinks, similar to the
 $5~\text{MJ}~\text{kg}^{-1}$ case.
Numerical schlieren images of flow over spherically blunted double cones with  $R_{N}/L=0$, 0.05, 0.075, 0.1, 0.125, 0.2, 0.25, 0.35 and 0.466 at a total enthalpy of
 $13~\text{MJ}~\text{kg}^{-1}$. The separation and reattachment points are marked with arrows.

Effect of leading-edge bluntness on the length of the separation region at a total enthalpy of  $13~\text{MJ}~\text{kg}^{-1}$.

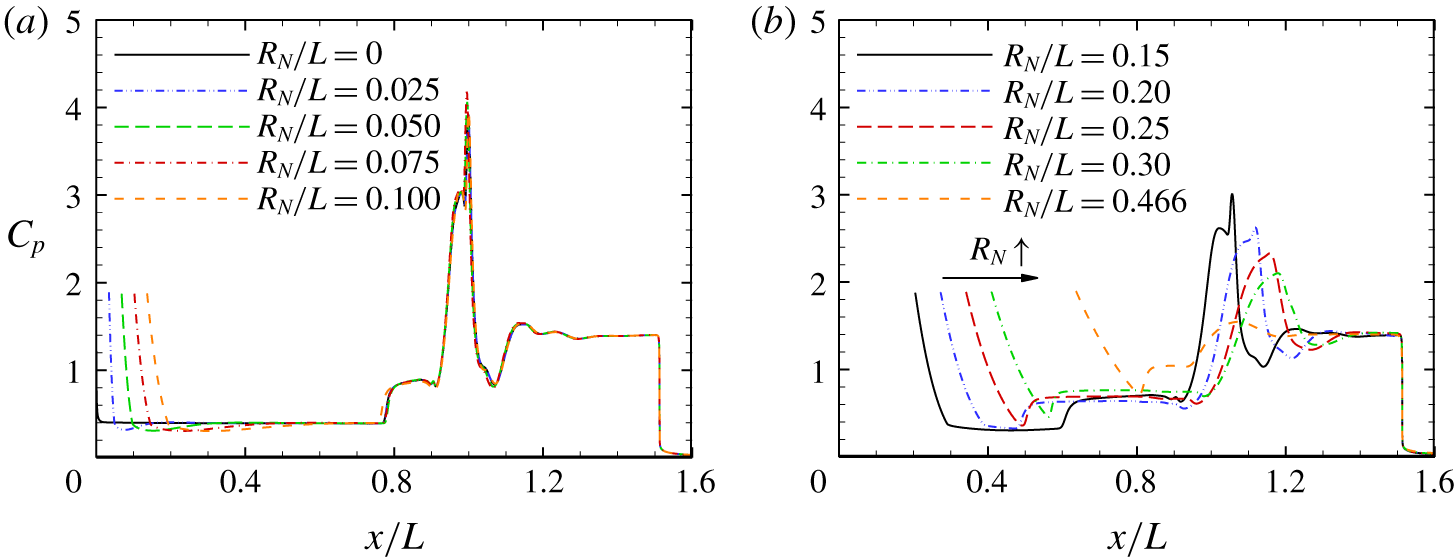
Figure 15 shows the effect of leading-edge bluntness on the surface pressure coefficient at  $13~\text{MJ}~\text{kg}^{-1}$. Again, the distributions for the nose radii below and above the critical value are plotted separately. For the sharp double-cone configuration, the sudden rise in pressure on the first cone occurs near
 $x/L=0.8$, which is more downstream compared with the
 $5~\text{MJ}~\text{kg}^{-1}$ case. Interestingly, a local peak can be observed near the maximum pressure, which is caused by an RS. In fact, the RS is significantly strengthened due to a smaller separation region compared with the
 $5~\text{MJ}~\text{kg}^{-1}$ case. The pressure overexpansion region is enlarged with increasing nose radius as expected; however, the pressure approaches the conical solution more and more asymptotically. For example, for
 $R_{N}/L=0.1$, the pressure recovery point is located at
 $x/L=0.69$. However, at an upstream location
 $x/L=0.59$, the pressure ratio
 $p/p_{c}$ only decreases by 2 %. Recall that the reattachment pressure decreases as the separation bubble increases. In this sense, intermediate states can be supported if the separation region is small enough.
Effect of leading-edge bluntness on the surface pressure coefficient for (a)  $R_{N}/L\leqslant 0.1$ and (b)
 $R_{N}/L>0.1$ at a total enthalpy of
 $13~\text{MJ}~\text{kg}^{-1}$.

4.5 Comparison with experiments
A series of hypersonic double-cone experiments with leading-edge bluntness was conducted by Holden et al. (Reference Holden, Wadhams, Harvey and Candler2006). In this section, we will employ the criterion established in this study to understand the experimental observations. Run 31 is considered with a Mach number of 12.43 and a unit Reynolds number of  $1.99\times 10^{5}~\text{m}^{-1}$, where the test gas was pure nitrogen with vibrational non-equilibrium, and the model had a nose radius of
 $R_{N}/L=0.0625$. Simulation with a sharp nose shows that the separation point is located at
 $x_{s}/L=0.590$. Based on (4.4), the predicted critical radius is
 $R_{Nc}/L=0.089$. The flow is thus expected to be subcritical and have a well-defined separation region.
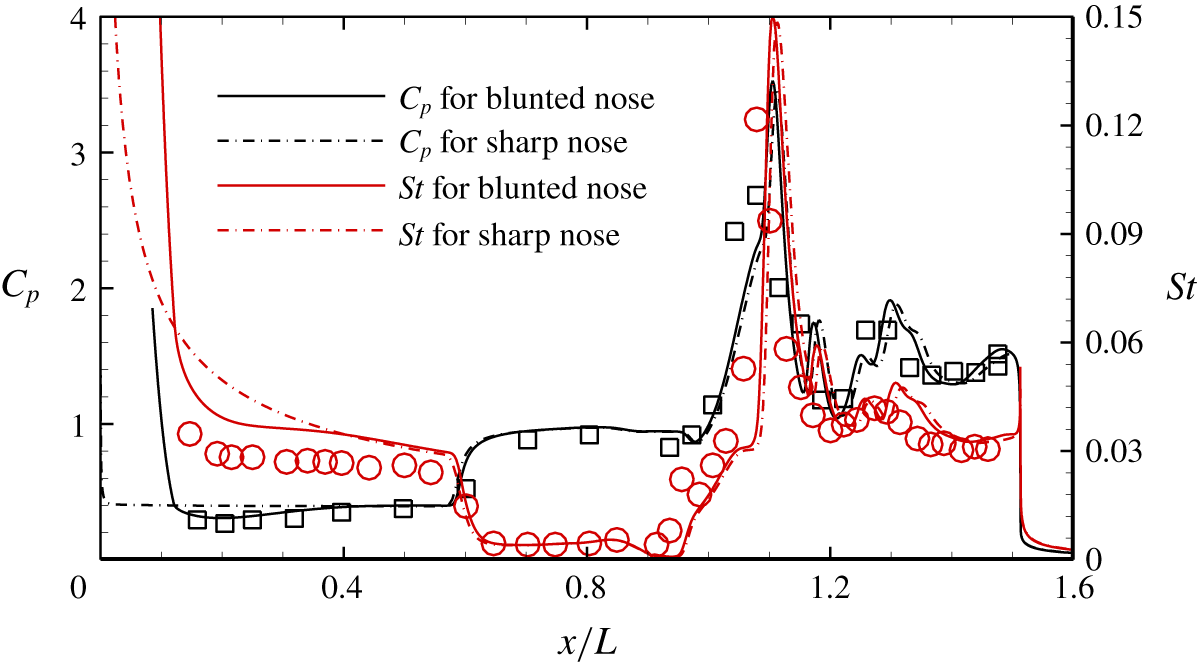
Figure 16 compares the numerical surface pressure and heat flux distributions with the measurements for run 31 in Holden et al. (Reference Holden, Wadhams, Harvey and Candler2006). The distributions for the sharp double-cone configuration are also plotted. Good agreement with the experimental data is obtained in terms of the location of the separation point, the peak values and locations and the oscillations on the second cone caused by the compression and expansion waves embedded in the underexpanded jet. Note that the pressure overexpansion due to leading-edge bluntness is also well captured. As expected, the beginning of separation is sufficiently distant from the nose region and the pressure recovery point. Moreover, the distributions in the interaction region are close to the sharp-nose results. Regarding the surface heat flux on the first cone, the predictive accuracy will be further improved by considering the vibrational non-equilibrium in the free stream and the vibrational temperature jump on the surface, as demonstrated by Nompelis et al. (Reference Nompelis, Candler and Holden2003).
Surface pressure and heat flux distributions for run 31 in Holden et al. (Reference Holden, Wadhams, Harvey and Candler2006). Black squares: surface pressure measurements; red circles: surface heat flux measurements.

Another case considered is run 33 in Holden et al. (Reference Holden, Wadhams, Harvey and Candler2006), with a Mach number of 10.35, a unit Reynolds number of  $3.19\times 10^{5}~\text{m}^{-1}$ and a nose radius of
 $R_{N}/L=0.0625$. The experiments indicated a large separation region stretching from the nose region of the first cone to the shoulder of the second cone instead of a well-defined one. However, we found it difficult to obtain steady flow fields for this case with and without bluntness. Such a problem has been encountered and reported by Knight et al. (Reference Knight, Longo, Drikakis, Gaitonde, Lani, Nompelis, Reimann and Walpot2012). It is likely that the axisymmetric laminar assumption is no longer valid at this Reynolds number. The mechanisms are beyond the scope of this study and will be addressed in the future. Nevertheless, some insights can still be acquired from the experimental data. The separation point for the sharp double-cone configuration is approximately located at
 $x_{s}/L=0.443$, as deduced from the surface pressure and heat flux measurements. The predicted critical radius is thus
 $R_{Nc}/L=0.0669$, which is lower than that for run 31. This is because the separation region increases with increasing unit Reynolds number for fully laminar interactions. The nose radius of the test model is very close to the critical value, which explains the experimental observations.
Run 36 in Holden et al. (Reference Holden, Wadhams, Harvey and Candler2006) had a Mach number of 10.34 and a unit Reynolds number of  $2.78\times 10^{5}~\text{m}^{-1}$. The nose radius was also
 $R_{N}/L=0.0625$. Again, CFD cannot converge for this flow condition, despite of a lower Reynolds number compared to run 33. Based on the experimental data for the sharp double-cone configuration, the separation point is approximately located at
 $x_{s}/L=0.498$ and the predicted critical radius is
 $R_{Nc}/L=0.0718$. As a result, the flow is subcritical in accordance with the experiments.
5 Conclusions
A hypersonic shock wave/laminar boundary-layer interaction over a canonical  $25{-}55^{\circ }$ double-cone configuration is numerically simulated to investigate the effect of leading-edge bluntness. Various nose radii are considered, with the upper limit corresponding to the largest allowable radius such that the point of tangency of the spherical nose and the first cone is located at the hinge.
The double-cone flow is insensitive to small bluntness in terms of shock structures, separation region sizes and surface pressure and heat flux distributions. With increasing nose radius, a critical value is observed, beyond which the separation bubble grows dramatically such that the separation point is shifted close to the nose region. Meanwhile, the reattachment point is pushed downstream towards the expansion corner. Compared with the sharp double-cone case, the surface pressure and heat flux peaks are dramatically reduced. As the nose radius is further increased, the separation point starts to move downstream in accordance with the movement of the juncture of the spherical nose and the first cone, while the reattachment point moves upstream. Eventually, for the limiting circumstance, the separation region is smaller than that for the sharp double cone, and the shock interaction has become rather weak.
The numerical results are analysed and interpreted based on a triple-deck formulation. Additional simulations of hypersonic flows over spherically blunted cones demonstrate that the entropy layer swallowing thickens the boundary layer and reduces the skin friction. The altered boundary-layer profile tends to increase the length of the separation region. However, the major mechanisms stem from the pressure overexpansion due to leading-edge bluntness such that the skin friction upstream of the separation point is further reduced and the upstream pressure can no longer resist the large adverse pressure gradient. Estimation of the critical radius is established, and the criterion agrees well with the experimental observations.
The role of the real gas effects is also examined by elevating the total enthalpy with the Reynolds number unchanged. The results show a similar trend with increasing nose radius compared with the moderate-enthalpy case. However, the enlargement of the separation region beyond the critical radius is gentler due to the significantly reduced separation bubble size.
Acknowledgements
This work is supported by the Hong Kong Research Grants Council (no. 152151/16E & no. 152065/19E) and the National Natural Science Foundation of China (no. 11772284). The authors would like to thank the National Supercomputer Center in Tianjin for providing computational resources.
Declaration of interests
The authors report no conflict of interest.