



1. Introduction
Instability in stratified multiphase systems is a highly challenging phenomenon that continues to baffle researchers (Chandrasekhar Reference Chandrasekhar1961; Boomkamp & Miesen Reference Boomkamp and Miesen1996). Density and viscosity contrast, interfacial tension (IFT) and large velocity difference have been identified as key driving factors of interfacial instability (Barnea & Taitel Reference Barnea and Taitel1993; Govindarajan & Sahu Reference Govindarajan and Sahu2014). Depending on the mechanism, different types of instabilities are possible: Rayleigh–Taylor instability (Lewis Reference Lewis1950), Rayleigh–Plateau instability (Joseph Reference Joseph1873), Kelvin–Helmholtz (K–H) instability (Barnea & Taitel Reference Barnea and Taitel1993) and Saffman–Taylor instability (Saffman & Taylor Reference Saffman and Taylor1958). Pertinent to our study, for a coflowing multiphase system of two Newtonian, inviscid ( $\mu _{1,2} = 0$) and density stratified layers (
 $\rho _{1} \neq \rho _{2}$) with different velocities (
 $u_{1} \neq u_{2}$) and a finite IFT (
 $\sigma$), K–H instability (Chandrasekhar Reference Chandrasekhar1961) would be present if
 $( u_{1} - u_{2} )^{2} > 2({( \rho _{1} + \rho _{2} )}/{\rho _{1}\rho _{2}} )\sqrt {\sigma g(\rho _{1} - \rho _{2})}$, where
 $\mu$,
 $\rho$,
 $u$ and
 $\sigma$ are symbols used for dynamic viscosity, density, velocity and IFT, respectively. On the other hand, an otherwise stable Poiseuille/Couette flow can exhibit long-wave instability
 $(\lambda > \sqrt {{\mu }/{\rho \dot {\gamma }}})$ due to viscosity stratification even with negligible inertia (Yih Reference Yih1967), where
 $\lambda$ and
 $\dot {\gamma }$ are symbols used for wavelength and strain rate, respectively. Such instability in multilayer viscous systems has been widely investigated theoretically for shear flow, Poiseuille and core–annular flow configurations (Hinch Reference Hinch1984; Hooper Reference Hooper1985; Hooper & Boyd Reference Hooper and Boyd1987; Hu & Joseph Reference Hu and Joseph1989; Joseph et al. Reference Joseph, Bai, Chen and Renardy1997; Govindarajan & Sahu Reference Govindarajan and Sahu2014). The literature reports a growth rate in semibounded flow (Hooper Reference Hooper1985) with a wall on one side
 ${\sim } O (k^{{4}/{3}})$ compared with bounded flows (Yih Reference Yih1967) with walls on both sides
 ${\sim } O (k^{2})$, indicating the stabilizing effect of confinement for long waves with wavenumber,
 $k \ll 1$. There have been experimental investigations to study the effect of viscosity stratification on instability (Charles & Lilleleht Reference Charles and Lilleleht1965; Kao & Park Reference Kao and Park1970; Khomami & Su Reference Khomami and Su2000). It has also been shown that coflows with a high IFT (
 $\sigma \approx 30$ mPa-s) operating at a higher Reynolds number (
 $Re = 30$) could lead to bulk mode instability (Kao & Park Reference Kao and Park1970). On the other hand, coflows with a lower IFT (
 $\sigma \approx 10$ mPa-s) exhibit interfacial mode instability, validating the theoretical prediction that lower IFT indeed increases the instability growth rate (Khomami & Su Reference Khomami and Su2000).
Instability in superposed multilayer flows of non-Newtonian fluids has drawn significant attention in the last few decades due to its prevalence in chemical process industries wherein the understanding of instability serves as the window for maintaining a stable interface during the co-extrusion process (Ganpule & Khomami Reference Ganpule and Khomami1999). A few theoretical studies have been conducted with Newtonian and non-Newtonian multilayer flows, wherein non-Newtonian phases are inelastic shear thinning following the power-law model, and Carreau model (Su & Khomani Reference Su and Khomani1991), viscoelastic following the Oldroyd-B model and second-order fluid model (Su & Khomami Reference Su and Khomami1992) or viscoplastic following the Bingham fluid model (Hormozi, Wielage-Burchard & Frigaard Reference Hormozi, Wielage-Burchard and Frigaard2011). These theoretical investigations have revealed that, in such flow configurations, the elasticity jump across the interface alone can initiate instability even in the absence of viscosity contrast and the relative contribution of elasticity stratification (Su & Khomami Reference Su and Khomami1992) is of the same order as that of the viscosity contrast. On the other hand, the shear-thinning nature of fluids acts as an extra production term in disturbance energy analysis (Chekila et al. Reference Chekila, Nouar, Plaut and Nemdili2011; Lashgari et al. Reference Lashgari, Pralits, Giannetti and Brandt2012). However, the propagation of these instabilities along the axial direction is still unclear in the literature. Earlier experiments conducted on a slit die geometry with non-Newtonian fluids indicate an increase in instability with the jump in normal stress across the interface (Su & Khomami Reference Su and Khomami1992; Wilson & Khomami Reference Wilson and Khomami1992). Further, prior works have revealed that, as less viscous and elastic fluid occupies more of the conduit, the interface becomes more unstable (Yiantsios & Higgins Reference Yiantsios and Higgins1988; Su & Khomami Reference Su and Khomami1992; Khomami & Su Reference Khomami and Su2000). The literature suggests that the highest instability growth rate occurs at a non-dimensional wavenumber  ${\sim } O (1)$ with all the lengths non-dimensionalized with the thickness of the fluid layer of higher viscosity. Further, previous studies reveal the encapsulation effect of superposed viscous layers wherein low-viscosity fluid tends to encapsulate the high-viscosity fluid, and the rate of encapsulation increases with increasing viscosity contrast (Lee & White Reference Lee and White1974). A review of the literature shows that most of these experimental studies are conducted on a macro-scale. However, interfacial instabilities involving viscoelastic fluids inside microfluidic confinements, where interfacial effects become predominant, are not well understood.
Interfacial instability in coflowing fluids inside microfluidic confinement has been investigated in the context of monodispersed droplet generation (Guillot et al. Reference Guillot, Colin, Utada and Ajdari2007; Utada et al. Reference Utada, Fernandez-Nieves, Gordillo and Weitz2008). However, instability in the stratified flow of parallel streams has been rarely investigated (Hu & Cubaud Reference Hu and Cubaud2018; Hazra, Mitra & Sen Reference Hazra, Mitra and Sen2022b; Kaneelil et al. Reference Kaneelil, Pahlavan, Herrada, LeRoy, Stengel, Warner, Galea and Stone2022). Such systems have shown immense potential in the manipulation and sorting of particles, droplets and cells in microfluidics applications (Tsai et al. Reference Tsai, Wexler, Wan and Stone2011; Jayaprakash, Banerjee & Sen Reference Jayaprakash, Banerjee and Sen2016; Hazra et al. Reference Hazra, Jayaprakash, Pandian, Raj, Mitra and Sen2019), and interfacial instability would act as a deterrent to such processes (Deng et al. Reference Deng, Wang, Ju, Xie and Chu2016; Hazra et al. Reference Hazra, Mitra and Sen2022b). On the other hand, interfacial instability is conducive to some applications such as rapid on-chip droplet generation and cell encapsulation. Despite the above developments, axial propagation and the characterization of the growth or decay of interfacial disturbances in confined microsystems have not been investigated well. The literature suggests that contrast in viscosity, density and elasticity, IFT, the ratio of fluid depths and inertia are key factors of interfacial instability in stratified multiphase systems (Khomami & Su Reference Khomami and Su2000; Hu & Cubaud Reference Hu and Cubaud2018, Reference Hu and Cubaud2020). However, an in-depth study of instability in a microfluidic stratified two-phase system from a general viscoelastic perspective is missing in the literature.
In the present work, we investigate the interfacial instability in microfluidic coflow combinations of Newtonian–Newtonian fluid (N–N) Fluorinert™ FC40 – SiO-1000 and Newtonian–viscoelastic fluids (N–VE) FC40 – polyethylene oxide (PEO) 1.7 %, FC40 – PEO 3 %, FC40 – PEO 4 % and FC40 – PEO 5 %. We theoretically obtain interface location, stream widths, velocity profiles and shear stress variation for the above-mentioned combinations. We perform linear stability analysis and develop analytical expressions for complex wave speed and the dispersion relation,  $(k$ vs
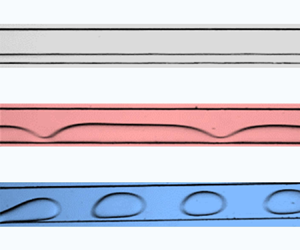
 $\omega _r)$. We categorize the behaviour of the systems into two regimes: a stable regime with a flat interface and an unstable regime with either waviness (unstable waviness) along the interface or droplets (unstable droplet) emerging from the low-viscosity fluid, as shown in figure 1(a) and presented in supplementary movie S1 available at https://doi.org/10.1017/jfm.2024.993. We present the regimes in a comprehensive regime plot in terms of the capillary numbers of the phases and explain the transitions among these regimes by decoupling the physics into viscous and elastic stratification components, which allows us to understand the competing effects leading to a variety of interfacial phenomena. In order to uncover the physical characteristics of the observed instabilities, we delineate the axial variation of amplitude
 $(A)$ and wavelength
 $(\lambda )$. We also investigate the mechanism of droplet generation and pinch-off time, which are of particular interest in microfluidics. The possibility to alter the viscous and elastic stratification components in our experiments could potentially allow for control of the transition between the unstable-waviness and unstable-droplet regimes. Our study has the potential to improve the present understanding of interfacial instability in microfluidic coflow systems and identify hydrodynamic conditions for seamless microfluidic operations.
Schematic description of the three distinct flow regimes and the experimental set-up. (a) Various flow configurations (flow is from left to right) observed in the experiments: (i) stable immiscible coflow configuration is shown with FC40 and PEO or SiO-1000 infused into the microchannel of dimensions  $L\ (27~{\rm mm}) \times W (300\ \mathrm {\mu } {\rm m})$ as phase 1 (P1) and phase 2 (P2) with flow widths
 $W_{1}$ and
 $W_{2}$, respectively; (ii) part of the channel showing the unstable-waviness regime, where
 $\tilde {\lambda }$ and
 $\tilde {A}$ are the dimensional wavelength and amplitude of the interfacial wave, respectively; and (iii) part of the channel showing the unstable-droplet regime. (b) Schematic diagram of the set-up and device. (i) Schematic of the experimental set-up showing microscope, high-speed camera and the pumps. (ii) Schematic of the microfluidic device.

2. Experiments
A schematic of the experimental set-up and the microchannel device used in the present study are depicted in figure 1(b). The device as shown in figures 1(b-ii) and 1(a) comprises two inlet channels leading to an expanded channel. The expanded channel is of rectangular cross-section and is 300  $\mathrm {\mu }$m wide (
 $W$), 100
 $\mathrm {\mu }$m deep and 27 mm long (
 $L$). The device is fabricated in polydimethylsiloxane (PDMS) using standard soft lithography (Sajeesh, Doble & Sen Reference Sajeesh, Doble and Sen2014) (Appendix A). We expose the PDMS microchannel and a glass slide to oxygen plasma for 3 min at 30 W radio frequency (RF) power. Immediately after plasma exposure, the microchannel device is bonded onto the glass slide. After mild heating at 50
 $^\circ$C for 5 min, the channel is flushed with PEO for 30 min to render hydrophilic channel surfaces. Polyethylene oxide (molecular wt. 1 MDa), silicone oil 1000 (SiO-1000), FC40 oil and Abil Em 90 surfactant were procured from Sigma-Aldrich, USA. The PEO at 1.7 %–5 % w/w is added to deionized (DI) water to obtain the non-Newtonian aqueous solutions, whose shear-thinning nature would depend on the polymer concentration. Abil Em 90 is mixed with FC40 at 5 % w/w. Viscosities of the fluids are measured using Anton Paar Rheometer MCR 72 with 50 mm of cone diameter at 25
 $^\circ$C and verified with the existing literature. Interfacial tension is measured using a droplet size analyser (DSA 25, Krüss GmbH, Germany). The measured properties of the fluids are summarized in table 1 and the viscosity variations are shown in Appendix B.
Various properties of different fluids used in the experiments. Symbols  $\mu$,
 $\tau$,
 $\gamma$ and
 $m$ refer to viscosity, relaxation time (Ebagninin, Benchabane & Bekkour Reference Ebagninin, Benchabane and Bekkour2009), IFT with respect to FC40 and viscosity ratio with respect to FC40, respectively.

Each measurement is repeated at least thrice and the standard deviation is found to be within  $\pm$3 %. Fluorinert™ FC40 (Newtonian, N) is used as the first coflow stream (P1), and SiO-1000 (Newtonian, N) or PEO (viscoelastic, VE) is used as the second coflow stream (P2). The coflow (N–N or N–VE) combinations FC40 – SiO-1000, FC40 – PEO 1.7 %, FC40 – PEO 3 %, FC40 – PEO 4 % and FC40 – PEO 5 % will be noted henceforth as P1–P2.
The working fluids are infused into the channels using high-performance syringe pumps (Cetoni GmbH, Germany) as shown in figure 1(b). The fluidic connections between the syringe pump and the device is established using polytetrafluoroethylene tubing (Fisher Scientific, USA). The phenomena (figure 1a) are observed and captured using an inverted microscope (Olympus IX73) coupled with a high-speed monochrome camera (FASTCAM SA3 model, Photron USA, Inc.) operating at 1000 to 6000 fps, interfaced with a computer system via Photron Fastcam Viewer software.
3. Theoretical analysis
We consider a coflow of Newtonian and viscoelastic fluids through a rectangular microchannel, as shown in figure 1. One part of the channel is filled with a Newtonian fluid, indicated as phase 1 (P1), and the other part is occupied by a viscoelastic fluid, which is phase 2 (P2). We use the subscript‘1’ for the Newtonian fluid and ‘2’ for the viscoelastic fluid. We perform a linear stability analysis by considering the continuity equation, Navier–Stokes equation, and the Oldroyd-B model. For phase 1, for Newtonian fluid, the dimensional continuity and Navier–Stokes equations become
 $$\begin{gather} \boldsymbol{\nabla} \boldsymbol{\cdot} \tilde{\boldsymbol{u}}_1=0, \end{gather}$$
 $$\begin{gather}\frac{\partial\tilde{\boldsymbol{u}}_1}{\partial \tilde{t}} + \tilde{\boldsymbol{u}}_1 \boldsymbol{\cdot} \boldsymbol{\nabla}\tilde{\boldsymbol{u}}_1 ={-} \frac{1}{\rho_1}\boldsymbol{\nabla}\tilde{p}_1 + \frac{\mu_1}{\rho_1} {\nabla}^{2}\tilde{\boldsymbol{u}}_1. \end{gather}$$
The Newtonian fluid velocity field is defined as  $\tilde {\boldsymbol {u}}_1=\tilde {u}_1 \boldsymbol {e}_x+\tilde {v}_1\boldsymbol {e}_y$, where the pressure, viscosity and density of the fluid are denoted by
 $\tilde {p}_1$,
 $\mu _1$ and
 $\rho _1$, respectively. Here, tildes over
 $x, y, t$ and flow variables indicate the dimensional quantities. For phase 2, in the case of viscoelastic fluid, the continuity and Navier–Stokes equations along with the Oldroyd-B model give
 $$\begin{gather} \boldsymbol{\nabla} \boldsymbol{\cdot} \tilde{\boldsymbol{u}}_2=0, \end{gather}$$
 $$\begin{gather}\frac{\partial\tilde{\boldsymbol{u}}_2}{\partial \tilde{t}} + \tilde{\boldsymbol{u}}_2 \boldsymbol{\cdot} \boldsymbol{\nabla}\tilde{\boldsymbol{u}}_2 ={-} \frac{1}{\rho_2}\boldsymbol{\nabla}\tilde{p}_2 + \frac{\mu_{2s}}{\rho_2}{\nabla}^{2}\tilde{\boldsymbol{u}}_2 + \frac{1}{\rho_2}\boldsymbol{\nabla} \boldsymbol{\cdot}\tilde{\boldsymbol{\sigma}}, \end{gather}$$
where the viscoelastic fluid velocity field is defined as  $\tilde {\boldsymbol {u}}_2=\tilde {u}_2 \boldsymbol {e}_x+\tilde {v}_2 \boldsymbol {e}_y$, and the pressure, solvent viscosity and density of the fluid are
 $\tilde {p}_2$,
 $\mu _{2s}$ and
 $\rho _2$, respectively. Additionally,
 $\tilde {\boldsymbol {\sigma }}$ is a second-rank tensor that describes the polymer effect of the viscoelastic fluid, expressed as
 \begin{equation} \tilde{\boldsymbol{\sigma}} + \tau\left[ \frac{\partial\tilde{\boldsymbol{\sigma}}}{\partial \tilde{t}} + \tilde{\boldsymbol{u}}_2 \boldsymbol{\cdot} \boldsymbol{\nabla} \tilde{\boldsymbol{\sigma}} -\tilde{\boldsymbol{\sigma}}\boldsymbol{\cdot}\boldsymbol{\nabla}\tilde{\boldsymbol{u}}_2 -( \boldsymbol{\nabla}\tilde{\boldsymbol{u}}_2 )^{\rm T} \boldsymbol{\cdot} \tilde{\boldsymbol{\sigma}}\right] =\mu_{2p}[ \boldsymbol{\nabla}\tilde{\boldsymbol{u}}_2 + ( \boldsymbol{\nabla}\tilde{\boldsymbol{u}}_2 )^{\rm T}]. \end{equation}
Here,  $\tau$ is the relaxation time and
 $\mu _{2p}$ is the polymer viscosity. We denote the components of the polymeric stress tensor in the fluid as
 $\tilde {\sigma }_{xx}$,
 $\tilde {\sigma }_{yy}$ and
 $\tilde {\sigma }_{xy}$. The solvent viscous stress components are represented as
 $\tilde {\sigma }_{xx,s}$,
 $\tilde {\sigma }_{yy,s}$ and
 $\tilde {\sigma }_{xy,s}$. We consider the following general boundary conditions: (i) zero normal velocity and no-slip condition at the top and bottom walls, which can be represented as
 $$\begin{gather} \textrm{at} \quad y=W_2:\quad \tilde{u}_2=0, \quad \tilde{v}_2=0, \end{gather}$$
 $$\begin{gather}\textrm{at} \quad y={-}W_1: \quad \tilde{u}_1=0, \quad \tilde{v}_1=0. \end{gather}$$
(ii) Continuity of velocity at the interface gives
 \begin{equation} \textrm{at} \quad y=0: \quad \tilde{u}_1= \tilde{u}_2, \quad \tilde{v}_1= \tilde{v}_2. \end{equation}
(iii) Continuity of shear stress at the interface (at  $y=0$) is expressed as
 \begin{equation} \{\tilde{\sigma}_{xy,s}+\tilde{\sigma}_{xy}\}_2 =\{\tilde{\sigma}_{xy,s}\}_1. \end{equation}
On the left-hand side of (3.9),  $\tilde {\sigma }_{xy,s}$ represents the solvent component, while
 $\tilde {\sigma }_{xy}$ denotes the polymer component of the shear stress in phase 2. Here, phase 2 is considered to be a viscoelastic fluid, so
 $\{\tilde {\sigma }_{xy}\}_2$ is not zero. Since phase 1 is considered to be a Newtonian fluid,
 $\{\tilde {\sigma }_{xy}\}_1$ becomes zero. (iv) Continuity of normal stress at the interface (at
 $y=0$) gives
 \begin{equation} \{-\tilde{p}+\tilde{\sigma}_{yy,s}+\tilde{\sigma}_{yy}\}_2 - \{-\tilde{p}+\tilde{\sigma}_{yy,s}\}_1={-}\gamma \frac{\partial^2 \tilde{A}}{\partial \tilde{x}^2}. \end{equation}
Here,  $\gamma$ and
 $\tilde {A}$ denote the IFT and the deviation of the interface from its mean position, respectively. In the first term on the left-hand side of (3.10),
 $\tilde {\sigma }_{yy,s}$ represents the solvent contribution, while
 $\tilde {\sigma }_{yy}$ indicates the polymer contribution to the normal stress in phase 2. Here, phase 2 is considered to be a viscoelastic fluid, so
 $\{\tilde {\sigma }_{yy}\}_2$ is not zero. Since phase 1 is considered to be a Newtonian fluid,
 $\{\tilde {\sigma }_{yy}\}_1$ becomes zero. The second term accounts for the normal stress of the Newtonian fluid in phase 1.
We non-dimensionalize the above equations by considering
 \begin{equation} x=\frac{\tilde{x}}{W_2}, \quad y=\frac{\tilde{y}}{W_2} \quad \mathrm{and} \quad t=\frac{\tilde{t} U_0}{W_2}, \end{equation}
where  $W_2$ is the width of the viscoelastic fluid layer and
 $U_0$ is the average velocity of the flow through the microchannel. Similarly, the dimensionless fluid velocity, pressure and viscoelastic stress tensor can be expressed as
 \begin{equation} u=\frac{\tilde{u}}{U_0}, \quad v=\frac{\tilde{v}}{U_0}, \quad p=\frac{\tilde{p}}{\rho_2 U_0^2}\quad \mathrm{and} \quad \boldsymbol{\sigma}=\frac{\tilde{\boldsymbol{\sigma}}}{\rho_2 U_0^2}. \end{equation}
Using (3.11) and (3.12), the dimensionless continuity (3.1) and Navier–Stokes equation (3.2) for Newtonian fluid can be written as
 $$\begin{gather} \boldsymbol{\nabla} \boldsymbol{\cdot} {\boldsymbol{u}}_1=0, \end{gather}$$
 $$\begin{gather}\frac{\partial{\boldsymbol{u}}_1}{\partial {t}} + {\boldsymbol{u}}_1 \boldsymbol{\cdot} \boldsymbol{\nabla}{\boldsymbol{u}}_1 ={-}\frac{1}{r} \boldsymbol{\nabla}{p}_1 + \frac{1}{R_1}{\nabla}^{2}{\boldsymbol{u}}_1. \end{gather}$$
Here,  $r$ is the density ratio between the Newtonian fluid and the viscoelastic fluid, defined as
 $r=\rho _1/\rho _2$ and
 $R_1$ is the Reynolds number for the Newtonian fluid, given by
 ${R_1=U_0 \rho _1 W_2/\mu _1}$. Similarly, for the viscoelastic fluid, the dimensionless continuity (3.3) and Navier–Stokes equations (3.4) can be expressed as
 $$\begin{gather} \boldsymbol{\nabla} \boldsymbol{\cdot} {\boldsymbol{u}}_2=0, \end{gather}$$
 $$\begin{gather}\frac{\partial{\boldsymbol{u}}_2}{\partial {t}} + {\boldsymbol{u}}_2 \boldsymbol{\cdot} \boldsymbol{\nabla}{\boldsymbol{u}}_2 ={-} \boldsymbol{\nabla}{p}_2 + \frac{1}{R_{2s}}{\nabla}^{2}{\boldsymbol{u}}_2 + \boldsymbol{\nabla} \boldsymbol{\cdot} {\boldsymbol{\sigma}}, \end{gather}$$
where (3.5) becomes
 \begin{equation} {\boldsymbol{\sigma}} + Wi\left[ \frac{\partial{\boldsymbol{\sigma}}}{\partial {t}} + {\boldsymbol{u}}_2 \boldsymbol{\cdot} \boldsymbol{\nabla} {\boldsymbol{\sigma}} -{\boldsymbol{\sigma}} \boldsymbol{\cdot}\boldsymbol{\nabla}{\boldsymbol{u}}_2 -( \boldsymbol{\nabla}{\boldsymbol{u}}_2 )^{{\rm T}} \boldsymbol{\cdot} {\boldsymbol{\sigma}} \right] =\frac{1}{R_{2p}}[ \boldsymbol{\nabla}{\boldsymbol{u}}_2 + ( \boldsymbol{\nabla}{\boldsymbol{u}}_2 )^{\rm T} ]. \end{equation}
Here,  $Wi$ is the Weissenberg number,
 $Wi=\tau U_0/W_2$. The Reynolds number corresponding to the solvent and the polymer viscosity are considered as
 $R_{2s}$ and
 $R_{2p}$, where,
 $R_{2s}=U_0 \rho _2 W_2/\mu _{2s}$ and
 $R_{2p}=U_0 \rho _2 W_2/\mu _{2p}$.
Following the conventional formulation for a normal mode of instability (Yih Reference Yih1967), the motion of fluid is resolved into the primary motion and the perturbation component. The perturbed forms of the velocity, pressure and viscoelastic stress fields are considered as
 \begin{equation} {u }={{U}}+{u}{'},\quad v=v',\quad p={P}+ p'\quad \mathrm{and}\quad \boldsymbol{\sigma}=\bar{\boldsymbol{\sigma}}+\boldsymbol{\sigma}\boldsymbol{'}, \end{equation}
respectively, where  $U, P$ and
 $\bar {\boldsymbol {\sigma }}$ are the primary flow velocity, pressure and viscoelastic stress. The primary flow has only an
 $x$ component of velocity (
 $y$ component of fluid velocity
 $V=0$) and it is independent of
 $x$ and
 $t$ (Yih Reference Yih1967). Here,
 ${u}'$,
 ${v}'$,
 ${p}'$,
 $\boldsymbol {\sigma }'$ are the first-order perturbation field variables. We substitute the perturbed fluid field (3.18a–d) in (3.13)–(3.17). Then, we separate the primary and first-order perturbed equation and neglect the higher-order perturbations (Yih Reference Yih1967; Li Reference Li1969).
3.1. The primary flow
The continuity equation (3.13) corresponding to the primary motion of Newtonian fluid is simplified as
 \begin{equation} \frac{\partial{U}_1}{\partial {x}}=0. \end{equation}
From (3.14), the  $x$-momentum equation becomes
 \begin{equation} 0={-}\frac{1}{r}\frac{\partial{P}_1}{\partial {x}}+\frac{1}{R_{1}}\frac{\partial^{2}U_1}{\partial y^{2}}, \end{equation}
and the  $y$-momentum equation reduces to
 $\partial {P}_1/\partial {y}=0$. Similarly, for the primary motion of viscoelastic fluid, the continuity equation becomes
 \begin{equation} \frac{\partial{U}_2}{\partial {x}}=0. \end{equation}
The  $x$-momentum equation simplifies to
 \begin{equation} 0={-}\frac{\partial{P}_2}{\partial {x}}+\frac{1}{R_{2s}}\frac{\partial^{2}U_2}{\partial y^{2}}+\frac{\partial \bar{\sigma}_{xx}}{\partial x}+\frac{\partial \bar{\sigma}_{yx}}{\partial y}, \end{equation}
and the  $y$-momentum equation becomes
 \begin{equation} 0={-}\frac{\partial{P}_2}{\partial {y}}+\frac{\partial \bar{\sigma}_{xy}}{\partial x}+\frac{\partial \bar{\sigma}_{yy}}{\partial y}. \end{equation}
Here,  $\bar {\sigma }_{xx}, \bar {\sigma }_{xy}, \bar {\sigma }_{yx}$ and
 $\bar {\sigma }_{yy}$ are the components of viscoelastic stress tensor
 $\bar {\boldsymbol {\sigma }}$ due to the primary flow, where
 $\bar {\sigma }_{xy}=\bar {\sigma }_{yx}$. In order to find these stress components, we consider (3.17). For primary motion, (3.17) reduces to
 $$\begin{gather} \bar{\sigma}_{xx}+ Wi \left[ U_2 \frac{\partial{\bar{\sigma}_{xx}}}{\partial {x}}-2 {\bar{\sigma}_{xy}}\frac{\partial{{U}_{2}}}{\partial {y}} \right]=0, \end{gather}$$
 $$\begin{gather}\bar{\sigma}_{xy}+ Wi \left[ U_2 \frac{\partial{\bar{\sigma}_{xy}}}{\partial {x}}-{\bar{\sigma}_{yy}}\frac{\partial{{U}_{2}}}{\partial {y}} \right]= \frac{1}{R_{2p}} \frac{\partial{U_2}}{\partial{y}}, \end{gather}$$
 $$\begin{gather}\bar{\sigma}_{yy}+ Wi \left[ U_2 \frac{\partial{\bar{\sigma}_{yy}}}{\partial {x}}\right]= 0. \end{gather}$$
By following Li (Reference Li1969), simplification of the (3.24)–(3.26) gives the primary viscoelastic stress components as
 \begin{equation} \bar{\sigma}_{yy}=0, \quad \bar{\sigma}_{xx}=\bar{\sigma}_{xx}(y), \quad \bar{\sigma}_{xy}=\bar{\sigma}_{xy}(y). \end{equation}
Using (3.27), (3.24) and (3.25) reduce to
 $$\begin{gather} \bar{\sigma}_{xx}= Wi \left[2 {\bar{\sigma}_{xy}}\frac{\partial{{U}_{2}}}{\partial {y}} \right], \end{gather}$$
 $$\begin{gather}\bar{\sigma}_{xy}= \frac{1}{R_{2p}} \frac{\partial{U_2}}{\partial{y}}. \end{gather}$$
Using (3.27)–(3.29), the  $x$ and
 $y$ momentum equations ((3.22) and (3.23)) for viscoelastic fluid become
 $$\begin{gather} 0={-}\frac{\partial{P}_2}{\partial {x}}+\frac{1}{R_{2s}}\frac{\partial^{2}U_2}{\partial y^{2}}+\frac{1}{R_{2p}}\frac{\partial^{2}U_2}{\partial y^{2}}, \end{gather}$$
 $$\begin{gather}\frac{\partial{P}_2}{\partial {y}}=0. \end{gather}$$
Here,  $\bar {\sigma }_{yy}=0$,
 $\partial {P_1}/\partial {y=0}$,
 $\partial {P_2}/\partial {y=0}$, therefore, we consider
 $P_1=P_2=P$ (Yih Reference Yih1967; Li Reference Li1969). The equations governing the primary flow for Newtonian (3.20) and viscoelastic fluid (3.30) can be represented as
 \begin{equation} \frac{\partial^{2}U_1}{\partial y^{2}}={-}\frac{R_1}{r} K, \end{equation}
and
 \begin{equation} \frac{\partial^{2}U_2}{\partial y^{2}}={-}{R_2} K, \end{equation}
respectively. Here,
 \begin{equation} K={-}\frac{\partial{P}}{\partial {x}},\quad R_2=\frac{R_{2s} R_{2p}}{R_{2s}+ R_{2p}}=\frac{U_0 \rho_2 W_2}{\mu_2}, \end{equation}
and  $\mu _{2}=\mu _{2s}+\mu _{2p}$. The
 $y$ coordinates of the top and bottom walls of the channel are represented by
 $y=1$ and
 $y=-n$, respectively, where
 $n=W_1/W_2$. We solve (3.32) and (3.33) using boundary conditions (i) at
 $y=1$,
 $U_2=0$, (ii) at
 $y=-n$,
 $U_1=0$, (iii) at
 $y=0$, continuity of velocity gives
 $U_1=U_2$ and (iv) at
 $y=0$, continuity of shear stress gives
 $m (\partial U_1/\partial y)= (\partial U_2/\partial y)$. Here,
 $m$ is the viscosity ratio between the Newtonian and viscoelastic fluids,
 $m=\mu _1/\mu _2$. The primary flow velocity of the Newtonian and viscoelastic fluid becomes
 $$\begin{gather} U_1=A_1 y^2+a_1 y+b, \end{gather}$$
 $$\begin{gather}U_2=A_2 y^2+a_2 y+b. \end{gather}$$
Here, the coefficients  $A_1,A_2,a_1,a_2$ and
 $b$ are obtained as
 \begin{equation} \left.\begin{array}{@{}c@{}} A_1=\dfrac{A_2}{m},\quad A_2={-}\dfrac{R_2 K}{2}, \\ a_1=\dfrac{K R_2 (m-n^2)}{2 m (m+n)},\quad a_2=m a_1, \\ b=\dfrac{K R_2 ( n + n^2) }{2 (m + n)}. \end{array}\right\} \end{equation}
Here,  $n=W_1/W_2$ and
 $r=\rho _1/\rho _2$. We find an expression for
 $K$ and
 $W_2$ from flow rate, given in Appendix C. Therefore,
 $R_2= (m/r)R_1$. Using the velocity profile of viscoelastic fluid (3.36) the primary viscoelastic stresses ((3.28) and (3.29)) can be obtained as
 $$\begin{gather} \bar{\sigma}_{xx}= \frac{2 Wi}{R_{2p}} ( U'_2)^2, \end{gather}$$
 $$\begin{gather}\bar{\sigma}_{xy}= \frac{U'_2}{R_{2p}}. \end{gather}$$
Here,  $U'_2=2 A_2 y+ a_2$. Together, (3.35)–(3.39) give the flow field corresponding to the primary motion of N–VE coflow in a microchannel under a pressure gradient.
3.2. The perturbation motion and governing equations of stability
Upon substituting the perturbed forms of the fields into the governing equations for a Newtonian fluid ((3.13) and (3.14)) and simplifying, we get the first-order perturbed continuity equation as
 \begin{equation} \frac{\partial{u}'_1}{\partial {x}}+\frac{\partial{v}'_1}{\partial {y}}=0. \end{equation}
The  $x$-momentum equation for Newtonian phase is
 \begin{equation} \frac{\partial{{u}}'_1}{\partial {t}} + U_1 \frac{\partial{u}'_1}{\partial {x}}+ v'_1\frac{\partial{U}_1}{\partial {y}}={-}\frac{1}{r} \frac{\partial{{p}}'_1}{\partial {x}}+ \frac{1}{R_1}\left( \frac{\partial^{2}u'_1}{\partial x^{2}} + \frac{\partial^{2}u'_1}{\partial y^{2}} \right). \end{equation}
The  $y$-momentum equation reduces to
 \begin{equation} \frac{\partial{{v}}'_1}{\partial {t}} + U_1 \frac{\partial{v}'_1}{\partial {x}}={-}\frac{1}{r} \frac{\partial{{p}}'_1}{\partial {y}}+ \frac{1}{R_1}\left( \frac{\partial^{2}v'_1}{\partial x^{2}} + \frac{\partial^{2}v'_1}{\partial y^{2}} \right). \end{equation}
Similarly, perturbations in the governing equations of a viscoelastic fluid ((3.15) and (3.16)) give the first-order perturbed continuity,  $x$ and
 $y$ momentum equations as
 $$\begin{gather} \frac{\partial{u}'_2}{\partial {x}}+\frac{\partial{v}'_2}{\partial {y}}=0, \end{gather}$$
 $$\begin{gather}\frac{\partial{{u}}'_2}{\partial {t}} + U_2 \frac{\partial{u}'_2}{\partial {x}}+ v'_2\frac{\partial{U}_2}{\partial {y}}={-}\frac{\partial{{p}}'_2}{\partial {x}} + \frac{1}{R_{2s}}\left( \frac{\partial^{2}u'_2}{\partial x^{2}} + \frac{\partial^{2}u'_2}{\partial y^{2}} \right) +\frac{\partial \sigma'_{xx}}{\partial x}+\frac{\partial \sigma'_{xy}}{\partial y}, \end{gather}$$
 $$\begin{gather}\frac{\partial{{v}}'_2}{\partial {t}} + U_2 \frac{\partial{v}'_2}{\partial {x}}={-}\frac{\partial{{p}}'_2}{\partial {y}}+ \frac{1}{R_{2s}}\left( \frac{\partial^{2}v'_2}{\partial x^{2}} + \frac{\partial^{2}v'_2}{\partial y^{2}} \right) +\frac{\partial \sigma'_{xy}}{\partial x}+\frac{\partial \sigma'_{yy}}{\partial y}, \end{gather}$$
respectively. Here,  $\sigma '_{xx}$,
 $\sigma '_{xy}$ and
 $\sigma '_{yy}$ are perturbed viscoelastic stress components. From (3.17) these components can be represented as
 \begin{align} &{\sigma}'_{xx}+ Wi \left[\frac{\partial \sigma'_{xx}}{\partial t} +U_2 \frac{\partial{{\sigma}'_{xx}}}{\partial {x}}+v'\frac{\partial \bar{\sigma}_{xx}}{\partial y}-2{\bar{\sigma}_{xx}}\frac{\partial{{u}'_{2}}}{\partial {x}} -2 {\bar{\sigma}_{xy}}\frac{\partial{{u}'_{2}}}{\partial {y}}-2 {{\sigma}'_{xy}}\frac{\partial{{U}_{2}}}{\partial {y}}\right]\nonumber\\ &\quad =\frac{2}{R_{2p}}\frac{\partial u'_2}{\partial x}, \end{align}
 \begin{align} & {\sigma}'_{xy}+ Wi \left[\frac{\partial \sigma'_{xy}}{\partial t} +U_2 \frac{\partial{{\sigma}'_{xy}}}{\partial {x}}+v'\frac{\partial \bar{\sigma}_{xy}}{\partial y}-{\bar{\sigma}_{xx}}\frac{\partial{{v}'_{2}}}{\partial {x}} -{{\sigma}'_{yy}}\frac{\partial{{U}_{2}}}{\partial {y}}\right]\nonumber\\ &\quad =\frac{1}{R_{2p}}\left[\frac{\partial u'_2}{\partial y}+\frac{\partial v'_2}{\partial x}\right], \end{align}
 \begin{align} &{\sigma}'_{yy}+ Wi \left[\frac{\partial \sigma'_{yy}}{\partial t} +U_2 \frac{\partial{{\sigma}'_{yy}}}{\partial {x}}-2{\bar{\sigma}_{xy}}\frac{\partial{{v}'_{2}}}{\partial {x}} \right]=\frac{2}{R_{2p}}\frac{\partial v'_2}{\partial y}. \end{align}
From (3.40) and (3.43),  $u'$ and
 $v'$ can be represented in terms of streamfunction
 $\psi$. Thus,
 \begin{equation} u'=\frac{\partial \psi}{\partial y}, \quad v'={-}\frac{\partial \psi}{\partial x}. \end{equation}
To perform the linear stability analysis, similar to Yih (Reference Yih1967), we consider the perturbation fields as a function of an exponential time factor and assume that they are spatially periodic. For both the Newtonian and viscoelastic phases, these fields can be expressed as follows:
 $$\begin{gather} (\psi_1, p'_1)=\{\chi (y), f_1(y)\} \exp [{\rm i}k(x-c t)], \end{gather}$$
 $$\begin{gather}(\psi_2, p'_2, \sigma'_{xx},\sigma'_{xy},\sigma'_{yy})=\{\phi (y),f_2(y), F_1(y), F_2 (y), F_3 (y)\} \exp [{\rm i}k(x-c t)]. \end{gather}$$
Here,  $k$ and
 $c$ represent the dimensionless wavenumber and complex wave speed, respectively, where
 $c = c_r + \textrm {i} c_i$. These dimensionless quantities are defined as
 $c = \tilde {c}/U_0$ and
 $k = \tilde {k} W_2$, with
 $\tilde {k}$ and
 $\tilde {c}$ denoting the dimensional wavenumber and complex wave speed. The relationship between these dimensional quantities is given by
 $\tilde {c} = \tilde {\omega }/\tilde {k}$, in which
 $\tilde {\omega }$ is the dimensional angular frequency. The stability or instability of the N–VE coflow is determined by the sign of
 $c_i$ (or
 $\omega _i$) (Yih Reference Yih1967; Govindarajan & Sahu Reference Govindarajan and Sahu2014). Substituting (3.49) and (3.50) for the Newtonian fluid in (3.41) and (3.42) after further simplification gives
 $$\begin{gather} {\rm i} k r\{(U_1-c) \chi'-U'_1 \chi\}={-}{\rm i}k f_1+ (r/R_1)(\chi'''- k^2 \chi'), \end{gather}$$
 $$\begin{gather}k^2 r(c-U_1) \chi= f'_1+{\rm i}k (r/R_1)(\chi''- k^2 \chi). \end{gather}$$
Eliminating  $f_1$ from (3.52) and (3.53) gives the Orr–Sommerfeld equation for the Newtonian phase as
 \begin{equation} \chi^{iv}-2 k^2 \chi''+k^4 \chi={\rm i} k R_1 \{ (U_1- c)(\chi''-k^2 \chi)-U''_1 \chi\}, \end{equation}
where  $R_1=R_2 m^{-1} r$. Therefore (3.54) is the same as in Yih (Reference Yih1967). Similarly, substitution of (3.49) and (3.51) in the perturbed equations of the viscoelastic fluid (3.44) and (3.45) gives
 $$\begin{gather} {\rm i}k\{ (U_2-c) \phi'-U'_2 \phi\}={-}{\rm i} k f_2+(1/R_{2s})(\phi'''-k^2 \phi') +{\rm i} k F_1+F'_2, \end{gather}$$
 $$\begin{gather}k^2 (c-U_2) \phi= f'_2+ ({\rm i}k/R_{2s})(\phi''-k^2 \phi') -{\rm i} k F_2-F'_3. \end{gather}$$
By eliminating  $f_2$ from (3.55) and (3.56), we obtain the Orr–Sommerfeld equation for the viscoelastic phase as
 \begin{align} \phi^{iv}-2 k^2 \phi''+k^4 \phi&={\rm i} k R_{2s} \{ (U_2- c )(\phi''-k^2 \phi)-U''_2\phi\}\nonumber\\ &\quad -R_{2s}\{ {\rm i}k F'_1+ F''_2+k^2 F_2-{\rm i} k F'_3\}, \end{align}
where  $F_1$,
 $F_2$ and
 $F_3$ are the amplitudes of the viscoelastic stress, which are a function of the polymer viscosity (
 $\mu _{2p}$) and the relaxation time
 $(\tau )$. Substitution of (3.49) and (3.51) in (3.46)–(3.48) after further simplification gives
 $$\begin{gather} F_1 \{1+ {\rm i} k\, Wi (U_2-c)\}=Wi \{{\rm i}k \bar{\sigma}'_{xx} \phi+2{\rm i}k \bar{\sigma}_{xx} \phi' +2 \bar{\sigma}_{xy} \phi''+ 2 F_2 U'_2 \}+ {\rm i}k \frac{2}{R_{2p}} \phi', \end{gather}$$
 $$\begin{gather}F_2 \{1+ {\rm i} k \, Wi (U_2-c)\}=Wi \{{\rm i}k \bar{\sigma}'_{xy} \phi+ k^2 \bar{\sigma}_{xx} \phi + F_3 U'_2 \} + \frac{1}{R_{2p}} (\phi''+k^2 \phi), \end{gather}$$
 $$\begin{gather}F_3 \{1+ {\rm i} k \, Wi (U_2-c)\}= 2 \,Wi\,\bar{\sigma}'_{xy} k^2 \phi- {\rm i}k \frac{2}{R_{2p}} \phi'. \end{gather}$$
We use (3.58)–(3.60) to analyse the values of  $F_1$,
 $F_2$ and
 $F_3$ in the upcoming sections. Equations (3.57)–(3.60) constitute the governing equations for viscoelastic fluid
 $(\phi )$. For Newtonian fluid,
 $\mu _{2p}= 0, \tau =0$, where
 $Wi\rightarrow 0$ and
 $R_{2p} \rightarrow \infty$, therefore
 $F_1$,
 $F_2$ and
 $F_3$ become zero. Then, (3.57) becomes
 \begin{equation} \phi^{iv}-2 k^2 \phi''+k^4 \phi={\rm i} k R_{2} \{ (U_2- c )(\phi''-k^2 \phi)-U''_2 \phi\}, \end{equation}
which reproduces the Orr–Sommerfeld equation of Yih (Reference Yih1967) for a Newtonian fluid.
In order to solve the Orr–Sommerfeld equation, we consider following boundary conditions: (i) zero normal velocity and no-slip condition at the top and bottom walls, that can be represented as
 $$\begin{gather} \phi(1)=0, \quad \phi'(1)=0, \end{gather}$$
 $$\begin{gather} \chi({-}n)=0, \quad \chi'({-}n)=0. \end{gather}$$
(ii) Continuity of the velocity at the interface. The continuity of  $v'$ at the interface
 $y=0$ gives
 \begin{equation} \phi(0)=\chi(0). \end{equation}
Similar to Yih (Reference Yih1967), we consider the deviation of the interface from the mean position as  $\eta$, where
 $y=\eta$. At
 $\eta$,
 $v'$ becomes
 \begin{equation} v'=\left( \frac{\partial}{\partial t}+U_2 \frac{\partial}{\partial x} \right)\eta={-}{\rm i} k \phi(0) \exp [ {\rm i}k ( x-c t)]. \end{equation}
Therefore,  $\eta$ is obtained as
 \begin{equation} \eta=\frac{\phi(0)}{c'} \exp [ {\rm i}k ( x-c t) ], \quad c'=c-U_2(0). \end{equation}
Similarly, the continuity of  $u'$ at the interface (Yih Reference Yih1967) demands
 \begin{equation} \phi'(0)+\frac{\phi(0)}{c'}U'_2(0)= \chi'(0)+\frac{\chi(0)}{c'}U'_1(0), \end{equation}
which can be simplified as
 \begin{equation} \phi'(0)-\chi'(0)= \frac{\phi(0)}{c'}(a_1-a_2). \end{equation}
(iii) Continuity of shear stress at the interface is expressed as
 \begin{equation} \frac{1}{R_{2s}}\{ \phi''(0)+k^2 \phi(0)\}+ F_2(0)=\frac{r}{ R_{1}}\{ \chi''(0)+k^2 \chi(0)\}. \end{equation}
Similarly, (iv) continuity of normal stress at the interface gives
 \begin{align} &{-}{\rm i}k R_{2s} \{c'
\phi'+a_2 \phi\}-\{\phi'''-k^2 \phi'\}+2k^2 \phi'\nonumber\\
&\quad +{\rm i}rkR_{2s} \{ c' \chi'+a_1 \chi\}+(r
R_{2s}/R_1)\{\chi'''-k^2 \chi'\} \nonumber\\ &\quad -2k^2(r
R_{2s}/R_1)\chi'-{\rm i}k R_{2s} F_1-R_{2s}F'_2 +{\rm i}k
R_{2s} F_3 ={\rm i} k^3 R_{2s} S (\phi/c').
\end{align}
Here,  $\gamma$ indicates the surface tension and
 $S=\gamma /\rho _2 W_2 U_0^2$. The N–VE coflow equations (3.62)–(3.68) are similar to Yih (Reference Yih1967) given for a N–N coflow. However, (3.69) and (3.70) are different and specific to our study. For a Newtonian fluid,
 $\mu _{2p}= 0, \tau =0$, where
 $Wi\rightarrow 0$ and
 $R_{2p} \rightarrow \infty$, therefore
 $F_1, F_2$ and
 $F_3$ become zero, which reproduces the same shear and normal stress boundary condition reported by Yih (Reference Yih1967) for a N–N coflow.
3.3. Solution of the governing equations of stability
The governing equations of the stability analysis for a N–VE coflow considers the differential equations (3.54), (3.57), (3.62)–(3.64) and (3.68)–(3.70), which outline an eigenvalue problem. Moreover, (3.58), (3.59) and (3.60) give the viscoelastic stresses required for the governing equations. By following the method adopted by Yih (Reference Yih1967) for long-wave instability, we expand the eigenfunctions and eigenvalues in a power series of wavenumber  $k$. Similar to Yih (Reference Yih1967) and Li (Reference Li1969), we consider a zeroth- and first-order approximation to get the eigenvalues.
In the zeroth approximation, we ignore all terms containing  $k$ and its higher orders. Therefore, (3.54) and (3.57) reduce to the following:
 $$\begin{gather} \chi^{iv}=0, \end{gather}$$
 $$\begin{gather}\phi^{iv}=0. \end{gather}$$
Here, the boundary conditions given by (3.62)–(3.64) and (3.68) remain the same. In the zeroth approximation,  $\omega '$ is considered as
 $\omega '_0$. However, (3.69) and (3.70) reduce to
 $$\begin{gather} \phi''(0)-m \chi''(0)=0, \end{gather}$$
 $$\begin{gather}\phi'''(0)-m \chi'''(0)=0. \end{gather}$$
Here,  $m=r R_2/R_1=\mu _1/\mu _2$. Solving (3.71) and (3.72) using reduced boundary conditions gives
 $$\begin{gather} \chi_0=1+B_{10}y+C_{10}y^2+D_{10}y^3, \end{gather}$$
 $$\begin{gather}\phi_0=1+B_{20}y+C_{20}y^2+D_{20}y^3, \end{gather}$$
where
 \begin{equation}
\left.\begin{array}{@{}c@{}} B_{10}=\dfrac{4 m+3 m n+n^3}{2
m n(1+n)},\quad B_{20}={-}\dfrac{m+3 n^2+4 n^3}{2 n^2
(1+n)}, \\ C_{10}=\dfrac{m + n^3}{m n^2 (1 + n)},\quad
C_{20}=m C_{10}, \\ D_{10}= \dfrac{ n^2-m}{2 m n^2 (1 +
n)}, \quad D_{20}=m D_{10}. \end{array}\right\}
\end{equation}
Using the above values, the eigenvalue  $c'_0$ is calculated from (3.68), which gives
 \begin{equation} c'_0={-}\frac{2 m n^2 (1+n) (a_1-a_2)}{m^2+4 m n+6 m n^2+4 m n^3+n^4}. \end{equation}
The solution of the zeroth approximation is the same as given in Yih (Reference Yih1967) for N–N coflow.
In the first approximation, we consider terms up to the first order of  $k$. Therefore (3.54) and (3.57) become
 \begin{align} \chi^{iv}_1&={\rm i} k R_1 \{ (U_1- c_0 )\chi''_0-2 A_1 \chi_0\}, \end{align}
 \begin{align} \phi^{iv}_1&={\rm i} k R_{2} \{ (U_2- c_0 )\phi''_0-2 A_2 \phi_0\}-4{\rm i}k \frac{R_2}{R_{2p}} Wi (U'_2 \phi''_0)'\nonumber\\ &\quad -{\rm i} k\frac{R_2}{ R_{2p}} Wi [ U''_2 \phi_0-2~U'_2 \phi'_0-(U_2-c_0) \phi'' ]''. \end{align}
Here, in (3.80), the second and third terms on the right-hand side come from the viscoelastic stress tensor, obtained by simplifying  $F_1$,
 $F_2$ and
 $F_3$ in (3.58)–(3.60). The general solution of (3.79) and (3.80) can be written as
 $$\begin{gather} \chi_1=B_{11}y+C_{11}y^2+D_{11}y^3+{\rm i}k R_1 h_1(y), \end{gather}$$
 $$\begin{gather}\phi_1=B_{21}y+C_{21}y^2+D_{21}y^3+{\rm i}k R_2 (h_2(y)+ Wi \, h_3(y)). \end{gather}$$
Here,  $h_1(y), h_2(y)$ and
 $h_3(y)$ are obtained as
 $$\begin{gather} h_1(y)=\frac{A_1 D_{10}}{210} y^7+ \frac{a_1 D_{10}}{60} y^6 +\frac{a_1 C_{10}-3 c'_0 D_{10}-A_1 B_{10}}{60} y^5 -\frac{c'_0 C_{10}+A_1}{12} y^4, \end{gather}$$
 $$\begin{gather}h_2(y)=\frac{A_2 D_{20}}{210} y^7+ \frac{a_2 D_{20}}{60} y^6 +\frac{a_2 C_{20}-3 c'_0 D_{20}-A_2 B_{20}}{60} y^5 -\frac{c'_0 C_{20}+A_2}{12} y^4, \end{gather}$$
 $$\begin{gather}h_3(y)={-} \frac{1}{R_{2p}} \left\{ \frac{3 A_2 D_{20} }{5 } y^5+\frac{3 a_2 D_{20}+4 A_2 C_{20}}{6 }y^4 \right\}. \end{gather}$$
The boundary conditions become
 $$\begin{gather} B_{21}+C_{21}+D_{21}+{\rm i}k R_2 \{h_2(1)+Wi \, h_3(1)\}=0, \end{gather}$$
 $$\begin{gather}B_{21}+2C_{21}+3D_{21}+{\rm i}k R_2 \{h'_2(1)+Wi \, h'_3(1)\}=0, \end{gather}$$
 $$\begin{gather}-n B_{11}+ n^2 C_{11}- n^3 D_{11}+{\rm i}k R_1 h_1({-}n)=0, \end{gather}$$
 $$\begin{gather}B_{11}-2nC_{11}+ 3n^2 D_{11}+{\rm i}k R_1 h'_1({-}n)=0. \end{gather}$$
The continuity of shear stress at  $y=0$ (i.e. (3.69)) becomes
 \begin{equation} C_{21}-m C_{11}+ {\rm i}k\, Wi\frac{R_2}{R_{2p}} l_1=0. \end{equation}
Here,  $l_1=A_2-B_{20} a_2+c'_0 C_{20}$. From first approximation, at
 $y=0$, (3.70) is simplified to
 \begin{equation} 6 m D_{11}-6 D_{21}+{\rm i}k R_2 (r-1)(c'_0 B_{20}+ a_2 ) + {\rm i} k\, Wi\frac{R_2}{R_{2p}}l_2=0, \end{equation}
where  $l_2=2(A_2 B_{20}-a_2 C_{20}- 3 c'_0 D_{20} )$. Solving (3.86)–(3.91) gives the coefficients
 $B_{11},C_{11},D_{11},B_{21},C_{21}$ and
 $D_{21}$, whose expressions are given in Appendix C. Thus, the equation for the eigenvalue becomes
 \begin{equation} c_1=\frac{(c'_0)^2 (B_{21}-B_{11})}{a_2-a_1}. \end{equation}
The eigenvalue is obtained as
 \begin{equation} \left.\begin{array}{@{}c@{}} c_1={\rm i} c_i, \\ c_i=k R_2 J_1(m,n,r,A_1)+k R_2 J_2 (Wi,R_{2p},m,n). \end{array}\right\} \end{equation}
Here, the eigenvalue consists of two parts,  $J_1$ is due to the viscosity of the fluid and
 $J_2$ is due to elasticity of the fluid. We can also express (3.93) as
 $c_i=kR_2 J$, where
 $J=J_1+J_2$. Also,
 $J_1$ can be expressed as
 \begin{equation} J_1={-}\frac{m^{{-}1} c_0^{\prime 2}}{a_1-a_2}\left\{m(h_2^{\prime}-2 h_2)-H_1-\frac{2}{n} I_1 +\frac{m-n^2}{2(1+n)}\left(h_2-h_2^{\prime}-\frac{H_1}{n}-\frac{I_1}{n^2}\right)\right\}. \end{equation}
In which
 \begin{equation}
\left.\begin{array}{@{}c@{}} I_1 =r h_1({-}n)-\frac{1}{6}
n^3\{-(r-1)(c_0^{\prime} B_{20}+a_2)\}, \\ H_1 =r
h_1^{\prime}({-}n)+\frac{1}{2} n^2\{-(r-1)(c_0^{\prime}
B_{20}+a_2)\}. \end{array}\right\}
\end{equation}
Similarly,  $J_2$ becomes
 \begin{align} J_2&=\frac{m^{{-}1} c_0^{\prime 2}}{a_1-a_2}Wi\left\{\frac{-3 l_1 m n^2 - l_2 m n^3 + 3 l_1 n^4 - l_2 n^4}{6 n^2 (1 + n) R_{2p}} \right. \nonumber\\ &\quad \left. -\,m(h'_3-2h_3)-\frac{m-n^2}{2(1+n)} (h_3-h'_3) \right\}. \end{align}
For a Newtonian fluid,  $\mu _{2p}= 0, \tau =0$, where
 $Wi\rightarrow 0$ and
 $R_{2p} \rightarrow \infty$, therefore
 $J_2$ becomes zero and
 $J=J_1$. Then (3.93) becomes
 \begin{equation} c_i=k R_2 J_1(m,n,r,A_1), \end{equation}
which reproduces the complex wave speed in a N–N coflow (Yih Reference Yih1967).
4. Results and discussion
In the experimental study, FC40 and SiO-1000 or PEO are infused into the microchannel as phase 1 (P1) and phase 2 (P2), respectively, to establish an immiscible N–N and N–VE coflow system (figure 1a). The flow rates of the FC40 and SiO-1000 phases are varied in the range 20–60  $\mathrm {\mu }$l min
 $^{-1}$ and 0.01–180
 $\mathrm {\mu }$l min
 $^{-1}$, respectively. The flow rate of the PEO phase is kept in the range 0–17
 $\mathrm {\mu }$l min
 $^{-1}$, such that the shear-thinning effects are insignificant (see Appendix B for the viscosity vs shear rate plot), which goes well with our theoretical model. With the above flow rate conditions,
 $R_{1} = ({\rho _{1}\ U_{0} W_{2}}/{\mu _{1}} ) \approx 70{-}400$, and
 $R_{2} = ( {\rho _{2}\ U_{0} W_{2}}/{\mu _{2}} ) \approx 10^{- 5} - 2$, where
 $R_1$ and
 $R_2$ are the Reynolds numbers for phases P1 and P2, respectively. The mean velocity corresponding to the total flow rate (
 $=Q_1+Q_2$) is represented by
 $U_0$. The mean velocities of phases P1 and P2 are determined as
 $U_{01} = {Q_{1}}/{W_{1}H}$ and
 $U_{02} = {Q_{2}}/{W_{2}H}$, respectively. The capillary numbers (
 $Ca$) of the two phases are estimated to be
 ${Ca}_{1} = {\mu _{1}U_{01}}/{\gamma _{12}} \approx 0.001{-}0.1$ and
 ${Ca}_{2} = {\mu _{2}U_{02}}/{\gamma _{12}} \approx 0.001{-}10$, where
 $\gamma _{12}$ is the IFT between the two phases. The flow rate ratio (
 $Q_{r}$) is defined as the ratio
 $( = {Q_{1}}/{Q_{2}} )$ of phase 1 (P1) flow rate to the phase 2 (P2) flow rate. Viscosity ratio (
 $m$) is defined as the ratio
 $( = {\mu _{1}}/{\mu _{2}})$ of the viscosity of P1 phase to that of P2 phase.
We first characterize the coflow system for a range of  $Q_{r}$ and
 $m$ values using the analytical expressions given for the primary flow in § 3.1. Further, we study the variation of velocity fields, interface location and shear stress distribution, which are elaborated in § 4.1. Next, in § 4.2, we illustrate the flow regimes: stable (S) and unstable (U) – waviness and droplet, observed for the different coflow combinations. We also theoretically predict these regimes using the expression for complex wave speed (
 $c_i$) derived in § 3.3. In § 4.3, we initially discuss the difference in the dispersion relation in the case of N–N and the N–VE coflow case. Later we experimentally characterize the behaviour of the axial evolution of the unstable-waviness regime (amplitude
 $A$ and wavelength
 $\lambda$) for different coflow combinations. Finally, in § 4.4, we investigate the unstable-droplet regime, which is of particular interest in microfluidic applications.
4.1. Description of stratified coflow in a microchannel
The instabilities generated due to the viscosity stratification in coflowing fluids strongly depend on the interface location and local velocity variation (Govindarajan & Sahu Reference Govindarajan and Sahu2014). In order to describe the unstable regimes, we first analyse the primary flow (figure 1a) using the theoretical formulations given in § 3.1. This allows us to identify the reference interface location and determine the characteristic velocities for phases P1 and P2.
Initially, we analytically determine the interface location by calculating the low-viscosity (P1) and high-viscosity (P2) stream width ( $W_1$ and
 $W_2$), as detailed in Appendix C.1. The variation of width ratio
 $( {W_{2}}/{W})$ depends on the flow rate ratio (
 $Q_{r}$) and the viscosity ratio (
 $m$). We plot the variation of
 $W_2/W$ with
 $(Q_r m)^{-1}$ at different values of
 $m$ as shown in figure 2(a), where
 $(Q_r m)^{-1}= (Q_2 \mu _2)/(Q_1 \mu _1)$. Here, the plots for different
 $m$ values collapse onto a single curve given by a theoretical fit:
 $W_2/W \approx (1+1.67 (Q_r m)^{1/3})^{-1}$. We use this fit to determine the interfacial location (or fluid stream width ratio) and the local velocity variations. We observe that, with the increase in both flow rate and viscosity of phase P2 (while keeping the phase P1 flow rate and viscosity constant), the width of second phase or
 $W_2$ increases (Hu & Cubaud Reference Hu and Cubaud2018). Owing to the thin layer effect (Renardy & Joseph Reference Renardy and Joseph1985), at very high
 $(Q_r m)^{-1}$ values, the phase 1 shrinks to a small stream width
 $W_1$ which can be obtained as
 $W_1=W-W_2$.
Theoretical study of width ratios, velocity profiles and shear stress distribution. (a) Evolution of fluid stream width ratio  $(W_2/W)$ against
 $(Q_r m)^{-1}=(Q_2/Q_1)(\mu _2/\mu _1)$ for various viscosity ratios (
 $m$), which is represented by a theoretical fit of the form
 $W_2/W \approx (1+1.67 (Q_r m)^{1/3})^{-1}$. (b) Velocity profile of coflow combinations at various
 $m$ values for
 $Q_r=4$ are shown, where phase 1, phase 2 and the interface location are indicated. (c) Interfacial shear stress (
 $\bar {\sigma }_{xy}|_{y=0}$) variation with
 $Q_2/Q_1$ for various
 $m$ values. The viscosity ratios
 $(m=\mu _1/\mu _2)$ are considered as
 $m=1/100$,
 $1/200$,
 $1/250$ and
 $1/500$.

We obtain the flow velocity profiles for various coflow combination with different viscosity ratios at a fixed flow rate ratio ( $Q_{r} = 4.0$) from (3.35)–(3.37), as presented in figure 2(b). It is found that, with decreasing
 $m$, velocity profiles become more skewed, which can give rise to interfacial instability (Hu & Cubaud Reference Hu and Cubaud2018). As expected theoretically (Hazra et al. Reference Hazra, Mitra and Sen2022b), the maximum velocity occurs in P1 phase having a lower viscosity. Therefore, at a fixed flow rate of P2, with decreasing
 $m$, the maximum velocity in P1 phase increases (Hazra et al. Reference Hazra, Mitra and Sen2022b). The variation of interfacial shear stress (
 $\bar {\sigma }_{xy}$) with varying flow rate ratio (
 $Q_{r}$) is depicted in figure 2(c). The interfacial shear stress at
 $y=0$ is calculated as
 $\bar {\sigma }_{xy}|_{y=0} \approx ({1}/{R_2}) ({\partial U_2}/{\partial y})=({r}/{R_1}) ({\partial U_1}/{\partial y})$. The results demonstrate that, for a fixed viscosity ratio (
 $m$), the interfacial shear stress (
 $\bar {\sigma }_{xy}|_{y=0}$) increases with a decrease in the flow rate ratio (
 $Q_{r}$). Additionally, for a fixed
 $Q_{r}$, a decrease in the viscosity ratio (
 $m$) leads to an increase in
 $\bar {\sigma }_{xy}|_{y=0}$. This relationship between
 $\bar {\sigma }_{xy}$ and
 $Q_{r}$ is crucial for understanding the transition between different flow regimes.
4.2. Description of flow regimes
Viscous and elastic stratification give rise to different flow regimes in microfluidic confinements. However, understanding the individual effect of viscosity and elasticity on the total instability is challenging due to the coupled variation of viscosity and elasticity. We conduct experiments and use the formulations given in § 3.3 to explore the decoupled effects of viscous and elastic stratification. In this section, we describe the experimentally observed flow regimes and use the variation of complex wave speed  $(c_i)$ to explain the transition between stable and unstable regimes. The earlier study (Yih Reference Yih1967) for the case of Poiseuille flow of coflowing Newtonian fluids reported only an unstable regime for a fluid density ratio
 $r=1$ and stream width ratio
 $n=1$. However, we observe different flow morphologies: (i) a stable regime (S) with a straight interface, (ii) an unstable regime (U) with wavy interface or droplets (dripping) from low-viscosity fluid; for the case of coflowing Newtonian and viscoelastic fluids. The experimental images of the different regimes observed from a large set of experiments are shown in figure 3(a). The images are captured at a fixed axial location,
 $\tilde {x} \approx 3$ mm with various coflow combinations (at a fixed
 $m$) by varying the flow rate (
 $Q_{2}$) of the high-viscosity fluid, keeping the flow rate (
 $Q_{1}$) of the low-viscosity fluid fixed.
Description of experimentally observed distinct flow regimes via theoretical study depicting the variation of  $J(=J_1+J_2), \ J_1$ (viscous stratification component), and
 $J_2$ (elastic stratification component) and a comprehensive regime plot. (a) Experimental images (pertaining to data points marked with
 $\bigstar$ in c) different regimes: stable (grey), unstable waviness (red) and unstable droplet (blue) are shown in a tabular form for varying flow rate ratio (
 $Q_{r}$) and viscosity ratio (
 $m$). Scale measures 300
 $\mathrm {\mu }$m. (b) Theoretical variation of
 $J$,
 $J_1$, and
 $J_2$ corresponding to (a) for different fluid combinations with fixed
 $Q_1$: (i) FC40-SiO 1000,
 $Q_1 = 45$
 $\mathrm {\mu }$l min
 $^{-1}$, (ii) FC40-PEO 3 %,
 $Q_1 = 50$
 $\mathrm {\mu }$l min
 $^{-1}$, (iii) FC40-PEO 4 %,
 $Q_1 = 45$
 $\mathrm {\mu }$l min
 $^{-1}$ and (iv) FC40-PEO 5 %,
 $Q_1 = 40$
 $\mathrm {\mu }$l min
 $^{-1}$. The colour bands represent the experimental stable (S), unstable-waviness (U-W) and unstable-droplet (U-D) regimes for a range of
 $Q_2$. From theory, the critical values of
 $Q_2$ and
 $J$ for the transition from the stable (S) to the unstable (U) regime are indicated by
 $Q_2^{c1}$ (black vertical dashed line) and
 $J^{c1}$ (black horizontal dashed line). The transition from the unstable-waviness to the unstable-droplet regime is marked by
 $Q_2^{c2}$ (green vertical dashed line) and
 $J^{c2}$ (green horizontal dashed line). (c) Regime plot showing stable coflow (grey), unstable-waviness (red) and unstable-droplet (blue) regimes for FC40-PEO 3 % (triangle symbol, double compound line), FC40-PEO 4 % (square symbol, dash-dot line), FC40-PEO 5 % (diamond symbol, dash-dot-dot line) and FC40-SiO 1000 (circle symbol, dash line) coflow combinations over a range of capillary numbers,
 ${Ca}_{1}$ and
 ${Ca}_{2}$. The subscript 1 and 2 are used for low-viscosity fluid (FC40) and the high-viscosity fluid, respectively. Different versions and colours of the corresponding symbols are used to indicate flow rates (
 $Q_{1}$,
 $Q_{2})$ over which the coflowing fluid combinations undergo various regime transitions, as shown in the legend. A more detailed version of the regime plot is provided in Appendix D.

In general, our experiments (shown in figure 3a) show that instabilities are generated due to the viscosity and elasticity difference between the liquids in a coflow. In this situation, an increase in the flow rate of the high-viscosity fluid causes a transition from stable to convective and eventually to absolute instability (Guillot et al. Reference Guillot, Colin, Utada and Ajdari2007; Utada et al. Reference Utada, Fernandez-Nieves, Gordillo and Weitz2008; Hemachandran et al. Reference Hemachandran, Hoque, Laurell and Sen2021). Transition between the different regimes (stable and unstable) in microfluidic coflows can be understood further using the expression for the complex wave speed ( $c_{i}$) obtained from the temporal stability analysis given in § 3.3, where
 $c_i=k R_2 J$ and
 $J=J_1+J_2$. Generally in a temporal stability analysis, the stability of a system is determined by observing the time evolution of perturbations (Yih Reference Yih1967; Govindarajan & Sahu Reference Govindarajan and Sahu2014). By assuming the wavenumber to be real (
 $k = k_r$), temporal instability is distinguished from spatial instability (Utada et al. Reference Utada, Fernandez-Nieves, Gordillo and Weitz2008). A zero value of the complex wave speed of the perturbations,
 $c_i$, indicates a neutrally stable case. However, if
 $c_i$ is negative (
 $c_i<0$), the disturbances diminish over time, indicating a flat interface in the stable regime. Conversely, if
 $c_i$ is positive (
 $c_i >0$), the disturbances increase exponentially, indicating that the system is unstable. Since our theoretical analysis assumes the wavenumber to be real, we use the above mentioned
 $c_i$ conditions to predict the regimes. The nature of the instability is found to be either convective or absolute. In order to differentiate between these two, a spatio-temporal analysis with the Briggs–Bers criterion is used in the literature (Guillot et al. Reference Guillot, Colin, Utada and Ajdari2007; Utada et al. Reference Utada, Fernandez-Nieves, Gordillo and Weitz2008). The complex wave speed,
 $c_i$, and growth rate,
 $\omega _i$, are related to the wavenumber,
 $k$, by the equation
 $\omega _i = k c_i$, where the values of
 $\omega _0$ and
 $k_0$ are obtained from
 $D(\omega _0, k_0)=0$ and
 $v_{group}=\partial \omega / \partial k |_{\omega =\omega _0, k=k_0}$ (Huerre & Monkewitz Reference Huerre and Monkewitz1990; Sahu & Govindarajan Reference Sahu and Govindarajan2014). Finally, the regimes obey the following conditions with regards to the instability: (i) convectively unstable,
 $\omega _i>0, v_{group}>0$; (ii) absolutely unstable,
 $\omega _i>0, v_{group}<0$.
First, we investigate the effect of viscous stratification by considering the case of N–N coflows: FC40-SiO 1000 ( $m = 1/250$). As mentioned in the earlier § 3.3, the formulations for
 $c_i$ reduces to (3.97) for the case of a FC40-SiO 1000 coflow, where the elastic stratification (Weissenberg number,
 $Wi\approx 0$) effects become negligible (
 $J_2=0$,
 $J=J_1$) and the instabilities are generated only due to the variation in the viscous stratification (
 $J_1$). Through (3.94)–(3.97), we obtain the variations in
 $J_1$,
 $J_2$,
 $J$ and
 $c_i$ for a wide range of values of
 $r$ and
 $n$, and represent for the case of a FC40-SiO 1000 coflow having
 $m=1/250$ and
 $r=1.89$ via figure 3(b-i). As
 $Q_2$ increases, the viscosity stratification causes
 $J_1$ to increase – flipping from a negative to a positive value. Further,
 $J_1$ becomes maximum at a substantially high flow rate (
 $Q_2$) as shown in figure 3(b-i). At the same time, the fluid stream width ratio (
 $W_2/W$) and shear stress follow the trend as explained in the previous section and shown in figure 2. Since at lower
 $Q_2$,
 $J_1 < 0$, therefore
 $c_i < 0$, where
 $c_i = R_2 k J_1 = R_2 k J$; which indicates a stable regime. Here, due to the high viscosity difference, the width of the high-viscosity phase (P2) is greater than that of the low-viscosity phase (P1) even at a smaller
 $Q_2$ and the shear stresses at interface is less (refer figure 2), which stabilizes the flow (Charru & Hinch Reference Charru and Hinch2000; Govindarajan & Sahu Reference Govindarajan and Sahu2014). In order to characterize the transition between stable and unstable regimes, we define the critical parameters:
 $Q_r^{c1}$ and
 $J^{c1}$, where
 $Q_r^{c1}$ is the critical flow rate ratio,
 $Q_r^{c1}=Q_1/Q_2^{c1}$ and
 $J^{c1}$ corresponds to the neutrally stable condition. Beyond
 $Q_2 > 17$
 $\mathrm {\mu }$l min
 $^{-1}$ (in figure 3b-i with the critical flow ratio for S–U regime transition being
 $Q_{r}^{c1} \approx 2.65$), the system becomes unstable with
 $J_1 > 0$,
 $J > 0$ and
 $c_i > 0$. Here, the normal stress difference starts to exceed the Laplace pressure, causing the interface to deform. The stable (S), unstable-waviness (U-W) and unstable-droplet (U-D) regimes experimentally observed at different ranges of the flow rates are depicted using colour bands in figures 3(b-i) to 3(b-iv). The variation of
 $J$ aligns with our experimental observations, as shown in figures 3(a-i) and 3(b-i). Low positive values of
 $J$ indicate an unstable regime with waviness, where the shear stress is optimal. At extreme values of
 $J$ (or at higher P2 phase velocity), FC40 cannot withstand the higher shear stress at the interface and breaks into droplets, which occurs when
 $c_i > 0$ and
 $v_{group} < 0$, leading to absolute instability (Huerre & Monkewitz Reference Huerre and Monkewitz1990; Guillot et al. Reference Guillot, Colin, Utada and Ajdari2007; Utada et al. Reference Utada, Fernandez-Nieves, Gordillo and Weitz2008). In a similar way, we experimentally define the critical parameters for the transition between waviness and the droplet realm within the unstable regime:
 $Q_r^{c2}$ and
 $J^{c2}$, where
 $Q_r^{c2}$ is the critical flow rate,
 $Q_r^{c2}=Q_1/Q_2^{c2}$. By directly comparing the experiments with the theory as shown in figure 3(b-i), we find
 $Q_r^{c2} \approx 1.125$ and
 $J^{c2} \approx 3.8$.
So far, we have discussed the sole effect of viscous stratification in the case of a N–N coflow inside a microchannel. Further, we extend this discussion to the combined effect of viscous and elastic stratification in the case of a N–VE coflow, as shown in figures 3(a-ii–iv) and 3(b-ii–iv). Here, the competition between viscous stratification ( $J_1$) and elastic stratification (
 $J_2$) governs the dynamics and hence determines the flow regimes. In the case of FC40-PEO 3 % coflow (N–VE,
 $m = 1/200$,
 $\tau = 0.009$ s), an increase in
 $Q_2$ leads to a transition from the stable (S) regime to the unstable (U) regime, similar to the FC40-SiO 1000 coflow case (see figures 3a-i and 3b-i). However, the transition from stable to unstable occurs at a lower
 $Q_2$ (or a higher
 $Q_{r}^{c1} \approx 4.55$) compared with FC40-SiO 1000 coflow. This difference is mainly due to the elastic stratification effect and the higher viscosity ratio (
 $m = 1/200$) in the FC40-PEO 3 % system. In this case, the variation of
 $J_1$ is minimal at lower
 $Q_2$ and more at higher
 $Q_2$, as shown in figure 3(b-ii). Elastic stratification causes a non-monotonic variation in
 $J_2$ with increasing
 $Q_2$. Initially,
 $J_1 \approx 0$,
 $J_2 < 0$ and
 $|J_2| > |J_1|$, resulting in
 $J < 0$ and
 $c_i < 0$, indicating a stable regime, as seen in experiments. With further increases in
 $Q_2$ (or decrease in
 $Q_r$),
 $J_2$ becomes positive (
 $J_2 > 0$) and
 $J_2 > J_1$, which give rise to
 $J > 0$ and
 $c_i > 0$, indicating an unstable regime, as shown in figure 3(b-ii). We further experimentally distinguish the transition between unstable waviness and unstable droplet (in figure 3a). The extra normal stress from the elasticity of phase 2 (
 $J_2 > 0$) helps to break the FC40 phase into droplets at lower interfacial shear stress as compared with the N–N coflow case, occurring when
 $c_i > 0$ and
 $v_{group} < 0$, leading to absolute instability (Huerre & Monkewitz Reference Huerre and Monkewitz1990; Guillot et al. Reference Guillot, Colin, Utada and Ajdari2007; Utada et al. Reference Utada, Fernandez-Nieves, Gordillo and Weitz2008). An earlier study (Azaiez & Homsy Reference Azaiez and Homsy1994) reported that an Oldroyd-B fluid is significantly more stable than a Newtonian fluid, with elasticity effects stabilizing the flow. However, in our study, we observed a contrasting phenomenon where elastic effects can destabilize the flow. Specifically, in the case of FC40-PEO 3 %, the elastic effects of the viscoelastic fluid stabilize the coflow at higher flow rate ratios but destabilize the flow at lower flow rate ratios. Moreover, viscous stratification also destabilizes the flow at lower flow rate ratios. The combined destabilization effects of viscous and elastic stratification shift the critical flow rate ratio for regime transition and convective to absolute instability transition to a lower
 $Q_2$ (or to a higher flow rate ratio) value as compared with the viscous case without elastic effects. In our study, we obtained
 $Q_{r}^{c1} \approx 4.55$ (with
 $J^{c1} \approx 0$) and
 $Q_{r}^{c2} \approx 3.85$ (with
 $J^{c2} \approx 2.13$). Thus our findings show that, in contrast to the previous study (Azaiez & Homsy Reference Azaiez and Homsy1994), elasticity can both stabilize and destabilize coflows depending on the flow rate ratio, thus demonstrating that the role of elasticity in flow instability is more complex and varies with fluid and flow parameters.
To explore further variations in the viscous and elastic properties of the fluid in the unstable regimes, we replace phase 2 (the high-viscosity phase) with PEO 4 % and PEO 5 %, where the viscosity and relaxation time are further increased compared with PEO 3 % (refer to table 1). The FC40-PEO 4 % ( $m=1/750$,
 $\tau =0.03$ s) and FC40-PEO 5 % (
 $m= 1/2250$,
 $\tau =0.06$ s) cases show a stark contrast to the previous cases. Interestingly, we observe that the instability of the interface is suppressed with increasing phase 2 flow rate (
 $Q_2$), leading to transitions from unstable (U) to stable (S) regimes, as shown in figure 3(a-iii,iv). In both cases, the very high viscosity contrast causes an initial increase in
 $J_1$ with
 $Q_2$, followed by a decrease at high
 $Q_2$ due to the thin layer effect, which is more evident in the case of FC40-PEO 4 %, depicted in figure 3(b-iii,iv). However, the increase in relaxation time or the Weissenberg number (
 $Wi$) compared with PEO 3 % changes the effects of elastic stratification. With an increase in
 $Q_2$,
 $J_2$ becomes more and more negative with a magnitude far higher than
 $J_1$. At lower
 $Q_2$ (or higher flow rate ratio),
 $J_1 > 0$ and
 $J_2 < 0$, where viscous stratification tends to destabilize the flow and elastic stratification tends to stabilize it. However, since
 $|J_1| > |J_2|$, viscous stratification suppresses elastic stratification, resulting in
 $J > 0$ and
 $c_i > 0$, indicating an unstable regime, as seen in experiments (figure 3b-iii,iv). In contrast, at higher
 $Q_2$ (or low flow rate ratio),
 $J_1 > 0$,
 $J_2 < 0$ and
 $|J_2|> |J_1|$, which shows that the elastic effects generated in the flow due to elastic stratification suppresses the viscous stratification undulations, resulting in
 $J < 0$ and
 $c_i < 0$, indicating a stable regime. It is important to mention that the unstable regime for both combinations of fluids shows only waviness in the interface. As evident from figures 3(b-iii,iv) and 2(a), with increasing
 $Q_2$, the elastic effects dominate and the P1 phase width (
 $W_{1}$) becomes thinner (‘thin layer effect’), which prevents the interface breaking into droplets (Renardy & Joseph Reference Renardy and Joseph1985). Overall, in the case of a fluid with very high viscosity (or very small
 $m$) and relaxation time (or high
 $Wi$), the elastic effects of the viscoelastic fluid stabilize the flow at lower flow rate ratios (Azaiez & Homsy Reference Azaiez and Homsy1994), while viscous stratification destabilizes it at higher flow rate ratios. The critical flow rate for the unstable to stable transition is found to be
 $Q_{r}^{c1} \approx 9$ for the FC40-PEO 4 % combination and
 $Q_{r}^{c1} \approx 13.33$ for the FC40-PEO 5 % combination.
The regimes described above are obtained by varying the flow rate of phase 2 (high-viscosity fluid),  $Q_2$ at fixed phase 1 (low-viscosity fluid) flow rate,
 $Q_1$. To generalize the flow regimes for various
 $Q_1$ and
 $Q_2$ combinations, we describe the flow regimes in terms of the capillary numbers of the two coflowing phases,
 $Ca_1$ and
 $Ca_2$ (Anna Reference Anna2016), presented in figure 3(c) (see Appendix D for a more detailed regime plot). In the case of FC40-SiO 1000 coflow (N–N,
 $m = 1/250$), we observe a transition from the stable (S) to the unstable-droplet (U-droplet) regime for
 $Ca_1 < 0.01$ and a transition from stable to unstable-waviness (U-waviness) to U-droplet regime for
 $Ca_1 > 0.01$ as shown in figure 3(a-i,b-i,c). This transitional behaviour of stable to U-waviness to U-droplet continues even at higher
 $Ca_1$ (see Appendix D). In the case of FC40-PEO 3 % coflow (N–VE,
 $m = 1/200$), for a small
 $Ca_1$ (i.e.
 $Ca_1 < 0.005$), an increase in
 $Ca_2$ leads to a transition from the stable regime to the U-droplet regime. For higher
 $Ca_1$ (i.e.
 $Ca_1 > 0.005$), we observe that the stable coflow (S) regime first changes to the U-waviness regime and eventually the P1 phase breaks into droplets, giving rise to the U-droplet regime, as shown in figure 3(a-ii,b-ii,c). At even higher
 $Ca_1$ (i.e.
 $Ca_1 > 0.01$), we only observe a stable regime, which can be attributed to the ‘thin layer effect’ (Renardy & Joseph Reference Renardy and Joseph1985) that dominates at a higher
 $Ca_2$. However, in the case of FC40-PEO 4 % and FC40-PEO 5 % coflows, we observe only unstable to stable transitions with increasing
 $Ca_2$ at all values of
 $Ca_1$ as shown in figure 3(a-iii,iv,b-iii,iv,c). Previous studies reported that, at high
 $Ca$ values, the growth of instabilities is suppressed, the flow becomes stable and droplets are not formed (Azaiez & Homsy Reference Azaiez and Homsy1994; Ambravaneswaran et al. Reference Ambravaneswaran, Subramani, Phillips and Basaran2004; Hemachandran et al. Reference Hemachandran, Hoque, Laurell and Sen2021). In contrast, we observe droplet generation even at high
 $Ca$ in a variety of Newtonian and viscoelastic coflowing fluid combinations, and report that using N–VE combination with moderate relaxation times (PEO
 $\lesssim$3 %) allows for control of the critical capillary number, which demarcates the U-waviness and U-droplet regimes.
Based on the preceding analysis, we have identified distinct unstable-waviness and unstable-droplet regimes that significantly differ from the stable configuration. These findings are supported by both experimental observations and theoretical insights. In the following sections, we will experimentally explore and delineate the physical characteristics of these regimes.
4.3. Parametric study of unstable-waviness regime
The propagation of the instability waves are characterized by frequency  $\tilde {f}$, wavelength
 $\tilde {\lambda }$, wave speed
 $\tilde {c}$ and amplitude
 $\tilde {A}$, where
 $\tilde {c}=\tilde {\omega }/\tilde {k}=\tilde {f} \tilde {\lambda }$. A dispersion relation in the instability analysis provides the information about the space–time variation of the perturbations. Therefore, we delve into the dispersion relations for both N–VE and N–N coflows using experiments and theory. In experiments, the flow rate ratio (
 $Q_{r}$) is gradually changed, and frequency (
 $\tilde {f}$) and wavelength (
 $\tilde {\lambda }$) are measured for each case, thus angular frequency
 $\tilde {\omega }_r= 2{\rm \pi} \tilde {f}$ and wavenumber (
 $\tilde {k} = {2{\rm \pi} }/\tilde {{\lambda }})$ are calculated. From experimental videos, for each
 $Q_{r}$, we calculate
 $\tilde {f}$ by counting the number of peaks/troughs formed at a fixed axial location per second and
 $\tilde {\lambda }$ is calculated as the distance between two adjacent troughs (figure 1a-ii). Subsequently, these values are used to calculate
 $\tilde {\omega }$ and
 $\tilde {k}$. It is observed that wavelength,
 $\tilde {\lambda }$ for the N–VE coflow (
 $\tilde {\lambda } \approx 1200$
 $\mathrm {\mu }$m) is higher than that for the N–N coflow (
 $\tilde {\lambda } \approx 800$
 $\mathrm {\mu }$m) (for
 $Q_{r}=6.25$ and 4.55, respectively), as shown in figure 4(a). When
 $Q_2/Q_1$ (or
 $Q_r^{-1}$) increases, frequency (
 $\,\tilde {f}$) increases but wavelength (
 $\tilde {\lambda }$) for both N–VE and N–N cases decreases significantly, as evident from figure 4. This suggests that both dimensionless wavenumber
 ${k}$ (
 $=\tilde {k} W_2$) and angular frequency
 ${\omega _r}$ (
 $\widetilde {\omega _{r}} W_2/U_0$) follow a similar trend of variation, as shown in figure 4(b). We find an expression for
 $\omega _r$ from (3.78), where
 $c_0=c'_0+b$,
 $c_0=\tilde {c}_0/U_0$. Therefore
 $\tilde {\omega }_r=\tilde {c}_0 \tilde {k}$, can be represented as
 $\tilde {\omega }_r=\tilde {k} U_0 c'_0+\tilde {k} U_0 b$. Here, the variation of dimensionless wavenumber,
 ${k}$ with angular frequency,
 ${\omega }$ for N–VE and N–N coflows obtained from experiments and theory show a good agreement, as shown in figure 4(b). The variation of wavenumber,
 ${k}$ with angular frequency,
 ${\omega }_{r}$ for the N–N coflow and N–VE coflow cases follow a similar trend but with a different slope. The percentage deviation of
 $k$ between theory and experiments is less than 10 %.
Variation of wave wavelength and frequency, and the dispersion relation for N–VE and N–N coflowing combinations. (a) Experimental images showing variation of wavelength with flow rate ratio,  $Q_{r}$ for N–VE and N–N coflow at
 $\tilde {x} \sim 3$ mm. (b) Experimental fit and theoretical variation of
 $k$ vs
 $\omega _{r}$ (dispersion relation) for N–VE and N–N coflow. (c) Variation of wave frequency,
 $\tilde {f}$ with
 $Q_{r}$. (d) Variation of wave wavelength,
 $\tilde {\lambda }$ with
 $Q_{r}$. Scale represents 300
 $\mathrm {\mu }$m.

Now we look into the effect of flow conditions and fluid properties on the physical characteristics of the unstable-waviness nature of the instability, by characterizing in terms of the dimensionless wavelength  $\lambda \ (=\tilde {\lambda }/W_2)$ and amplitude
 $A (=\tilde {A}/W_2)$. The axial evolution of instability for different coflow combinations is captured at various axial locations (
 $\tilde {x}$), which is depicted in figure 5. In most cases, we observe that instability is suppressed along the channel length downstream. It is also evident that the decay in
 $A$ is accompanied by an increase in
 $\lambda$, as shown in figure 5, suggesting a complex relationship between the two parameters. We investigate the variation of
 $A$ with
 $x$ for a range of flow rate ratios (
 $Q_r$) as well as for the corresponding capillary number ratios (
 $Ca_r=Ca_1/Ca_2$) in figure 6.
Experimental images of axial evolution of instability of FC40-SiO 1000, FC40-PEO 3 %, FC40-PEO 4 % and FC 40-PEO 5 %, coflow.

Experimental variation of amplitude,  $A$ vs
 $x$ for (a) FC40-SiO 1000, (b) FC40-PEO 3 %, (c) FC40-PEO 4 % and (d) FC40-PEO 5 % coflow. The dashed lines indicate the experimental fit of the form
 $A \approx A_0 \,\textrm {e}^{-k_i x}$, where
 $k_i$ is the decay rate.

The axial variations in amplitude  $A$ for different coflow combinations are depicted in figure 6. With an increase in
 $Q_r$,
 $A$ decreases across all coflow combinations, reflecting reduced fluid field perturbations due to viscous and elastic stratification. As discussed in figure 5, the amplitude
 $A$ of waviness decays along the majority of the channel length, modelled as
 $A \propto \textrm {e}^{-k_i x}$, where
 $k_i$ represents the complex wavenumber, indicating the decay rate with
 $x$. Experimental data in figure 6 give
 $k_i$ values: (i) FC40-SiO 1000,
 $k_i \approx 0.0125{-}0.0160$; (ii) FC40-PEO 3 %,
 $k_i \approx 0.0069{-}0.0089$; (iii) FC40-PEO 4 %,
 $k_i \approx 0.0118{-}0.0194$; and (iv) FC40-PEO 5 %,
 $k_i \approx 0.0112{-}0.0308$. These values indicate the maximum decay rate for FC40-PEO 5 % and the minimum for FC40-PEO 3 %, which follow the variation of viscosity
 $\mu _{{PEO} \ 3\,\%}<\mu _{{SiO}-1000}<\mu _{{PEO} \ 4\,\%} <\mu _{{PEO} \ 5\,\%}$ and relaxation time
 $\tau _{{PEO} \ 3\,\%}<\tau _{{PEO} \ 4\,\%} <\tau _{{PEO} \ 5\,\%}$. This indicates the effects of varying viscous and elastic stratification along the channel, which cause elongation of the wavelet, as indicated by blue arrows in figure 5. In addition to the decreasing trend of
 $A$, an increasing trend in amplitude is observed for FC40-SiO 1000 in figure 6(a) for
 $\tilde {x} > L/2$, where wavelets contract, leading to an increase in the amplitude. The evolution of amplitude
 $A$ along
 $x$ is intricately linked with wavelength
 $\lambda$, as shown in Appendix E. For FC40-PEO 3 % and FC40-SiO 1000 coflows, experimental findings yield
 $\tilde {A}^{m}\tilde {\lambda }^{n} = \tilde {A}\tilde {\lambda }^{1.7} = \textrm {constant} \sim 10^7$, where
 $\tilde {A}$ and
 $\tilde {\lambda }$ are in
 $\mu m$ (see Appendix E). Additionally, the visco-capillary length scale
 $\ell _c$ is calculated to determine whether wavelengths fall in the long- or short-wave regime:
 $Ca = {\mu _{2}{\dot {\gamma }}_{2}l_{c}}/{\gamma _{12}} \sim 1$ gives
 $l_{c} \approx {{\gamma _{12}}/{\mu _{2}{\dot {\gamma }}_{2}}} \sim 100$
 $\mathrm {\mu }$m. Considering the channel width
 $W \approx 300$
 $\mathrm {\mu }$m as a reference geometric length scale, it can be inferred that
 $\lambda > \ell _c$ and
 $\lambda > W$, suggesting a long-wave regime.
4.4. Droplet generation regime
Finally, we investigate the mechanism of droplet generation for FC40-PEO 1.7 %, FC40-PEO 3 % and FC40-SiO 1000 coflow combinations. In the above cases, time lapse images are captured at a location,  $\tilde {x} \approx 5$ mm to observe the time evolution of the interfaces. In the case of FC40-PEO 1.7 % with
 $m \approx 1/20$ and FC40-PEO 3 % with
 $m \approx 1/200$, from § 4.2, we get
 $c_i>0$,
 $v_{group}<0$ leading to the absolute instability (Huerre & Monkewitz Reference Huerre and Monkewitz1990; Guillot et al. Reference Guillot, Colin, Utada and Ajdari2007; Utada et al. Reference Utada, Fernandez-Nieves, Gordillo and Weitz2008; Sahu & Govindarajan Reference Sahu and Govindarajan2014), wherein instability would increase over time, resulting in breaking of the FC40 phase into droplets. From experimental results shown in figure 7(a), we observe that the interface deforms significantly and assumes
 $\tilde {\lambda } \approx 400$
 $\mathrm {\mu }$m before the FC40 phase breaks into drops. Variation of the local vertical distance of the marked point (initially
 $\tilde {y} = 80$
 $\mathrm {\mu }$m at
 $\tilde {t} < 0$ s) on the interface from lower/P1 sidewall (figure 7b, FC40-PEO 1.7 % case) is measured with time and presented in a
 $\tilde {y}$ vs
 $\tilde {t}$ plot (figure 7b). Droplet pinching first initiates (at
 $\tilde {t} = 0$ s) at some distance downstream of the marked point but gradually the droplet pinching point recedes to the left until it reaches the marked point beyond which it stabilizes. Hence the amplitude of the interfacial disturbance increases for
 $0\ \textrm {s} < \tilde {t} < 1\ \textrm {s}$. Subsequently, we do not observe any further leftward movement of the pinching point (figure 7b) and the amplitude of interfacial disturbance remains fixed at
 ${\sim }80\ \mathrm {\mu } \textrm {m}$ for
 $1\ \textrm {s} < t < 2\ \textrm {s}$, implying the pinching event is periodic. Similar to FC40-PEO 3 %, in FC40-SiO 1000 coflow, increasing
 $Q_2$ leads to breaking of the FC40 phase into droplets when
 $c_i>0$ and
 $v_{group}<0$, shown in figure 3. The droplet generation phenomenon is studied by capturing high-speed videos for sufficient duration
 $({\sim }4\ \textrm {s})$. The flow rate ratio (
 $Q_{r}$) for FC40-PEO 1.7 %, FC40-PEO 3 % and FC40-SiO 1000 coflow combinations, is kept constant at
 $Q_{r} \sim 2.78$, 3.85 and 2.33, respectively.
(a) Experimental time lapse images of droplet generation for FC40-PEO 1.7 %, FC40-PEO 3 % and FC40-SiO 1000 coflows. (b) Time evolution of interface distance from lower (P1) sidewall for FC40-PEO 1.7 % coflow. Droplet breakup point and  $t_{pinch}$ is shown for zoomed-in view of an interval of
 $0.1$ s.

Generally, the droplet generation is associated with a pinch-off time  $\tilde {t}_{pinch}$, which can be considered as the time between two successive droplet pinch offs, as described in the literature (Guerrero et al. Reference Guerrero, Chang, Fragkopoulos and Fernandez-Nieves2019). In the present case of stratified coflow,
 $\tilde {t}_{pinch}$ can be calculated from the time gap between the two consecutive droplet pinch offs for
 $1\ \textrm {s} < \tilde {t} < 2\ \textrm {s}$, as shown in figure 7(b), wherein the amplitude of instability is constant. Using this argument, a small interval of 0.1 s from a
 $\tilde {y}$ vs
 $\tilde {t}$ plot (figure 7b) is analysed and we get
 $\tilde {t}_{pinch} \sim 0.01$ s. The droplet pinch-off time for the FC40-SiO 1000 coflow combination can be similarly obtained as
 $0.07$ s.
In summary, here we investigated interfacial instabilities resulting from the coflow of N–N and N–VE fluids within a microfluidic confinement. Our theoretical formulations elucidate the experimentally observed regimes and their transition, where we discuss the decoupled influences of viscous and elastic stratification. Additionally, we analyse the dispersion relation, variations in wavelet amplitude and wavelength and the phenomena of droplet formation. Our findings are pertinent to a wide array of applications in microfluidics, including: chemical, biological and biochemical applications.
5. Conclusions
We investigated the interfacial instability in microfluidic coflow systems of N–N fluid FC40 – SiO-1000 and N–VE fluids (N–VE) FC40 – PEO 1.7 %, FC40 – PEO 3 %, FC40 – PEO 4 %, and FC40 – PEO 5 %. The instabilities generated inside a microchannel show a strong dependency on the interface location, flow conditions and fluid properties. From theory, we obtained the interface location, velocity profiles across channel width and variation of the interfacial shear stress for various coflow combinations, and determined the stream width ratio of different flow combinations using the theoretical fit relation:  $W_2/W \approx (1+1.67 (Q_r m)^{1/3})^{-1}$.
We performed a linear stability analysis and developed analytical expressions for the complex wave speed  $c_i$ corresponding to the instability growth rate,
 $\omega _{i}$ and the dispersion relation (
 $k$ vs
 $\omega _{r}$) for both N–N and N–VE coflow systems. The final expression for
 $c_i$ is divided into two parts considering
 $J_1$ and
 $J_2$, where
 $J_1$ takes care of the instability variations due to viscous stratification and
 $J_2$ accounts for the elastic stratification. We express
 $c_i=k R_2 J$, where
 $J=J_1+J_2$. On the basis of
 $c_i$, we characterized the system into two regimes:
 $c_i<0$ for a stable regime with a flat interface and
 $c_i >0$ for an unstable regime with either waviness (unstable waviness) along the interface or droplets (unstable droplet) emanating from the low-viscosity fluid. We presented the regimes in a comprehensive regime plot for all fluid combinations in terms of the capillary numbers of the phases and by considering the properties of the interfacial flows, the physical mechanisms behind the transitions among these regimes are discussed in detail. The regimes (stable, unstable waviness and unstable droplet) and the transitions among the regimes are found to be a consequence of the individual contributions from the viscous and the elastic stratification components, which are functions of the fluidic properties and flow parameters. We showcased a range of possible flow regimes with various coflow combinations, corresponding to the capillary numbers of the two fluids. For a typical combination of the capillary numbers, higher viscosity ratio and lower elasticity of the coflow systems result in a transition from stable to unstable waviness to unstable droplet; while for lower viscosity ratio and higher elasticity of the coflow systems, transition happens from unstable waviness to the stable regime.
Our analysis attempted to decouple the viscous and elastic effects and explain the root cause of the observed interfacial behaviour at different experimental conditions. Depending upon the coflow combination and fluidic conditions, the sign and the magnitude of  $J_1$ and
 $J_2$ vary with the flow rate and the relative competition between the two decides the nature of the instability (stable or unstable). We found that, in the case of moderately elastic and high viscosity ratio fluids, at high flow rate ratios, elastic stratification stabilizes the flow, dominating over the effect of viscous stratification; and at low flow rate ratios, elastic stratification de-stabilizes the flow, adding up to the de-stabilizing effect of viscous stratification. This combined destabilization effect results in advancing of the transition of the stable to the unstable regime to a lower flow rate of the high-viscosity fluid. We also found that in the case of highly elastic and low viscosity ratio fluids, at high flow rate ratios, viscous stratification de-stabilizes the flow, dominating over the stabilizing effect of elastic stratification; and at low flow rate ratios, elastic stratification stabilizes the flow, dominating over the de-stabilizing effect of viscous stratification.
In order of uncover the physical characteristics of the observed instabilities, we delineated the axial variation of amplitude  $(A)$ and wavelength
 $(\lambda )$ using experiments and estimated the decay rate of instabilities along the channel length. We also investigated the mechanism of droplet generation, which is of particular interest in microfluidics applications. We elucidated the role of absolute instability and found out the droplet pinch-off time for periodic droplet generation. In contrast to the reported literature, we are able to prevent the suppression of the interfacial instability growth at higher capillary numbers and thus enable droplet generation even at such high capillary number conditions in a variety of Newtonian and viscoelastic coflow systems. This enables control of transition between the unstable-waviness and unstable-droplet regimes. Our investigation will facilitate the advancement of our present understanding of interfacial instability in microfluidic coflow and the identification of hydrodynamic conditions for seamless microfluidic application.
Supplementary movies
Supplementary movie is available at https://doi.org/10.1017/jfm.2024.993.
Acknowledgements
The authors would like to extend appreciation to CNNP, IIT Madras for facilitating device fabrication.
Funding
The authors acknowledge support from IIT Madras via project no. RF21220988MERFIR008509, and by the Ministry of Human Resources and Development, Government of India, through the Institute of Eminence (IoE) project no. SB22231233MEETWO008509 via grant no. 11/9/2019-U.3(A).
Declaration of interests
The authors report no conflict of interest.
Appendix A. Details of device fabrication
The microchannel devices are fabricated with PDMS by using standard photolithography and soft lithography procedures outlined as follows. A photomask is designed in AutoCAD 2015 and printed (JD Photo Data, UK). Silicon wafer used for photolithography process is cleaned using RCA1, RCA2 and HF dip followed by DI water rinse and placed in an oven for 2 min at 120  $^\circ$C to remove moisture. Photoresist SU8 2075 (MicroChem Corp, Newton, USA) is spun coated onto the wafer at 2100 rpm for 30 s with an acceleration of 300 rpm s
 $^{-1}$. Soft baking is done at 65
 $^\circ$C for 5 min followed by 95
 $^\circ$C for 10 min. The photoresist is exposed to UV light through the photomask for 30 s. Post-exposure bake is done at 65
 $^\circ$C for 2 min followed by 95
 $^\circ$C for 8 min. Then, the UV exposed wafer is developed to obtain the silicon master with an SU8 pattern on top of it, which is then placed in an oven at 100
 $^\circ$C for 30 min to further improve adhesion between photoresist and wafer. Dimensions of the SU8 pattern are verified using the optical surface profiler Veeco NT-1100 profiler and a confocal microscope to scan the surfaces with an incident light source and measure the emissive, reflective or refractive light to acquire information about the surface topography. The PDMS monomer and curing agent (Sylgard-184, Silicone Elastomer kit, Dow Corning, USA) are mixed at a ratio of 10:1 by weight, and the mixture is degassed in a desiccator to remove air bubbles trapped during mixing. The PDMS is poured onto the silicon master, which is then cured inside a vacuum oven at 75
 $^\circ$C for 1 h. Post curing, the hardened PDMS layer containing the channel structure is peeled off the silicon master and cut to size. Fluidic access holes for the inlet/outlet and the pressure taps are punched using a 1.5 mm biopsy punch (Med Morphosis LLP, Pondicherry, India). The PDMS layer containing the microchannel structure is bonded to a glass slide using an oxygen plasma bonder (Harrick Plasma, USA). In the fabricated device, the expanded channel section has a width of 300
 $\mathrm {\mu }$m and depth 100
 $\mathrm {\mu }$m.
Appendix B. Viscosity variation
The variations of viscosity  $(\mu )$ with shear strain rate
 $(\dot {\gamma })$ for various fluids: SiO 1000, PEO 1.7 %, PEO 3 %, PEO 4 % and PEO 5 % are shown in figure 8. The flow rates of the PEO phases are kept such that the shear rate
 $(\dot {\gamma })\lesssim 30$ s
 $^{-1}$, so that the shear-thinning effects are insignificant.
Variation of viscosity  $(\mu )$ with shear strain rate
 $(\dot {\gamma })$ for Newtonian (SiO 1000) and viscoelastic (PEO 1.7 %, PEO 3 %, PEO 4 % and PEO 5 %) fluids. The working ranges of shear strain rates for viscoelastic fluids are indicated by a vertical dash-dotted line and arrow.

Appendix C. The differential system governing stability solution
C.1. Calculation of pressure gradient and fluid stream width
To calculate the pressure gradient term,  $K$ from the fluid flow rate, we consider flow rate of phase 2 and determine the average velocity. This involves taking the area average of
 $U_2$ (see (3.36)) over the interval from
 $y=0$ to
 $y=1$, and then multiplying by the area of fluid flow
 $(W_2 h)$. By equating this result with the known flow rate of phase 2 (
 $Q_2$), the final expression of
 $K$ becomes
 \begin{equation} K=\frac{(1+n) (Q_2/Q_0)}{R_2 \{{-}1/6+(m+2n+n^2)/(4m+4n)\} }. \end{equation}
In this context,  $Q_0$ represents the total flow rate in the channel,
 $R_2$ is the Reynolds number of phase 2 and
 $m$ and
 $n$ are the viscosity ratio (
 $m=\mu _1/\mu _2$) and stream width ratio (
 $n=W_1/W_2$), respectively. The value of
 $n$ can be determined experimentally, numerically or theoretically.
Similar to  $K$, we calculate
 $n$. We consider the flow rate of phase 1 and determine the average velocity (from (3.35)) over the interval
 $y=0$ to
 $y=-n$. By equating this with the known flow rate of phase 1 (
 $Q_1$), and using (C1), the final expression of
 $n$ is simplified into a fourth-order equation, given by
 \begin{equation} n^4+4 m n^3-3 m n^2 (Q_r-1)-4 m Q_r n -m^2 Q_r=0, \end{equation}
where  $Q_r= Q_1/Q_2$. The solution to (C2) yields four possible solutions. Among these, the acceptable solution for our case is
 \begin{equation} n=\tfrac{1}{2}\{{-}2m+G_1^{1/2}+G_2^{1/2}\}, \end{equation}
where  $G_1$ and
 $G_2$ are given by
 \begin{align} G_1&=m+4 m^2+3m ({-}1+Q_r)-m Q_r+\frac{m^2 (1+Q_r)^2}{G_3}+G_3, \end{align}
 \begin{align} G_2&={-}m+8 m^2+3m ({-}1+Q_r)+m Q_r-\frac{m^2 (1+Q_r)^2}{G_3}-G_3\nonumber\\ &\quad -\frac{4m(4m^2+3m({-}1+Q_r)-2Q_r)}{G_1^{1/2}}, \end{align}
where  $G_3$ is given by
 \begin{align} G_3&=\{{-}8m^4 Q_r-m^3 Q_r^3-9m^3 Q_r^2+9m^3 Q_r+m^3+8m^2 Q_r^2-[m^4 ({-}m^2 (1 + Q_r)^6 \nonumber\\ &\quad + (8m^2 Q_r - 8 Q_r^2 + m ({-}1 - 9 qr + 9 Q_r^2 + Q_r^3))^2)]^{1/2}\}^{1/3}. \end{align}
From the solution of  $n$, the ratio
 $W_2/W$ can be expressed as
 $W_2/W=1/(1+n)$. We plot this ratio for various values of
 $m$ in figure 2 and obtain the correlation,
 $W_2/W \approx \{ 1+1.67(Q_r m)^{1/3}\}^{-1}$.
C.2. Coefficients of first approximation
The coefficients of first approximation are
 \begin{align} B_{11}& =\frac{{\rm i} k {R_2} }{6m n (n+1) {R_{2p}}} \{9 {h_1} n r {R_{2p}}+12 h_1 r {R_{2p}}+3h'_1 n^2 r {R_{2p}}\nonumber\\ &\quad +6h'_1 n r {R_{2p}}+3 (h_2+h_3) n^3 {R_{2p}}\nonumber\\ &\quad -3 (h'_2+h'_3) n^3 R_{2p} +3 l_1 n^3 Wi-l_{2} n^3 Wi-(r-1)(c'_0 B_{20} a_2) n^3 {R_{2p}}\}, \end{align}
 \begin{align} B_{21}&= \frac{{\rm i} k R_2 }{6 n^2 (n+1) R_{2p}}\{{-}3 h_1 r R_{2p}-3h'_1 n r R_{2p}-3 (h_2+h_3) (4 n+3) n^2 R_{2p}\nonumber\\ &\quad+3 (h'_2+h'_3) (2 n+1) n^2 R_{2p} +3 l_1 n^2 \,Wi+l_{2} n^3\, Wi+(r-1)(c'_0 B_{20} a_2) n^3 R_{2p}\}, \end{align}
 \begin{align} C_{11}&=\frac{{\rm i} k R_2}{3m n^2 (n+1) R_{2p}} \{3 h_1 r R_{2p}+3h'_1 n r R_{2p}+3 (h_2+h_3) n^3 R_{2p}-3 (h'_2+h'_3) \nonumber\\ &\quad n^3 R_{2p}+3 l_1 n^3\, Wi -l_{2} n^3 \,Wi-(r-1)(c'_0 B_{20} a_2) n^3 R_{2p}\}, \end{align}
 \begin{align} C_{21}&=\frac{{\rm i} k R_2 }{3 n^2 (n+1) R_{2p}}\{3 h_1 r R_{2p}+3h'_1 n r R_{2p}+3 (h_2+h_3)n^3 R_{2p}\nonumber\\ &\quad -3 (h'_2+h'_3) n^3 R_{2p}-3 l_1 n^2 \,Wi -l_{2} n^3 \,Wi-(r-1)(c'_0 B_{20} a_2) n^3 R_{2p}\}, \end{align}
 \begin{align} D_{11}&={-}\frac{{\rm i} k R_2 }{6m n^2 (n+1) R_{2p}}\{3 h_1 r R_{2p}+3h'_1 n r R_{2p}-3 (h_2+h_3) n^2 R_{2p}\nonumber\\ &\quad +3 (h'_2+h'_3) n^2 R_{2p}-3 l_1 n^2 \,Wi +l_{2} n^2 \,Wi+(r-1)(c'_0 B_{20} a_2) n^2 R_{2p}\}, \end{align}
 \begin{align} D_{21}&=\frac{{\rm i} k R_2 }{6 n^2 (n+1) R_{2p}}\{{-}3 h_1 r R_{2p}-3h'_1 n r R_{2p}+3 (h_2+h_3) n^2 R_{2p}-3 (h'_2+h'_3) n^2 R_{2p}\nonumber\\ &\quad +3 l_1 n^2 \,Wi +l_{2} n^3 \,Wi+(r-1)(c'_0 B_{20} a_2) n^3 R_{2p}\}. \end{align}
Here,  $c'_0$,
 $h_1$,
 $h_2$ and
 $h_3$ are obtained from (3.78), (3.83), (3.84) and (3.85), respectively.
Appendix D. Regime plot - detailed
The regime plot detailing various regimes – stable, unstable-waviness and unstable-droplet are shown through figure 9.
Description of the experimentally observed distinct flow regimes via a comprehensive regime plot. (a) Experimental images (pertaining to data points marked with  $\bigstar$ in b) of different regimes: stable coflow (grey), unstable waviness (red) and unstable droplet (blue) are shown in a tabular form for varying flow rate ratio (
 $Q_{r}$) and viscosity ratio (
 $m$). Scale measures 300
 $\mathrm {\mu }$m. (b) Regime plot showing stable coflow (grey), unstable-waviness (red) and unstable-droplet (blue) regimes for FC40-PEO 3 % (triangle symbol, double compound line), FC40-PEO 4 % (square symbol, dash-dot line), FC40-PEO 5 % (diamond symbol, dash-dot-dot line) and FC40-SiO 1000 (circle symbol, dash line) coflow combinations over a range of capillary numbers,
 ${Ca}_{1}$ and
 ${Ca}_{2}$. The subscripts 1 and 2 are used for low-viscosity fluid (FC40) and high-viscosity fluid, respectively. Different versions and the colours of corresponding symbols are used to indicate flow rates (
 $Q_{1}$,
 $Q_{2})$ for which the coflowing fluid combinations undergo regime transitions, shown in the legend.

Appendix E. Relationship between the amplitude and the wavelength
In order to relate the variation of amplitude and wavelength of instabilities present in the unstable-waviness regime, we consider the case of FC40-SiO 1000 and FC40-PEO 3 % coflows. For these coflowing combinations, we experimentally find that  $\tilde {A}^{m} \tilde {\lambda }^{n} = \tilde {A} \tilde {\lambda }^{1.7} = \textrm {constant} \approx 10^7$, where
 $\tilde {A}$ and
 $\tilde {\lambda }$ are in
 $\mathrm {\mu }$m. The variation of amplitude and wavelength is shown in figure 10.
Relationship between the amplitude  $(\tilde {A})$ and the wavelength
 $(\tilde {\lambda })$. The experimental fit is of the form:
 $\tilde {A} \tilde {\lambda }^{1.7} \approx 1.83 \times 10^7$ with the goodness of fit = 0.83.



