1. Introduction
Transition to turbulence is a major challenge in the aerodynamic design of vehicles. Some consequences include heating and enhanced momentum transfer in boundary layers, resulting in drag and surface heat-transfer penalties. High-speed boundary layers exhibit several pathways to transition (e.g. see Morkovin Reference Morkovin1969), depending on the disturbance environment. Among these, the most explored are the linear mechanisms driven by the instabilities of the base flow, which are thought to be relevant in low-disturbance flight environments.
It is well known that the most rapidly growing instability in high-speed boundary layers (typically above Mach  $4$) is the second-mode, or Mack-mode (Mack Reference Mack1975, Reference Mack1984). At Mach numbers relevant to hypersonic flight vehicles, this inviscidly unstable mode exhibits growth rates that can be up to approximately five times (Özgen & Kırcalı Reference Özgen and Kırcalı2008) those observed in the Tollmien–Schlichting (also referred to as the first-mode) instability. Receptivity studies trace the origin of the second-mode in adiabatic hypersonic boundary layers (HBLs) to a discrete stability mode, which is initiated in the slow acoustic spectrum near the leading edge (Fedorov Reference Fedorov2003, Reference Fedorov2011), with a phase speed,
 $(1-1/M_\infty )$. The linear regime of this instability has also been examined in several early experimental (Wilkinson Reference Wilkinson1997; Schneider Reference Schneider2013) and computational (Pruett & Chang Reference Pruett and Chang1995; Ma & Zhong Reference Ma and Zhong2003) studies.
Reliable prediction and mitigation of transition in HBLs also require detailed understanding and characterization of nonlinear and secondary instability (Herbert Reference Herbert1988) growth in the second-mode. Although the most highly amplified waves of the second-mode instability are two-dimensional (2-D), secondary instabilities that precede turbulent breakdown itself are usually oblique. Under natural conditions, these oblique modes generally gain prominence after the 2-D waves are nonlinearly saturated. Such undulations of the second-mode could also be induced due to the presence of a first-mode instability, as noted in the direct numerical simulations (DNS) of Khotyanovsky & Kudryavtsev (Reference Khotyanovsky and Kudryavtsev2016). Exploration of this regime thus requires careful quantification of the competing mechanisms involved.
Craig et al. (Reference Craig, Humble, Hofferth and Saric2019) explain the challenges associated with experimental quantification of this nonlinear regime. The presence of superharmonics of the fundamental second-mode exposes limitations in frequency responses of measurement systems. Other experimental campaigns include the non-intrusive measurements by Casper, Beresh & Schneider (Reference Casper, Beresh and Schneider2014) of the nonlinear evolution of the second-mode instability within wavepackets in a Mach  $6$ boundary layer, which eventually broke down into turbulent spots. High-speed schlieren imaging has also enabled spectral, time-frequency and topology analyses on second-mode disturbances at hypersonic speeds, as reported in Laurence, Wagner & Hannemann (Reference Laurence, Wagner and Hannemann2016).
The relevant modal and non-modal interactions in this regime can be faithfully captured by carefully performed high-resolution simulations. In particular, DNS anchored in experiments and interpreted within the constructs of linear theory, can provide crucial insights into the nonlinear and breakdown stages of the second-mode instability. For example, Pruett & Chang (Reference Pruett and Chang1995) studied the nonlinear stages of second-mode oblique waves using DNS of HBLs over a Mach  $8$ cone. A major advantage of DNS is that it provides a means to effectively isolate the initialization of specific candidate waves and their effects on the routes to transition. Franko & Lele (Reference Franko and Lele2013) simulated transition induced by second-mode instabilities through fundamental resonance and oblique mode breakdown; the latter effected an overshoot in heat transfer rates. Controlled excitation using wavepackets and harmonic waves by Sivasubramanian & Fasel (Reference Sivasubramanian and Fasel2014, Reference Sivasubramanian and Fasel2015) have quantified the relative dominance of fundamental (K-type) resonance mechanisms in hypersonic cones over subharmonic (H-type) resonance. Topological changes associated with enhanced compressibility of HBLs have also been identified as shown in Jocksch & Kleiser (Reference Jocksch and Kleiser2008), where the near-wall region of nonlinear wavepackets contains spanwise coherent structures associated with second-mode instability, even in the late-transitional stages.
In the current work, we perform a DNS-based study of the route to transition in a Mach  $6$ boundary layer by following the evolution of a second-mode instability wave. The goal is to provide a comprehensive picture of the entire sequence of key developments during transition to turbulence, including linear amplification, nonlinear saturation, secondary instability growth and eventual breakdown into a fully turbulent state. Since many of the fundamental features are obtained in a suitably configured flat-plate boundary layer, this canonical base flow is chosen to facilitate the exposition of intricacies in the modal dynamics of the second-mode pathway to transition.
High-resolution numerical schemes with minimal artificial dissipation greatly facilitate the resolution of the broad spectrum of spatio-temporal scales as they evolve during the different stages of transition (see e.g. Hader & Fasel Reference Hader and Fasel2019). The method employed in this work is described in § 2. The controlled generation of second-mode instability waves is described in § 3; briefly, wall blowing–suction is employed with parameters informed by linear stability analysis. Using the concept of  $FS$-synchronization (Ma & Zhong Reference Ma and Zhong2003; Fedorov & Tumin Reference Fedorov and Tumin2011), the streamwise location where the phase speeds of the slow and the fast discrete modes merge are identified. This ensures that the instability growth downstream is induced by the linear instability of the second-mode constituted by the slow discrete mode (mode
 $S$). Wang, Zhong & Ma (Reference Wang, Zhong and Ma2011) identify the receptivity of HBLs which causes actuators that are located upstream of the
 $FS$-synchronization location to induce mode
 $S$ amplification at downstream locations, consistent with linear stability theory (LST) predictions.
The DNS can be utilized to effectively identify the multidimensional variations in the nonlinearly saturated second-mode instability, along with the distortions induced in the base flow. At nonlinear amplitudes, modifications of the ‘rope-shaped’ density-field structures of the second-mode instability, consistent with experimental observations, have been reported in Egorov, Fedorov & Soudakov (Reference Egorov, Fedorov and Soudakov2006). Section 4 addresses this regime using nonlinearly forced 2-D DNS, to highlight major deviations from the linear response, which include a second region of amplification downstream of the zone of linear instability. The effects of saturation are further quantified by decomposing the nonlinear response into its orthogonal modes, representing the fundamental and its superharmonics.
The numerical approach also allows for a seamless extension of the analysis to the late transitional regime encompassing realistic breakdown scenarios. This requires judicious choice of the three-dimensional (3-D) perturbations to initiate the breakdown. In this context, computations of secondary instabilities in a Mach  $4.5$ boundary layer by Adams & Kleiser (Reference Adams and Kleiser1996) identify subharmonic resonance as a viable route to transition, when the 2-D mode is allowed to naturally distort in the presence of random noise. Franko & Lele (Reference Franko and Lele2013) showed that imposing specific spanwise wavenumbers can realize controlled transition routes of fundamental resonance and oblique breakdown. A simple random forcing approach by Hader & Fasel (Reference Hader and Fasel2018) to account for realistic wind tunnel effects, resulted in transition over a flared cone, with spectral and heat-transfer characteristics consistent with controlled second-mode fundamental resonance. In this study, we adopt an approach that follows the technique of Adams & Kleiser (Reference Adams and Kleiser1996), where a 2-D second-mode instability is excited in the HBL, in the presence of background random perturbations. This narrows the transition route to that initiated by second-mode instability, but allows the receptivity of the system to choose the preferred modes of secondary instabilities and eventual breakdown. The 3-D simulation which captures the breakdown of the instability wave is presented in § 5, where the vortical structures are analysed to identify various stages of nonlinear evolution and length scales present in the HBL.
Spectral characterization of the unsteady flow field can help quantify crucial aspects such as nonlinear saturation and breakdown. Laurence et al. (Reference Laurence, Wagner and Hannemann2016) utilizes time-resolved and time-averaged frequency spectra to identify the presence of second-mode wavepackets, as well as localized turbulent activity in HBLs. Section 6 details spectral analyses, where the one-dimensional (1-D) energy spectra are utilized to compare the DNS data with the turbulent spectrum. In addition, wavenumber–frequency analysis is performed to study the effect of oblique modes on the second-mode instability (see e.g. Novikov, Egorov & Fedorov Reference Novikov, Egorov and Fedorov2016).
While first-order spectra identify the presence of specific frequencies/wavenumbers in a signal, higher-order spectral analyses can yield insights into nonlinear coupled interactions that result in new frequencies/wavenumbers. First- and higher-order spectra (generalized as polyspectra) correspond to the Fourier transforms of the cumulants of the signal (Mendel Reference Mendel1991). For example, power spectrum of a signal,  $\phi (t)$, is obtained as the Fourier transform of the second-order cumulant,
 $C_2(\tau )=E\{\phi (t)\phi (t+\tau )\}$ (also the auto-correlation function), whereas bispectrum is the Fourier transform of the third-order cumulant,
 $C_3(\tau _1,\tau _2)=E\{\phi (t)\phi (t+\tau _1)\phi (t+\tau _2)\}$.
 $E\{.\}$ is the expectation operator. Kimmel & Kendall (Reference Kimmel and Kendall1991) have utilized this second-order spectral representation (bispectrum) to study nonlinear interactions within second-mode instabilities. We utilize the bispectrum to identify coupled interactions in the saturated second-mode, which result in harmonics, spectral broadening and mean flow distortions, that have been previously reported in experimental studies. Following this, the global form of the fundamental and subharmonic modes crucial to these interactions are extracted. The final section, § 7, discusses the near-wall effects of transition, resulting in skin-friction variations in the transitional HBL. Due to the prolonged transition zone of the second-mode instability wave (Franko & Lele Reference Franko and Lele2013), a complete breakdown to turbulence in HBLs resulting from this transition route is relatively less explored. Hence, the near-wall analysis is also extended to the fully turbulent regions of the HBL. Finally, correlation analyses and probability distributions are utilized to extract the dominant length scales and qualitative trends in high-velocity patches, which form localized regions of intense skin friction.
2. Numerics
The governing equations are the unsteady 3-D compressible Navier–Stokes equations, formulated for generalized curvilinear coordinates in the strong-conservation form:
 \begin{equation} \frac{\partial}{\partial \tau} \left(\frac{\boldsymbol{Q}}{J}\right) = -\left[\left(\frac{\partial \boldsymbol{F_i}}{\partial \xi} + \frac{\partial \boldsymbol{G_i}}{\partial \eta} + \frac{\partial \boldsymbol{H_i}} {\partial \zeta}\right) +\frac{1}{Re} \left(\frac{\partial \boldsymbol{F_v}}{\partial \xi} + \frac{\partial \boldsymbol{G_v}}{\partial \eta}+ \frac{\partial \boldsymbol{H_v}}{\partial \zeta}\right)\right]. \end{equation}
The conserved variable vector is denoted by  $\boldsymbol {Q}=[\rho ,\rho u,\rho v, \rho w, \rho E]^{\textrm {T}}$, where
 $\rho$ is the density,
 $(u,v,w)$ are the Cartesian components of velocity and
 $E={T}/{(\gamma -1){M_\infty }^2}+(u^2+v^2+w^2)/2$, is total specific internal energy. Here,
 $T$ is the temperature,
 ${M_\infty }$ is the reference free stream Mach number and
 $\gamma$ is the ratio of the specific heats. The ideal gas law,
 $p=\rho T/{\gamma {M_\infty }^2}$, is assumed, where
 $p$ is pressure. Also,
 $J=\partial {(\xi ,\eta ,\zeta ,\tau )}/\partial {(x,y,z,t)}$ is the Jacobian of the coordinate transformation. Inviscid fluxes along the coordinates, (
 $\xi , \eta , \zeta$), are represented by
 $(\boldsymbol {F_i}, \boldsymbol {G_i}, \boldsymbol {H_i})$.
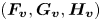 $(\boldsymbol {F_v}, \boldsymbol {G_v}, \boldsymbol {H_v})$ are the corresponding viscous fluxes. Further details on the formulation can be found in Vinokur (Reference Vinokur1974) and Anderson, Tannehill & Pletcher (Reference Anderson, Tannehill and Pletcher1984).
Denoting dimensional numbers with  $(.)^*$, the Reynolds number,
 $Re$, is defined as,
 $Re=\rho _\infty ^{*}U_\infty ^{*}L^{*}/\mu _\infty ^{*}$, where subscript
 $\infty$ denotes free stream conditions,
 $U$ and
 $\mu$ are velocity and dynamic viscosity, respectively and
 $L^{*}$ is a reference length scale. The pressure is normalized as
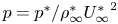 $p=p^{*}/\rho _\infty ^{*}{U_\infty ^{*}}^2$. The Prandtl number,
 $Pr$, is assumed to be
 $0.72$ and
 $\gamma =1.4$. Sutherland's law is used to obtain temperature dependence of viscosity.
The discretized equations are solved in a finite difference framework using a high-order approach to ensure sufficient resolution of the wide range of scales involved in the transition phenomena of interest. The high edge-Mach-number gives rise to relatively strong shocklets in the nonlinearly distorted and turbulent regions of the boundary layer; this necessitates robust shock-capturing schemes. These requirements are balanced using a shock detector routine (Bhagatwala & Lele Reference Bhagatwala and Lele2009), which locally lowers the order of reconstruction in the vicinity of discontinuities. A schematic representation of the approach is provided in figure 1. The situation considers a shock, ‘ $S$’, present at grid point,
 $i$. Points from
 $i-5$ to
 $i+5$ (denoted ‘
 $M$’) represent the vicinity of the shock, where primitive variables are reconstructed using a third-order modified upwind scheme for conservation laws (MUSCL) based scheme, along with the application of the van Leer harmonic limiter (van Leer Reference van Leer1979), to minimize grid-scale oscillations. At locations away from the shock (denoted ‘
 $W$’), a seventh-order weighted essentially non-oscillatory (WENO) reconstruction (Balsara & Shu Reference Balsara and Shu2000) is performed on the characteristic variables. The inviscid fluxes are then computed using the Roe scheme (Roe Reference Roe1981). Viscous fluxes are discretized using the fourth-order central scheme. An implicit time-integration approach is adopted using the second-order diagonalized (Pulliam & Chaussee Reference Pulliam and Chaussee1981) Beam–Warming approximate factorization (Beam & Warming Reference Beam and Warming1978).
Schematic showing the shock-capturing technique. Here, ‘ $S$’ denotes the shock location; ‘
 $M$’ indicates shock vicinity, where third-order reconstruction is used; and ‘
 $W$’ indicates locations where seventh-order reconstruction is used.

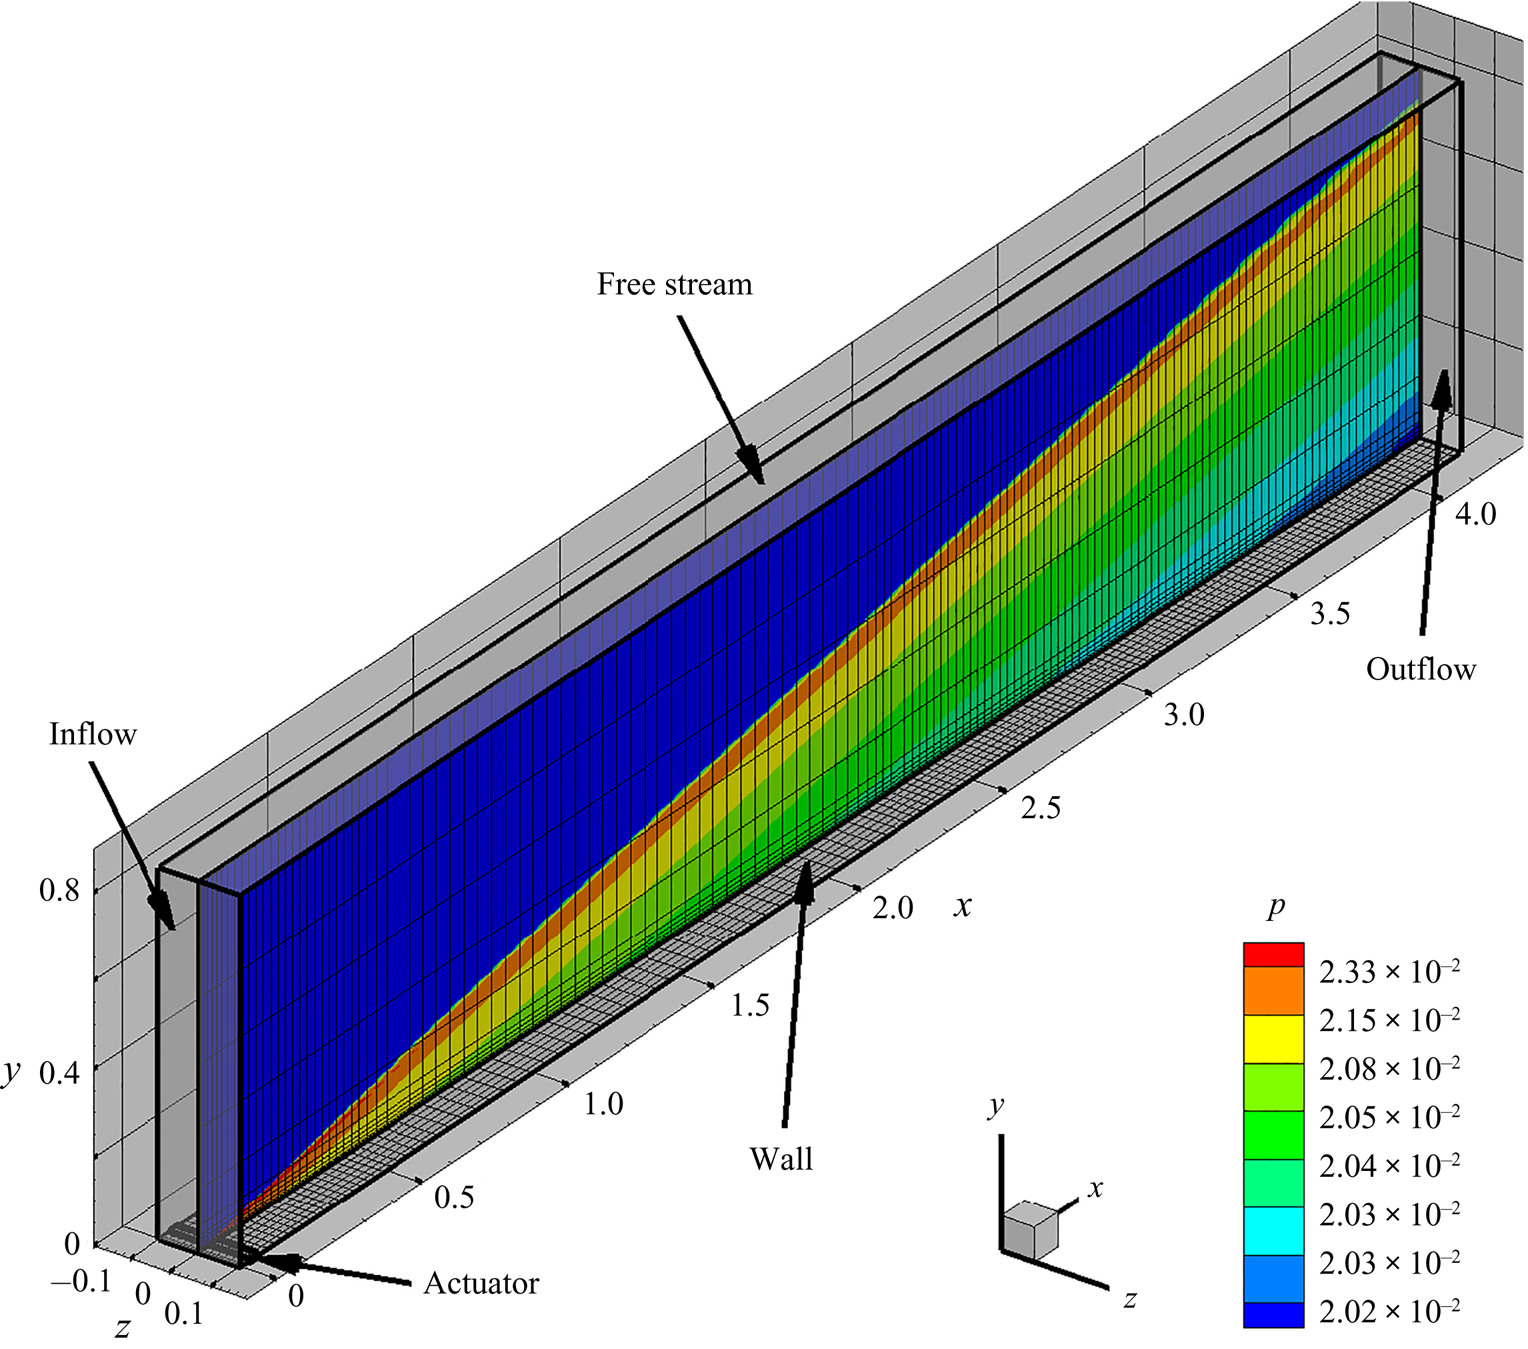
The flow field consists of a boundary layer, developing over an adiabatic flat plate with a sharp leading edge. The free stream conditions correspond to those described in Egorov et al. (Reference Egorov, Fedorov and Soudakov2006), with  $Re=2\times 10^6$ and
 $M_\infty =6$. The computational domain and the laminar flow field are presented in figure 2, for reference.
 $(x,y,z)$ are the Cartesian coordinates, corresponding to the streamwise, wall-normal and spanwise directions, respectively. For clarity, every
 $20$th node is displayed in the wall-normal and spanwise directions, and every
 $40$th node is displayed in the streamwise direction. The computational domain spans
 $0 \le x \le 4.2$,
 $0 \le y \le 0.85$ and
 $-0.1\le z \le 0.1$, where,
 $x=0$ coincides with the leading edge of the plate. Laminar pressure contours are also shown on the midspan plane, and the wall-normal extent ensures that the leading edge shock is captured within the domain. The grid is clustered near the leading edge and the wall, and a uniform grid spacing is used in the spanwise direction. A sponge zone is created through aggressive grid stretching beyond
 $x > 4$ and
 $y > 0.65$, to minimize reflections from the boundaries. The computational domain is resolved using
 $5,531$,
 $301$ and
 $121$ nodes in the streamwise, wall-normal and spanwise directions, respectively. Based on fully turbulent boundary layer parameters at the outflow, the grid resolution in wall units are as follows:
 ${\rm \Delta} x^+ = 2.5$,
 ${\rm \Delta} y^+ = 0.3$ and
 ${\rm \Delta} z^+ = 6.9$. This grid resolution was deemed sufficient after comparisons with results obtained on a relatively coarser grid. The appendix summarizes these comparative studies in the transitional and turbulent regions of the HBL.
Computational domain along with the boundaries, as indicated. The location of the upstream actuator is also marked on the plate surface. A midspan plane is shown along with pressure contours of the laminar flow.

The inflow plane is a supersonic inlet boundary, where free stream values are imposed on all primitive variables. The zero-streamwise-gradient condition is applied on the downstream outflow boundary. Similarly, the zero-wall-normal-gradient condition is applied on the free stream boundary. The surface of the plate is a no-slip, adiabatic wall. Periodic boundary conditions are used in the spanwise direction. The actuator used to excite instabilities in the HBL is modelled as a blowing–suction slot, which introduces harmonic perturbations in wall-normal momentum,  $q_w=\rho _w v_w$. Following Egorov & Novikov (Reference Egorov and Novikov2016), this is defined as
 \begin{equation} q_w(x,z,t)=\rho_w v_w=A\sin\left(2{\rm \pi}\frac{x-x_1}{x_2-x_1}\right)\sin(\omega_A t). \end{equation}
The amplitude of the spanwise homogeneous wave,  $A$, depends on whether the analysis is linear or nonlinear, and is defined in the relevant sections below. The frequency of forcing,
 $\omega _A$, and its upstream and downstream limits,
 $x_1$ and
 $x_2$, respectively, are obtained from linear stability analysis, as described in the following section.
The initial simulations used to characterize the linear and nonlinear properties of the second-mode instability are 2-D in nature, which solves the 2-D form of (2.1). The spatial schemes, boundary conditions and the actuator model are identical to those described above for the 3-D simulations. Time integration of the 2-D equations are performed using the nonlinearly stable third-order Runge–Kutta scheme (Shu & Osher Reference Shu and Osher1988).
In the following sections, we study the evolution of the second-mode instability through the linear, nonlinear and transitional regimes. The first step is to initiate the correct disturbances by identifying suitable wave parameters using linear analysis.
3. Linear analysis
The unstable frequencies and corresponding wavelengths are estimated with a temporal framework because of its simplicity (Malik Reference Malik1990). For this, the laminar basic state is assumed to be 1-D, and the Navier–Stokes equations are linearized following Reynolds decomposition. The perturbations are composed of waves defined by streamwise and spanwise wavenumbers,  $\alpha$ and
 $\beta$, respectively, with circular frequency,
 $\omega$. The Reynolds decomposition and the wave ansatz for any primitive variable,
 $\phi$, can be represented as
 \begin{equation} \phi = \bar{\phi} + \phi ',\quad \phi ' = \hat{\phi}(y)\exp({\textrm{i}(\alpha x + \beta z - \omega t)}), \end{equation}
where  $\overline {(.)}$ and
 $(.)'$ are time-averaged and perturbation quantities, respectively. The resulting eigenvalue problem is solved to obtain the complex eigenvalues,
 $\omega$, for specified real wavenumbers,
 $\alpha$ and
 $\beta$. Since second-mode instability is associated with 2-D waves which exhibit the highest growth rates (Malik Reference Malik1990; Yao et al. Reference Yao, Krishnan, Sandham and Roberts2007), we use
 $\beta =0$.
For adiabatic walls, the second-mode instability is associated with the so-called mode  $S$, which is a discrete eigenmode originating from the slow continuous acoustic spectrum (see e.g. Fedorov Reference Fedorov2003, Reference Fedorov2011). With increasing downstream distance from the leading edge, as the growth rate of this mode becomes positive (unstable), the phase speed of mode
 $S$ synchronizes with that of mode
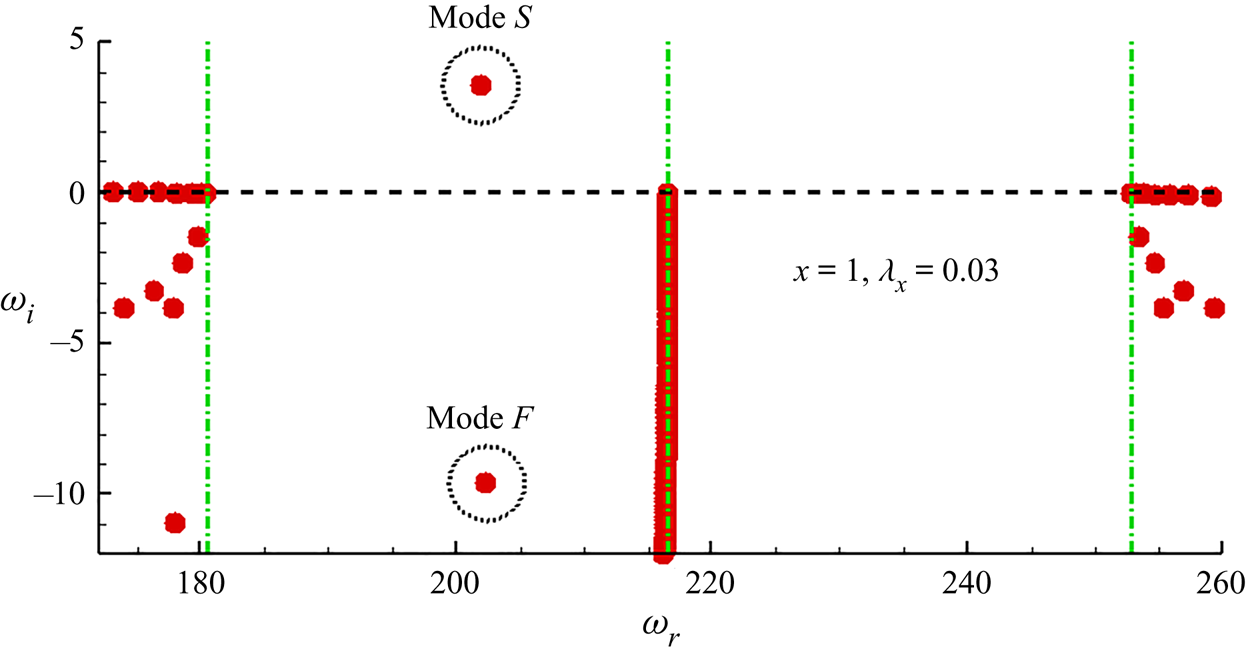
 $F$, which is another discrete mode branching-off from the fast continuous acoustic spectrum (Ma & Zhong Reference Ma and Zhong2003; Fedorov & Tumin Reference Fedorov and Tumin2011). This phenomenon helps identify the unstable second-mode instability, shown in the eigenspectrum of the basic state at
 $x=1$ (figure 3) for a perturbation wave with a streamwise wavelength,
 $\lambda _x = 2 {\rm \pi}/ \alpha = 0.03$. The horizontal and vertical axes are the real (circular frequency) and imaginary (growth rate) parts of the eigenvalue,
 $\omega _r$ and
 $\omega _i$, respectively. The left-hand, middle and right-hand vertical dash-dot lines correspond to the slow-acoustic, vortical/entropic and fast-acoustic wave speeds, respectively. The two circled eigenvalues represent mode
 $S$ (unstable) and mode
 $F$ (stable) that have synchronized, as indicated by their abscissa.
Eigenspectrum from linear stability analysis obtained at  $x=1$. The left-hand and right-hand vertical lines correspond to the slow and the fast acoustic speed limits, respectively. The unstable mode
 $S$ and the stable mode
 $F$ are marked with circles in the vicinity of their phase-speed synchronization.

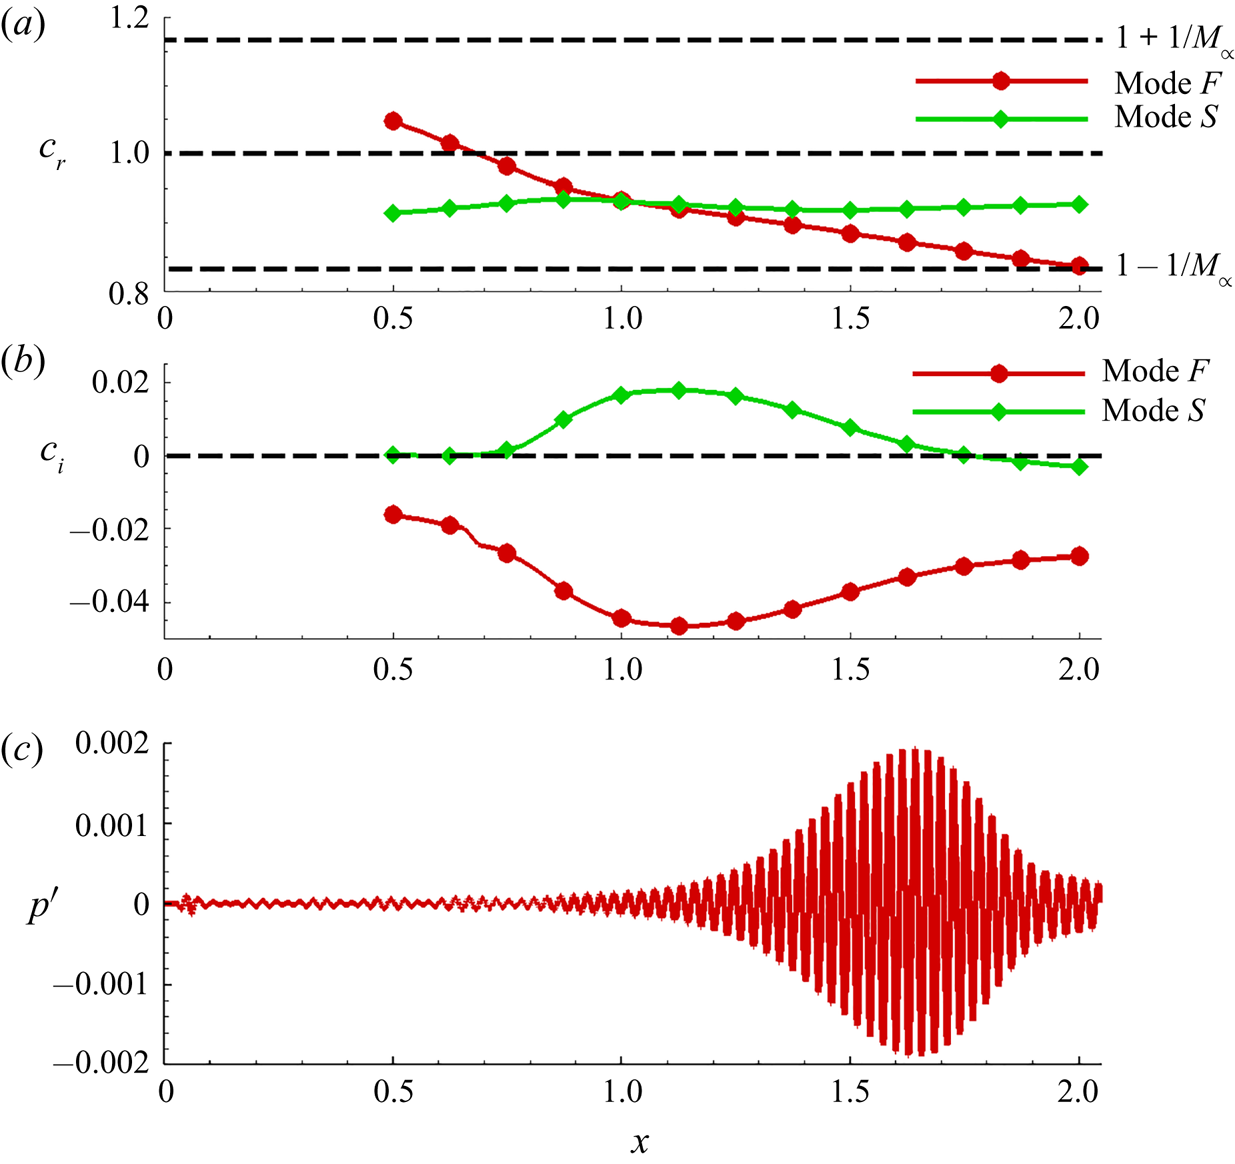
The above mentioned  $FS$-synchronization is evident in the phase-speed plots of mode
 $S$ and mode
 $F$, presented in figure 4. Figure 4(a) plots the loci of (real) phase speed,
 $c_r= \omega _r/\lambda _x$, as a function of streamwise distance from the leading edge. The phase speed of mode
 $S$ is found to be relatively invariant beyond
 $x=0.5$, whereas that of mode
 $F$ gradually decreases from the fast acoustic limit,
 $(1+1/M_\infty )$, to the slow acoustic limit,
 $(1-1/M_\infty )$, as was also reported by Ma & Zhong (Reference Ma and Zhong2003). During this process, mode
 $F$ first intersects with the continuous vortical/entropy spectrum (Fedorov & Tumin Reference Fedorov and Tumin2003) at
 $c_r=1$, and then, mode
 $S$. The loci of the imaginary parts of phase speeds are plotted in figure 4(b). In the vicinity of
 $FS$-synchronization, the growth rate of mode
 $S$ becomes positive (
 $c_i > 0$), and eventually reaches peak values around
 $x \sim 1.1$. At the free stream conditions considered, the unstable growth rates of mode
 $S$ after
 $FS$ synchronization can display magnitudes five to ten times (see e.g. Özgen & Kırcalı Reference Özgen and Kırcalı2008; Unnikrishnan & Gaitonde Reference Unnikrishnan and Gaitonde2019) larger than those prior to it. Mode
 $F$ remains damped over this adiabatic wall, since
 $c_i < 0$.
(a) Variations in phase speed,  $c_r$, of mode
 $F$ and mode
 $S$ as a function of streamwise distance from the leading edge. (b) Variations in growth rate,
 $c_i$, of mode
 $F$ and mode
 $S$ as a function of streamwise distance from the leading edge. (c) Linear response of DNS to second-mode actuation shown using wall-pressure perturbation.

Since the nonlinear evolution of second-mode will be examined through DNS, it is essential to first quantify the linear response of DNS, and reconcile any differences from LST. These may arise due to the temporal framework and 1-D assumption of mean flow in the latter approach, or because the DNS basic state is slightly altered due to viscous–inviscid interaction near the leading edge of the plate. To this end, a 2-D DNS is performed to obtain a converged laminar flow (previously shown in figure 2). This flow is then perturbed by small-amplitude wall-normal blowing–suction as defined by (2.2), with  $A=5\times 10^{-4}$. Similar amplitudes have been used by Egorov et al. (Reference Egorov, Fedorov and Soudakov2006) to obtain linear second-mode response in 2-D DNS. It is seen in figure 3 that, the circular frequency of mode
 $S$ is around
 $\omega _r = 200$ in the vicinity of
 $FS$ synchronization. Hence, the actuator frequency is also chosen as
 $\omega _A=200$. The streamwise extent of the actuator slot is defined as
 $x_1=0.035$ and
 $x_2=0.064$, which is approximately equal to the wavelength of the instability wave identified in figure 3. As observed in Zhong (Reference Zhong2001) and Wang & Zhong (Reference Wang and Zhong2009), when the actuator is placed upstream of the
 $FS$ synchronization point, the unstable mode
 $S$ is naturally excited in the HBL.
The linear response of second-mode instability thus obtained from the DNS, shown in figure 4(c), facilitates a direct comparison with corresponding LST results. The wall-pressure perturbation,  $p'$, is plotted versus streamwise distance,
 $x$, in the region of
 $FS$ synchronization. The most significant amplification in linear DNS coincides with the unstable region of mode
 $S$, with peak amplitude observed at
 $x \sim 1.65$. This is also consistent with the streamwise location at which mode
 $S$ amplification rate falls below
 $c_i =0$, thus indicating the location at which the second-mode instability begins to attenuate. The reasonable agreement between LST and linear DNS ensures that the wave parameters chosen induce a second-mode instability in the numerical simulations within the computational domain.
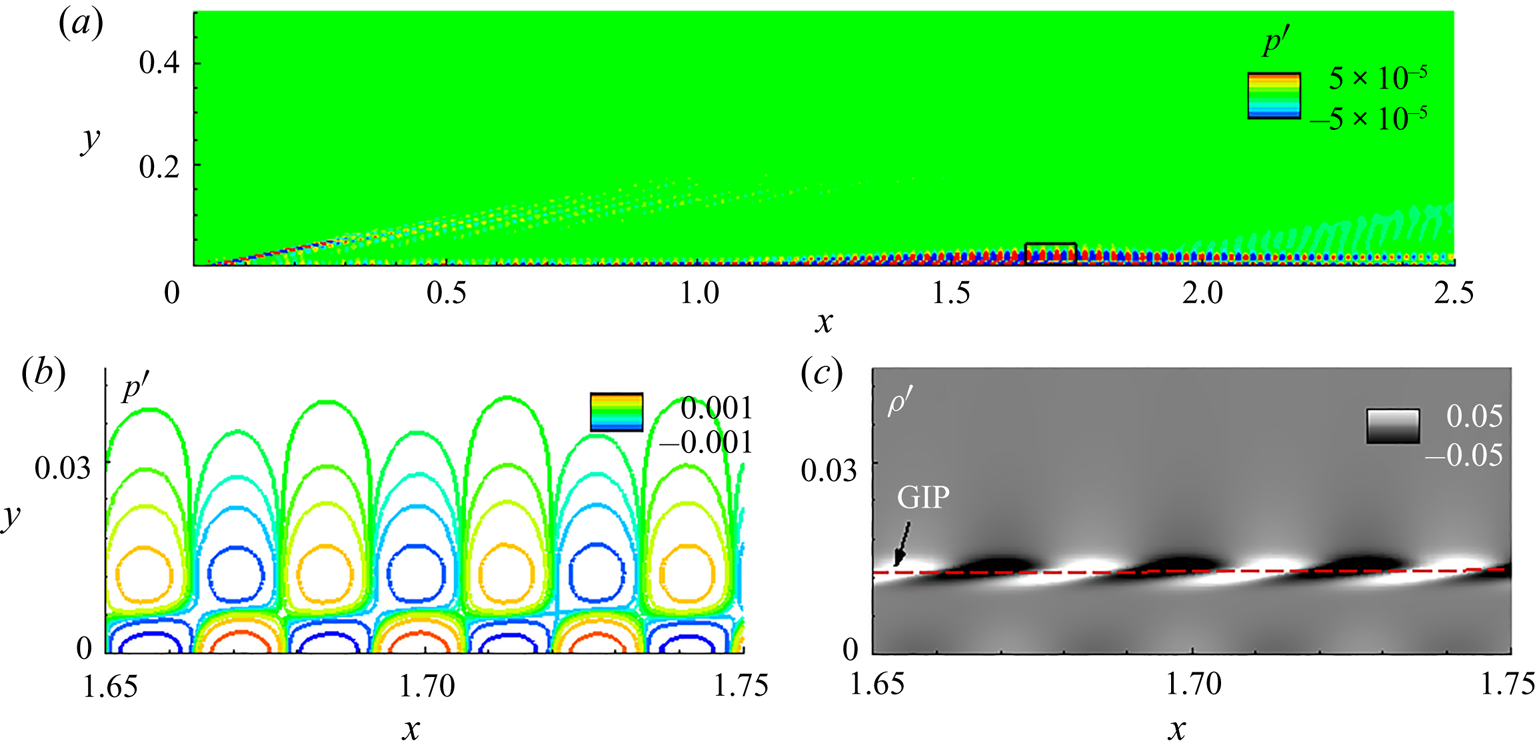
Some characteristic features of the second-mode instability are presented in figure 5. The pressure perturbation contours in figure 5(a) shows that instability amplification is restricted to within the boundary layer, primarily in the zone  $1.2<x<2.2$. The signature of the actuator is also visible in the vicinity of the leading edge. The pressure perturbation contours in the vicinity of peak amplification (marked by a rectangle in figure 5a) are plotted in detail in figure 5(b). The classic two-lobed structure of second-mode instability waves is evident with compact wall-normal support. The density perturbations visualized in figure 5(c) exhibit ‘rope-shaped’ patterns, observed commonly in experimental measurements (Stetson & Kimmel Reference Stetson and Kimmel1993; Laurence et al. Reference Laurence, Wagner and Hannemann2016; Kennedy et al. Reference Kennedy, Laurence, Smith and Marineau2018). These peak levels of density perturbations align with the generalized inflection point (GIP) in the mean profile, where the gradients are generally the highest, and engender rapid perturbation growth. Here, GIP corresponds to the zero-crossing of the function,
 $({\partial }/{\partial y})(({1}/{\bar {T}})({\partial \bar {u}}/{\partial y}))$. The locus of the GIP is also marked using a horizontal dashed line. The outer lobes in pressure perturbations also occur at this wall-normal location, as can be seen by comparing figures 5(b) and 5(c).
(a) Pressure perturbation contours in the linear DNS. (b) Magnified view of pressure perturbation contours in the region of second-mode amplification (marked in panel (a) with a rectangle). (c) Corresponding contours of density perturbation field. The dashed line in panel (c) represents the GIP.

4. Nonlinear evolution of second-mode
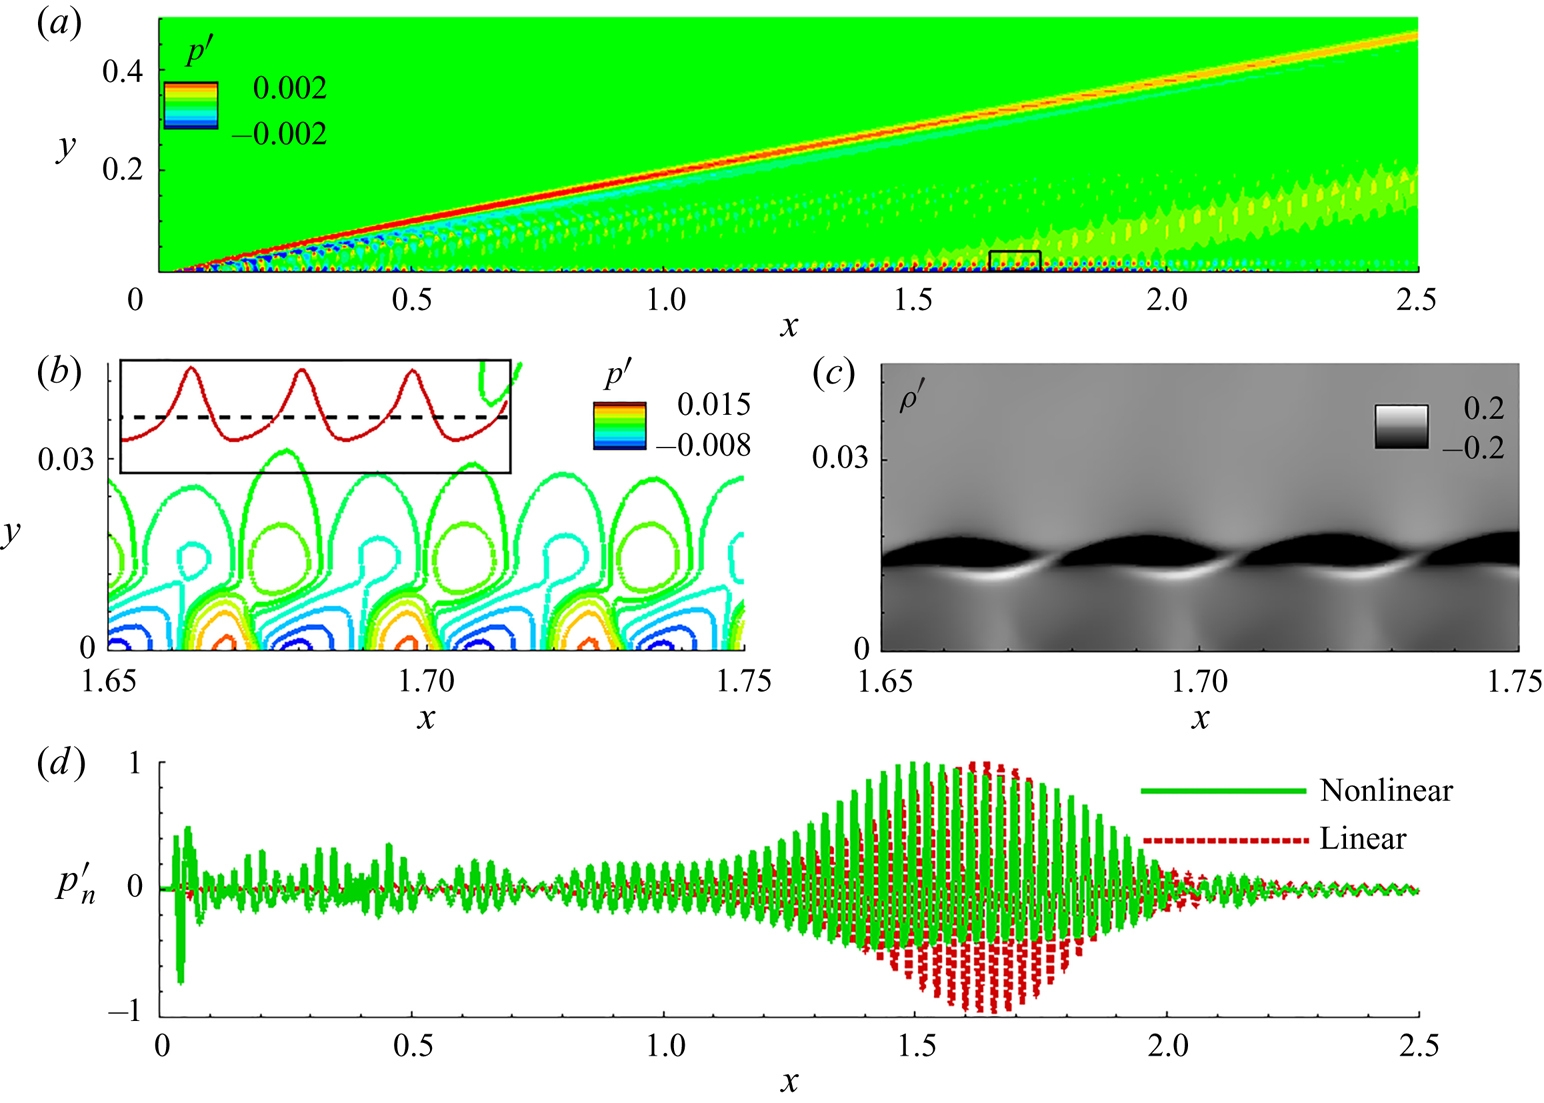
Prior to analysing the breakdown scenario, it is illustrative to examine the saturated second-mode to identify the effects of nonlinearity on the 2-D wave. For this, 2-D forced DNS is performed with an actuator amplitude,  $A=5\times 10^{-2}$. The resulting perturbation field is shown in figure 6. The pressure perturbation contours in figure 6(a) indicate waves accumulating behind the shock wave, as well as amplifying within the boundary layer. Unlike the linear scenario, pressure perturbations here show occasional extensions into the free stream, as was also observed in the nonlinear behaviour of second-mode by Egorov & Novikov (Reference Egorov and Novikov2016). The region marked by the rectangle (in figure 6a) is magnified in figure 6(b) for a detailed representation of the pressure perturbation contours. The pressure cells are distorted in an alternating pattern, with the corresponding waveform exhibiting wider troughs and narrower steep peaks. The surface pressure is plotted in the inset of figure 6(b) in the range,
 $1.65 \le x \le 1.75$, for a qualitative representation of this distortion. The horizontal dashed line is the zero mark. The density perturbation contours in this region are presented in figure 6(c). While the general ‘rope-shaped’ patterns persist, there are some variations from the linear structures observed in figure 5(c). For example, the perturbations in the linear field are symmetric about the zero value, as indicated by the identical shapes of the black and white zones. However, the nonlinear field is asymmetric, with the negative deviations being spatially dominant. The interlacing is also pronounced in the nonlinear response (Egorov & Novikov Reference Egorov and Novikov2016), with the braided pattern becoming more evident. This is seen, for instance, in the experiments of Laurence et al. (Reference Laurence, Wagner and Hannemann2016), where the initial stages of second-mode wavepackets display symmetric fluctuations. The tightly braided structures become evident upon tracking these wavepackets into the nonlinearly saturated regime.
(a) Pressure perturbation contours in the nonlinear DNS. (b) Magnified view of pressure perturbation contours in the region of second-mode amplification (marked in panel (a) with a rectangle). Inset in panel (b) plots surface pressure perturbations with respect to the zero mark (dashed horizontal line). (c) Corresponding contours of density perturbation field. (d) Normalized surface pressure perturbations in the linear and nonlinear DNS.

Nonlinearity can alter the growth-envelope features of second-mode instabilities from those predicted by LST. To quantify this, we plot the surface pressure perturbations from the linear and nonlinear DNS in figure 6(d). These pressure plots are normalized by their respective peak absolute values to obtain  $p'_n$, to facilitate a straightforward comparison. Due to the high growth rate of the second-mode instability in the linear regime, the primary zone of amplification between
 $1.2<x<2.2$ essentially masks the pressure trace elsewhere over the wall. In contrast, nonlinear saturation limits peak amplification to approximately three to five times of that observed at upstream locations. In the nonlinear case, the second-mode achieves peak amplitudes at an upstream location, compared with the linear case. One possible underlying cause is the energization of superharmonics, with smaller wavelengths, that can be harboured in the thinner boundary layer upstream. The envelope of the nonlinear wave is also asymmetric and modulated as evident in the range,
 $1.5 \le x \le 2$. Such modulations are characteristic of nonlinear saturation (Hader & Fasel Reference Hader and Fasel2020) and will be further examined below in the spectral domain. Beyond
 $x=2$ the linear response decays monotonically, whereas the nonlinear response exhibits a second region of amplification between
 $2 \le x \le 2.5$. These regions become relevant in the 3-D simulation discussed in the next section, by influencing oblique mode instabilities and facilitating the breakdown of the HBL.
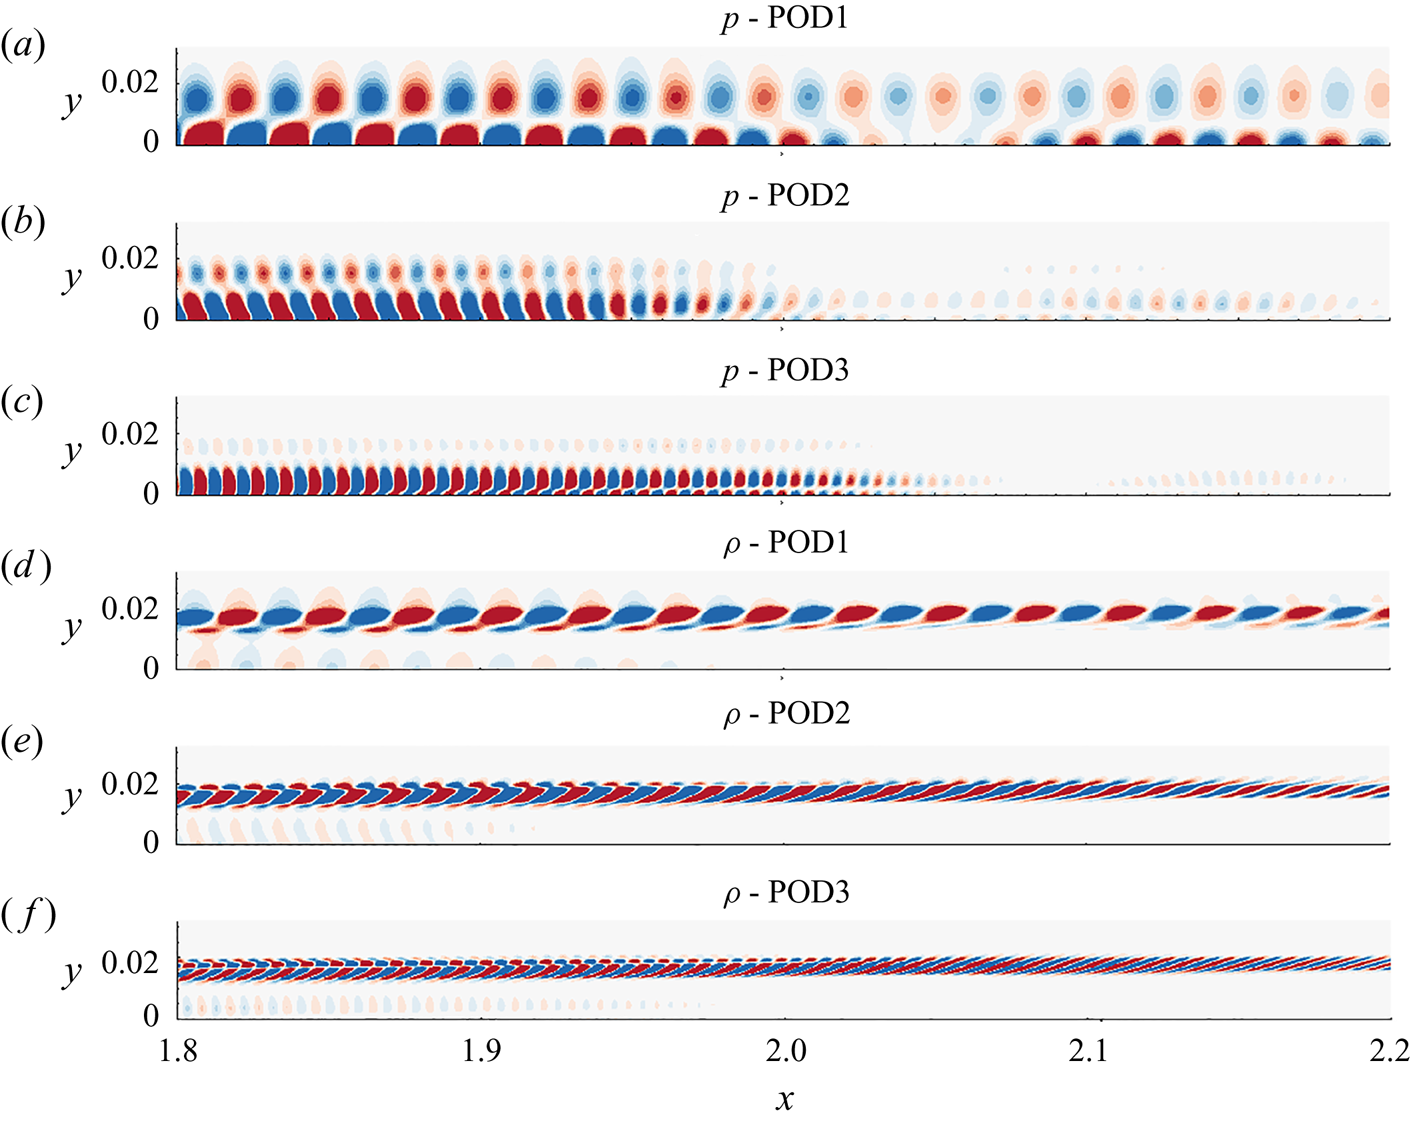
The differences between the linear and nonlinear perturbation fields are manifested as superharmonics of the primary (forcing) frequency. These differences can be highlighted by splitting the pressure and density perturbations fields into orthogonal modes using proper orthogonal decomposition (POD). Since the nonlinear field is assuredly composed of the forcing frequency and its integer superharmonics alone, the POD modes naturally coincide with these harmonics. This was verified post facto by extracting the frequency spectra of the monochromatic POD modes. Due to the harmonic nature of the perturbations, the POD modes appear in pairs, the first three of which are presented in figure 7, for pressure (p-POD1, p-POD2 and p-POD3) and density ( $\rho$-POD1,
 $\rho$-POD2 and
 $\rho$-POD3). They correspond to modes at frequencies,
 $\omega _A$,
 $2\omega _A$ and
 $3\omega _A$, in the respective primitive variables. The streamwise extent,
 $1.8 \le x \le 2.2$, is chosen to highlight the deviation from the linear response. The dual-lobed pressure contours and the ‘rope-shaped’ density patterns in the leading modes of the nonlinear field recover the corresponding linear response observed earlier in figure 5. In addition, the primary mode in pressure most clearly accounts for the second region of amplification observed in the nonlinear response between
 $2 \le x \le 2.5$. The higher modes of pressure also exhibit a dual-lobed structure in the region of peak amplitudes of the primary mode, and are increasingly restricted to within the boundary layer. The first and second superharmonics in density perturbations are also confined to the vicinity of the GIP, and exhibit a higher degree of interlacing, resulting in the braided features in the overall nonlinear response (figure 6c). In all the primitive variables examined, the wavelengths of higher modes decrease by the same factor at which the frequencies increase in the superharmonics, thus imparting similar phase speeds to all the modes.
(a) First, (b) second and (c) third orthogonal modes in pressure perturbations. (d) First, (e) second and (f) third orthogonal modes in density perturbations.

Following the analysis of linear and nonlinear behaviour of the 2-D second-mode instability, we now perform the complete 3-D DNS to identify mechanisms leading to its breakdown and eventual transition of the HBL.
5. Breakdown and transition
For simulating transition, the amplitude of the spanwise homogeneous wave in the 3-D DNS is maintained the same ( $A=5\times 10^{-2}$) as in the nonlinear 2-D DNS analysed above. To capture the receptivity of the nonlinearly distorted HBL to oblique instabilities, a background random perturbation field is also imposed on the actuator. This also enhances the stochastic nature of post-breakdown unsteadiness in the HBL (Sayadi, Hamman & Moin Reference Sayadi, Hamman and Moin2013). The random perturbation field is obtained using a pseudorandom number generator to generate real values,
 $r_n$, uniformly distributed between
 $-1 \le r_n < 1$. For the grid resolution and domain size adopted, Nyquist limit results in the excitation of a finite range of spanwise wavenumbers approximately bounded by,
 $31 \le \beta \le 1870$. The corresponding streamwise wavenumber range is around
 $210 \le \alpha \le 16\,000$. The time step size utilized for the simulation limits the highest frequency resolved to
 $\omega \sim 6 \times 10^4$. The scaling of the random field is varied across three orders of magnitude to ensure that the breakdown characteristics are not sensitive to its amplitude. In the reported results, the root mean square value of random perturbations are
 $O(1\times 10^{-4})$.
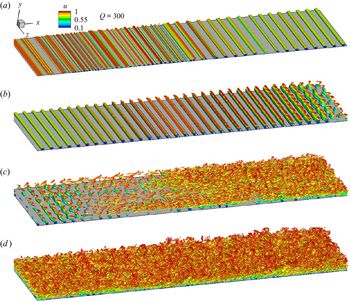
The overall features of the destabilized HBL are presented first, in figure 8, using an iso-level of Q-criterion, coloured by  $u$. Each frame represents equal streamwise segments of the plate defined as,
 $0 \le x \le 1$,
 $1 \le x \le 2$,
 $2 \le x \le 3$ and
 $3 \le x \le 4$, for figures 8(a), 8(b), 8(c) and 8(d), respectively. The key features evident from the vortical structures highlighted through the Q-criterion are now listed; further supporting quantitative evidence where appropriate is provided in subsequent sections.
(i) In the range,
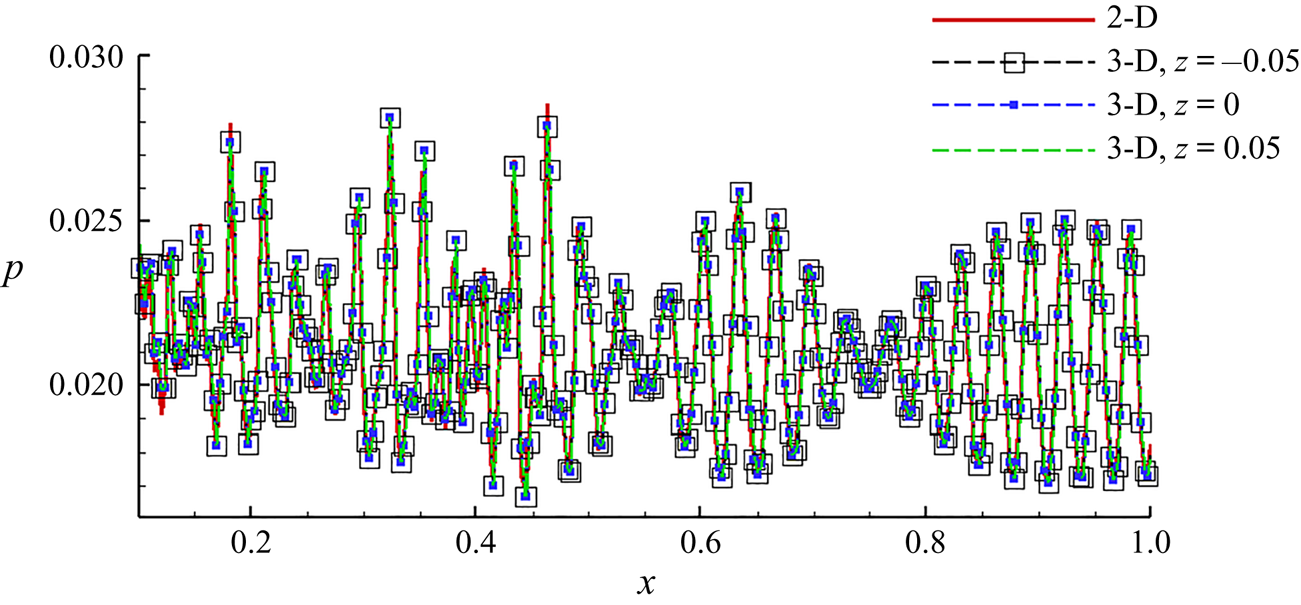
 $0 \le x \le 1$, the behaviour of the second-mode instability in the 3-D simulation is essentially same as that observed in the 2-D nonlinear simulation discussed above. Specifically, the HBL is dominated by spanwise homogeneous ‘rollers’ which distort the laminar basic state on which the secondary instabilities evolve. The similarity of the 2-D nonlinear and 3-D results is also highlighted in figure 9. The wall-pressure distributions for $x \le 1$ are plotted as obtained from the 2-D simulation, and three spanwise locations (as indicated) in the3-D simulation. We observe minimal spanwise variations in this region.
(ii) Although the rollers remain the dominant coherent feature in
$1 \le x \le 2$, traces of spanwise variations begin to appear near the GIP. This is evident by $x \sim 1.5$, prominently on the free stream side of the rollers relative to the near-wall region. By $x \sim 2$, the top portion of the rollers is sufficiently modulated by the most receptive oblique waves, effectively detaching from the 2-D waves in the inner boundary layer and evolving into lambda vortices. In the near-wall region, the rollers are eventually distorted (to a lesser extent) and initiate spanwise breakdown.(iii) In
$2 \le x \le 3$, the spanwise breakdown rapidly destabilizes the HBL, forming hairpin vortices characteristic of initial stages of turbulence in boundary layers (Schlatter & Örlü Reference Schlatter and Örlü2010). Detailed analysis of the coherent structures in $2 \le x \le 2.5$ indicates that the ‘legs’ of lambda vortices, consisting of streamwise vortex tubes, stretch in the streamwise direction. This is accompanied by the ‘inclination’ (Jeong et al. Reference Jeong, Hussain, Schoppa and Kim1997) of these vortices such that the ‘head’ region moves away from the wall. Densely arranged hairpin vortices appear in the boundary layer towards $x \sim 3$, together with a rapid broadening of spanwise length scales in the flow. Wall-shear measurements indicate that the average skin friction increases by a factor of around four within the range, $2.5 \le x \le 3$. Due to the random nature of the spanwise inhomogenity seeded with the actuator, complete breakdown of the boundary layer occurs at slightly different streamwise locations across the span in an instantaneous sense.(iv) The final section,
$3 \le x \le 4$, displays a turbulent boundary layer, composed of broadband content in the frequency and waveumber domains. The ‘forest of hairpins’ (Wu & Moin Reference Wu and Moin2009) in early turbulence ($x \sim 3$) indicates that the boundary layer has attained statistical invariance in the spanwise direction. Further downstream, consistent with the observations in incompressible scenarios, the boundary layer thickens and ‘arch-like’ structures appear in the outer layer (Eitel-Amor et al. Reference Eitel-Amor, Örlü, Schlatter and Flores2015) , which are detached from the streamwise vortices observed closer to the wall (Jeong et al. Reference Jeong, Hussain, Schoppa and Kim1997). In addition, beneath the streamwise vortices, near-wall spanwise-oriented structures also appear, which have been previously observed in transitional regions (Jocksch & Kleiser Reference Jocksch and Kleiser2008) above $M_\infty =5$, and are found here to persist into the fully developed turbulent region of the HBL.


The DNS results of transition visualized using Q-criterion, coloured with  $u$. Each frame represents equal streamwise segments, as follows: (a)
 $0 \le x \le 1$; (b)
 $1 \le x \le 2$; (c)
 $2 \le x \le 3$; and (d)
 $3 \le x \le 4$.

Comparison of wall-pressure distribution in the 2-D nonlinear simulation with corresponding results from the 3-D simulation, at indicated spanwise locations.

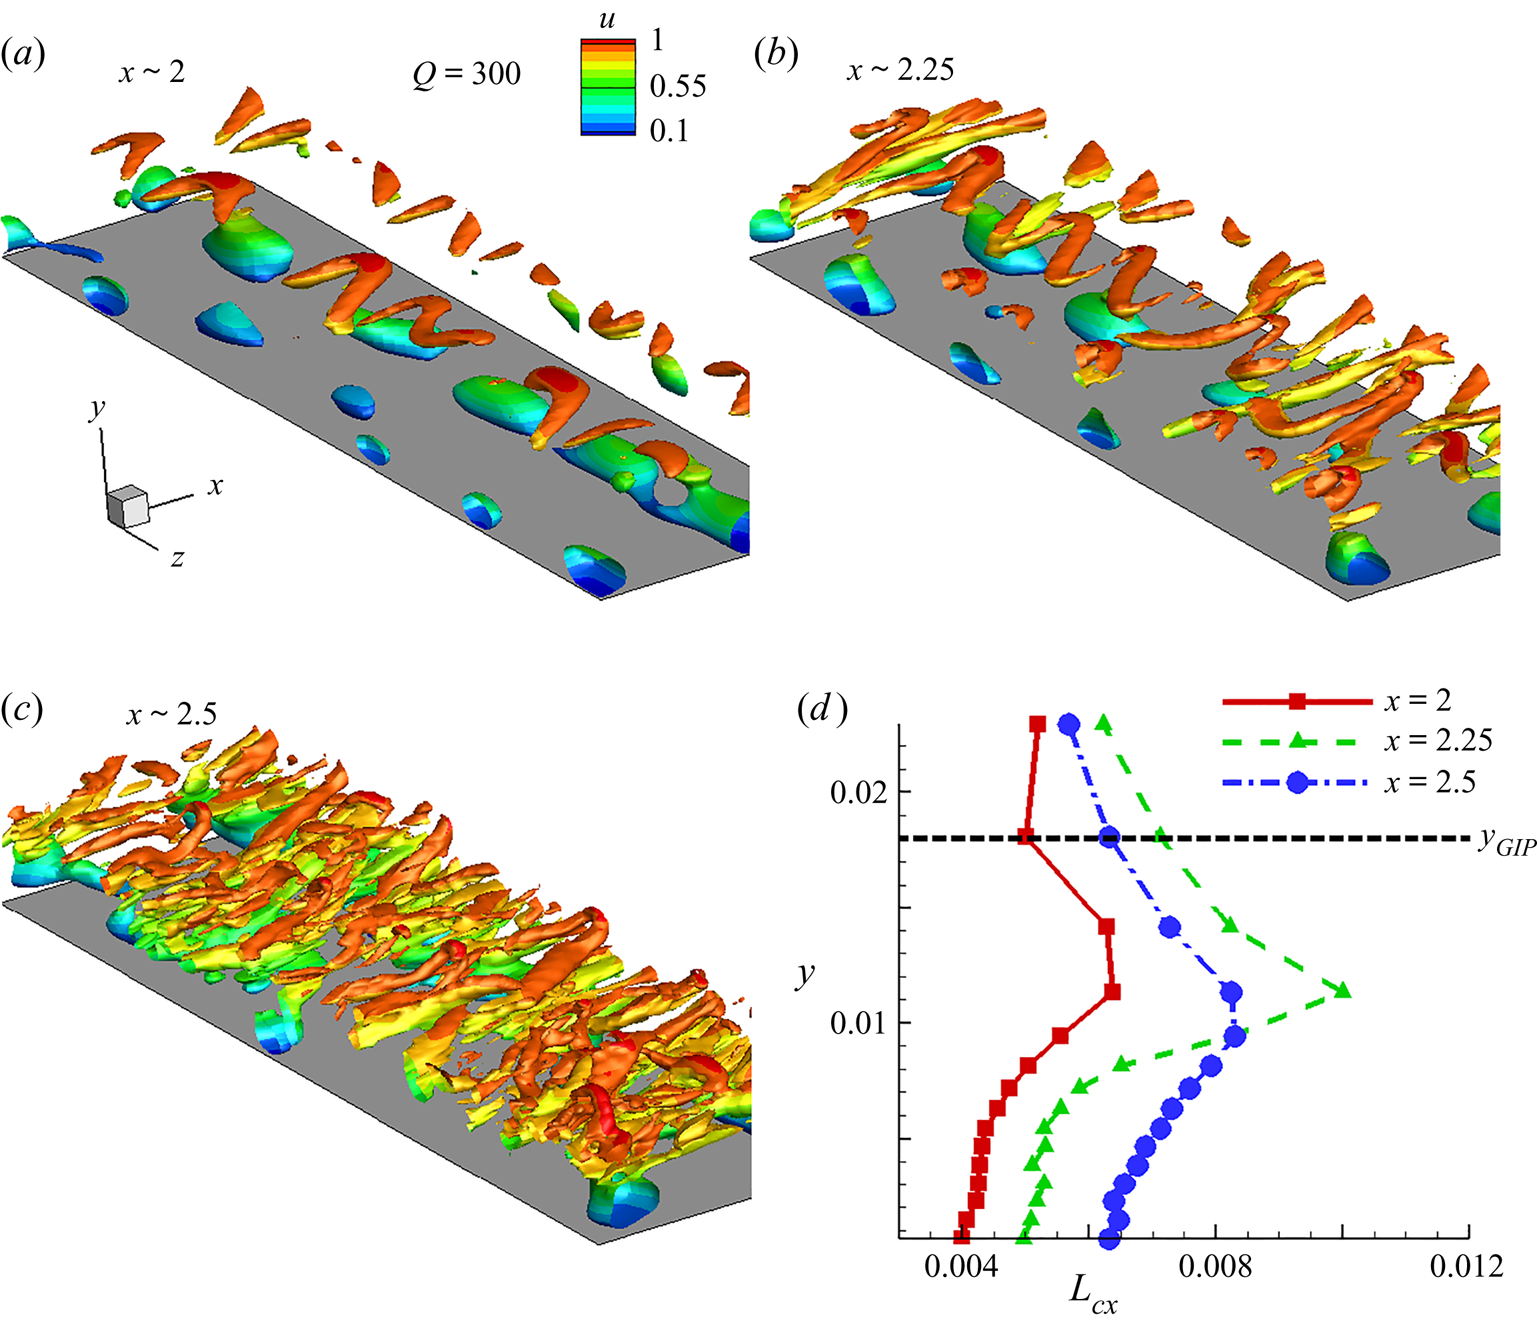
Since initiation of breakdown from the 2-D wave is of direct interest to this study, further details of spanwise inhomogeneity in the rollers are presented in figure 10. The upstream region of figure 8(c),  $2 \le x \le 2.5$, is highlighted through the iso-level of Q-criterion, coloured by
 $u$. Three locations are chosen, in the vicinity of
 $x \sim 2$,
 $x \sim 2.25$ and
 $x \sim 2.5$, to characterize the early spanwise variations in the second-mode. The formation of lambda vortices near the GIP is evident in figure 10(a), with the rollers beneath it. The streamwise vortex filaments undergo stretching in the downstream direction, and are inclined to the wall, as can be observed by comparing figures 10(a) and 10(b). Further downstream, the lambda vortices develop into hairpin vortices, with the ‘head’ region in the outer boundary layer (figure 10c).
The Q-criterion coloured by  $u$, isolating the behaviour of oblique instabilities in the region of transition: (a)
 $x \sim 2$; (b)
 $x \sim 2.25$; (c)
 $x \sim 2.5$. (d) Variation of streamwise length scales inside the boundary layer at the indicated locations.

The inclination and stretching of vortices can be verified and quantified from the trends in the streamwise length scales present across the height of the boundary layer. This is demonstrated in figure 10(d) using the streamwise integral length scale,  $L_{cx}=\int _{0}^{\infty } cc_u \,\textrm {d} \chi$. The autocorrelation coefficient of streamwise velocity,
 $cc_u$, is calculated as
 \begin{equation} cc_u(x,y,z,\chi)=\frac{\overline{u'(x,y,z,t)u'(x+\chi,y,z,t)}}{\left(\overline{u'^2(x,y,z,t)}\right)^{0.5} \left(\overline{u'^2(x+\chi,y,z,t)}\right)^{0.5}},\end{equation}
and is first obtained on the midspan plane at various wall-normal locations within the boundary layer at  $x=2, 2.25$ and
 $x=2.5$, from which the integral length scales at each streamwise location are calculated. The locus of GIP in
 $2 \le x \le 2.5$ (marked as
 $y_{GIP}$) can be approximated by the dashed horizontal line. At
 $x=2$, the near-wall region is dominated by fundamental and superharmonics in the 2-D instability, and thus has a relatively smaller length scale. Below the GIP, the lambda vortices result in a local maxima in
 $L_{cx}$, at
 $y \sim 0.012$. Here, the lambda vortices are detached from the rollers on the wall, and the ‘legs’ are inclined with respect to the GIP. Near the GIP and above it,
 $L_{cx}$ diminishes because of the absence of any significant streamwise oriented structures. This trend is further enhanced at
 $x=2.25$ due to the stretching of the lambda vortices, which increases the local maxima in
 $L_{cx}$. As the lambda vortices penetrate the boundary layer,
 $L_{cx}$ exhibits a smoother profile as seen at
 $x=2.5$.
6. Spectral-domain analysis of transition
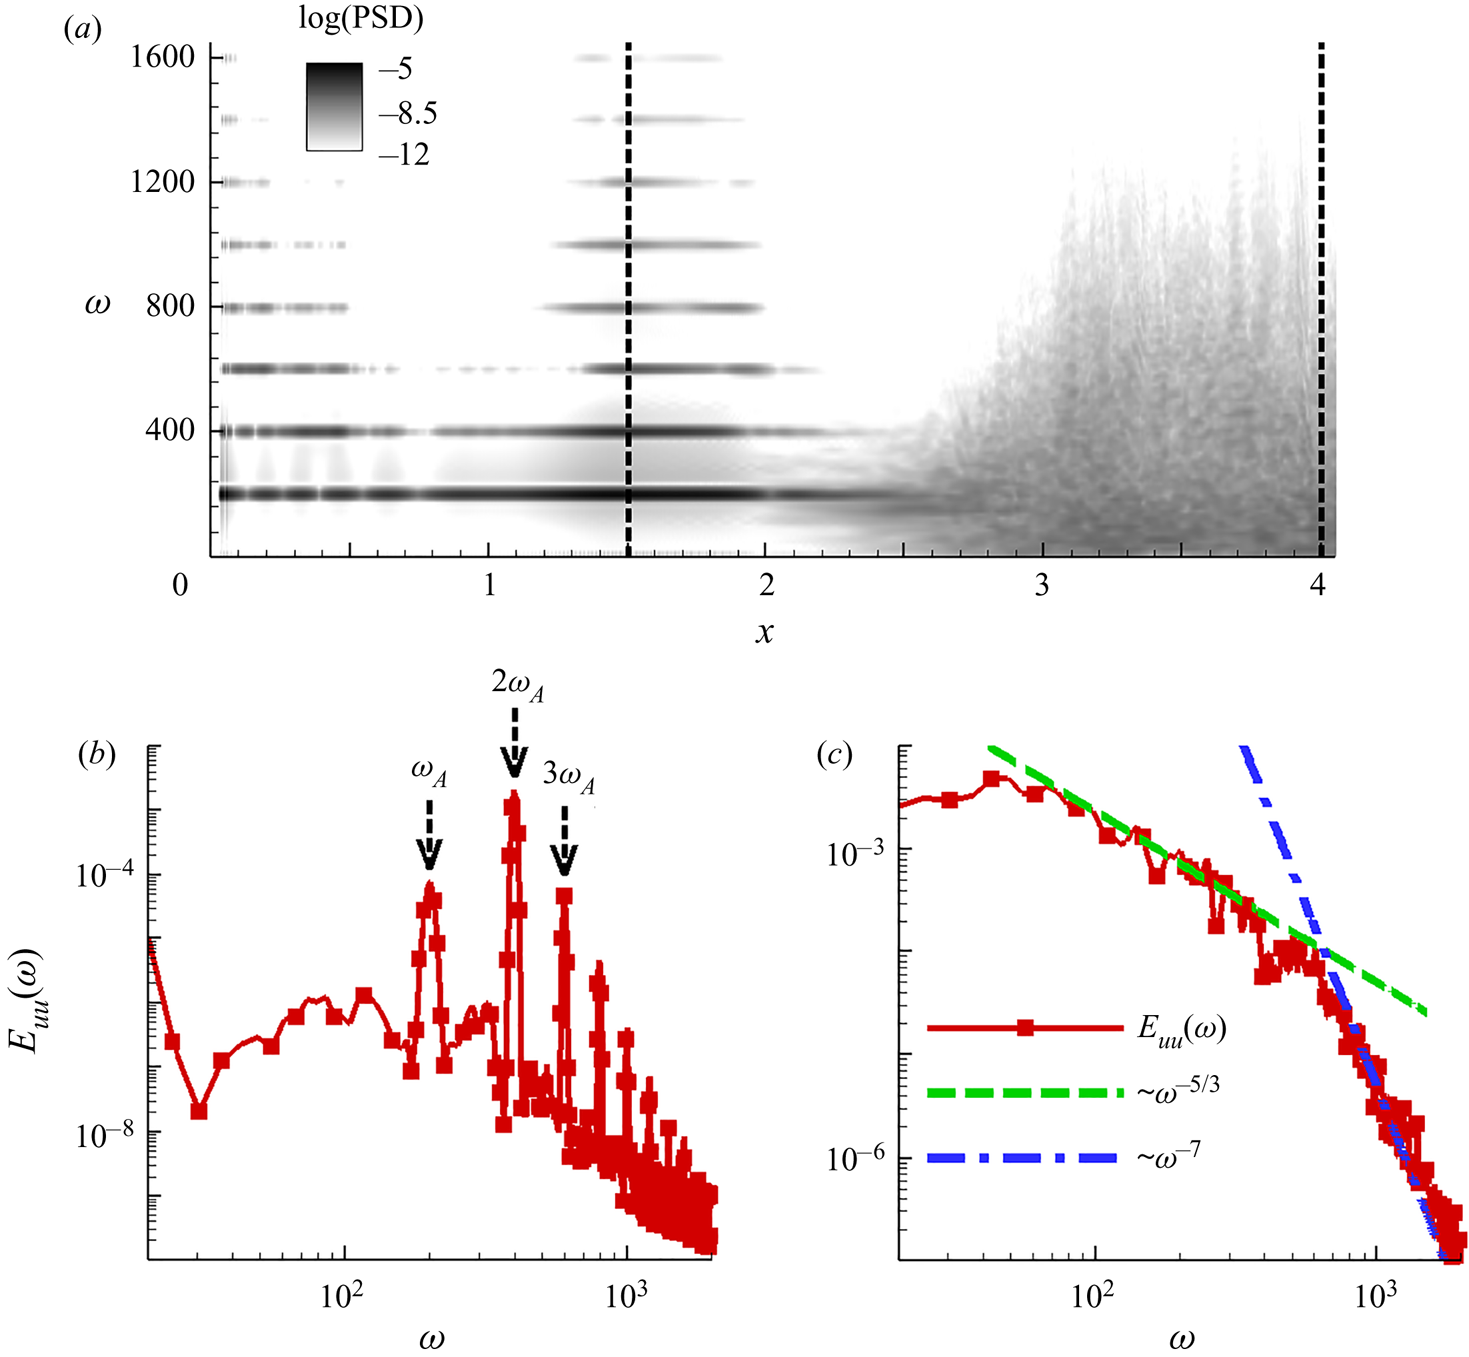
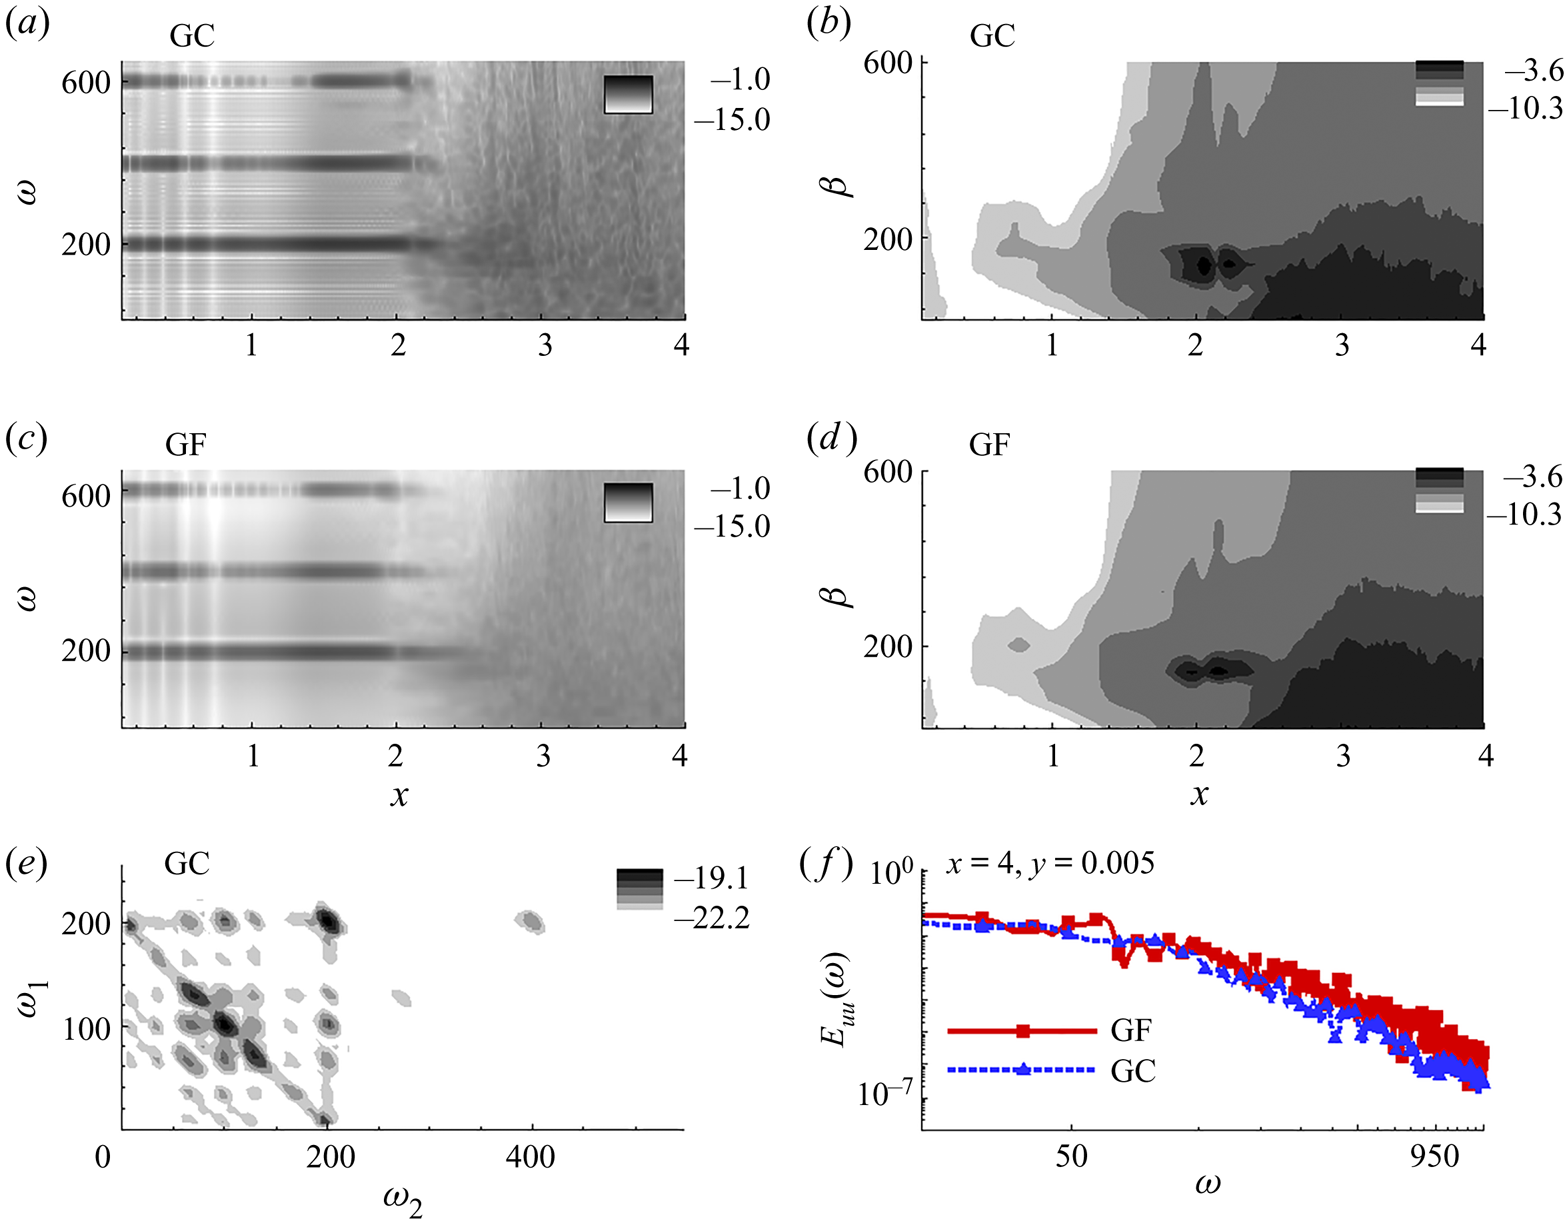
The frequency spectra of wall-pressure fluctuations provide a quantitative representation of the transitional characteristics and development of nonlinearities in the HBL. An illustrative manifestation is evident on the midspan: figure 11(a) plots the logarithm of power spectral density (PSD) of wall pressure fluctuations. The horizontal axis is  $x$ and the vertical axis represents circular frequency,
 $\omega$. The two vertical dotted lines mark the locations
 $x=1.5$ and
 $x=4$, for reference. The spectrum near the leading edge shows the imprint of the actuator, primarily at
 $\omega =200$, from which multiple superharmonics develop due to nonlinear effects. As the HBL grows, these superharmonics dampen, as seen in
 $0.5 \le x \le 1$. Once the linear instability region of the fundamental wave begins at
 $x \sim 1$ (figure 4c), the superharmonics also amplify (
 $1 \le x \le 2$). At
 $x \sim 1.5$, most of the superharmonics exhibit peak amplitudes. The streamwise velocity spectrum,
 $E_{uu}(\omega )$, at this location is plotted in figure 11(b). The fundamental frequency (
 $\omega _A$), and the first (
 $2\omega _A$) and second (
 $3\omega _A$) superharmonics are also marked for reference. Nonlinear saturation limits the linear amplification of the fundamental frequency, and peak energy is actually observed in the first superharmonic,
 $\omega =400$. Although the spectrum is narrow banded at higher frequencies (integer multiples of the fundamental), the lower range shows a broadband nature, indicating percolation of frequencies to either side of the fundamental. This will be further examined below in the context of nonlinear coupling of frequencies.
(a) Wall-pressure frequency-content variation in terms of power spectral density obtained at various streamwise locations at the midspan. Streamwise velocity spectra at (b)  $x=1.5$ and (c)
 $x=4$. Dashed arrows in panel (b) mark the fundamental frequency and its first two superharmonics. Dashed line in panel (c) represents the slope,
 $\omega ^{-5/3}$. Dashed-dotted line in panel (c) represents the slope,
 $\omega ^{-7}$.

For  $x>2$, the superharmonics above
 $\omega =400$ attenuate rapidly outside the region of linear instability. A qualitative shift in boundary layer character is evident, however, in the region
 $2 \le x \le 3$, where the harmonic narrow-band spectrum gives way to a broadband spectrum. As seen in the iso-level plots (figure 8), this region is characterized by oblique waves that distort the 2-D rollers, and result in an early signature of turbulence in the form of hairpin structures. Since
 $\omega =200$ remains the dominant frequency in
 $2 \le x \le 2.5$, this indicates that fundamental resonance (Sivasubramanian & Fasel Reference Sivasubramanian and Fasel2015) is the most probable cause of transition in this scenario. There are also traces of peaks at
 $\omega \sim 150$ near the wall and
 $\omega \sim 100$ (near the GIP, not evident in this plot). The latter will be revisited in the following discussion through bicoherence, although the relatively lower energy content at the half-frequency of the fundamental significantly limits the effects of subharmonic resonance (Sivasubramanian & Fasel Reference Sivasubramanian and Fasel2014). This observation indicates that in the presence of unbiased spanwise variations upstream, fundamental resonance is the preferable mode of breakdown for a given 2-D second-mode wave. Fundamental resonance has also been observed to arise naturally in HBLs over flared cones by Hader & Fasel (Reference Hader and Fasel2019, Reference Hader and Fasel2020).
At further downstream locations,  $x>3$, the frequency spectrum is broadband, with no trace of dominance of the forcing harmonic, or its multiples. The spectral content is evaluated at
 $x=4$, at a wall-normal location,
 $y^+ \sim 41$, using
 $E_{uu}(\omega )$, and is reported in figure 11(c). The dotted and dashed-dotted lines mark the slopes,
 $\omega ^{-5/3}$ and
 $\omega ^{-7}$, respectively (Mayer, Von Terzi & Fasel Reference Mayer, Von Terzi and Fasel2011), demarcating the inertial subrange and the dissipation scales. The spectrum shows that the HBL reaches a fully turbulent state towards the outflow boundary, with an inertial subrange extending over a decade of frequencies.
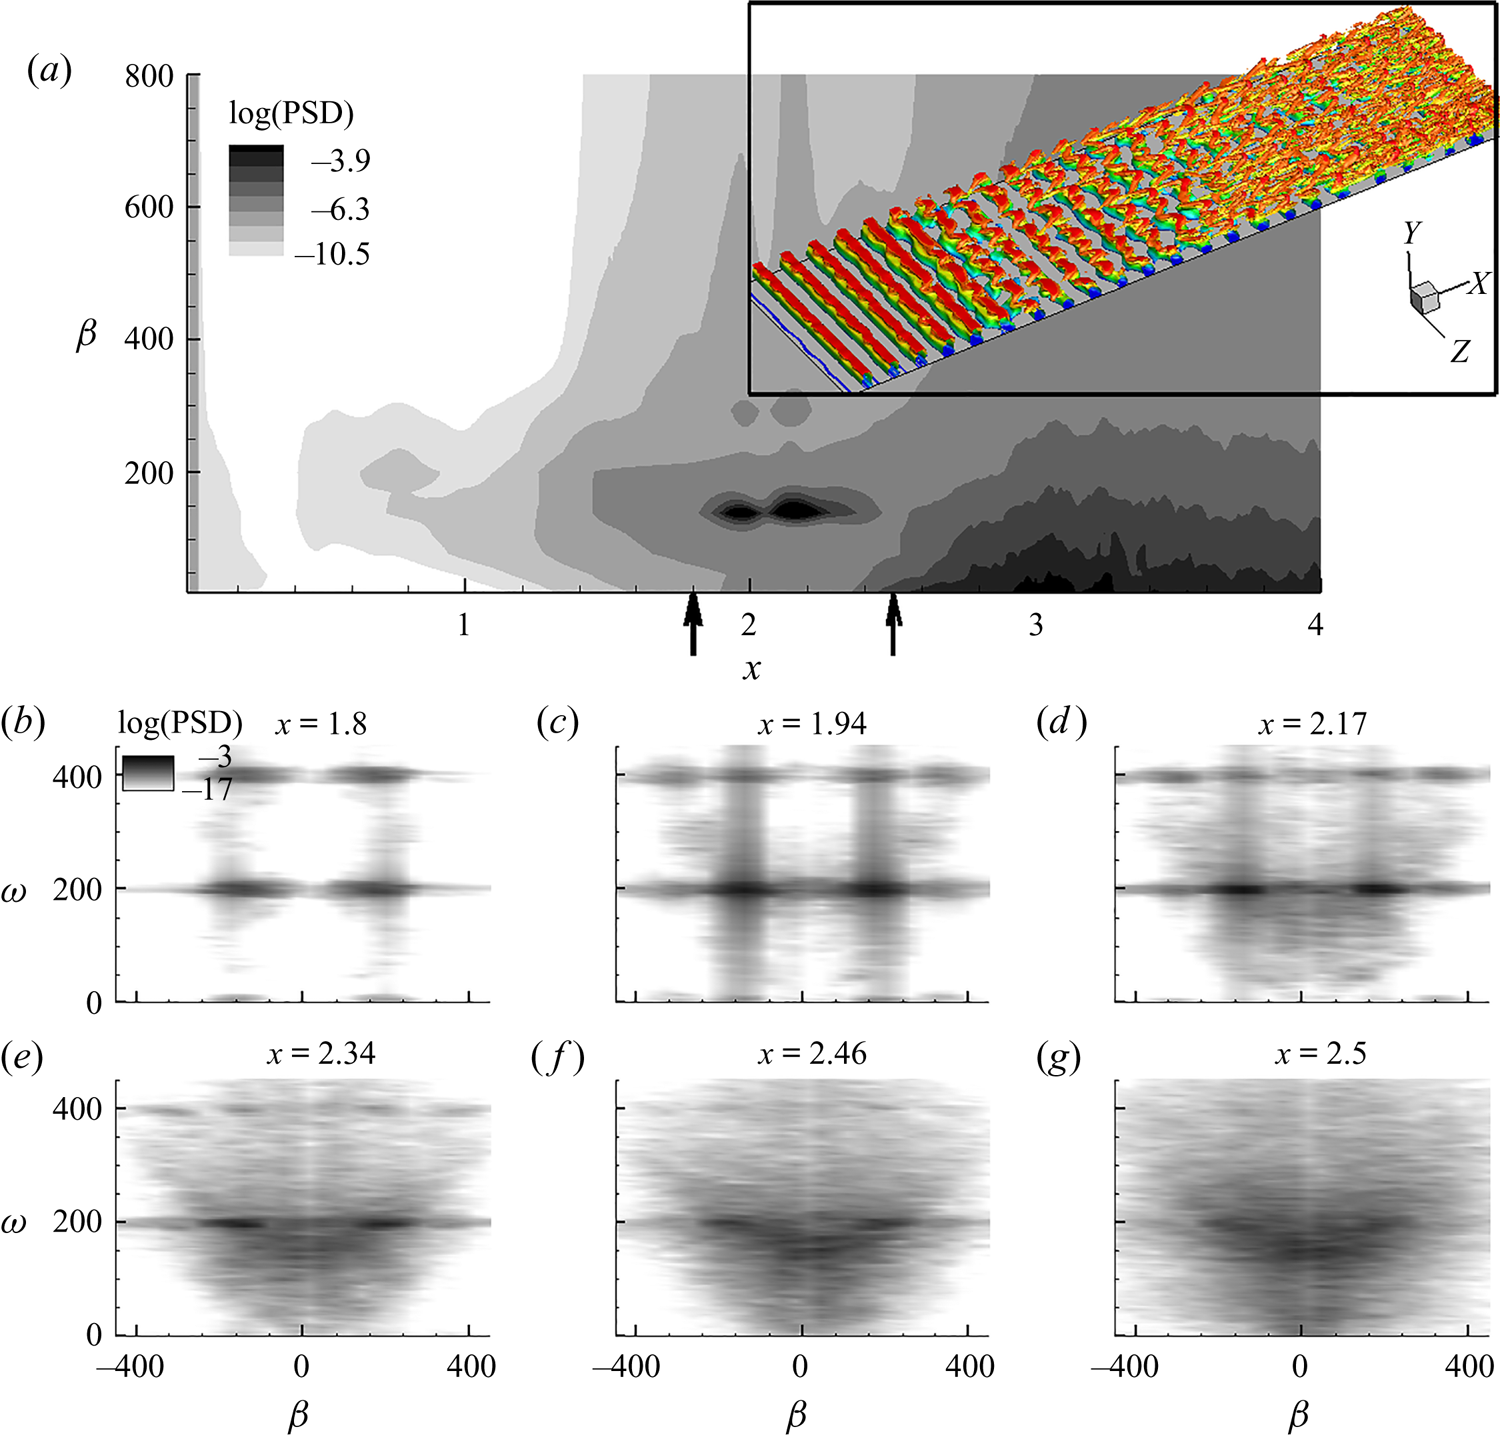
The sensitivity of the HBL to a narrow band of wavenumbers in the nonlinearly distorted upstream region,  $x \le 1.5$, is examined by plotting wavenumber spectra in figure 12(a). The horizontal axis is
 $x$ and the vertical axis represents spanwise wavenumber,
 $\beta$. These oblique modes ride on the rollers and modulate them in the spanwise direction as the 2-D wave amplifies. An interesting feature here is the region of peak amplification of the oblique mode,
 $1.8 \le x \le 2.5$, marked by two vertical arrows on the horizontal axis. The most amplified oblique mode has a spanwise wavenumber of
 $\beta \sim 150$, corresponding to a wavelength of
 $\lambda _z \sim 0.04$, which is
 $20\,\%$ of the span of the domain. For reference, the vortical structures in the HBL within this streamwise extent are also shown in an inset, using Q-criterion coloured with
 $u$. This region of intense amplification of the oblique modes is crucial to the final breakdown of the boundary layer through the formation of initial hairpin vortices. The significance of this streamwise region is limited in the linear framework, since the 2-D wave monotonically attenuates beyond
 $x \sim 1.7$ (figure 6d). However, the nonlinear response of the 2-D wave indicates that a second region of amplification is present (figure 6d), which is also evident in the fundamental 2-D mode extracted through POD (figure 7a). This region exhibits strong non-parallel, localized amplification of the fundamental frequency, which clearly harbours the oblique modes and makes the ‘rollers’ susceptible to spanwise breakdown. There is a qualitative shift in the HBL in the vicinity of
 $x \sim 2.5$, as it remains no longer narrow-banded in wavenumber space. The wavenumber spectrum is rapidly populated near the lower end, as the HBL becomes turbulent towards the outflow.
(a) Spanwise wavenumber spectra obtained from wall-pressure perturbations. Vertical arrows mark  $1.8 \le x \le 2.5$. Inset shows Q-criterion coloured with
 $u$ in
 $1.8 \le x \le 2.5$. (b–g) Wavenumber–frequency spectra at indicated locations.

Due to the illustrative nature of these spectra in describing the breakdown process, a further analysis of the wavenumber–frequency ( $\beta - \omega$) domain is performed in the
 $1.8 \le x \le 2.5$ region. Six equally spaced streamwise locations are chosen as shown in figure 12(b–g). The logarithm of PSD is plotted to identify the spatio-temporal characteristics of the instabilities. To highlight the dynamics in the oblique modes, the spanwise homogeneous component is removed prior to performing the transformation from the spatio-temporal plane. At
 $x=1.8$, the spectrum remains narrow banded in the frequency domain, with only the fundamental and its superharmonic being prominent. At both these frequencies, the spatial scales are localized at
 $\beta \sim 150$. Progressing downstream, the superharmonic weakens, and the oblique mode at the fundamental frequency gains prominence by
 $x=1.94$ and
 $x=2.17$. This is another indication that the transition is dominated by the fundamental breakdown mechanism. In the latter half of the domain chosen for this aspect of the analysis,
 $1.8 \le x \le 2.5$ (figure 12e–g), the spectrum rapidly broadens in both wavenumber and frequency. Energy eventually percolates to lower wavenumbers and frequencies due to the development of spanwise coherence in the near-wall structures and the initiation of quasi-streamwise vortices.
The above spectral analyses provide quantitative insights into the frequencies and wavenumbers present in the HBL. The genesis of these frequencies may be further clarified by identifying those waves that are nonlinearly coupled, and the extent of their coupling (which results in spectral broadening). An effective technique is to use higher-order spectral quantities, such as the bispectrum,  $B(\omega _1,\omega _2)$. For a signal,
 $\phi (t)$, this is defined as
 \begin{equation} B(\omega_1,\omega_2)=\lim_{T\to\infty}\frac{1}{T}E[\varPhi(\omega_1)\varPhi(\omega_2)\varPhi^c(\omega_1+\omega_2)], \end{equation}
where  $T$ is the temporal duration of the signal,
 $\phi (t)$,
 $\varPhi (\omega )$ is Fourier transform of
 $\phi (t)$ and the superscript,
 $(.)^c$, represents the conjugate transpose.
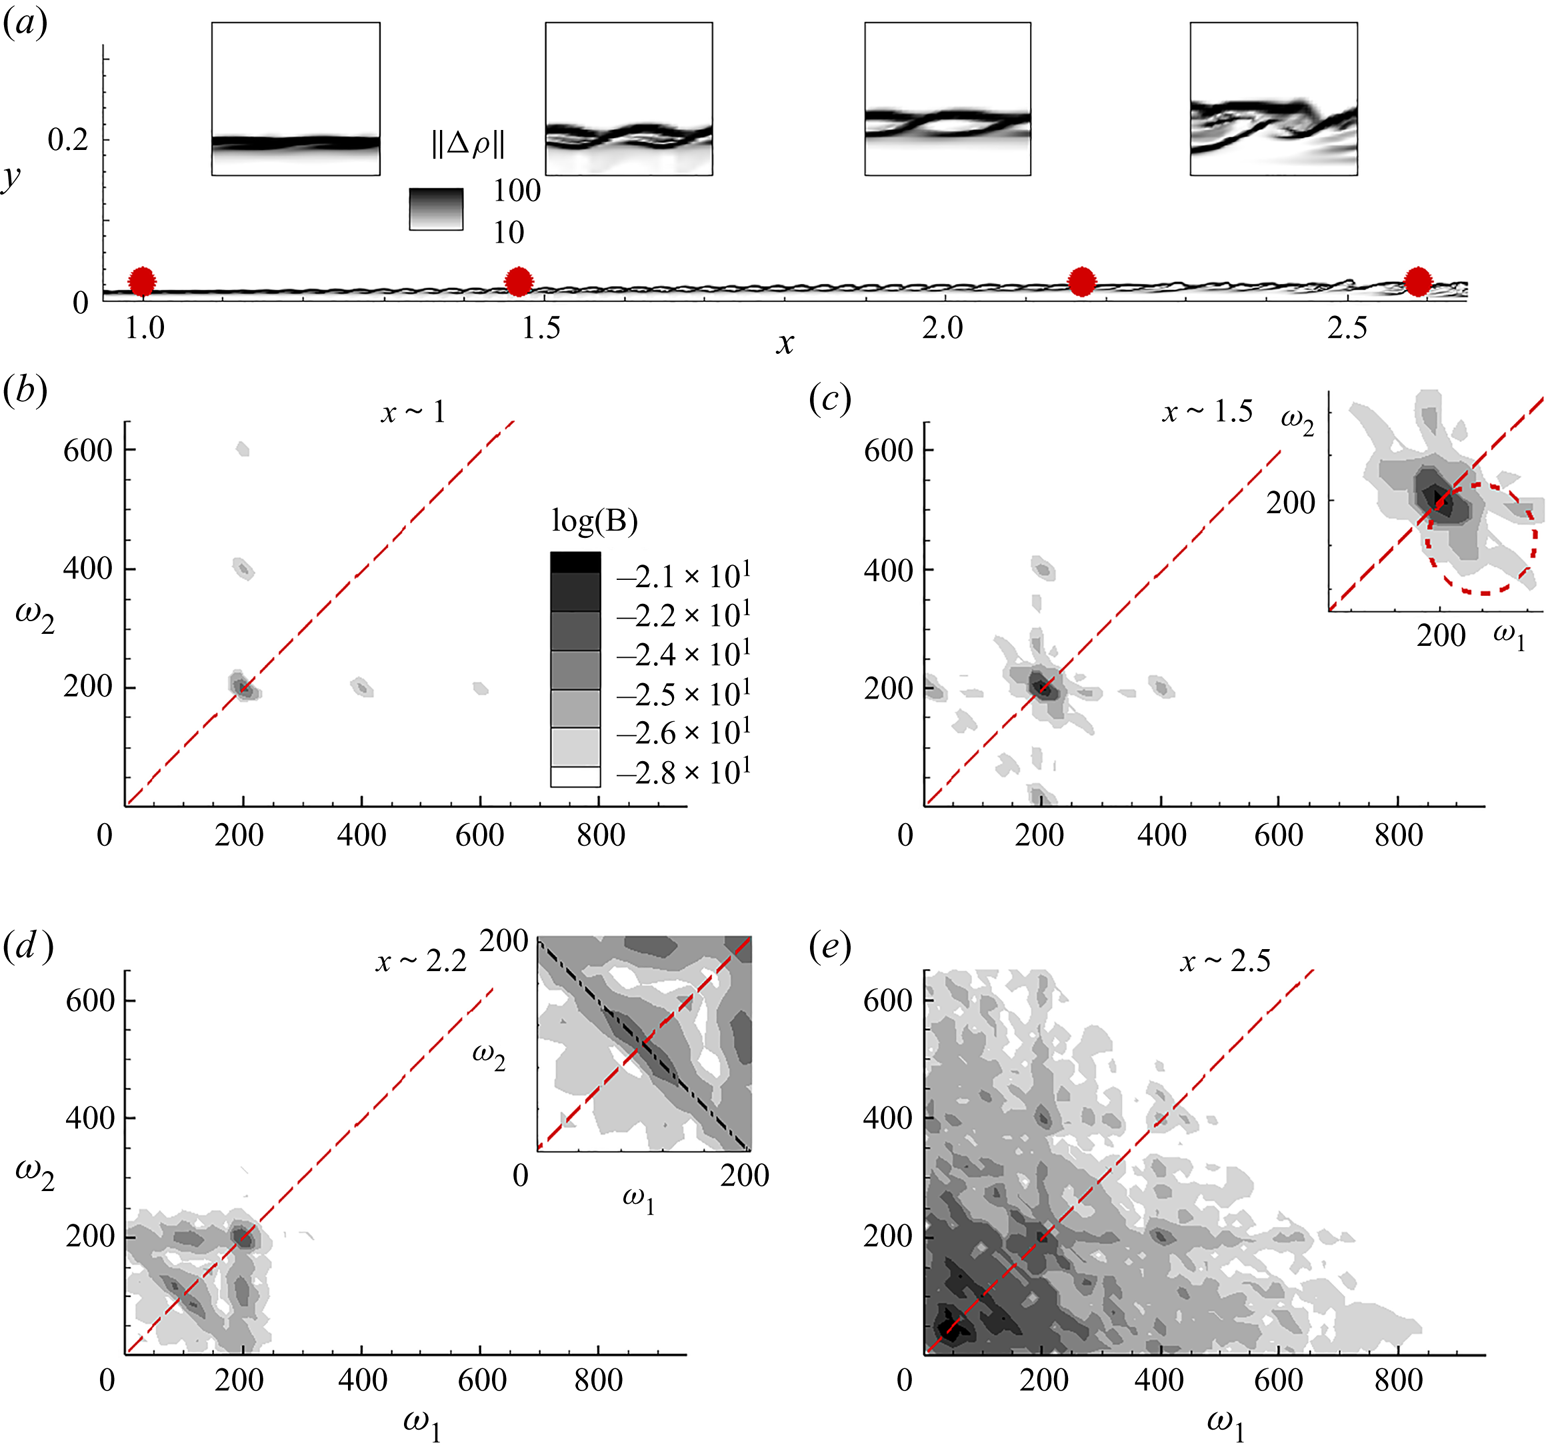
The bispectrum of pressure signals in the vicinity of the GIP facilitates tracking of the nonlinear coupling that leads to the generation of new frequencies in the nonlinearly saturated and transitional regimes of the HBL. The bispectrum also incorporates information on the absolute scales of energy in the fluctuations. Thus, it quantifies the nonlinear generation of fluctuating energy at new frequencies, in relation to the fundamental wave. Figure 13(a) plots the density-gradient magnitude to visualize the braided ‘rope-like’ structures near the GIP, and the eventual downstream breakdown region. The solid circles mark four locations where the time traces of pressure are acquired to calculate the bispectrum. The state of the HBL in the vicinity of these locations are also magnified in four insets, for reference. The braids are not evident at  $x \sim 1$ since the nonlinearities are relatively weaker here. As the superharmonics amplify, the interlacing is more prominent at
 $x \sim 1.5$ and
 $x \sim 2.2$, consistent with the 2-D nonlinear DNS. At
 $x \sim 2.6$, the GIP is no longer compact, and indicates nonlinear breakdown.
(a) Density-gradient magnitude contours, marked with the locations,  $x \sim 1$,
 $x \sim 1.5$,
 $x \sim 2.2$ and
 $x \sim 2.6$. The vicinity of these locations are magnified in the four insets. (b–f) The bispectrum evaluated at the above locations. The dotted inclined lines bisect the first quadrant. The dash-dot line in the inset of panel (d) represents
 $\omega _1 + \omega _2 = \omega _A$.

The bispectrum at  $x \sim 1$ is presented in figure 13(b). The axes represent circular frequency, and the inclined dashed line marks the
 $45^{\circ }$ angle, bisecting this quadrant. Significant bicoherence at
 $(\omega _1,\omega _2)$ in this plane suggests quadratic phase coupling among waves with frequencies,
 $\omega _1, \omega _2$ and
 $\omega _3 = \omega _1 + \omega _2$. When combined with additional contextual data from the Fourier spectrum, the bispectrum yields information about the specific (sum or difference) interaction among these three frequencies (Bountin, Shiplyuk & Maslov Reference Bountin, Shiplyuk and Maslov2008). Due to the symmetry of the bispectrum, it is sufficient to examine only one half of the quadrant. The most prominent nonlinear interaction at this location occurs at the fundamental frequency
 $(\omega _1 = \omega _2 =200)$, to produce its superharmonic (
 $\omega _3 = 400$). The fundamental also interacts with the superharmonics thus produced, e.g.
 $(\omega _1 = 200, \omega _2 =400)$ and
 $(\omega _1 = 200, \omega _2 =600)$, resulting in the banded spectrum discussed earlier in figure 11(a). Similar nonlinear interactions of second-mode have been reported in bispectrum analysis of experimental data in HBLs by Kimmel & Kendall (Reference Kimmel and Kendall1991) and Chokani (Reference Chokani1999), which resulted in a nonlinear regime dominated by fundamental resonance, which is also the case here.
The bispectrum at  $x \sim 1.5$ (figure 13c) is not as compact as at the previous location. Nonlinear coupling at higher superharmonics are no longer significant here, with the coupling mainly limited to self-interaction of the fundamental, as well as between the frequency pair,
 $(\omega _1 = 200, \omega _2 =400)$. An interesting feature is the spectral support in the vicinity of the self-interaction, marked by a dashed circle in the inset in figure 13(c). These mostly correspond to interactions of the type,
 $(\omega _1 = 200+\varDelta , \omega _2 =200-\varDelta )$, resulting in the superharmonic,
 $\omega _3 = 400$, where
 $\varDelta$ is a small deviation from the harmonic. A similar observation has been reported in the nonlinear regime of the second-mode instability over a flared cone in the experiments of Craig et al. (Reference Craig, Humble, Hofferth and Saric2019). Along the
 $45^o$ line, the interactions favour
 $(\omega _1 = 200+\varDelta , \omega _2 =200 + \varDelta )$, resulting in
 $\omega _3 = 400 + 2\varDelta$, representing the ‘broadband self-interaction’ (Craig et al. Reference Craig, Humble, Hofferth and Saric2019) of the second-mode instability that results in spectral broadening. By this streamwise location we also notice the interaction of the fundamental with the neighbourhood of the zero frequency. This is interpreted as the nonlinear interaction leading to energy transfer from the mean flow into the fundamental frequency. Craik (Reference Craik1971) indicates that this results in strong amplification of the oblique wave, thus inducing spanwise periodicity. In figure 12(a), we indeed observe that the nonlinearly saturated second-mode increasingly becomes selective to oblique mode instabilities in this streamwise region, converging onto
 $\lambda _z \sim 0.04$ as the dominant wavelength prior to breakdown. There is also a possibility that this interaction induces gradual modulation in the second-mode envelope as discussed in Craig et al. (Reference Craig, Humble, Hofferth and Saric2019).
Another interesting quadratic coupling is evident in the signal at  $x \sim 2.2$ (figure 13d). A continuous range of frequencies is involved in this interaction, as defined by the linear equation,
 $\omega _1 + \omega _2 = \omega _A$, with
 $\omega _A$ being the actuator frequency as defined earlier. This line segment is marked in the magnified image (inset in figure 13d). The highest degree of coupling is observed between the frequencies,
 $(\omega _1 = 90, \omega _2 =110)$, which are close to the subharmonic of the fundamental frequency. Experimental measurements (Bountin et al. Reference Bountin, Shiplyuk and Maslov2008) over cones have reported such a continuous linear range of interaction and the small offset of peak interaction region (from the subharmonic). The coupling of the second-mode fundamental with its first subharmonic is essential for the subharmonic-resonance route to transition (see e.g. Shiplyuk et al. Reference Shiplyuk, Bountin, Maslov and Chokani2003). Thus although fundamental resonance is observed to be the primary mechanism of transition through spectral analysis, the quadratic phase coupling identifies the presence of subharmonic resonance as well, in the later nonlinear stages. This is possible because, unbiased forcing of spanwise variations in the 2-D second-mode provides necessary scales for both routes. The interaction of the fundamental with the subharmonic,
 $(\omega _1 = 200, \omega _2 =100)$ to generate
 $\omega _3 = 300$ is evident in the
 $x-\omega$ plot (figure 11a) as a weak spectral peak in the streamwise extent,
 $2 \le x \le 2.4$. Following the initiation of the interaction
 $\omega _1 + \omega _2 = \omega _A$, the bispectrum is quickly populated towards the lower frequencies, as seen at
 $x \sim 2.6$ (figure 13e). By this location the Fourier spectrum also attains a broad peak at frequencies below the fundamental, and the boundary layer is in the later stages of transition. Here, cubic and higher-order interactions could become relevant among the wide range of frequencies present.
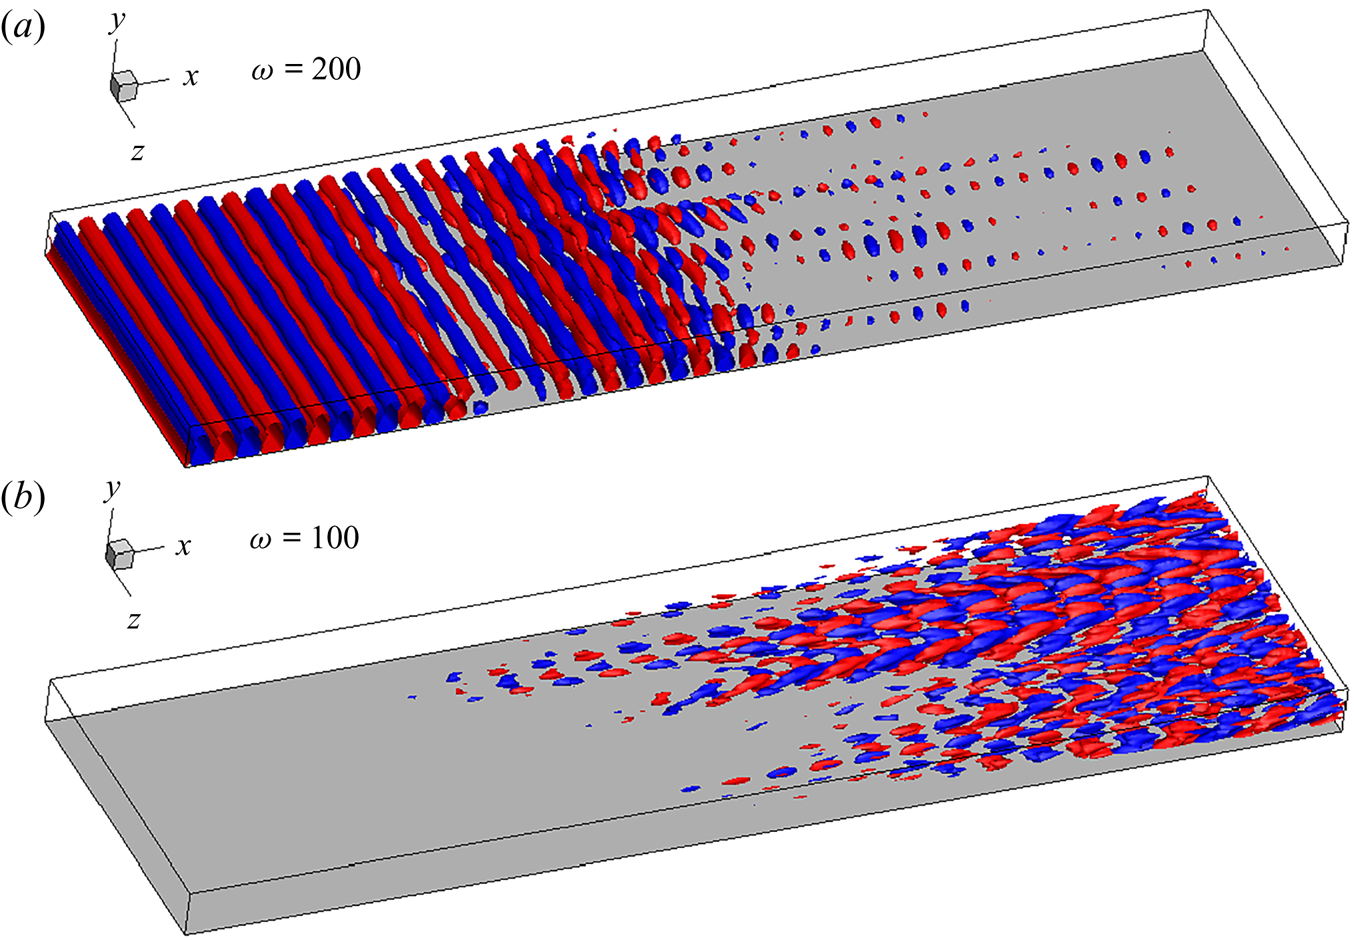
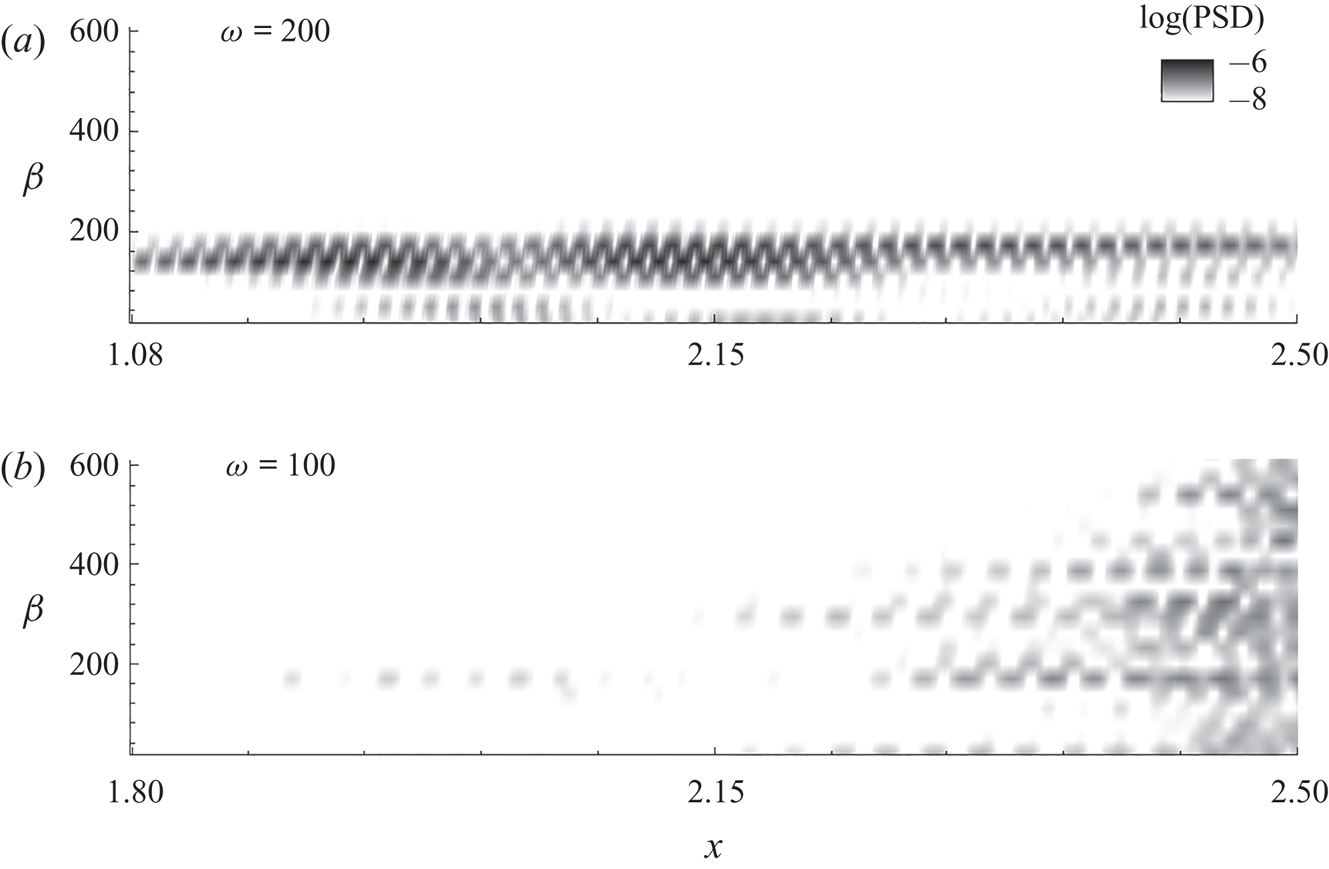
Since the fundamental and its subharmonic are found to be relevant in the transitional region, we extract their global forms in figure 14. The corresponding spanwise wavenumber spectra are provided in figure 15. The 3-D structures of the pure-frequency modes are extracted using the dynamic mode decomposition, (known as DMD) (Schmid Reference Schmid2010), which also approximates the Koopman modes of the nonlinear operator (Rowley et al. Reference Rowley, Mezić, Bagheri, Schlatter and Henningson2009). Thus, although this flow field is nonlinearly saturated, these modes represent the relevant eigenfunctions of the infinite-dimensional linear operator that approximates the nonlinear evolution of the flow. The iso-levels of the fundamental frequency in  $u'$ are shown in figure 14(a). Its spanwise wavenumber spectrum (with the
 $\beta =0$ component removed) obtained near the wall is provided in figure 15(a). The axial extent,
 $1.8 \le x \le 2.5$, is similar to that discussed in the context of figure 12. The upstream 2-D wave gradually develops oblique waves and disintegrates in the spanwise direction. The spatial support of the fundamental mode attenuates significantly beyond
 $x \sim 2.15$. The spanwise wavenumber has a narrow spectral range and corresponds to its peak value observed earlier in figure 12(a). This confirms that
 $\lambda _z \sim 0.04$ is the dominant instability of the second-mode rollers at the fundamental frequency. The subharmonic mode and its spanwise spectrum are evident in figures 14(b) and 15(b), respectively. Although the spectral contours in figure 11(a) do not highlight this mode due to its relatively lower energy content, the modal analysis efficiently educes its spatial support. This mode becomes significant beyond
 $x > 2.15$, consistent with the quadratic interaction detected in figure 13(d). This instability begins at a spanwise wavenumber identical to that in the fundamental, but quickly populates the spanwise spectrum towards the breakdown region. In the following section we study the post-breakdown regime to explore the effects on the wall.
Iso-levels of  $u'$ used to represent the (a) fundamental and (b) subharmonic modes in the transitional region.

Spanwise wavenumber spectrum of the (a) fundamental and (b) subharmonic modes in the transitional region.

7. Turbulent HBL and near-wall effects
The impact of the state of the HBL on the wall is readily identifiable through the skin-friction coefficient,  $c_f$, defined as
 \begin{equation} c_f=\frac{2}{Re} \mu \left. \frac{\partial u}{\partial y} \right |_{y=0}. \end{equation}
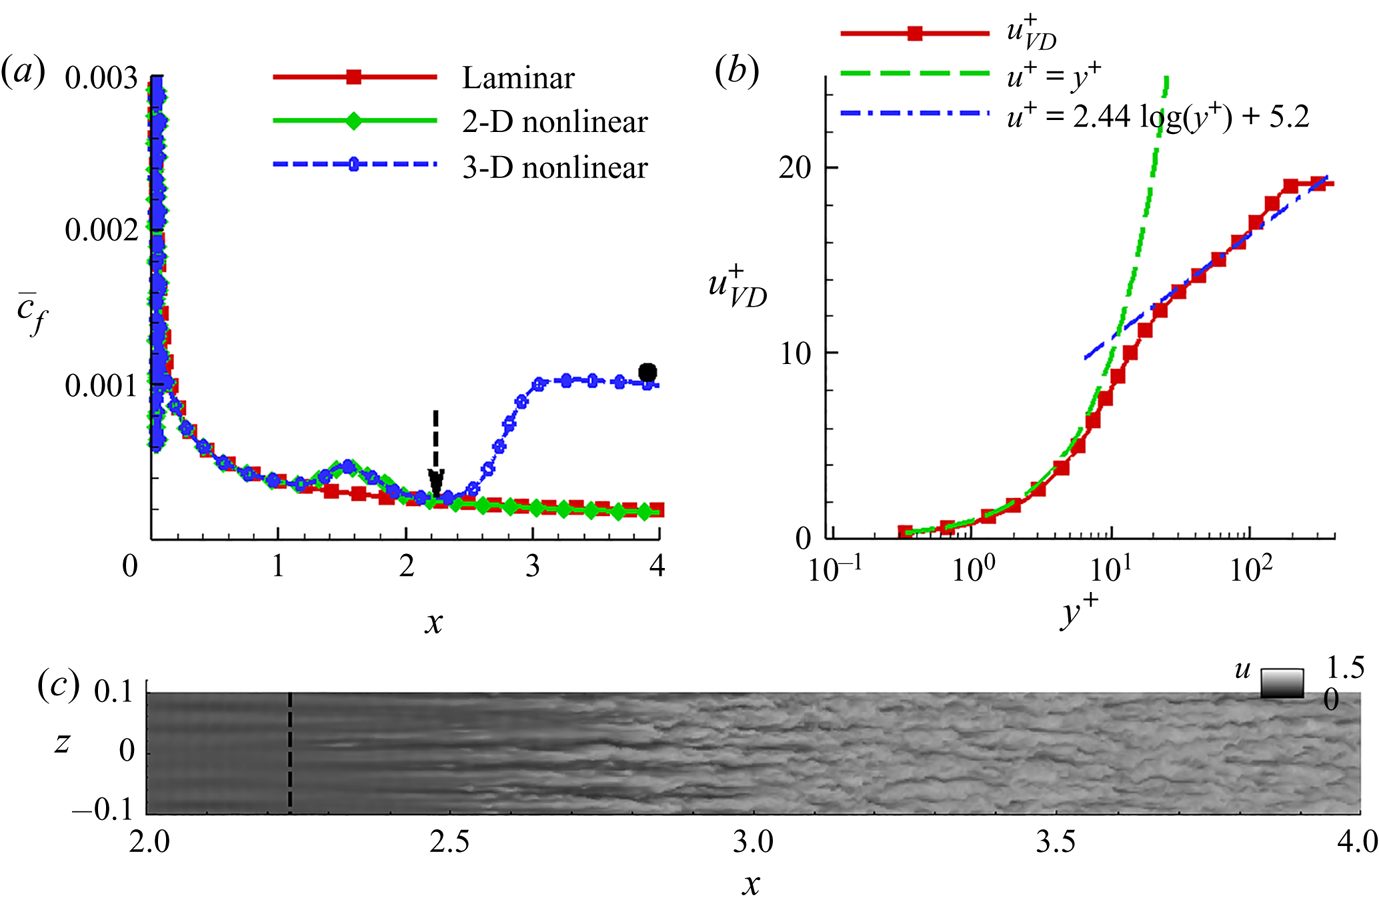
The time-averaged skin-friction coefficient,  $\bar {c}_f$, is plotted in figure 16(a), for the 2-D laminar, 2-D nonlinear and 3-D nonlinear simulations, as indicated. For the 3-D case, the
 $c_f$ value is also averaged across the span. The laminar value of
 $\bar {c}_f$ decreases monotonically in the downstream direction, following the initial peak associated with the leading edge viscous–inviscid interaction. The
 $\bar {c}_f$ obtained for the nonlinearly saturated 2-D DNS is very similar to that of the laminar case, except for a localized hump in
 $1 \le x \le 2$ corresponding to the peak amplitude of the saturated second-mode waves. Such a peak in skin friction was also observed by Franko & Lele (Reference Franko and Lele2013) in the region of second-mode saturation. The 3-D DNS closely follows the trend in the 2-D nonlinear DNS until this hump relaxes to the laminar value. Beyond this point, the skin friction rises rapidly due to the spanwise breakdown of the boundary layer, ultimately leading to transition. The location of the local minimum in
 $\bar {c}_f$ is obtained at
 $x \sim 2.24$ (marked with a dashed arrow), and can be considered (Kimmel Reference Kimmel1993) as an indicator of the beginning of transition. This location also matches the streamwise station beyond which the spanwise spectra switch over from a narrowband form (peak energy near
 $\beta \sim 150$ or
 $\lambda _z \sim 0.04$) to one where a wide range of low wavenumbers are energized (discussed previously in figure 12a). By the end of the domain,
 $x=4$, the
 $c_f$ value is
 $\sim 0.001$, which is consistent with the turbulent skin-friction value reported in Egorov & Novikov (Reference Egorov and Novikov2016) for identical free stream conditions (marked with a solid circle). The wall-normal profile of streamwise velocity in terms of wall units (
 $y^+$) and friction velocity (
 $u^+$) at this location are provided in figure 16(b). The van Driest transformation is applied to obtain
 $u^{+}_{VD}$, which encompasses the enhanced effects of compressible fluctuations at this edge Mach number (van Driest Reference van Driest1956; Schetz & Bowersox Reference Schetz and Bowersox2011). The dashed curve is a linear relation expected in the viscous sublayer, which extends until around
 $y^+ \sim 10$, consistent with prior calculations (Franko & Lele Reference Franko and Lele2013; Sivasubramanian & Fasel Reference Sivasubramanian and Fasel2015). The viscous sublayer is followed by the buffer layer, beyond which a logarithmic variation is observed in the velocity profile. This profile is compared with a reference log-law formula (Roy & Blottner Reference Roy and Blottner2006), which indicates the existence of a turbulent boundary layer. The velocity defect law constitutes the deviation from the log-law in the outer region.
(a) Time-averaged skin-friction coefficient for various cases as indicated. (b) Wall-normal velocity profile at  $x=4$, in terms of wall units and friction velocity. (c) Contours of
 $u$ on a wall-parallel plane at
 $y \sim 8 \times 10^{-3}$.

In cases where the second-mode fundamental resonance dominates, the transition location is relatively prolonged (Koevary et al. Reference Koevary, Laible, Mayer and Fasel2010; Khotyanovsky & Kudryavtsev Reference Khotyanovsky and Kudryavtsev2016); this has been associated with the weaker streamwise streaks generated (Franko & Lele Reference Franko and Lele2013). These streaks are visible primarily in the region  $2 \le x \le 3$ in figure 16(c), which plots the instantaneous streamwise velocity contours at
 $y \sim 8 \times 10^{-3}$. This wall-normal location corresponds to
 $y^+ \sim 30$ (lower end of the log-layer), based on the boundary layer properties at the exit of the domain (
 $x=4$). The transition location,
 $x = 2.24$, is also marked with a dashed vertical line. Consistent with the results in Franko & Lele (Reference Franko and Lele2013), the streamwise streaks are generated following the saturation of the fundamental second-mode, and eventually develop undulations (observed within
 $2.5 \le x \le 3$), before disintegrating in the turbulent region downstream. Although the fully turbulent region resulting from second-mode fundamental resonance was not addressed in the above reference, detailed analysis of the transitional regime indicated that no peak existed in the skin-friction plot. Figure 16(c) also shows that the instantaneous undulations in the streaks originate at slightly different locations along the span of the plate. This could explain why the skin-friction overshoot was not observed in the time- and span-averaged
 $c_f$, plotted in figure 16(a). A previous study (Unnikrishnan & Gaitonde Reference Unnikrishnan and Gaitonde2019) of this HBL where transition was induced through forcing by a monochromatic first-mode oblique wave, clearly identified a skin-friction overshoot in the transitional regime.
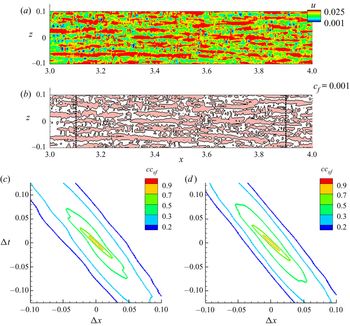
Near-wall features in the boundary layer provide significant insights into the drag penalty on the surface. Here, we study the influence of the transitioned HBL on the wall, as it evolves into a fully turbulent state in the region  $3 \le x \le 4$. The streamwise velocity distribution near the wall is a relevant quantity to identify the skin-friction characteristics, and are presented in figure 17(a). The instantaneous contours indicate the presence of several near-wall patches of high values of
 $u$, which qualitatively indicate regions of high skin friction, since
 $u$ is a surrogate for
 $c_f$ in this spanwise homogeneous flow. To relate these regions to shear events, the corresponding instantaneous
 $c_f$ contours are plotted in figure 17(b). The contour level chosen here is
 $c_f=0.001$ which is approximately the value of the mean skin-friction eventually attained in the turbulent region, as seen in figure 16(a). The large-scale patterns in near-wall velocity contours have corresponding signatures in the above-average skin-friction regions, consistent with the observations of Pan & Kwon (Reference Pan and Kwon2018), where regions of extreme skin friction were characterized by large-scale structures. Their conditional analysis identified ‘finger-shaped’ large-scale structures in negative wall-normal velocity perturbations directly above these high-shear regions, which signify ‘splatting’ events (Agostini, Leschziner & Gaitonde Reference Agostini, Leschziner and Gaitonde2016), constituting strong movements of outer-layer high-momentum fluid towards the wall.
(a) Instantaneous contours of  $u$ near the wall. (b) Corresponding signature of
 $c_f$, plotted using the contour representing its mean value in the turbulent region. Spatio-temporal correlations in
 $c_f$ obtained at (c)
 $x=3.1$ and (d)
 $x=3.9$.

The post-transitional characteristics of the HBL are expected to evolve until fully turbulent conditions are achieved. The evolution of skin-friction patterns in this region are further quantified using spatio-temporal correlations,  $cc_{sf}$, defined as
 \begin{equation} cc_{sf}(x,y,z,{\rm \Delta} x,{\rm \Delta} t)= \frac{\overline{c_f(x,y,z,t)c_f(x+{\rm \Delta} x,y,z,t+{\rm \Delta} t)}}{\left(\overline{c_f^2(x,y,z,t)}\right)^{0.5} \left(\overline{c_f^2(x+{\rm \Delta} x,y,z,t+{\rm \Delta} t)}\right)^{0.5}}.\end{equation}
Figures 17(c) and 17(d) display spanwise-averaged results at  $x=3.1$ and
 $x=3.9$, which highlight key changes in skin-friction patterns that transpire in this streamwise domain. The primary observation is that the width of the spatio-temporal correlation contours decreases as the HBL becomes turbulent, approximately
 $10\,\%$ between the two locations examined. This indicates a reduction in the length of the high-velocity patches near the surface. No significant changes are observed in the convection velocity of these patches as suggested by the similar slopes of the correlation contours at these two locations.
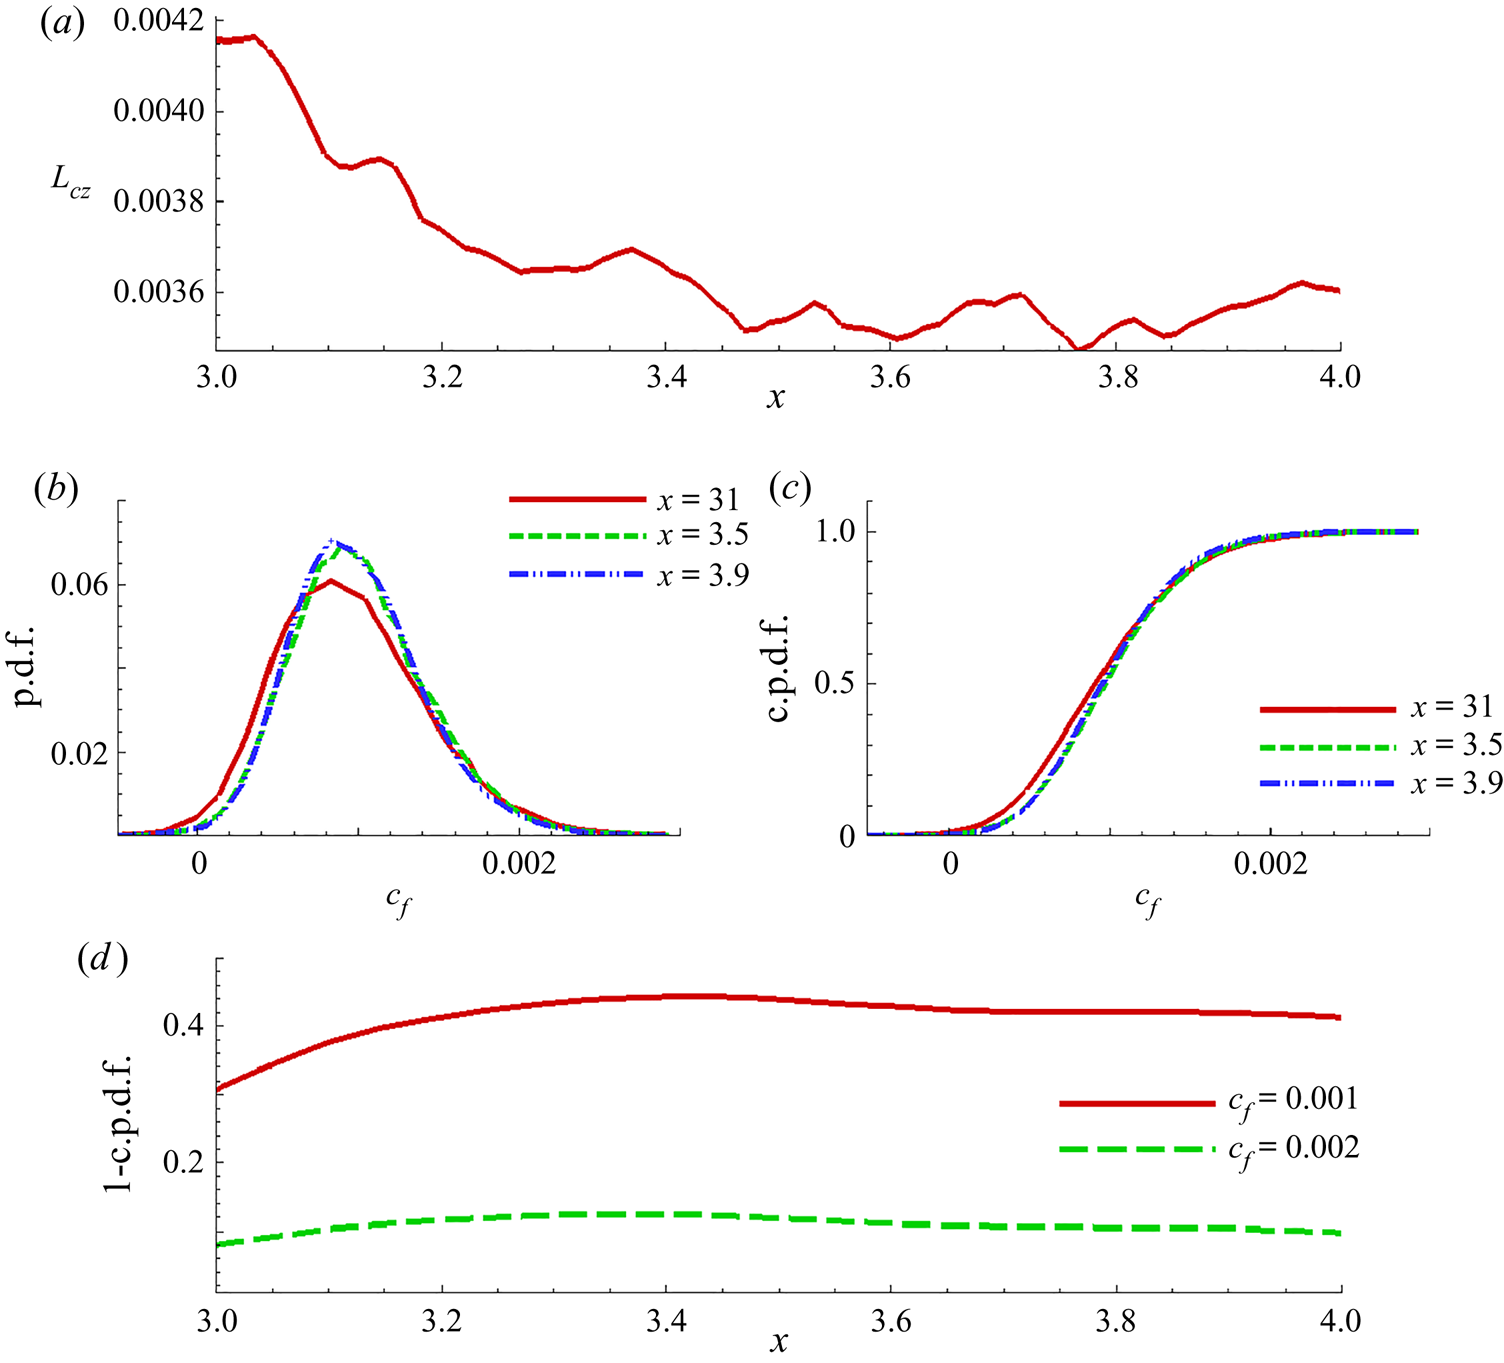
The spanwise extent of the localized regions of high skin friction also varies with streamwise distance, as indicated by the integral length scale,  $L_{cz}$, in figure 18(a), plotted as a function of streamwise distance. Here,
 $L_{cz}$ is obtained by integrating the autocorrelation function of
 $c_f$. A decrease in spanwise width of around
 $14 \%$ is observed in the range
 $3 \le x \le 3.6$, beyond which fluctuations induce only minor variations. The high skin-friction patches initially display spanwise extents that thus closely follow the secondary instability of the roller structures, which were disintegrated following the amplification of oblique waves with
 $\lambda _z \sim 0.04$.
(a) Spanwise integral length scale in  $c_f$ plotted versus
 $x$. (b) The p.d.f. of
 $c_f$ at indicated locations. (c) Corresponding c.p.d.f.s, as indicated. (d) Probability of occurrence of shear events above the threshold value (as indicated) plotted with
 $x$.

The occurrence of shear events can also be quantified using their probability distribution function (p.d.f.) at various streamwise locations. Spanwise averaged p.d.f.s are provided in figure 18(b), at the indicated locations. Immediately following transition,  $c_f$ exhibits a relatively broader distribution, at
 $x=3.1$, with a positive skewness (
 $\textrm {mean} \sim 0.001$,
 $\textrm {mode} \sim 0.0008$). As turbulence sets in, the
 $c_f$ distribution becomes narrower, with the p.d.f.s at
 $x=3.5$ and
 $x=3.9$ exhibiting more frequent occurrences of skin-friction patches around the mean value of
 $c_F \sim 0.001$. Since the positive tail in the streamwise velocity and
 $c_f$ distribution is indicative of large-scale sweeping motions (Agostini et al. Reference Agostini, Leschziner and Gaitonde2016), the cumulative p.d.f.s (c.p.d.f.s) is a suitable measure to quantify the occurrence of such events in the post-transition region. The c.p.d.f.s of
 $c_f$ at these three locations (figure 18c) indicate that developing turbulence in the boundary layer results in a reduction of events with low skin-friction impact, in
 $0 \le c_f \le 0.001$. These plots also confirm that the distribution characteristics of wall loading have converged to an equilibrium state in the latter half of the domain,
 $3 \le x \le 4$. The quantity, 1-c.p.d.f., at a chosen value of
 $c_f$, shows the fractional occurrence of events above that threshold. Figure 18(d) plots this function with
 $x$ for two values of
 $c_f$, one near the mean and the other twice that value. The plot for
 $c_f=0.001$ indicates that large-scale near-wall sweeping motions increase following transition, and eventually equilibrate. The occurrence of extreme skin-friction events categorized as above
 $c_f=0.002$ exhibit relatively lesser variations, but nevertheless settle to around
 $10\,\%$ by the end of the domain. This is consistent with the classification of large-scale events by Agostini & Leschziner (Reference Agostini and Leschziner2014), where a
 $10\,\%$ threshold was chosen for this segregation.
8. Summary
The entire process of linear and nonlinear development of a second-mode instability followed by its role in transition and eventual generation of a turbulent HBL is examined with 3-D DNS. An LST approach is employed to correctly inform the second-mode initiation process. In the linear growth region, ‘rope-shaped’ structures, similar to prior experimental observations, arise in the density-perturbation field near the GIP of the base flow. When the forcing is increased to induce nonlinear effects, the second-mode envelope becomes asymmetrically modulated. The generation of superharmonics and base-flow distortion results in wider crests and narrower peaks in pressure perturbations. The density-perturbation field now exhibits tightly braided structures, closely resembling schlieren visualizations of the late-stage evolution of second-mode wavepackets. The saturated field is delineated into orthogonal modes, which identify a second region of fundamental frequency growth outside the linear envelope. The integer superharmonics thus extracted, exhibit a proportional decrease in wavelengths, and maintain similar phase speeds as the fundamental mode.
The 3-D breakdown process is realized by forcing the 2-D second-mode in the presence of weak random perturbations, which allow the receptivity of the nonlinearly distorted base flow to guide the breakdown process. The domain chosen is long enough to obtain a well-developed inertial subrange in the streamwise-velocity spectrum of the fully turbulent boundary layer. The initial growth of 2-D ‘roller’ structures is followed by the onset of a secondary instability that results in selective amplification of a narrow band of spanwise wavenumbers. This yields lambda vortices below the GIP and spanwise disintegration of the rollers. Streamwise vortex-stretching in the lambda vortices generates hairpin vortices, inclined to the GIP locus, to manifest a localized peak (below the GIP) in streamwise length scales within the transitional HBL.
A detailed frequency-based analysis facilitates a clearer description of the breakdown process mechanisms. Although the region of linear growth is characterized by localized generation of several superharmonics, these attenuate downstream. Rather, in the post spanwise-breakdown region, subharmonic and lower frequencies are excited, and a broadband nature is observed. The spanwise wavenumber spectrum identifies the sensitivity of the nonlinearly saturated HBL to oblique waves with wavelengths around  $20\,\%$ of the spanwise extent of the domain. The peak energy in this wave is attained in the second region of amplification of the fundamental frequency identified in the 2-D nonlinear simulation, and results in spanwise breakdown, quickly populating the wavenumber spectrum. The presence of fundamental resonance is confirmed through the observation of these oblique waves, which occur at the fundamental frequency.
Analysis of the pressure signal near the GIP through the bispectrum measure yields key insights into the quadratic coupling present in the nonlinear flow field; the simulations augment the understanding of this phenomenon, which is also observed in experimental data. The fundamental mode progressively interacts with itself and the superharmonics thus generated, resulting in a multiharmonic spectrum prior to transition. This is followed by broadband ‘self-interaction’ at frequencies in the vicinity of the fundamental. The experimentally observed interactions among a continuous range frequencies defined by a linear equation are also detected further downstream, where the subharmonic resonance is also observed. Modal analysis yields the global form of the fundamental and subharmonic components – the former constitute the most dominant feature until spanwise breakdown is initiated. The subharmonic displays minimal presence prior to this event, but emerges as the dominant component immediately downstream.
The connection between the skin-friction coefficient and near-wall dynamics of the post-transition region is also illustrative. Here,  $c_f$ reaches the expected turbulent value for this free stream condition towards the end of the domain, where a turbulent
 $u$-velocity profile is observed. Regions of intense skin-friction levels correspond to the large-scale ‘splatting’ motions entraining high-momentum fluid towards the wall. The spanwise and streamwise extents of these regions decrease following transition, until turbulence establishes in the boundary layer. Thus fundamental resonance is found to result in a fully turbulent HBL downstream.
Acknowledgements
This research was supported by the Office of Naval Research (grant: N00014-17-1-2528) monitored by E. Marineau, with R. Burnes serving as technical point of contact. The simulations were performed with a grant of computer time from the DoD HPCMP DSRCs at AFRL, NAVO and ERDC, and the Ohio Supercomputer Center.
Declaration of interests
The authors report no conflict of interest
Appendix. Grid resolution studies
To ensure that the insights obtained from the 3-D DNS are not significantly dependent on the choice of grid, we summarize comparisons between two grids in figure 19. The fine grid (GF) is the relatively finer grid, which was used to obtain the results described in the above sections. The coarse grid (GC) is  $20\,\%$ coarser in the wall-normal and spanwise directions, relative to GF. The streamwise resolution is comparable between the two grids. The streamwise development of frequency spectra is compared in figures 19(a) and 19(c) from the two grids. Both grids display very similar evolution of superharmonics prior to transition. The location at which harmonic spectra attain a broadband character is also consistent between the two grids. Similar results are also obtained in the wavenumber spectra in figures 19(b) and 19(d), for GC and GF, respectively. Irrespective of the spanwise resolution of the grids,
 $\beta \sim 150$ remains the most amplified oblique wave within the streamwise region,
 $1.8 \le x \le 2.5$. The GC also captures the continuous range of quadratic interaction at
 $x \sim 2.2$, as shown in figure 19(e), consistent with the results for GF (see figure 13d). Thus, key characteristics of transition are consistently reproduced on both the grids. Finally, we compare the quantitative nature of turbulence obtained in GC and GF using the streamwise velocity spectra in figure 19(f). The comparison is reported near the outlet of the domain, at
 $x \sim 4$, and
 $y \sim 0.005$, corresponding to
 $y^+ \sim 21$. A reasonable match is obtained between the two grids, with GC displaying slightly more attenuation at higher frequencies, as expected.
(a) Wall-pressure frequency spectra at various streamwise locations at the midspan for the GC. (b) Spanwise wavenumber spectra obtained from wall-pressure perturbations for the GC. (c) Wall-pressure frequency spectra at various streamwise locations at the midspan for the GF. (d) Spanwise wavenumber spectra obtained from wall-pressure perturbations for the GF. (e) The bispectrum evaluated from pressure perturbations at  $x\sim 2.2$, on GC. (f) Comparison of streamwise velocity spectra obtained on GF and GC, at the indicated location.