





1. Introduction
This article discusses the linear stability of a rigidly rotating liquid column. The limit of zero rotation corresponds to the classical Rayleigh–Plateau problem analysed first, in the inviscid limit, by Plateau (Reference Plateau1873) and later by Rayleigh (Reference Rayleigh1878). The subsequent literature on the rigidly rotating liquid column (Hocking & Michael Reference Hocking and Michael1959; Hocking Reference Hocking1960; Gillis & Kaufman Reference Gillis and Kaufman1962; Pedley Reference Pedley1967) primarily focused on the necessary and/or sufficient condition for instability, although later Weidman, Goto & Fridberg (Reference Weidman, Goto and Fridberg1997) examined the dominant unstable modes for the inviscid rotating column based on growth-rate calculations. More recently, Kubitschek & Weidman (Reference Kubitschek and Weidman2007a) obtained the dominant modes for the viscous rotating column, and organized their results based on the wavenumber of the dominant perturbation, in a parameter plane consisting of the Weber number (a dimensionless measure of rotation defined below) and the column Reynolds number. The boundaries demarcating the crossover of the dominant mode in this plane converged smoothly to the inviscid predictions of Weidman et al. (Reference Weidman, Goto and Fridberg1997) for  $Re\to \infty$. The later experiments of Kubitschek & Weidman (Reference Kubitschek and Weidman2007b) were consistent with the modal crossover boundaries obtained in Kubitschek & Weidman (Reference Kubitschek and Weidman2007a). While all of the above results show the expected destabilizing effect of rotation, in terms of a larger range of wavenumbers turning unstable with an increase in the column angular velocity, on account of centrifugal forces, there remains a difference between the viscous and inviscid criteria for instability obtained in the early literature (Hocking & Michael Reference Hocking and Michael1959; Hocking Reference Hocking1960; Gillis & Kaufman Reference Gillis and Kaufman1962; Pedley Reference Pedley1967). Although the expression for the stability threshold (see (2.5) below) remains the same in both cases, it has been shown to be necessary and sufficient in the presence of viscosity (Gillis & Kaufman Reference Gillis and Kaufman1962), but only serves as a sufficient condition in the inviscid limit (Pedley Reference Pedley1967; Weidman Reference Weidman1994; Henderson & Barenghi Reference Henderson and Barenghi2002). In this article, we re-examine the instability of a rigidly rotating liquid column, with an emphasis on the entire inviscid spectrum, including the neutral modes. The analysis sheds new light on this problem, showing that inviscid unstable modes arise from an infinite hierarchy of coalescences between pairs of dispersion curves just above the viscous threshold. The resulting intricate picture helps explain the aforementioned difference between the nature of the inviscid and viscous threshold criteria.
Perturbations to a liquid column may be characterized in terms of their azimuthal  $(n)$ and axial
 $(k)$ wavenumbers and, accordingly, may be classified as axisymmetric (
 $n = 0, k\neq 0$), planar (
 $n \neq 0,k = 0$) and helical (spiral) or three-dimensional perturbations (
 $n \neq 0, k \neq 0$). Starting in § 2, we study the dispersion curves, and the associated stability thresholds, for a rigidly rotating column of liquid subject to each of the aforementioned classes of perturbations. The nature of the dispersion curves is a function of the Weber number,
 $We = \rho \varOmega ^2 a^3 / \gamma$, a dimensionless parameter that compares the relative importance of centrifugal and surface tension forces; here,
 $\rho$ is the density,
 $\varOmega$ the column angular velocity,
 $a$ the column radius and
 $\gamma$ the coefficient of surface tension. For helical perturbations, we analyse the dispersion curves in the
 $We$–
 $k$ plane for different fixed
 $n$ values. Note that, following early work by Hocking & Michael (Reference Hocking and Michael1959) and Hocking (Reference Hocking1960),
 $We^{-1}$ has often been referred to as the Hocking parameter (
 $L$); for instance, the aforementioned efforts of Weidman et al. (Reference Weidman, Goto and Fridberg1997) and Kubitschek & Weidman (Reference Kubitschek and Weidman2007a) presented their results for the dominant inviscid modes as a function of
 $L$, and the dominant viscous modes in the
 $L$–
 $Re$ plane, respectively. In what follows, we stick to
 $We$. In the next paragraph, we begin by recapitulating the well known results for the classical case of a stationary liquid column (
 $We = 0$).
The classical Rayleigh–Plateau instability is one of a stationary liquid column to sufficiently long wavelength axisymmetric perturbations, and explains the spontaneous breakup of a (slow) jet into nearly uniformly sized droplets (see Chandrasekhar (Reference Chandrasekhar1981); for sufficiently slow speeds, the shear at the air–water interface is unimportant, and the jet may be made equivalent to a stationary column via a Galilean transformation). Plateau (Reference Plateau1873) concluded, via a quasistatic analysis, that perturbations with an axial wavelength greater than the circumference of the column ( $ka<1$ or, if the wavenumber is scaled with the column radius,
 $k < 1$) act to destabilize the column by decreasing the total interfacial area. Rayleigh (Reference Rayleigh1878) then accounted for both inertia and surface tension, obtaining the following dispersion relation for small amplitude Fourier mode perturbations, proportional to
 $\exp ({{\rm i}(kx + n\theta - \sigma t)})$, in the inviscid limit:
 \begin{equation} \sigma^2 = k\frac{{\rm I}_n'(k)}{{\rm I}_n(k)}(k^2+n^2-1), \end{equation}
where  $\sigma = \sigma _r + {\rm i}\sigma _i$ has been scaled with
 $\sqrt {\gamma /\rho a^3}$ (
 $\sigma _r$ being the frequency and
 $\sigma _i$ being the growth rate), and the axial wavenumber
 $(k)$ is now scaled with
 $1/a$;
 ${\rm I}_n(k)$ is the modified Bessel function of the first kind with the prime denoting differentiation. From (1.1), only axisymmetric perturbations are found to be unstable (
 $\sigma _i > 0$) for
 $k < 1$, with the maximum growth rate corresponding to
 $k = 0.697$. The growing and decaying modes transform to a pair of neutral modes across
 $k = 1$, the latter corresponding to capillary waves propagating in opposite directions along the axis of the column. For
 $k \rightarrow \infty$, one obtains
 $\sigma = \sqrt {\gamma k^{3} / \rho }$ regardless of
 $n$, which is the dispersion relation for capillary waves propagating on an infinite plane interface.
Hocking & Michael (Reference Hocking and Michael1959) and Hocking (Reference Hocking1960) first investigated the effects of rotation on a liquid column subject to planar and axisymmetric perturbations, obtaining the necessary and sufficient criteria for stability. For the axisymmetric case, the authors obtained the criterion  $We < k^2 -1$, regardless of viscosity. For the planar case, the authors found the inviscid criterion to be
 $We < n(n+1)$, while that for any finite viscosity to be
 $We < n^2 -1$ (see also Gillis Reference Gillis1961). Gillis & Kaufman (Reference Gillis and Kaufman1962) later studied three-dimensional perturbations of a viscous rotating column and concluded that the latter criterion generalizes to
 $We < k^2 + n^2 - 1$. Pedley (Reference Pedley1967) showed that although the aforementioned viscous criterion remains relevant in the inviscid limit, it only serves as a sufficient condition for stability. Thus, for inviscid columns, a necessary and sufficient condition is not yet known, and clarifying the above difference between the viscous and inviscid criteria is the subject of this effort. As stated above, our focus on the entire eigenspectrum allows us to understand in detail the regions in parameter space corresponding to the inviscid unstable modes while also pointing to the necessary and sufficient criterion for inviscid stability.
While the main findings of the present effort pertain to helical perturbations, we nevertheless consider all three classes of perturbations mentioned above, in sequence, and a complete picture of linear stability emerges as a consequence. Thus, § 2 below starts off with a brief description of the linear stability formulation, which is then followed by subsections pertaining to axisymmetric (§ 2.1) and planar (§ 2.2) perturbations. We detail our new findings for three-dimensional perturbations in § 2.3. In the conclusions section (§ 3), we show that our findings with regard to the non-trivial nature of the inviscid spectrum carry over to the case where the interfacial cohesion underlying surface tension is replaced by a volumetric cohesion mechanism, that of self-gravitation, instead. This makes our findings relevant to the astrophysical scenario, and we end with a few pertinent comments in that regard.
2. The rotating liquid column
The rigidly rotating columnar base state corresponds to  $u_r = 0$,
 $u_\theta = \varOmega r$,
 $u_z = 0$ and
 $p = p_0 + ({\rho \varOmega ^2 r^2}/{2})$ for
 $r < a$, where
 $p_o$ is an arbitrary baseline pressure on account of incompressibility. The governing linearized equations for small-amplitude perturbations may be derived in the usual way from the Euler equations, with kinematic (radial velocity) and dynamic (pressure) boundary conditions at the column free-surface. The equations governing inviscid evolution have already been written down and solved in earlier efforts (Hocking & Michael Reference Hocking and Michael1959; Hocking Reference Hocking1960; Weidman et al. Reference Weidman, Goto and Fridberg1997), and in what follows, we directly examine the resulting dispersion relations. Note that the density of the exterior fluid is assumed to be small relative to that of the liquid column, and its influence on column oscillations is neglected.
2.1. Axisymmetric perturbations
The dispersion relation for axisymmetric perturbations was obtained by Hocking (Reference Hocking1960), and is given by
 \begin{equation} We \; \sigma^{2} \sqrt{\frac{4}{\sigma^{2}}-1} \frac{{\rm J}_{0}(\alpha)}{{\rm J}_{1}(\alpha)} - k(k^{2}-1) + We \; k=0, \end{equation}
where  $\alpha = k\sqrt {{4}/{\sigma ^2} - 1}$. Here, as before,
 $k$ is scaled with
 $1/a$ but
 $\sigma$ is scaled with
 $\varOmega$ as opposed to
 $\sqrt {\gamma k^3 / \rho }$ used in (1.1). Using (2.1), Hocking obtained the necessary and sufficient criterion for stability to be
 \begin{equation} We < k^2 - 1 \end{equation}
indicating that centrifugal forces destabilize the system, increasing the interval of unstable wavenumbers from  $(0,1)$ in the non-rotating case to
 $(0,\sqrt {1+We})$ in the rotating case.
Figure 1(c) shows the dispersion curves for the axisymmetrically perturbed column obtained from (2.1). The spectrum is seen to borrow its traits from two constituent cases – the Rayleigh–Plateau configuration involving only surface tension (figure 1a) and the Rankine vortex involving only rotation (figure 1b). Much like the Rankine vortex, the rotating liquid column supports an infinite sequence of primarily Coriolis-force-driven modes (henceforth referred to as the Coriolis modes), with the inner dispersion curves corresponding to perturbations with an increasingly fine-scaled radial structure; note that the Rankine vortex has recently been shown to also possess a continuous spectrum on account of the irrotational shear in the column exterior (Roy & Subramanian Reference Roy and Subramanian2014; Roy et al. Reference Roy, Garg, Reddy and Subramanian2021). The Coriolis modes in both these problems have frequencies  $\sigma _r \in (-2,2)$. Additionally, the rotating liquid column has two modes that owe their origin to surface tension akin to the Rayleigh–Plateau configuration (henceforth referred to as the capillary modes). Figure 1(c) shows the family of Coriolis modes along with the two capillary modes, and their variation with
 $k$, for
 $We = 20$. Note that the pair of capillary modes follow the characteristic
 $k^{3/2}$ scaling for large
 $k$, while the Coriolis mode frequencies approach
 $\sigma _r = {\pm }2$ in this limit. The effect of
 $We$ on the dispersion curves is illustrated in figure 2. For
 $k \ll \sqrt {We + 1}$, Coriolis forces dominate the spectrum, and it is only for
 $k > \sqrt {We + 1}$ that the effects of surface tension become apparent, with the pair of capillary mode dispersion curves transitioning to the aforementioned
 $k^{3/2}$ scaling. For
 $We \gg k^2-1$, (2.1) reduces to
 $\sigma ^{2} \sqrt {{4}/{\sigma ^{2}}-1} ({{\rm J}_{0}(\alpha )}/{{\rm J}_{1}(\alpha )}) + k = 0$, a
 $We$-independent dispersion relation; the transition
 $k$ has receded to infinity and the entire spectrum is governed by Coriolis forces.
The dispersion curves for the Rayleigh–Plateau problem (a), the Rankine vortex (b) and the rotating liquid column with  $We = 20$ (c). Blue curves denote neutral modes while the dotted orange curves denote growing/decaying modes. Only the first 10 of the infinite number of neutral modes are shown for the Rankine vortex and the rotating column.

The dispersion curves of the rotating liquid column with varying  $We$: (a)
 $We = 0.1$; (b)
 $We = 1$; (c)
 $We = 10$; (d)
 $We = 20$. Blue curves denote neutral modes while dashed orange curves denote growing / decaying modes. A vertical dashed line drawn at
 $k = \sqrt {1+We}$ indicates the axial wavenumber beyond which the effects of surface tension on the neutral modes become significant.

Before discussing the spectrum further, we note that while the dispersion relation in (2.1) is in a form suitable for making connections with prior results, and for examining limiting scenarios, it is necessary to use an alternate form, obtained from multiplying all terms in (2.1) by  ${\rm J}_1(\alpha )$, when plotting the dispersion curves using a software such as Mathematica. Not doing so leads to Mathematica erroneously interpreting the singularities of (2.1), corresponding to the zeros of
 ${\rm J}_1$, as additional zeros, in turn leading to spurious dispersion curves. Similar remarks apply to the dispersion relation for non-axisymmetric modes analysed below (see (2.6)).
The description above clearly shows that there is a qualitative change in the nature of the eigenspectrum with the onset of rotation, as evident from comparing figures 1(a) and 1(c), and points to the stationary column  $(We \rightarrow 0)$ being a singular limiting case. The interfacial dynamics for the stationary column is entirely determined by the pair of capillary modes (whether neutral or unstable), which are now irrotational. For these modes, the non-dimensional frequency (
 $\sigma$) in (2.1) diverges in the limit of zero rotation. Thus,
 $\alpha$ reduces to
 $ik$ and one recovers the Rayleigh–Plateau dispersion relation given in (1.1). In contrast, the Coriolis modes, which remain vortical in the zero-rotation limit, may be regarded as a complete set of stationary vortical perturbations that do not perturb the column free surface. For these modes, the non-dimensional frequency
 $\sigma$ remains finite (implying that the dimensional one vanishes as
 $O(\varOmega )$) and, therefore, so does
 $\alpha$. The dispersion relation reduces to
 ${We}\, {\rm J}_0(\alpha )/{\rm J}_1(\alpha ) = k(k^2 - 1)$, implying that
 ${\rm J}_1(\alpha ) = 0$ governs the Coriolis mode frequencies for
 $We=0$; this also ensures that the radial velocity vanishes at
 $r = 1$ (see 3.2a in Kubitschek & Weidman (Reference Kubitschek and Weidman2007a)), consistent with the aforementioned requirement of an unperturbed free surface. An analogous limiting scenario prevails for any non-zero
 $n$, with the limiting dispersion relation being given by
 $\sigma -n = ({2n\,{\rm J}_n(\alpha )})/({\alpha {\rm J}_n'(\alpha )})$; thus, the Coriolis modes, in all cases, reduce to stationary vortical perturbations as
 $We \rightarrow 0$, and are irrelevant to the dynamics of free surface disturbances.
Finally, it needs mentioning that while the growing and decaying modes for the rotating column exist over a wider range of wavenumbers given by  $0 < k < \sqrt {1+We}$, they do not emerge as a result of coalescence of neutral modes, as was the case for the Rayleigh–Plateau problem (where the so-called ‘principle of exchange of stability’ holds); instead, as evident from the dashed dispersion curves in figures 1 and 2, they arise independently as the stability threshold is crossed. Importantly, since the eigenvalues associated with these modes are purely imaginary, the state of neutral stability is one of rigid rotation, and therefore, as pointed out by Rosenthal (Reference Rosenthal1962), viscosity cannot alter the threshold. Thus,
 $We = k^2 - 1$ remains the threshold regardless of the column Reynolds number (which may be defined as
 $Re = \varOmega a^2/\nu$, with
 $\nu$ being the kinematic viscosity).
2.2. Planar perturbations
Next, we examine planar perturbations, the inviscid dispersion relation for which was first obtained by Hocking & Michael (Reference Hocking and Michael1959) and is given by
 \begin{equation} \sigma = n-1 \pm \sqrt{\frac{(n-1)(n(n+1)-We)}{We}}, \end{equation}
which is algebraic (quadratic) instead of transcendental, as was the case for axisymmetric perturbations (see (2.1)), and as is also the case for helical perturbations (see (2.6)). The existence of only a pair of planar modes is because the infinite number of Coriolis modes degenerate to  $\sigma = n$ for
 $k \rightarrow 0$ in the inviscid limit, see figures 1(c) and 4(a). For any
 $We$, the two planar-wave frequencies are symmetrically distributed about
 $n-1$. For small
 $We$, they are asymptotically large (of
 $O(We^{-1/2})$, which corresponds to a dimensional frequency of
 $\sqrt {\gamma /\rho a^3}$, as expected, and approach each other with increasing
 $We$. For
 $n \geq 2$, the modes coalesce at
 $\sigma = n-1$ for
 $We = n(n+1)$, the inviscid threshold mentioned earlier, and become complex valued for
 $We > n(n+1)$, implying instability.
Unlike the axisymmetric case, viscosity has a profound effect on the stability of the rotating column to planar perturbations. To see this, let  $\varLambda = {n(n^2-1)}/{We} - n$ so that the pair of inviscid frequencies above may be written as
 $\sigma = n-1 \pm \sqrt {1+\varLambda }$ and the inviscid threshold corresponds to
 $\varLambda = -1$. For large but finite
 $Re$, Hocking (Reference Hocking1960) obtained the following expressions for the planar-wave frequencies, corrected for viscous effects, again as the solutions of a quadratic equation:
 \begin{equation} \sigma = n - 1 \pm \sqrt{1+\varLambda} - \frac{{\rm i}}{Re} \left(2n(n-1)\frac{-1\pm\sqrt{1+\varLambda}}{\pm \sqrt{1+\varLambda}}\right). \end{equation}
Note that the  $O(1/Re)$ scaling for the viscous correction, implied by (2.4), is not valid near the inviscid threshold as the expression within brackets diverges for
 $\varLambda \to -1$. One may nevertheless derive the requirement for viscous instability. This corresponds to
 $\sigma$ in (2.4) having a negative imaginary part which in turn translates to
 $\varLambda = 0$ (bounded away from the aforementioned breakdown value), or
 $We = n^2-1$. This threshold was shown to be applicable for columns of all finite
 $Re$ (Gillis Reference Gillis1961). Rather counter-intuitively, on one hand, the viscous threshold does not depend on
 $Re$, leading to the aforementioned discontinuous jump in the threshold
 $We$ from
 $n(n+1)$ to
 $n^2-1$. On the other hand, the viscous threshold for stability is less than the inviscid threshold, implying the destabilizing influence of viscosity. The latter behaviour is attributed to the phase difference between pressure and displacement waves. The two waves are exactly out of phase in the inviscid limit. This is no longer true in presence of viscous effects which allow for a net work done during a single oscillation. The role of viscosity in modifying the phase difference, and thereby inducing exponential growth, is reminiscent of the Miles mechanism that accounts for the growth of wind-driven gravity waves (Miles Reference Miles1957; Benjamin Reference Benjamin1967); although, on account of the rigidly rotating base state, there isn't the complicating effect of a critical layer (Miles Reference Miles1957) in the present problem.
Figures 3(a) and 3(b) show that although the stability threshold changes discontinuously for any finite  $Re$, the growth rates in the interval between the inviscid and viscous thresholds (
 $n^2 - 1 < We < n(n+1)$) scale viscously, and therefore, decrease to zero for
 $Re \rightarrow \infty$ (see also the figure in Gillis (Reference Gillis1961) and figure 6c in Kubitschek & Weidman (Reference Kubitschek and Weidman2007a)). For
 $We \in (n^2-1, n(n+1))$, the growth rates scale as
 $Re^{-1}$, while remaining
 $O(1)$ for
 $We > n(n+1)$. Within a small
 $O(Re^{-2})$ interval around
 $We = n(n+1)$, the growth rates exhibit a slower decay of
 $O(Re^{-1/2})$ for
 $Re \rightarrow \infty$, consistent with the singular role of viscosity in the neighbourhood of the inviscid threshold, implied by (2.4), see figure 3(b). Finally, it is worth mentioning that the viscous dispersion relation is a transcendental one even for planar modes (Hocking Reference Hocking1960). Thus, for any finite
 $Re$, there exist an infinite number of planar modes and, importantly, they remain non-degenerate. It may be shown that all but two of these modes (the two being governed by the corrected quadratic derived by Hocking, given by (2.4)) have
 $\sigma _r \rightarrow n\varOmega$, with
 $\sigma _i \sim O(Re^{-1})$ in the limit
 $Re \rightarrow \infty$. The zero Doppler frequency limit
 $(\sigma _r - n\varOmega = 0)$ suggests that these remaining modes correspond to the limiting forms of the planar Coriolis modes for large but finite
 $Re$. In fact, for any finite
 $Re$, the
 $\sigma _i$ values for the Coriolis modes form an infinite sequence going asymptotically to
 $-\infty$ with increasing modal index, this being consistent with the fact that the finer-scaled modes must exhibit progressively greater (viscous) decay rates.
The two figures plot the growth rates of planar perturbations as a function of  $We$ and
 $Re$ for
 $n = 4$: (a) growth rates versus
 $We$ for various
 $Re$; (b) growth rates versus
 $Re$ for various
 $We$. Note the discontinuous change in the stability criterion from
 $We = 20$, for the inviscid case (the dotted black curve in (a)) to
 $We = 15$ for any finite
 $Re$. Dashed black lines in (b) denote the large
 $Re$ asymptotes obtained from the planar viscous dispersion relation due to Hocking (Reference Hocking1960).

2.3. Three-dimensional perturbations
The effect of rotation on three-dimensional perturbations is well understood only in the presence of viscosity. As shown first by Gillis & Kaufman (Reference Gillis and Kaufman1962), the necessary and sufficient criterion for the stability of the rotating column in the presence of viscosity is
 \begin{equation} We < k^2 + n^2 -1. \end{equation}
It is easily seen that (2.5) reduces to the corresponding criteria for viscous planar and axisymmetric perturbations for  $n = 0$ and
 $k = 0$, respectively. For inviscid stability, however, this criterion has only been shown to be a sufficient one (Pedley Reference Pedley1967). The relevance of the same threshold
 $We (=k^2 + n^2-1)$ in the presence and absence of viscosity is because, as will be seen below, similar to the axisymmetric case, the system is in a state of rigid-body rotation at this
 $We$. However, the change from a necessary and sufficient condition in the viscous case to only a sufficient one in the inviscid limit points to the possibly subtle relation between the inviscid and viscous stability scenarios.
The dispersion relation for the inviscid rotating column has, in fact, already been given by Weidman et al. (Reference Weidman, Goto and Fridberg1997) as
 \begin{equation} \alpha \frac{{\rm J}_{n-1}(\alpha)}{{\rm J}_{n}(\alpha)} - \frac{We \left(4-(\sigma-n)^{2}\right)}{We + 1-n^{2}-k^{2}} - n\left(1+\frac{2}{(\sigma-n)}\right)=0, \end{equation}
where  $\alpha = k\sqrt {{4}/{(\sigma -n)^2}-1}$. It will be shown below that, for a given
 $n > 1$, the spectrum as governed by (2.6) changes qualitatively with increasing
 $We$. This is illustrated in figure 4 which shows four sets of dispersion curves, for
 $n = 3$, each corresponding to a different regime.
The inviscid dispersion curves corresponding to the different  $We$ regimes for
 $n = 3$: (a)
 $We < n^2-1$ (
 $We = 7$); (b)
 $n^2 - 1 < We < n(n+1)$ (
 $We = 10$); (c)
 $n(n+1) < We < We_{{cusp}}$ (
 $We = 12.5$); (d)
 $We > We_{{cusp}}$(
 $We = 17$); where
 $We_{{cusp}} \approx 16$ for
 $n = 3$. The neutral Coriolis modes are shown in blue and the neutral capillary modes in orange. The real part of the unstable eigenvalues are shown as dashed green curves while the imaginary parts are shown as dashed red curves.

The first regime,  $We < n^2-1$ (
 $=8$ for
 $n=3$), corresponds to the case where the rotating column is stable since
 $We$ is below the aforementioned viscous threshold; the dispersion curves for this
 $We$ are shown in figure 4(a). Similar to the axisymmetric case (see figure 1), the spectrum consists of a pair of capillary modes (orange) and an infinite hierarchy of Coriolis modes (blue), the first few of which are shown in the figure. As
 $We$ is increased, the capillary branches move towards each other with the upper branch moving down towards smaller
 $\sigma$. This is in accordance with (2.3) above, which shows that the two capillary branch frequencies in the planar limit
 $(k = 0)$ approach
 $n - 1$ with
 $We$ approaching the inviscid threshold. Since the Coriolis modes degenerate to
 $\sigma = n$ in the planar limit
 $(k = 0)$, this motion of the upper capillary branch would seem to cause it to cross the Coriolis modes with increasing
 $We$. The coalescences of the retrograde capillary mode with the retrograde Coriolis dispersion curves, that result after the crossing, would then appear to lead to the emergence of unstable modes at higher
 $We$. Note that such a scenario was not possible in the axisymmetric case, where the frequency in the limit
 $k \rightarrow 0$ was identically zero regardless of the particular dispersion curve (capillary or Coriolis) or
 $We$, see figure 2.
The second regime,  $n^2-1 < We < n(n+1)$, is where, as already seen for
 $k = 0$, the column is unstable (to planar perturbations) only in the presence of viscosity. As shown in figure 4(b), the upper capillary branch appears to have moved below the line corresponding to
 $\sigma = n$, and now suffers a coalescence with the lowermost Coriolis branch at
 $k_1 \approx 0.58$. This coalescence is accompanied by the pair of eigenvalues becoming complex-valued for larger
 $k$, implying instability. The instability continues until the column approaches a state of rigid rotation, corresponding to
 $We = k^2+n^2-1$, and the corresponding wavenumber is therefore given by
 $\sqrt {We-n^2+1}$. Thus, the lone interval of instability in this regime is given by
 $k_1< k<\sqrt {We-n^2+1}$ with the upper limit being
 $\sqrt {2}$ for
 $n=3$ and the chosen
 $We$ in figure 4(b).
At  $We = n(n+1)$, the pair of capillary branches coalesce at
 $k = 0$, the corresponding value of
 $\sigma$ being
 $(n-1)$, as predicted by (2.3). Thus, for
 $We$ larger than
 $n(n+1)$, the eigenspectrum exhibits two coalescences, resulting in the unstable intervals
 $0 < k < k_2$ and
 $k_1 < k < \sqrt {We-n^2+1}$ (for the values chosen in figure 4(c),
 $k_1 \approx 0.98$ and
 $k_2 \approx 0.53$). The first interval corresponds to the unstable mode that results from the coalesced pair of capillary modes, and its lower limit (
 $k_2 = 0$ at
 $We = n(n+1)$) denotes the onset of inviscid instability to planar perturbations. The two coalescences lead to an intervening stable interval given by
 $k_2 < k < k_1$ (figure 4c). As a result, the composite dispersion curve that describes the neutral mode is now a combination of portions of the original Coriolis and capillary branches, and has a hysteretic character, as evident from the dispersion curve bending back in the aforementioned stable interval. Although, strictly speaking, the participating Coriolis and capillary modes lose their identity, and only a composite curve remains, an intuitive association of its parts with the original curves is clear. We, therefore, continue to colour portions of the composite curve based on the underlying ‘parent’ curves. With increasing
 $We$,
 $k_1$ and
 $k_2$ approach each other and the hysteretic region shrinks and eventually vanishes. The critical
 $We$ where hysteresis vanishes is termed
 $We_{{cusp}}$; as explained below, this is because the disappearance of the hysteretic region is marked by a cusp in the
 $We$–
 $k$ plane. The third regime can then be defined as
 $n(n+1) < We < We_{{cusp}}$. For
 $n=3$,
 $We_{{cusp}} \approx 16$ (see figure 7b).
The fourth regime corresponds to  $We > We_{{cusp}}$ when the fold in the dispersion curve and, thence, the intermediate stable wavenumber interval vanishes. There is now only a single unstable interval corresponding to
 $0 < k < \sqrt {We-n^2+1}$ (figure 4d), consistent with the aforementioned viscous criterion.
The results presented above agree quantitatively with the restricted observations of Weidman et al. (Reference Weidman, Goto and Fridberg1997) who obtained the (inviscid) growth rates for  $n=1, 2$ and
 $3$, as a function of
 $k$, for
 $We=10$. Consider figure 5(a) in Weidman et al. (Reference Weidman, Goto and Fridberg1997), where the authors present growth rates for
 $n=2$ and
 $3$. Since
 $10 > We_{cusp}$ for
 $n = 2$, the growth rates correspond to the fourth regime according to the classification above. Nevertheless, the local minimum seen in the growth rate curve for
 $n=2$ (akin to the dotted red curves in figures 4d and 5d) is reminiscent of the hysteresis that occurs at a smaller
 $We$. The growth-rate curve for
 $n=3$ presented in the same figure matches quantitatively with the dotted red curve in figure 4(b). Since
 $n(n+1) < 10 < We_{{cusp}}$ for
 $n = 3$, this growth-rate behaviour corresponding to the second regime described above. Their observations for
 $n=1$ can be similarly understood based on the discussion presented in the Appendix. Thus, while our results are consistent with the earlier findings in Weidman et al. (Reference Weidman, Goto and Fridberg1997), our focus on the entire inviscid eigenspectrum allows us to move beyond growth rates calculations for specific
 $We$ values, and thereby, infer the implications of the growth-rate behaviour on the relation between the inviscid and viscous stability criteria.
The inviscid dispersion curves corresponding to the different  $We$-regimes for
 $n=4$: (a)
 $We < n^2-1$ (
 $We=12$); (b)
 $n^2 - 1 < We < n(n+1)$ (
 $We=18$), (c)
 $n(n+1) < We < We_{cusp}$ (
 $We=22$); (d)
 $We > We_{cusp}$ (
 $We=26$); where
 $We_{{cusp}} \approx 25.5$ for
 $n=4$. The neutral Coriolis modes are shown in blue and the neutral capillary modes in orange. The real part of the unstable eigenvalues are shown as dashed green curves while the imaginary parts are shown as dashed red curves.

The general behaviour of the dispersion curves with increasing  $We$, highlighted above, holds for all
 $n$ values greater than unity. Figure 5 shows an analogous behaviour of the eigenspectrum for
 $n = 4$ with
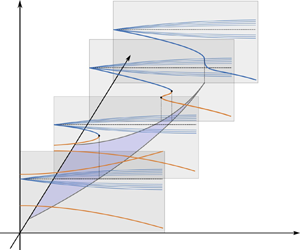
 $We_{{cusp}} \approx 25$. The dispersion curves, such as those in figures 4 and 5, may be stacked upon one another, along the
 $We$ axis, so as to demarcate the regions of inviscid stability in the
 $We$–
 $k$ plane for each
 $n$. Figure 6 shows schematically how this may be achieved (the unstable wavenumber ranges have been omitted for clarity). With varying
 $We$, projections of the pair of folding points associated with each hysteretic dispersion curve (the black dots in figures 4c, 5c and 6), that mark the intermediate stable interval in the
 $\sigma$–
 $k$ plane, yield the two branches of a stable island in the
 $We$–
 $k$ plane. The picture is that of a cusp catastrophe (Zeeman Reference Zeeman1976), implying that the aforementioned pair of branches terminates in a cusp. The points of coalescence between a capillary mode and the lowest retrograde Coriolis mode (figures 4b and 5b) yield the upper branch of the stable island, while those between the two capillary modes (figures 4c and 5c) yield the lower branch. The cusp-shaped islands of inviscid stability in the
 $We$–
 $k$ plane, for
 $n = 2, 3, 4$ and
 $5$, are shown in figure 7. While closed form expressions for the boundaries of these islands are not available, one may nevertheless obtain their small-
 $k$ approximations. For the lower branch, one has
 $\sigma \rightarrow n-1$ for
 $k \to 0$; the resulting limiting form of the dispersion relation gives the required approximation as
 $k \thicksim \sqrt {(({n^2-1})/{n(n+1)})(We-n(n+1))}$. For the upper branch, however,
 $(\sigma -n)/k$ remains
 $O(1)$ as
 $k \to 0$. Since this remains true for all of the Coriolis mode branches, the upper branch asymptote is obtained by exploiting the fact that the slope of the hysteretic dispersion curve diverges at the turning points. Thus, simultaneously solving (2.6) with
 $d\sigma /dk \to \infty$ for
 $k \rightarrow 0$ yields the small-
 $k$ approximation for the upper branch. These approximations have been shown as dashed black curves in figure 7, where they are seen to compare well with the numerically determined island boundaries well beyond the rigorous interval of validity
 $(k \ll 1)$. While one expects the
 $We$–
 $k$ plane to remain similar in form for
 $n > 5$, the scenario for
 $n = 1$ is essentially different, and is analysed in the Appendix. In this case, there exists only one stable island that extends to infinity along the
 $We$ axis. The exceptional behaviour is not entirely unexpected, given that the limit
 $k \to 0$ is a singular one –
 $n=1$ corresponds to a mere translation of the rotating column in the planar limit.
A schematic showing the loci of the pairs of folding points, associated with the hysteretic dispersion curves, which leads to the inviscidly stable island in the  $We$–
 $k$ plane.

Depiction of the stable islands in the  $We$–
 $k$ plane for (a)
 $n = 2$, (b)
 $n = 3$, (c)
 $n = 4$ and (d)
 $n = 5$. Blue curves denote both, the outer boundary (
 $We = n^2+k^2-1$) and the numerically obtained boundaries of the inviscidly stable island within; the shaded region between these boundaries denotes the inviscidly unstable region. The dashed black curves denote the small-
 $k$ asymptotes for the island boundaries; the lower branch asymptote is
 $k \thicksim \sqrt {(({n^2-1})/{n(n+1)})(We-n(n+1))}$ and that for the upper branch is obtained by simultaneously solving
 ${\rm d}\sigma /{\rm d}k = \infty$ with (2.6) for small
 $k$.

The discussion along with the preceding figures establish the following behaviour. With increasing  $We$, the upper capillary branch moves down to lower frequencies, appearing to cross the zero-Doppler-frequency line
 $\sigma = n$ in the process and, thereafter, undergoes a pair of coalescences (one with the lowest Coriolis mode, and the other with the lower capillary branch). These coalescences lead to intermediate unstable ranges of wavenumbers which, with varying
 $We$, trace out a stable island in the
 $We$–
 $k$ plane (see figure 7). There are two subtle aspects with regard to this general behaviour that need amplification, however. The first is that the upper capillary branch does not, in fact, end up crossing
 $\sigma = n$ (hence, the usage ‘appears to’ in all the instances above). Instead, as shown in figure 8, at
 $We = n^2-1$, when the zero-
 $k$ frequency of this branch equals
 $\sigma = n$ (figure 8d), the capillary branch stops moving downward as a whole; instead, a new discrete mode emanates from
 $\sigma = n$, and continues down into the retrograde frequency range with further increase in
 $We$ (figures 8e and 8f ). Further, even as the upper capillary branch descends towards
 $\sigma = n$, for
 $We$ just below
 $n^2-1$, it never crosses the lower cograde Coriolis branches. These ‘avoided crossings’ are illustrated via suitably magnified views in figure 8(a–c), and arise from the Krein signature criterion, required for unstable coalescences between different modal branches, not being satisfied for cograde modes (Mackay & Meiss Reference Mackay and Meiss1987; Fukumoto Reference Fukumoto2003; Chernyavsky, Kevrekidis & Pelinovsky Reference Chernyavsky, Kevrekidis and Pelinovsky2018).
Dispersion curves ( $\sigma$ versus
 $k$) for
 $n = 4$ and
 $We$ close to
 $n^2 - 1$: (a)
 $We = 14.25$; (b)
 $We = 14.75$; (c)
 $We = 14.95$; (d)
 $We = 15$; (e)
 $We = 15.05$; (f)
 $We = 15.1$. At
 $We = n^2 - 1$ the capillary mode splits into two and yields a new retrograde mode (also shown in orange) which subsequently undergoes an infinite sequence of coalescences with the retrograde Coriolis modes for higher
 $We$.

The second subtle aspect is related to the retrograde mode above that bifurcates from the cograde capillary mode at  $\sigma = n$. In moving further down towards
 $\sigma = n-1$ with increasing
 $We$ (at which point this mode undergoes a coalescence with the lower capillary branch, leading to an unstable wavenumber interval
 $(0, k_2)$, as illustrated in figures 4c and 5c), the mode must end up crossing an infinite number of Coriolis mode branches, in turn implying the possibility of an infinite hierarchy of coalescences, instead of just the single one with the lowermost (retrograde) Coriolis branch shown in figures 4(b) and 5(b). Note that the infinite number of crossings must occur in the neighbourhood of
 $\sigma = n$ which, from (2.3), corresponds to
 $We = n^2-1$. Therefore, one may verify the existence of such a hierarchy of crossings by checking for the occurrence of coalescences in the eigenspectra in the vicinity of
 $We = n^2 - 1$. It turns out that all of the crossings of the aforementioned retrograde mode with the retrograde Coriolis modes lead to coalescences and, thence, hysteretic dispersion curves with intermediate unstable
 $k$-intervals. The number of such hysteretic curves increases rapidly as
 $We$ approaches
 $n^2-1$ from above. Figure 9 depicts the increasing number of hysteretic dispersion curves that result for
 $n = 3$ for
 $We \rightarrow 8^+$; there is one coalescence for
 $We = 8.5$, three for
 $We=8.2$ and four for
 $We=8.1$, besides the original coalescence between the new retrograde mode and the lowest Coriolis mode, with successive coalescences occurring at progressively smaller
 $k$. Figure 10 provides a magnified view of the ensemble of dispersion curves for
 $We = 8.1$, emphasizing the rapid oscillations in the growth rate owing to the multiple closely spaced intervals of stability. Similar to figure 7, each of these hysteretic intervals marks out a stable island in the
 $We$–
 $k$ plane. Therefore, in the inviscid limit, there appears to be an infinite hierarchy of neutrally stable islands (each of these associated with a cusp catastrophe, or a fold in the three-dimensional surface characterizing the
 $We$–
 $k$–
 $\sigma$ relationship as illustrated in figure 6) enclosed within the viscously unstable region given by
 $We > n^2+k^2-1$. This infinite hierarchy of inviscidly stable islands only appears above, and not below, the viscous threshold since, as already pointed out, the cograde modes exhibit avoided collisions (figure 8a–c), while the retrograde modes coalesce, yielding complex eigenvalues, consistent with their respective Krein signatures. The higher-order stable islands are much smaller than the leading one, and decrease in size rapidly, eventually going asymptotically to the limit point
 $(We,k) = (n^2-1,0)$. The resulting picture in the
 $We$–
 $k$ plane is illustrated in figure 11 for
 $n = 2,3,4$ and
 $5$. Each of the panels shows five leading satellite islands besides the main island, of what is likely an infinite hierarchy. As implied by figure 10, a consequence of this infinite hierarchy is a rapid alternation of regions of stability and instability as one increases
 $k$ for a fixed
 $We$ and, thence, a rapidly fluctuating growth rate with changing
 $k$.
An increasing number of retrograde dispersion curves exhibit a hysteretic character for  $We \to (n^2-1)^+$; the figures show this behaviour for
 $n = 3$. (a) A single coalescence between a capillary and a Coriolis mode:
 $We = 9$. (b) The capillary-Coriolis coalescence plus a single hysteretic dispersion curve:
 $We = 8.5$. (c) The capillary-Coriolis coalescence plus three hysteretic dispersion curves:
 $We = 8.2$. (d) The capillary-Coriolis coalescence plus four hysteretic dispersion curves:
 $We = 8.1$.

A magnified view of figure 9(d):  $We = 8.1; n = 3$. Note the multiple hysteretic dispersion curves (four, besides the original) and corresponding oscillations in the growth rate.

The main and satellite islands of inviscid stability, in the  $We$–
 $k$ plane, for (a)
 $n = 2$, (b)
 $n = 3$, (c)
 $n = 4$ and (d)
 $n = 5$. Magnified views, of five of the infinite hierarchy of satellite islands, appear in the insets.

3. Conclusion
In this paper, we have analysed the inviscid stability of a rotating liquid column as a function of  $We$, and the axial and azimuthal wavenumbers (
 $k$ and
 $n$) of the imposed perturbation, with a focus on the entire eigenspectrum that includes a pair of capillary modes and an infinite hierarchy of Coriolis modes in the general case. While it is known that a viscous rotating column becomes unstable if and only if
 $We > k^2+n^2-1$, consideration of the full eigenspectrum highlights the intricate nature of the inviscidly unstable region in the
 $We$–
 $k$ plane. The intricacy arises from the likelihood of an infinite hierarchy of coalescences between pairs of dispersion curves in the neighbourhood of the planar viscous threshold
 $(We = n^2-1)$. As illustrated in figure 11, these coalescences appear to lead to an infinite hierarchy of inviscidly stable islands within the viscously unstable region
 $(We > n^2+k^2-1)$ in the
 $We$–
 $k$ plane; each of these islands corresponds to a fold in the
 $We$–
 $k$–
 $\sigma$ surface in three dimensions (see figure 6). The existence of these islands explains why
 $We < n^2 + k^2 -1$ only serves as a sufficient condition for stability in the inviscid limit (Pedley Reference Pedley1967); evidently, one can be stable even when
 $We > n^2+k^2-1$, provided one is inside any of these islands. Thus, the necessary and sufficient condition for inviscid instability would require
 $We > n^2+k^2 -1$ and, in addition, that the
 $(We,k,n)$ triplet chosen lies outside the inviscid islands identified in figure 11. It is not possible to provide a precise expression for this criterion since, as already pointed out, closed form expressions for the island boundaries are not known; although, the small-
 $k$ asymptotes appear to serve as useful approximations especially for the larger
 $n$ values (see figure 7). Interestingly, it has been shown in the appendix of Weidman et al. (Reference Weidman, Goto and Fridberg1997) that one may again obtain only a sufficient condition for inviscid stability for the analogous two-fluid system. Thus, for a configuration consisting of a central column of a denser liquid and an annular domain of a lighter one, both being in a state of rigid-body rotation, the sufficient condition for inviscid stability becomes
 \begin{equation} We_{1} - We_{2} < k^2 + n^2 -1, \end{equation}
which is the natural generalization of the single-fluid criterion encountered earlier, and where  $We_1$ and
 $We_2$ are now the Weber numbers based on the inner and outer fluid densities. Although the viscous problem and, therefore, the viscous stability criterion for the two-fluid system problem has not yet been examined, the discussion presented here suggests an analogous relationship between the viscous and inviscid criteria.
The discovery of an infinite hierarchy of inviscidly stable islands in the  $We$–
 $k$ plane also has implications for viscous stability for large but finite
 $Re$. As shown in figure 10, for the case
 $n =3$ and
 $We = 8.1$, the inviscid growth rate oscillates rapidly between zero and order-unity values, with the oscillations becoming increasingly dense and rapid for
 $We \rightarrow 8^+$ (the value of
 $n^2-1$ for
 $n = 3$); interestingly, although the growth rates decrease for
 $We \rightarrow (n^2-1)^+$, as expected, the amplitude of the oscillations, for a fixed
 $We$, does not appear to decay with increasing order of the modal coalescence, the order here referring to the modal index of the (retrograde) Coriolis mode involved in the particular coalescence. Now, for large but finite
 $Re$, one expects only a finite number of oscillations regardless of the proximity of
 $We$ to
 $n^2-1$. This is because, as mentioned in § 2.2, the viscous decay rates for planar perturbations can attain arbitrarily high values for large enough modal indices, owing to the vanishingly small radial scale associated with the eigenfunction. Thus, for finite
 $Re$, however large, one expects the (inviscid) growth rate associated with modal coalescences above a certain threshold order to be overwhelmed by viscous decay. Nevertheless, for an
 $Re$ large enough that the spacings between adjacent islands is greater than
 $O(Re^{-2})$, one expects rapid oscillations in the growth rate between order-unity values between the islands, and
 $O(Re^{-1})$ values within them. While the
 $Re$ values required to see substantial growth-rate oscillations requires a full viscous calculation, it does appear that the
 $Re$ values involved might be very large. In contrast, experiments on the rotating liquid column have only accessed a maximum
 $Re$ of
 $O(10)$, see Kubitschek & Weidman (Reference Kubitschek and Weidman2008).
The question of  $Re$ being large enough for one to be able to observe the aforementioned oscillations in the (viscous) growth rate leads us to the astrophysical analogue of the configuration examined thus far – that of a rotating self-gravitating fluid column, which may be likened to a large-scale filamentary structure; such structures appear to have a ubiquitous presence in the interstellar medium and are regarded as playing an important role in the star formation process (André Reference André2017). Chandrasekhar and Fermi performed one of the earliest studies on the stability of a self-gravitating columnar configuration (see Chandrasekhar & Fermi Reference Chandrasekhar and Fermi1953; Chandrasekhar & Lebovitz Reference Chandrasekhar and Lebovitz1964). Their calculations were done in the incompressible limit when the column has a uniform density and a finite radius, and revealed an axisymmetric instability. Analogous to the Rayleigh–Plateau instability of the liquid column, the axisymmetrically deformed fluid (gas) column has a lower gravitational potential energy than the original columnar configuration for sufficiently long-wavelength perturbations and is therefore unstable to all axisymmetric perturbations with wavelengths longer than
 $1.0668$ times the column radius (Chandrasekhar Reference Chandrasekhar1981, p. 519). Subsequently, Ostriker extended the analysis of Chandrasekhar & Fermi (Reference Chandrasekhar and Fermi1953) to a compressible columnar configuration, evaluating the base-state density profiles using a polytropic equation of state for different values of the polytropic index (Ostriker Reference Ostriker1964a). Compressibility leads to an inhomogeneous base state with a finite radial extent, the isothermal case alone being an exception. Next, Ostriker (Reference Ostriker1964b) analysed the effects of compressible perturbations on a homogeneous finite-radius cylinder (a solution of the incompressible equations). Later analyses include the stability calculations of Stodólkiewicz (Reference Stodólkiewicz1963) and Nagasawa (Reference Nagasawa1987) for the aforementioned isothermal configuration, and those have again shown axisymmetric disturbances alone to be unstable. On account of filamentary molecular clouds being good representations of spiral galactic arms, and the implications of instability for formation of dense prestellar cores, stability analyses of self-gravitation columnar configurations with or without magnetic fields continue to garner attention (McKee & Ostriker Reference McKee and Ostriker2007; Breysse, Kamionkowski & Benson Reference Breysse, Kamionkowski and Benson2014; Motiei, Hosseinirad & Abbassi Reference Motiei, Hosseinirad and Abbassi2021).
Rotation is ubiquitous in self-gravitating filaments, and Hansen, Aizenman & Ross (Reference Hansen, Aizenman and Ross1976) were one of the first to examine the equilibrium and stability of an isothermal and uniformly rotating cylinder. The inclusion of rotation, and the resulting conflicting effects of rotation and self-gravitation on density stratification, introduces an unusual feature into the equilibrium state – that of a (spatially) damped oscillatory density profile. Hansen et al. (Reference Hansen, Aizenman and Ross1976) analysed the stability of such rotating base states (of a finite radius) to two-dimensional disturbances, and found that rotation renders cylinders, exceeding a critical size, unstable to non-axisymmetric disturbances. Freundlich, Jog & Combes (Reference Freundlich, Jog and Combes2014) have recently studied a polytropic rotating cylinder within the framework of a local stability analysis. More recently, Sadhukhan, Mondal & Chakraborty (Reference Sadhukhan, Mondal and Chakraborty2016) have extended the local stability analysis to polytropic rotating cylinders, with the addition of a magnetic field, and observe that the background rotation acts to reduce the unstable growth rates. Thus, there exist instances in the literature of rotation having conflicting roles – in terms of both stabilizing and destabilizing self-gravitating masses. To comprehensively understand the role that rotation plays in the stability of filamentary molecular clouds, there is an imminent need for a global three-dimensional stability analysis of rotating polytropic columnar configurations. In this concluding section, however, we only look at the limiting case of an incompressible cylinder – the rotating version of Chandrasekhar and Fermi's seminal study referenced above. This is because our focus here is to primarily draw an analogy between the cohesive forces of surface tension and gravitation; we show below that a rotating self-gravitating incompressible fluid column exhibits an infinite hierarchy of cusp catastrophes analogous to the rotating liquid column above. Although beyond the scope of the present calculation, and despite the known singular role of compressibility (Ostriker Reference Ostriker1964b), we expect our findings to continue to be relevant for compressible self-gravitating columns.
A linear stability analysis of a self-gravitating cylinder, in a state of rigid-body rotation, readily furnishes the following dispersion relation:
 \begin{equation} \alpha \frac{{\rm J}_{n-1}(\alpha)}{{\rm J}_{n}(\alpha)} - \frac{\dfrac{\varOmega^2}{2{\rm \pi}\rho G}(4-(\sigma-n)^2)}{\dfrac{\varOmega^2}{2{\rm \pi}\rho G} - (1 - 2{\rm K}_n(k){\rm I}_n(k))} - n\left( 1+\frac{2}{(\sigma-n)} \right)=0, \end{equation}
where  ${\varOmega ^2}/{2{\rm \pi} \rho G}$ is the analogue of the Weber number for the self-gravitating case, in measuring the relative importance of gravitational and centrifugal forces,
 $G$ being the gravitational constant. Let us now define
 \begin{equation} We_G = f(n,k)\,\frac{\varOmega^2}{2{\rm \pi}\rho G}, \end{equation}
where  $f(n,k) = ({k^2+n^2-1})/({1 - 2{\rm I}_n(k){\rm K}_n(k)})$, so that we have, in terms of
 ${We_G}$, a dispersion relation identical to that in (2.6). Since
 $f(n,k)$ is a monotonically increasing function of
 $k$ for a given
 $n$, one has a unique value of
 ${\varOmega ^2}/{2{\rm \pi} \rho G}$ for every
 ${We_G}$. The
 ${\varOmega ^2}/{2{\rm \pi} \rho G}-k$ plane will then be topologically equivalent to the
 ${We_G}$–
 $k$ plane and, thence, to the
 $We$–
 $k$ plane of the rotating liquid column seen earlier. The resulting infinite hierarchy of cusp catastrophes for the rotating self-gravitating fluid column, and its comparison with the hierarchy already seen above, for the rotating liquid column (with surface tension), is shown in figure 12.
Comparison of the inviscidly stable islands for the surface-tension (blue) and self-gravitating (orange) cases for (a)  $n = 2$, (b)
 $n = 3$, (c)
 $n = 4$ and (d)
 $n = 5$. The insets in each figure show magnified views of the first five satellite islands for the self-gravitating column.

Going beyond the paradigm of Newtonian gravitation, it is worth mentioning that the efforts of Cardoso & Dias (Reference Cardoso and Dias2006) and Caldarelli et al. (Reference Caldarelli, Dias, Emparan and Klemm2009) who have pointed out intriguing similarities between dynamics of black holes and fluid droplets, are again based on the similarities between surface tension and self-gravitation. The authors demonstrate that several aspects of the Gregory–Laflamme instability of black strings can be mapped onto the Rayleigh–Plateau instability of a fluid cylinder. Based on the analogy between rotating liquid drops and rotating black holes, the authors further propose an instability of ultraspinning black holes and suggest inclusion of rotation as a possible direction for further investigation. Although a direct analogy does not hold in this case owing to, for instance, a dependence of the surface tension of a black hole on rotation, the results obtained here nevertheless point to intriguing stability characteristics that might emerge from consideration of more detailed models of rotating self-gravitating astrophysical objects.
As a final note, our findings here apply to a rotating column of a circular cross-section. If there is a departure from circularity, for instance, due to an imposed straining flow, then additional instability mechanisms come into play. Based on the known example of a strained vortex column (see Moore & Saffman Reference Moore and Saffman1975; Tsai & Widnall Reference Tsai and Widnall1976), there arises the possibility of an instability due to a parametric resonance between eigenmodes with different azimuthal wavenumbers; this, as opposed to an instability from the coalescence of two modes of a given azimuthal wavenumber, as is the case analysed here.
Funding
The majority of this work took place at JNCASR, Bangalore and the funding support from the institute is gratefully acknowledged.
Declaration of interests
The authors report no conflict of interest.
Appendix. Stability criteria for  $n = 1$

For planar perturbations with  $n = 1$, one sees from (2.3) that
 $\sigma$ vanishes identically for all non-zero
 $We$. Therefore, the inviscid threshold,
 $We = n(n+1)$, is of no relevance in this case, and there can be no analogue of the different
 $We$-regimes that exist for
 $n \geq 2$ (see figure 4a–d). As already stated in the main text, this is expected since a planar perturbation for
 $n=1$ corresponds to a mere translational displacement. Further, for
 $n \geq 2$, the pair of planar frequencies, corresponding to the two capillary branches, are widely separated, and symmetrically distributed approximately
 $\sigma = n-1$, for small
 $We$. The motion of the upper capillary branch down towards
 $\sigma = n$, with increasing
 $We$, and the subsequent birthing of a new retrograde mode at
 $\sigma = n$, is essential for the infinite hierarchy of coalescences in the
 $\sigma -k$ plane and, thence, for the infinite hierarchy of inviscidly stable islands in the
 $We$–
 $k$ plane. In contrast, for
 $n = 1$,
 $\sigma = 0$ is a double root of the governing quadratic. Thus, a second mode emanates from
 $\sigma = 0$, with increasing
 $k$, in addition to the retrograde capillary mode, and may be likened to the retrograde mode above, for
 $n \geq 2$, that undergoes coalescences with the Coriolis modes. But, for
 $n =1$, this mode is already below the infinite hierarchy of retrograde Coriolis modes even at the smallest
 $We$ (see figure 13a, below), and one may only expect a merger with the lowest member of the Coriolis hierarchy. As a result, one expects a leading stable island, but no satellite islands, in the
 $We$–
 $k$ plane.
Dispersion curves for  $n = 1$ (a–d); the solid blue curves indicate the Coriolis modes, the solid orange curves indicate the capillary modes and the dashed curves indicate real (red) and imaginary (green) parts of the unstable modes. Panel (e) depicts the stable island generated as a result of coalescence of the lowest Coriolis mode and the retrograde capillary mode. Here (a)
 $We = 1$, (b)
 $We = 2$, (c)
 $We = 5$, (d)
 $We = 10$, (e) region of stability for
 $n=1$.

In fact, the nature of the dispersion curves for  $n=1$ does not change qualitatively with increasing
 $We$. One observes a single coalescence and, thence, a single unstable interval bounded away from
 $k = 0$, for any finite
 $We$. Figure 13(a–d) confirms this behaviour for
 $We$ ranging from 1 to 10. As
 $We=10$ is significantly greater than the hypothetical threshold (
 $n(n+1) = 2$), we do not expect this picture to alter for greater
 $We$ values and the resulting stable island in the
 $We$–
 $k$ plane would thus extend to infinity (figure 13e). This, once again, points to the absence of distinct
 $We$ regimes observed for
 $n \geq 2$. The growth rate and range of unstable wavenumbers shown in figure 13(d) are consistent with figure 4 of Weidman et al. (Reference Weidman, Goto and Fridberg1997). Finally, from the growth rate perspective, the
 $n=1$ mode remains subdominant for all
 $Re$ greater than
 $1.166$ (approximately). As shown by Kubitschek & Weidman (Reference Kubitschek and Weidman2007a) the azimuthal wavenumber of the dominant perturbation jumps from
 $n=0$ to
 $n=2$ beyond
 $Re \approx 1.166$, and then to higher
 $n$ values with increasing
 $We$. Thus, the anomalous behaviour of
 $n=1$ is less important in the limit of large
 $Re$ as, for instance, in the astrophysical context above.



