1. Introduction
Taming turbulence in the flow represents significant economic and environmental benefit in most industrial applications (Brunton & Noack Reference Brunton and Noack2015). Turbulence control plays a significant role in drag reduction (for example, see Choi, Moin & Kim Reference Choi, Moin and Kim1994; Lee et al. Reference Lee, Kim, Babcock and Goodman1997; Chamorro, Arndt & Sotiropoulos Reference Chamorro, Arndt and Sotiropoulos2013). For the example of transport vehicles, aerodynamic drag accounts for approximately 15 % of the round-trip fuel consumption for a coal train (Stodolsky & Gaines Reference Stodolsky and Gaines2003), and for cars overcoming aerodynamic drag, it takes up most of the power consumption at highway speeds (Sudin et al. Reference Sudin, Abdullah, Shamsuddin, Ramli and Tahir2014). A drag reduction of around 25 % in a three-dimensional bluff body reported by Pfeiffer & King (Reference Pfeiffer and King2012) indicates turbulence control as a remarkable energy saving strategy that is potentially applicable to all relative industries.
To tackle the turbulence control problems, myriads of control strategies have been proposed (Joslin & Miller Reference Joslin and Miller2009), and these strategies can be classified principally into passive and active categories. For passive control, small modifications of the flow configuration are implemented to improve the surrounding flow, such as the installation of vortex generators to reduce drag on a car (Mukut & Abedin Reference Mukut and Abedin2019), and the application of a chevrons nozzle to enhance the jet mixing (Zaman, Bridges & Huff Reference Zaman, Bridges and Huff2011). Active control requires energy input to the flow domain from the actuators. Different types of active actuators, such as synthetic jets (Amitay et al. Reference Amitay, Smith, Kibens, Parekh and Glezer2001), plasma actuators (Wang et al. Reference Wang, Choi, Feng, Jukes and Whalley2013) and moving surfaces (Modi Reference Modi1997), have been applied widely in the flow control experiments, with significant improvement of flow performance (Cattafesta & Sheplak Reference Cattafesta and Sheplak2011). For either control strategy, the control devices can be described in a parametrized manner, such as the shape parameters of the vortex generator or the duty cycles of the plasma actuators. These parametrized flow control devices will alter the dominant turbulent structures in the original flow, and generate distinct flow patterns according to the selection of the control parameters.
In the typical flow control set-up, pointwise sensors, such as hotwire probes, pressure transducers and shear stress sensors, are placed sparsely in the flow or on the boundary. The deployment of these sensors makes it possible to recover the flow state from sparsely sampled sensor signals that comprise partial information of the flow state. The full state estimation from sparse sensors is of great importance in terms of flow control (Taylor & Glauser Reference Taylor and Glauser2004). The accurate estimation of the full or partial flow state has the potential to notably improve the control outcome via a carefully designed controller, leading to remarkable drag reduction, mixing enhancement, noise attenuation, etc. (Brunton & Noack Reference Brunton and Noack2015). The machine learning architecture that couples a recurrent neural network and model predictive control in Bieker et al. (Reference Bieker, Peitz, Brunton, Kutz and Dellnitz2020) is also proven to predict accurately and control the flow state from limited sensor data. For oscillatory dynamics, flow state estimation techniques based on reduced-order models (ROMs) have also been applied widely in the active flow control plants (see, for example, Tadmor et al. Reference Tadmor, Noack, Morzynski and Siegel2004; Barbagallo, Sipp & Schmid Reference Barbagallo, Sipp and Schmid2009). However, a sensor-based dynamic observer loses its accuracy with increasing state-space dimension even for a simple unforced oscillatory wake transient (Gerhard et al. Reference Gerhard, Pastoor, King, Noack, Dillmann, Morzyński and Tadmor2003). Every extra degree of freedom may act as potential noise amplifier. A dynamic ROM, let alone estimation, is also a challenge for wall-bounded actuators with corresponding actuation commands as free input, as exemplified by Weller, Lombardi & Iollo (Reference Weller, Lombardi and Iollo2009) for oscillatory dynamics. These challenges are even more pronounced for sensor-based estimation using ROMs for complex dynamics with multiple independent actuators.
As the most commonly used technique, linear stochastic estimation (LSE; Adrian Reference Adrian1994), as well as its variants (Tinney et al. Reference Tinney, Coiffet, Delville, Hall, Jordan and Glauser2006; Lasagna, Orazi & Iuso Reference Lasagna, Orazi and Iuso2013), establishes a linear model between sensor inputs and the flow state output (Clark, Naghib-Lahouti & Lavoie Reference Clark, Naghib-Lahouti and Lavoie2014). This method has been applied widely to either distil flow structures (Bonnet et al. Reference Bonnet, Cole, Delville, Glauser and Ukeiley1994) or construct models for accurate flow estimation (Stalnov et al. Reference Stalnov, Palei, Fono, Cohen and Seifert2007). The well-trained linear model can serve as a state estimation function in feedback flow control experiments (for example, see Samimy et al. Reference Samimy, Debiasi, Caraballo, Serrani, Yuan, Little and Myatt2007). Quadratic stochastic estimation (QSE) includes a nonlinear second-order term. These terms have been shown to be important for some wake estimation problems (Bourgeois, Martinuzzi & Noack Reference Bourgeois, Martinuzzi and Noack2013). Yet QSE calibration is computationally expensive (Murray & Ukeiley Reference Murray and Ukeiley2002). Challenges of QSE have already been reported in Tung & Adrian (Reference Tung and Adrian1980). In contrast, neural network regression has become a mature methodology.
The fast development of machine learning methods (Brunton, Noack & Koumoutsakos Reference Brunton, Noack and Koumoutsakos2020) makes it possible to estimate the flow state via a spectrum of nonlinear approaches. A state estimation method based on the Autoencoder and the recurrent neural network is proposed by Kumar, Bahl & Chakraborty (Reference Kumar, Bahl and Chakraborty2022) in which the flow field can be predicted accurately from few sensors. The comparison of neural network, LSE and gappy proper orthogonal decomposition (POD) is reported by Nair & Goza (Reference Nair and Goza2020) for the prediction of the laminar wake behind a fat plate from sparse sensor measurements. A series of convolutional neural network (CNN) based estimation architectures are proposed and evaluated by Güemes, Discetti & Ianiro (Reference Güemes, Discetti and Ianiro2019), Güemes et al. (Reference Güemes, Discetti, Ianiro, Sirmacek, Azizpour and Vinuesa2021) and Guastoni et al. (Reference Guastoni, Güemes, Ianiro, Discetti, Schlatter, Azizpour and Vinuesa2021) to estimate the turbulent flow from wall measurements, and the results yield promising accuracy. The accurate estimation of the flow state from time-resolved sensor measurements and non-time-resolved velocity snapshots using long short-term memory (LSTM) is reported in Deng et al. (Reference Deng, Chen, Liu and Kim2019). Nevertheless, neither of these recent advancements in machine learning is designed naturally for multiple-input, multiple-output (MIMO) flow control. In the case of model-based feedback flow control, it is necessary to establish an estimation method that can accurately infer the flow state from sparse measurements under adjustable control commands.
For the present study, we propose the first machine learning, sensor-based flow estimation that is capable of inferring the flow state from sparse measurements for MIMO plants. The  $k$ nearest neighbours (
 $k$NN) regression and deep neural network (DNN) serve as two nonlinear approaches, which represent a data-centric and a global nonlinear approach, respectively. In addition, LSE is employed as a linear reference point to highlight the significance of nonlinearity in the estimation problem. These methods are examined in the fluidic pinball plant, a cluster of three equal parallel cylinders centred on an equilateral triangle pointing upstream in a uniform flow (Bansal & Yarusevych Reference Bansal and Yarusevych2017; Chen et al. Reference Chen, Ji, Alam, Williams and Xu2020). This configuration is becoming an increasingly popular benchmark for MIMO flow control. The flow may be monitored using the forces on the cylinders or the velocity signals at selected locations. Actuation is performed with the rotation speed of each cylinder as control input. These actuations give rise to rich dynamics in the flow, and consequently it becomes challenging to obtain accurate flow estimation under a wide range of steady control commands. Meanwhile, a large spectrum of control algorithms have been applied to this plant (Peitz, Otto & Rowley Reference Peitz, Otto and Rowley2020; Raibaudo et al. Reference Raibaudo, Zhong, Noack and Martinuzzi2020; Blanchard et al. Reference Blanchard, Maceda, Fan, Li, Zhou, Noack and Sapsis2021; Cornejo Maceda et al. Reference Cornejo Maceda, Li, Lusseyran, Morzyński and Noack2021; Ghraieb et al. Reference Ghraieb, Viquerat, Larcher, Meliga and Hachem2021; Raibaudo & Martinuzzi Reference Raibaudo and Martinuzzi2021; Castellanos et al. Reference Castellanos, Maceda, de la Fuente, Noack, Ianiro and Discetti2022; Li et al. Reference Li, Cui, Jia, Li, Yang, Morzyński and Noack2022). The fluidic pinball wake has been investigated in detail by Noack et al. (Reference Noack, Stankiewicz, Morzyński and Schmid2016), Ishar et al. (Reference Ishar, Kaiser, Morzyński, Fernex, Semaan, Albers, Meysonnat, Schröder and Noack2019), Deng et al. (Reference Deng, Noack, Morzyński and Pastur2020, Reference Deng, Noack, Morzyński and Pastur2021a,Reference Deng, Pastur, Tuckerman and Noackb, Reference Deng, Noack, Morzyński and Pastur2022), Cortina-Fernández et al. (Reference Cortina-Fernández, Vila, Ianiro and Discetti2021), Chen, Raiola & Discetti (Reference Chen, Raiola and Discetti2022) and Menier et al. (Reference Menier, Bucci, Yagoubi, Mathelin and Schoenauer2022), among many others.
This paper is organized as follows. The problem set-up of the control-oriented flow estimation problem and the estimation procedure are detailed in § 2.1, followed by the introduction of data compression (POD, § 2.2)  $k$NN (§ 2.3), DNN (§ 2.4) and LSE (§ 2.5). Section 3 introduces the fluidic pinball plant as well as the numerical database that will be used in this study. The comparison of three estimation methods exemplified for the fluidic pinball plant is presented in § 4. Sections 4.2–4.4 show the estimation results for three representative cases that correspond to the specific flow control strategies. The overall performance of each estimation method is concluded in § 4.5, followed by the conclusions and outlook in § 5.
2. Nonlinear, control-oriented flow estimation
In this section, we introduce control-oriented, sensor-based flow estimation that is capable of evaluating the flow state under various steady control commands. The set-up of the estimation problem, as well as the general estimation procedure, is described in § 2.1, and the data pre-processing technique is introduced briefly in § 2.2. To tackle the estimation problem, we propose a spectrum of data-driven estimators in this work. Two machine-learning-based approaches, i.e.  $k$ nearest neighbours (
 $k$NN) regression and deep neural network (DNN), will be introduced in §§ 2.3 and 2.4, respectively. In addition, the traditional linear stochastic estimation (LSE) method, which serves as a reference point in the present work, will be explained in § 2.5.
2.1. Problem set-up and estimation procedure
For stationary flow under a range of steady control commands, our objective is to estimate the instantaneous two-dimensional velocity field  $\boldsymbol{u}_{\boldsymbol{b}}(\boldsymbol{x})$ from the known information, which includes the instantaneous sensor signal
 $\boldsymbol{s}$ and the control command
 $\boldsymbol{b}$. Here, the velocity vector is defined as
 $\boldsymbol{u}_{\boldsymbol{b}}=(u,v)$, and the spatial domain
 $\boldsymbol{x}=(x,y)$ is bounded in
 $\mathbb {R}^2$. The control command
 $\boldsymbol{b}=[b_1,\ldots,b_M]^\text {T}$ is composed of all parametrized actuation instructions from a total of
 $M$ actuators in the flow. Each actuation instruction is bounded in
 $\mathbb {R}$ such that the control command
 $\boldsymbol{b}$ is located in a finite high-dimensional space
 $\mathcal {D} \in \mathbb {R}^M$. For the fluidic pinball plant that will be examined in this study,
 $\boldsymbol{b}$ represents the rotation speeds of cylinders that are placed in the flow. For other relevant flow control applications,
 $\boldsymbol{b}$ may also represent duty cycles of the mini-jet/plasma actuators, shape parameters of the passive control devices, etc. A local sensor signal
 $\boldsymbol{s}=[s_1,\ldots,s_L]^\text {T}$ contains partial information about the flow field. The sensors are placed at sparse locations
 $\{\boldsymbol{x}_{\boldsymbol{s}}^{(i)}\}^{L}_{i=1}$, and the measurement is equivalent to a masking function
 $\mathcal {G}$ that preserves the flow state at sensor locations. The challenge of this study is to establish a mapping function
 $\mathcal {F}$ from local sensor signal
 $\boldsymbol{s}$ and the actuation command
 $\boldsymbol{b}$ to the estimation of the corresponding flow state
 $\hat {\boldsymbol{u}}_{\boldsymbol{b}}(\boldsymbol{x})$ under control.
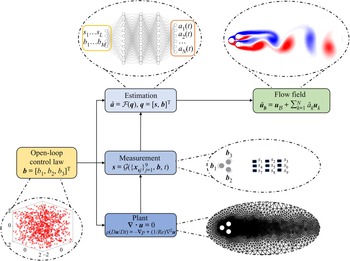
To achieve this goal, we propose a data-driven procedure to estimate the flow state under different control laws. Figure 1 outlines the estimation procedure exemplified for the fluidic pinball, which is a benchmark problem that will be examined in this study. This plant contains multiple control commands ( $b_1$ to
 $b_3$) and multiple sensor measurements (
 $s_1$ to
 $s_9$); details will be introduced in § 3. For most sensor-based flow state estimation methods, only sensor signals are utilized as the input. However, to include the influence of different control commands to the flow state, in this study we employ a combined input vector
 $\boldsymbol{q}$ that comprises the sensor signal
 $\boldsymbol{s}$ and the control command
 $\boldsymbol{b}$, such that
 \begin{equation} \boldsymbol{q}=[\boldsymbol{s},\boldsymbol{b}]^{\text{T}}\in\mathbb{R}^{L+M}. \end{equation}
The effectiveness of this algorithmically easy extension of the estimator input in the parameter direction has been proved in Hasegawa et al. (Reference Hasegawa, Fukami, Murata and Fukagata2020). In this pioneering work, a CNN-LSTM-based reduced-order model is established for flow at different Reynolds numbers. Here, we extend this approach and include high-dimensional actuation parameters to the input vector. For the purpose of establishing a data-driven mapping from the combined input  $\boldsymbol{q}$ to the flow state
 ${\boldsymbol{u}}_{\boldsymbol{b}}$, we first construct a database that contains massive input–output pairs under a set of
 $N_b$ randomly generated control commands. These control commands are denoted as
 $\mathcal {B}=\{\boldsymbol{b}_j\}_{j=1}^{N_b}$. For numerical plants, the flow snapshots are calculated from the numerical solver, and the sensor signals
 $\boldsymbol{s}$ are obtained by masking the flow field according to the sensor locations. For experimental applications, the data can be acquired from synchronous measurements between particle image velocimetry and hotwire probes/pressure sensors (for example, see Tu et al. Reference Tu, Griffin, Hart, Rowley, Cattafesta and Ukeiley2013).
A flow chart of control-oriented full-state estimation exemplified for the fluidic pinball plant and the DNN estimator.

Based on the well-established database described above, data-driven estimation can be performed to optimize and generalize the mapping function. Nevertheless, given the high-dimensional nature of the flow state space, it is computationally expensive to estimate the velocity vector at every point inside the flow domain. Hence a reduced-order representation of the flow field is required prior to the application of any estimation algorithm. Different types of dimensionality reduction techniques have been proposed and are proven to be successful, including but not limited to deep Autoencoder (Fukami, Nakamura & Fukagata Reference Fukami, Nakamura and Fukagata2020), the POD (Lumley Reference Lumley1967) and wavelet transform (Bruce, Koger & Li Reference Bruce, Koger and Li2002). In this work, a POD-based approach is employed to reduce the complexity of the flow snapshots. The application of POD does not involve any pre-training, which is typically computationally expensive, and the resulting POD eigenfunctions are human-interpretable. In this work, the database that includes all flow snapshots is pre-processed with a nearly lossless POD that compresses the high-dimensional data onto an energy-optimum, low-dimensional subspace (see § 2.2). Consequently, the estimation of instantaneous flow snapshots is equivalent to the estimation of the first  $N$ POD modal coefficients
 $\boldsymbol{a}$, which take up the majority of fluctuating energy in the flow.
The generation of the database containing flow snapshots under various control laws, and the application of the dimensionality reduction technique, enable us to estimate the flow state via a spectrum of estimators that are capable of learning the mapping function  $\mathcal {F}: \boldsymbol{q}\rightarrow \boldsymbol{a}$ from a total of
 $N_s$ input–output observation pairs
 $\mathcal {M} : \{(\boldsymbol{q}^{(j)},\boldsymbol{a}^{(j)})\}_{j=1}^{N_s}$ recorded under different control commands in the set
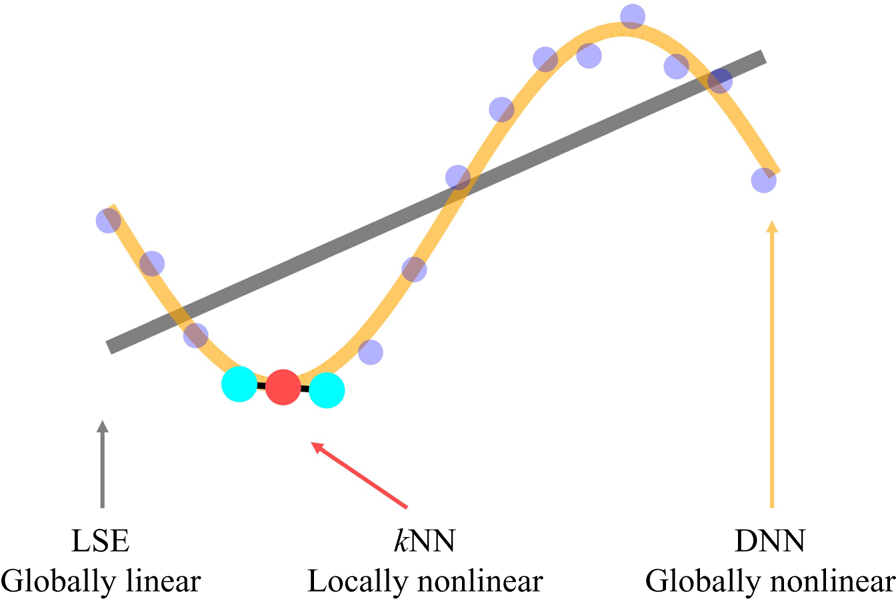
 $\mathcal {B}$. In this work, three representative estimators are proposed, and a graphical illustration of these data-driven methods can be found in figure 2. The
 $k$NN regression acts as a locally nonlinear approach; this method learns the mapping from its neighbourhood observations via a non-parametric, distance-based interpolating process. The DNN establishes a globally nonlinear model and optimizes the internal parameters of the model through an iterative optimization routine. For LSE, a linear relationship between inputs and outputs is first assumed, then a least-squares fit is performed to minimize the estimation error. These estimation methods, as well as the POD-based data compression technique, will be introduced in the following subsections.
A graphical illustration of the three estimation methods. Scattered points represents true data. LSE (grey) fits the data in a linear manner.  $k$NN (red) estimates from the neighbourhood observations (light blue). DNN (yellow) optimizes the input–output relationship by a globally nonlinear function.

2.2. Data pre-processing: the proper orthogonal decomposition
In this study, the snapshot POD (Sirovich Reference Sirovich1987) is employed as a data pre-processing technique, which reduces the computational cost of the estimation by compressing the high-dimensional flow snapshots onto a low-dimensional orthonormal subspace where energy is optimized. As we do not include the time coordinate for the control-oriented flow estimation in this study, Koopman-style decomposition techniques (Chen, Tu & Rowley Reference Chen, Tu and Rowley2012) are not available for the data pre-processing. Given a set of flow snapshots under various control commands in  $\mathcal {B}$, a velocity decomposition is first performed that splits the velocity vectors
 $\boldsymbol{u}_{\boldsymbol{b}}$ into the mean and fluctuating components:
 \begin{equation} \boldsymbol{u}_{\boldsymbol{b}}(\boldsymbol{x},t) = {\boldsymbol{u}}_{\mathcal{B}} (\boldsymbol{x}) + \boldsymbol{u}'_{\boldsymbol{b}}(\boldsymbol{x},t). \end{equation}
Here,  ${\boldsymbol{u}}_{\mathcal {B}}$ represents the mean velocity component, and
 $\boldsymbol{u}'_{\boldsymbol{b}}$ is the fluctuating counterpart. In this work, the mean velocity
 ${\boldsymbol{u}}_{\mathcal {B}}$ is defined as the ensemble average over time
 $t$ and all control laws in the set
 $\mathcal {B}$:
 \begin{equation} {\boldsymbol{u}}_{\mathcal{B}}(\boldsymbol{x}) = \langle \boldsymbol{u}_{\boldsymbol{b}}(\boldsymbol{x},t) \rangle_{\boldsymbol{b},t}, \end{equation}
where  $\langle {\cdot }\rangle _{\boldsymbol{b},t}$ represents the ensemble average over both control commands and time instances. For the fluctuating velocity
 $\boldsymbol{u}'_{\boldsymbol{b}}$, we apply the snapshot POD and expand the velocity field based on a series of orthonormal POD eigenfunctions. As the first
 $N$ POD modes usually capture most of the energy and large-scaled coherent structures in the flow, an expansion of the fluctuating velocity can be formulated as
 \begin{equation} \boldsymbol{u}'_{\boldsymbol{b}}(\boldsymbol{x},t)=\sum_{k=1}^{N} a_k(\boldsymbol{b},t)\,\boldsymbol{u}_{k}(\boldsymbol{x}). \end{equation}
Here,  $\boldsymbol{u}_{k}$ represents the orthonormal eigenfunction of the
 $k$th POD mode, and
 $a_k$ the corresponding modal coefficient which contains the energy trace. Since the eigenfunctions
 $\boldsymbol{u}_{k}$ are invariant with time and control command, the velocity expansion in (2.4) simplifies the full-state estimation problem to the estimation of the POD modal coefficients
 $\boldsymbol{a}=[a_1,\ldots,a_N]^{\text {T}}$. As a result, a significant reduction of the computational cost can be achieved. After the estimates of the POD coefficients are obtained, the flow field can be reconstructed according to (2.2) and (2.4).
2.3.  $k$ nearest neighbours regression

To establish a mapping function  $\mathcal {F}:\boldsymbol{q}\rightarrow \boldsymbol{a}$ for the purpose of flow estimation, we first introduce the
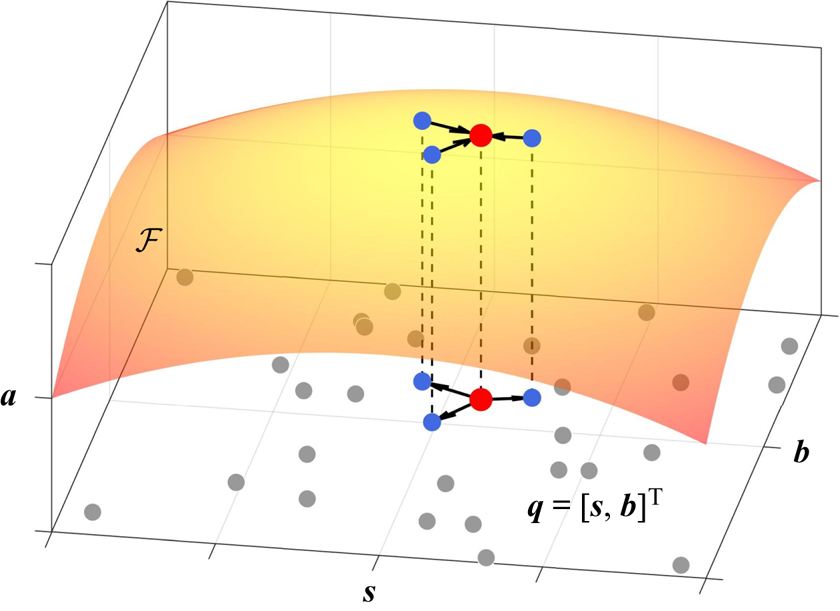
 $k$NN (Stone Reference Stone1977) regression algorithm. This method is a locally nonlinear estimation approach, and a schematic diagram of
 $k$NN is presented in figure 3.
 $k$NN adopts a non-parametric approach where the mapping function
 $\mathcal {F}$ is approximated locally by averaging a subset of
 $K$ observations in which the input data reside in the same neighbourhood of the observations. In this study, a weighted average over the first
 $K$ nearest neighbours is carried out based on the distance between the estimation input and the neighbourhood observations, such that the output can be approximated by the equation
 \begin{equation} {\hat{\boldsymbol{a}}}(\boldsymbol{q}) = \frac{\sum_{i=1}^K \boldsymbol{a}(\boldsymbol{q}^{(i)})\,1/d(\boldsymbol{q},\boldsymbol{q}^{(i)})}{\sum_{i=1}^K 1/d(\boldsymbol{q},\boldsymbol{q}^{(i)})}. \end{equation}
In this equation,  $d(\boldsymbol{\alpha}_{1},\boldsymbol{\alpha}_{2})$ represents the distance between vectors
 $\boldsymbol{\alpha}_{1}$ and
 $\boldsymbol{\alpha}_{2}$, and the Euclidean distance
 $\lVert \boldsymbol{\alpha}_{2}-\boldsymbol{\alpha}_{1} \rVert _2$ is adopted throughout this study. Here,
 $\boldsymbol{a}(\boldsymbol{q}^{(i)})$ denotes the output in the observation set that corresponds to the combined input
 $\boldsymbol{q}^{(i)}$. The superscript
 $^{(i)}$ represents the
 $i$th nearest neighbour in the observation set based on the measurement of distance in the input space, and the parameter
 $K$ stands for the number of neighbourhood observations that are utilized during the averaging process. In general, the value of
 $K$ in (2.5) needs to be determined empirically. A small
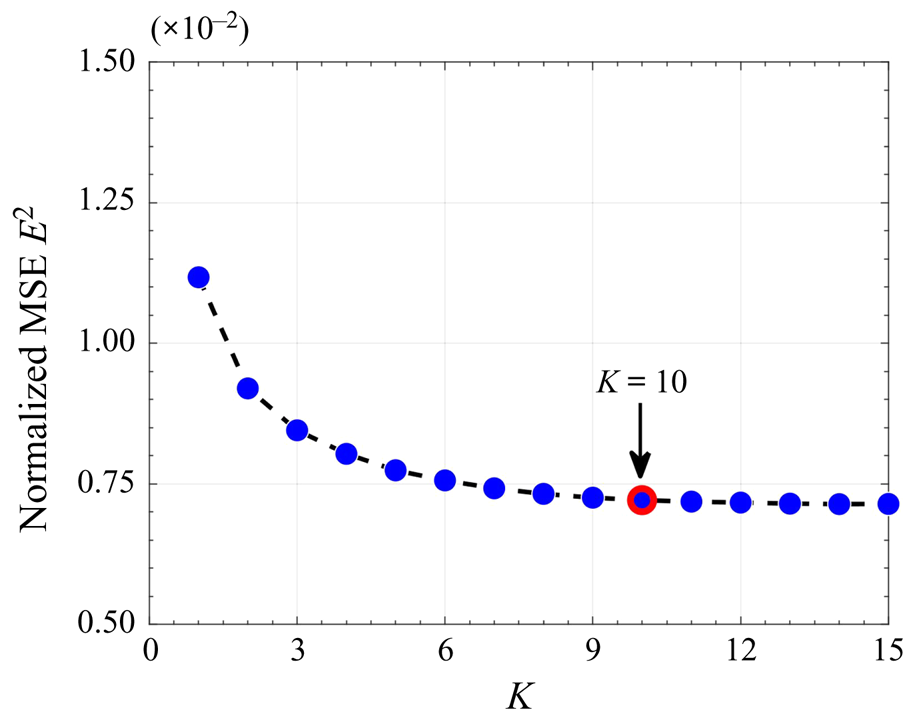
 $K$ means that the result can be influenced greatly by the outlying observation and random noise, while a large value is usually computationally expensive. Therefore, a convergence study is carried out to determine the optimal value of
 $K$ used in this study. Figure 4 shows the normalized mean-squared estimation error (i.e.
 $E^2$ in (3.5)) of
 $k$NN under different
 $K$ values for the fluidic pinball plant, from which
 $K=10$ is selected in an effort to balance the accuracy and the computational efficiency.
A schematic of  $k$NN for the control-oriented flow estimation.

Mean-squared error (MSE) of  $k$NN under different neighbourhood numbers
 $K$ in (2.5).

2.4. Deep neural network
As the second approach, we employ DNN to approximate the mapping function  $\mathcal {F}$ in a globally nonlinear manner. In general, DNN is composed of several layers of artificial neurons that are connected to one another. For each layer, a linear transformation of the input data
 $\boldsymbol{y}_{{in}}$ is first performed with tunable weights
 $\boldsymbol{\mathsf{W}}$ and biases
 $\boldsymbol{c}$, then a nonlinear activation function
 $\sigma$ is exerted, such that
 \begin{equation} \boldsymbol{y}_{{out}} = \sigma(\boldsymbol{\mathsf{W}}^{\rm T}\boldsymbol{y}_{{in}} + \boldsymbol{c}). \end{equation}
Here,  $\boldsymbol{y}_{{in}}\in \mathbb {R}^{n_{{in}}}$,
 $\boldsymbol{y}_{{out}}\in \mathbb {R}^{n_{{out}}}$,
 $\boldsymbol{\mathsf{W}}\in \mathbb {R}^{n_{{in}} \times n_{{out}}}$ and
 $\boldsymbol{c}\in \mathbb {R}^{n_{{out}}}$. By stacking multiple layers of artificial neurons sequentially and assigning the output from one layer as the input to the next layer, DNN has the potential to accurately approximate complex nonlinear functions by learning weights and biases from data (Hornik, Stinchcombe & White Reference Hornik, Stinchcombe and White1989).
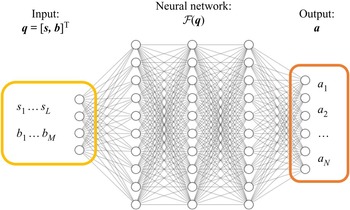
A schematic of the DNN architecture used for control-oriented flow estimation can be found in figure 5. Here, the sensor signal components  $s_1$ to
 $s_L$, as well as the control command parameters
 $b_1$ to
 $b_M$, are concatenated and form the input of the neural network. The output of the neural network contains the truncated POD modal coefficients
 $a_1$ to
 $a_N$. Both the combined input vector
 $\boldsymbol {q}$ and output vector
 $\boldsymbol {a}$ are re-scaled into the range
 $[0,1]$ to facilitate convergence. Note that in
 $k$NN and LSE, the input vector is non-dimensionalized to an amplitude of
 ${O}(1)$ by the freestream velocity
 $U_{\infty }$, which is in accord with the recommendation in Burkov (Reference Burkov2019).
A schematic of a DNN for control-oriented flow estimation.

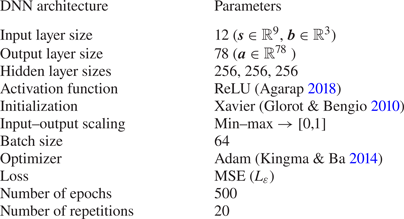
A brief summary of the DNN architecture applied in this study can be found in table 1. The architecture of the neural network is determined empirically by balancing the estimation accuracy and the computational cost. Based on the dimension of the combined input vector and the POD modal truncation (see § 4.1), the sizes of the input and the output layers are 12 and 78, respectively. Three 256-node hidden layers are fully connected in between, for each neuron for which the rectified linear activation function (ReLU; Agarap Reference Agarap2018) is specified as the activation function.
The set-up of the DNN applied for the fluidic pinball plant.

To minimize the loss function that indicates the performance of the neural network, all tunable weights and biases are optimized with gradient-based back-propagation via an iterative training approach (LeCun, Bengio & Hinton Reference LeCun, Bengio and Hinton2015). In this study, the Adam optimization method (Kingma & Ba Reference Kingma and Ba2014) is adopted, and the corresponding loss function is defined as  $L_{\varepsilon }=\langle \lVert \boldsymbol{a}-{\hat {\boldsymbol{a}}}\rVert _2^2 \rangle$, which represents the mean squared error between the desired output
 $\boldsymbol{a}$ and the actual output
 $\hat {\boldsymbol{a}}$ over the training samples. To accelerate the training phase and avoid the convergence to local minimum, the iterative back-propagation is achieved based on the evaluation of mini-batches that are partitioned randomly from the training data. In the present work, the batch size is set to 64, and a total number of 500 epochs were carried out to train the model. Other key settings related to the fluidic pinball dataset applied in this work, including the dataset partition and the iterative training process, will be detailed in § 3.4.
Before the iterative training, all weights are initialized randomly following the suggestion in Glorot & Bengio (Reference Glorot and Bengio2010). In this method, the randomly generated initial weights yield Gaussian distributions, and the initial biases are set to zero. To examine the influence of randomness from the network initialization to the estimation outcome, we trained the network 20 times, and for each time the initial weights are randomly generated. We calculate the averaged outputs and their variances based on the test set, and present these results in § 4.
2.5. Linear stochastic estimation
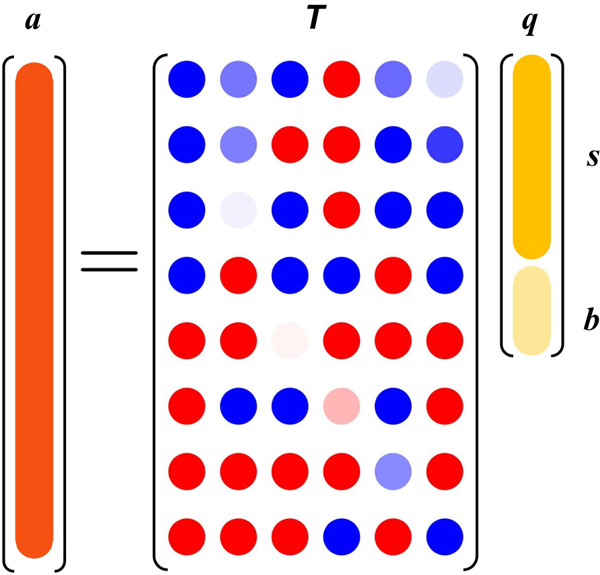
Besides the nonlinear, machine-learning-based methods, we apply LSE (Adrian Reference Adrian1994) as a reference point in this study. LSE represents the most general linear fit between fluctuating sensor signals and POD modal coefficients. The solution of LSE is equivalent to the least-squared estimation error for the estimation of POD modal coefficients. As presented in figure 6, this method analytically optimizes a linear input–output model, such that
 \begin{equation} {a}_i(\boldsymbol{b},t)=\sum_{j=1}^N \boldsymbol{\mathsf{T}}_{ij}\,q_j(t). \end{equation}
Multiplying by  $q_k$ on both sides of (2.7) and taking the ensemble average over
 $\boldsymbol{b}$ and
 $t$, we get
 \begin{equation} \sum_{j=1}^N \boldsymbol{\mathsf{T}}_{ij} \langle q_jq_k\rangle_{\boldsymbol{b},t} = \langle a_i q_k \rangle_{\boldsymbol{b},t}. \end{equation}
Here,  $\langle q_jq_k\rangle _{\boldsymbol{b},t}$ denotes the cross-correlation between inputs, and
 $\langle a_i q_k \rangle _{\boldsymbol{b},t}$ represents the autocorrelation between inputs and outputs. Both matrices can be computed directly from data, and a least-squares solution of
 $\boldsymbol{\mathsf{T}}_{ij}$ can be obtained by solving (2.8).
A schematic of the LSE algorithm for the control-oriented flow estimation. The yellow column and light yellow column represent the sensor signal  $\boldsymbol {s}$ and control command
 $\boldsymbol {b}$, respectively. The orange column represents the estimation of the POD modal coefficients
 $\boldsymbol {a}$. Dots in the transfer matrix correspond to the weights of
 $\boldsymbol{\mathsf{T}}$, which is visualized under a blue (negative)–white (0)–red (positive) colour scheme.

So far, we have described the control-oriented, sensor-based flow estimation problem, as well as a spectrum of machine learning flow estimation methods that are capable to tackle this problem. In the next section, we will present the numerical plant, i.e. the fluidic pinball, that will be utilized in this study to evaluate the performance of these estimation methods.
3. Numerical plant: the fluidic pinball
In this section, we introduce the fluidic pinball as a benchmark plant to evaluate control-oriented flow estimation methods described in § 2. An overview of the fluidic pinball is provided in § 3.1, followed by the description of the flow configuration and the numerical solver in § 3.2. The establishment of the fluidic pinball database that will be used in this study is detailed in § 3.3, including control commands generation and data sampling, as well as sensor placement. The partition of the database for the purpose of establishing data-driven mappings, as well as the criteria to evaluate the estimation performance, will be concluded in § 3.4.
3.1. An overview of the fluidic pinball plant
The fluidic pinball plant is a classical control problem that contains rich dynamical behaviours thanks to different flow control inputs (Ishar et al. Reference Ishar, Kaiser, Morzyński, Fernex, Semaan, Albers, Meysonnat, Schröder and Noack2019). This plant is composed of a two-dimensional, uniform flow passing a set of three cylinders of the same diameter  $D$. The centres of the three cylinders form an equilateral triangle pointing in the upstream direction, and the side length of the triangle is
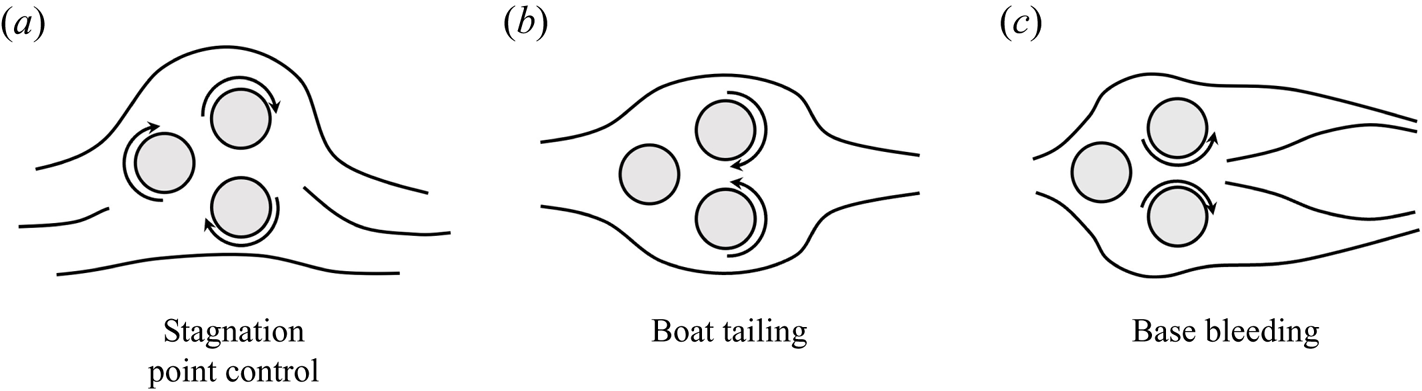
 $1.5D$. The unforced flow exhibits six different Navier–Stokes solutions, including two stable statistically asymmetric periodic vortex sheddings (Deng et al. Reference Deng, Noack, Morzyński and Pastur2020, Reference Deng, Noack, Morzyński and Pastur2021a). The independent rotation of three cylinders allows the control of the wake formed downstream, and is capable of replicating most known control mechanisms, namely, phasor control, stagnation point control, boat tailing and base bleeding, as well as high- and low-frequency forcing (Ishar et al. Reference Ishar, Kaiser, Morzyński, Fernex, Semaan, Albers, Meysonnat, Schröder and Noack2019; Cornejo Maceda et al. Reference Cornejo Maceda, Li, Lusseyran, Morzyński and Noack2021). In this study, only steady, open-loop control commands are considered. Apart from the uncontrolled case with periodic vortex shedding, steady rotations of cylinders enables the realization of stagnation point control, boat tailing and base bleeding. The schematics of these control mechanisms can be found in figure 7. With the stagnation point control, a unified rotation is exerted on the three cylinders, from which the incoming flow is deflected following the cylinder rotation direction thus attenuated periodic vortex shedding (Seifert Reference Seifert2012). Both boat tailing and base bleeding mechanisms starts from the counter-rotation of the two rearward cylinders. With boat tailing, the top cylinder rotates clockwise and the bottom rotates counter-clockwise. This will guide the boundary layer flowing towards the centre region downstream of the cylinders, which delays the flow separation and leads to significant drag reduction (Geropp & Odenthal Reference Geropp and Odenthal2000; Evrard et al. Reference Evrard, Cadot, Herbert, Ricot, Vigneron and Délery2016). When the top cylinder rotates counter-clockwise and the bottom rotates clockwise, the base bleeding mechanism takes place, which generates a fluid jet on the centreline. The jet actuation will limit the interaction between upper and lower shear layers, hence impairing the development of large-scale vortices downstream. The ability of the base bleeding mechanism to reduce bluff-body aerodynamic drag has been reported in Wood (Reference Wood1964), Bearman (Reference Bearman1967) and Howell, Sheppard & Blakemore (Reference Howell, Sheppard and Blakemore2003), among many others. With the deployment of sparse sensors in the flow, the fluidic pinball forms an MIMO system. Here, we focus on the application of sensor signal, along with the control command, to estimate the instantaneous flow field under steady control.
A graphical illustration of three flow control mechanisms in the fluidic pinball plant. Figures from Lin (Reference Lin2021). (a) Stagnation point control. (b) Boat tailing. (c) Base bleeding.

3.2. Flow configuration and numerical solver
The flow is depicted in a two-dimensional Cartesian coordinate system, where the origin is located on the midpoint of the two rear cylinders. The  $x$ axis represents the streamwise direction, and the
 $y$ axis points perpendicular to the freestream direction. Both axes are scaled by the diameter of the cylinders. The velocity vector is scaled by the freestream velocity
 $U_{\infty }$, and is denoted by
 $\boldsymbol{u}=(u,v)$, where
 $u$ represents the streamwise velocity, and
 $v$ the transverse velocity. In this study, we consider an incompressible Newtonian fluid with constant density
 $\rho$ and kinematic viscosity
 $\nu$. The Reynolds number based on the cylinder diameter
 $D$ is defined as
 $Re_{D} = U_{\infty }D/\nu$. Throughout this study, the Reynolds number is set to 100, which corresponds to the asymmetric periodic vortex shedding according to Deng et al. (Reference Deng, Noack, Morzyński and Pastur2020). The computational domain
 $\varOmega$ is bounded by a rectangular box
 $[-6,20]\times [-6,6]$ externally and the three cylinders internally:
 \begin{align}
\varOmega&=\{[x,y]^{\text{T}}\in
\mathcal{R}^2:[x,y]^{\text{T}}\in[{-}6,20]\times[{-}6,6]\cap(x-x_i)^2\nonumber\\
&\quad +(y-y_i)^2\geqslant 1/4, i=1,2,3\}.
\end{align}
Here,  $x_i$ and
 $y_i$ represent the centres of the three cylinders positioned in the flow, where
 \begin{equation}
\left. \begin{array}{@{}ll@{}} x_1={-}3/2\cos(30^\circ),
& y_1=0,\\
x_2=0, & y_2={-}3/4,\\
x_3=0, & y_3=3/4.\\ \end{array} \right\}
\end{equation}
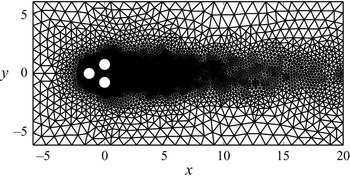
The computational domain  $\varOmega$ is discretized by the unstructured mesh shown in figure 8. This mesh contains 4225 triangles and 8633 vertices. The grid independence of the direct Navier–Stokes solutions has been established by Deng et al. (Reference Deng, Noack, Morzyński and Pastur2020).
Computational grid for the fluidic pinball simulation.

The boundary conditions for the inflow, upper and lower boundaries are specified as the freestream velocity  $U_{\infty }$ and a stress-free condition is assumed at the outflow boundary. To model the steady rotation of the cylinders, a no-slip condition is enforced on the cylinder boundaries. The flow adopts the circumferential velocities on the boundary of the front, bottom and top cylinders, which is specified by
 $b_1 = U_F$,
 $b_2 = U_B$ and
 $b_3 = U_T$. Here,
 $b_1$ to
 $b_3$ are scaled with
 $U_{\infty }$. For each cylinder, the rotation speed on the boundary is within the range
 $[-2, 2]$. A positive value corresponds to counter-clockwise rotation of the cylinders, and vice versa. The control command can then be written as
 $\boldsymbol{b}=[b_1,b_2,b_3]^{\textrm {T}}\in [-2,2]^3$. The initial condition for the numerical simulations is the symmetric steady solution calculated from the steady Navier–Stokes equations. We use an in-house implicit finite-element method solver UNS3 (Noack & Morzyński Reference Noack and Morzyński2017) that employs an implicit finite element method to perform numerical integration of Navier–Stokes equations with third-order accuracy in space and time. In this study, only the post-transient data are collected for the purpose of constructing the fluidic pinball database that will be used to model the input–output relationship between the sparse sensors and the flow state. We non-dimensionalize the time with
 $U_{\infty }$ and
 $D$. For every control command, 100 snapshots are recorded with a time interval
 $\Delta t = 1$. The numerical simulation under a single control command takes up around 1 core hour, and the data storage for 100 snapshots is approximately 78 MB. For the unforced flow, the vortex shedding period is approximately 8.5 times the non-dimensionalized time unit. We choose
 $\Delta t=1$ in an attempt to balance the computational cost and the overall sampling range in time. The generation of control commands, as well as the placement of virtual sensors, will be detailed in the next subsection.
3.3. Control command generation and sensor placement
To establish control-oriented flow estimators, a set of 1000 different control commands  $\mathcal {B}=\{\boldsymbol{b}_j\}_{j=1}^{1000}$ are generated randomly inside the control parameter space
 $[-2,2]^3$. As mentioned in § 3.2, the control parameter
 $\boldsymbol{b}$ represents the circumferential rotation speed of three cylinders in the flow. Here, we employ the Latin hypercube sampling (McKay, Beckman & Conover Reference McKay, Beckman and Conover1979) to obtain a set of randomly distributed control commands
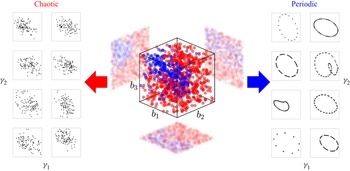
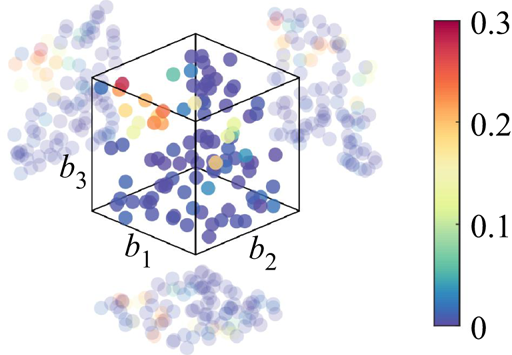
 $\mathcal {B}$. As presented in figure 9, this sampling method ensures a nearly uniform distribution of samples inside the multi-dimensional control parameter space. For each control command, we categorize the flow state into periodic and chaotic types after the flow snapshots are obtained from the numerical solver. The classification criteria are based on the relationship between two variables,
 $\gamma _1$ and
 $\gamma _2$, obtained from the sampled snapshots. Here,
 $\gamma _1 = C_L(t)$ and
 $\gamma _2 = (C_L(t+\Delta t)-C_L(t))/\Delta t$, and
 $C_L$ represents the lift coefficient. The lift coefficient is computed by integrating pressure over the surfaces of three cylinders. From these plots, different characteristics between periodic and chaotic flows can be distinguished clearly. Representative periodic and chaotic phase pattern approximations are displayed in figure 9. For periodic flows, the discrete points in the plots will form circular or periodic trajectories. In contrast, the patterns in chaotic flows are dispersed and disordered. The classification of the flow state will enable us to evaluate the performance of the flow estimators introduced in § 2 under different types of the flow states.
Randomly sampled control commands  $\mathcal {B}$ in the control space
 $[-2, 2]^3$ and their projections on the three orthogonal coordinate planes. Periodic and chaotic cases are rendered by red and blue dots, respectively. Representative patterns of
 $\gamma _1$ versus
 $\gamma _2$ in each category are also presented in this figure. See the text for the definitions of
 $\gamma _1,\gamma _2$.

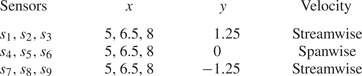
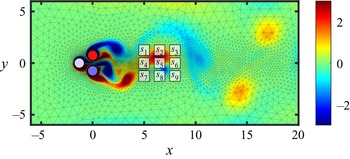
To monitor the flow state, nine virtual probes are placed downstream to measure the discrete velocity signal, in either the streamwise or spanwise component. The velocity probes are deployed as a  $3\times 3$ rectangular grid symmetric about the centreline, where the upper and lower sensors measure the streamwise velocity, and the middle ones on the centreline measure the spanwise velocity. The streamwise locations of the sensors are
 $x = 5, 6.5, 8$, and the spanwise locations are
 $y = -1.5,0,1.5$. This sensor placement has been validated by Cornejo Maceda et al. (Reference Cornejo Maceda, Li, Lusseyran, Morzyński and Noack2021), in a sense that such arrangement is capable of detecting large-scaled vortex shedding while encompassing phase information between sensors in its feedback flow control experiment. In other words, this arrangement can help to infer the flow state in the dynamically controlled flow with a wide range of control commands. Hence in this work, we continue to use this promising sensor placement to obtain flow state estimation. A summary of the sensor placement can be found in table 2, and a comprehensive visualization regarding the flow state, control parameters and downstream sensing is presented in figure 10.
Virtual sensor locations and the corresponding velocity components.

Visualization of sensor placement in the flow domain. The background is rendered by an instantaneous vorticity field. The corresponding control command  $\boldsymbol{b}$ is visualized by the colours on the three cylinders, under a blue (negative)–white (0)–red (positive) colour scheme.

3.4. Data partition and estimation performance evaluation
According to the steady control command and virtual probe placement described above, the fluidic pinball database is established aiming for sensor-based, control-oriented flow estimation. To preserve the generality of the data-driven estimation and prevent over-fitting, the collected input–output data pairs are partitioned into a training set, a validation set, and a test set based on a random split of the control commands  $\mathcal {B}$. The partition of the control commands follows an 80 %–10 %–10 % ratio, and each set is composed of all time instances generated from the corresponding control commands. The training and validation sets compose the observation data
 $\mathcal {M}$, and will be utilized for the neighbourhood searching in
 $k$NN and the calculation of
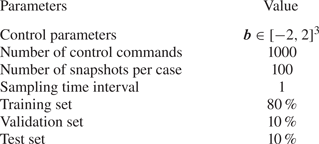
 $T_{ij}$ in LSE. To prevent over-fitting the training data in DNN, the iterative training and gradient-based back-propagation are performed only on the mini-batched training set. After every epoch, we evaluate the model performance on the validation set. The network parameters corresponding to the minimum validation loss over the 500 epochs are outputted after training. The number of epochs is determined empirically by observing the fact that the training loss will hardly be minimized after 500 epochs. For all estimation methods, the test set is not accessible during the training stage. Therefore, with this separate set, we can evaluate the generalized performance of the proposed methods. All key parameters regarding the fluidic pinball database have been concluded and presented in table 3.
A conclusion of the fluidic pinball database.

To evaluate the performance of each estimation method from various perspectives, different types of errors are defined and calculated based on the data from the test set. In this work, different types of errors will be discussed; the definitions are presented in the following. To evaluate the estimation performance under each control command, the normalized estimation error of the POD modal coefficients is defined as
 \begin{equation} \varepsilon_{\boldsymbol{a}}(\boldsymbol{b}) = \sqrt{\frac{\langle \lVert \boldsymbol{a}-\hat{\boldsymbol{a}} \rVert_2^2 \rangle_t}{\langle \lVert \boldsymbol{a} \rVert_2^2 \rangle_t}}. \end{equation}
Similarly, the normalized velocity estimation error  $\varepsilon _{\boldsymbol{u}}(\boldsymbol{x})$ evaluates the spatial distribution of the velocity estimation error that accounts for all time instances and control commands, which is normalized by the overall fluctuating energy, such that
 \begin{equation} \varepsilon_{\boldsymbol{u}}(\boldsymbol{x}) = \sqrt{\frac{\langle \lVert \boldsymbol{u}'_{\boldsymbol{b}}(\boldsymbol{x})-\hat{\boldsymbol{u}}'_b (\boldsymbol{x}) \rVert_{2}^2 \rangle_{\boldsymbol{b},t}}{\langle \lVert \boldsymbol{u}'_{\boldsymbol{b}}(\boldsymbol{x}) \rVert_{2}^2 \rangle_{\boldsymbol{b},t}}}. \end{equation}
Furthermore, we define the normalized overall estimation error  $E$, which is a scalar representing the overall accuracy of each estimation method. The value of
 $E$ is determined as the cumulative estimation error over the spatial domain, all control commands, and all temporal instances in the test set normalized by energy, such that
 \begin{equation} E = \sqrt{\frac{\langle \int_{\varOmega} \lVert \boldsymbol{u}(\boldsymbol{x})-\hat{\boldsymbol{u}}(\boldsymbol{x}) \rVert_{2}^2\,\mathrm{d}\boldsymbol{x}\rangle_{\boldsymbol{b},t}}{\langle \int_{\varOmega} \lVert \boldsymbol{u}(\boldsymbol{x}) \rVert_2^2\,\mathrm{d}\boldsymbol{x}\rangle_{\boldsymbol{b},t}}}. \end{equation}
4. Results and discussion
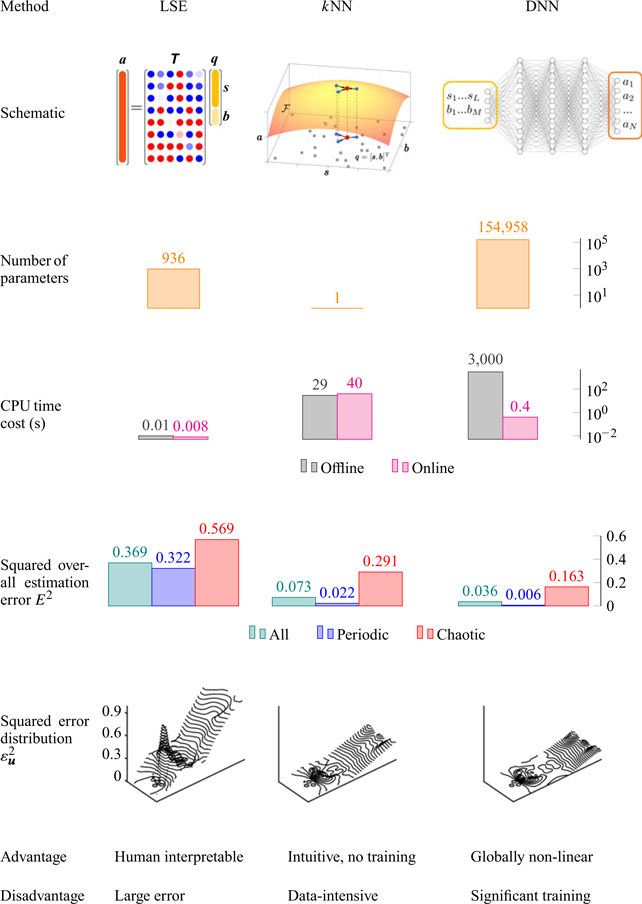
In this section, we apply the three estimation methods introduced in § 2 to the fluidic pinball plant. First, we present the results from the snapshot POD in § 4.1, which includes the energy distribution and the physical interpretation of the leading POD modes. Then the performances of the estimation methods are compared under three representative flow control commands that are selected from the test cases, and the results are presented in §§ 4.2, 4.3 and 4.4, respectively. Here, each control command represents a specific flow control mechanism introduced in § 3.1, and the comparison includes the estimation of reduced-order POD modal coefficients as well as the full-state flow field. Furthermore, the overall performance of each estimation method will be evaluated and discussed in § 4.5, and this section is closed by a concluding diagram (table 4) that contains a thorough assessment of each estimation method from various perspectives. Throughout this section, we adopt the non-dimensionalized form of the data and spatial dimensions, as introduced in § 3.2.
A comprehensive comparison of all estimation methods from different horizons.

4.1. The snapshot POD
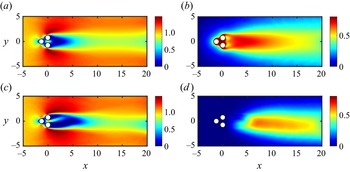
To perform sensor-based flow estimation, a necessary step is to find a reduced-order representation of the high-dimensional flow snapshots. In this work, we decompose the velocity into mean and fluctuating components according to (2.2), then apply the snapshot POD to describe the velocity field using the linear combination of the most energetic POD modes. Figures 11(a,b) present the ensemble-averaged mean streamwise velocity field and the intensity of the fluctuating velocity component  $\sqrt {\langle u^2+v^2 \rangle _{\boldsymbol{b},t}}$, respectively. For comparison, the corresponding profiles of the uncontrolled case
 $\boldsymbol{b} = [0,0,0]^{\textrm {T}}$ are also displayed in figures 11(c,d). Unlike the unforced mean profiles, which are biased to the negative
 $y$ direction due to the pitchfork bifurcation described in Deng et al. (Reference Deng, Noack, Morzyński and Pastur2020), the profiles in figure 11 are seen to be symmetric about the centreline
 $y=0$ thanks to the effect of control. In addition, one can clearly capture a reduced length of the separation region behind the cylinders, as well as the expansion of the most energetic region (in the sense of fluctuating velocity), when the flow is under random control.
(a) Ensemble-averaged streamwise velocity field over 1000 different control commands, and (b) intensity of the fluctuating velocity. (c) Uncontrolled mean streamwise velocity field with pitchfork bifurcation (Deng et al. Reference Deng, Noack, Morzyński and Pastur2020), and (d) the corresponding fluctuating velocity intensity.

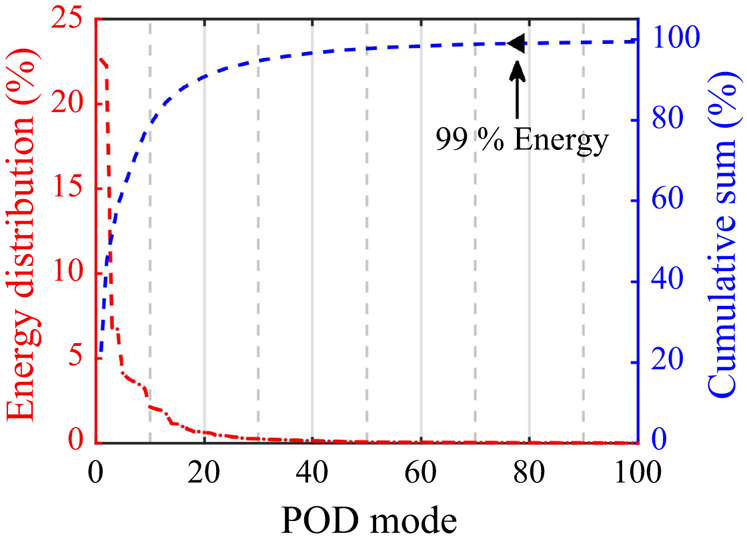
Following the velocity decomposition, we employ the snapshot POD to set up a reduced-order representation of the fluctuating velocity  $\boldsymbol{u}'_{\boldsymbol{b}}$. Figure 12 presents the energy distribution as well as the cumulative sum of the first 100 POD modes. The leading POD modes are seen to possess most of the fluctuating energy, in which the first two and the first ten modes take up 44.9 % and 78.9 % of the overall energy, respectively. A fast decay of the energy in lower-order POD modes is also observed. In an attempt to reduce the computational cost while preserving the most energetic flow structures, the modal truncation criterion is defined as 99 % of the total energy, which corresponds to the first 78 POD modes in this database. These modes will serve as the expected outputs to investigate the performance of the estimation methods.
Energy distribution of the leading POD modes and the cumulative sum.

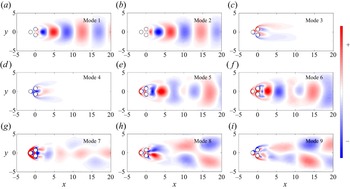
Figure 13 presents the modal shapes of the first 9 dominant POD modes. Each contour represents the curl of the corresponding POD eigenfunction ( $\boldsymbol {\nabla }\times \boldsymbol{u}_k$). The combination of POD modes 1 and 2 can effectively depict the spatial structures of the von Kármán vortex street appearing downstream of the three cylinders. Modes 4 and 5 also represent the vortex shedding structures in the flow, and modes 8 and 9 describe the second harmonics of the dominant coherent structures. Although these structures can be recognized clearly from visualization, the shapes of these modes are no longer strictly symmetric/antisymmetric about the centreline thanks to the influence of cylinder rotations. To advance the physical understanding of POD modes 3, 4 and 7, we calculate the root-mean-square (r.m.s.) of these POD modal coefficients over time (
 $\sqrt {\langle a_i^2(\boldsymbol {b},t) \rangle _t}$ for
 $i=3,4,7$) for all
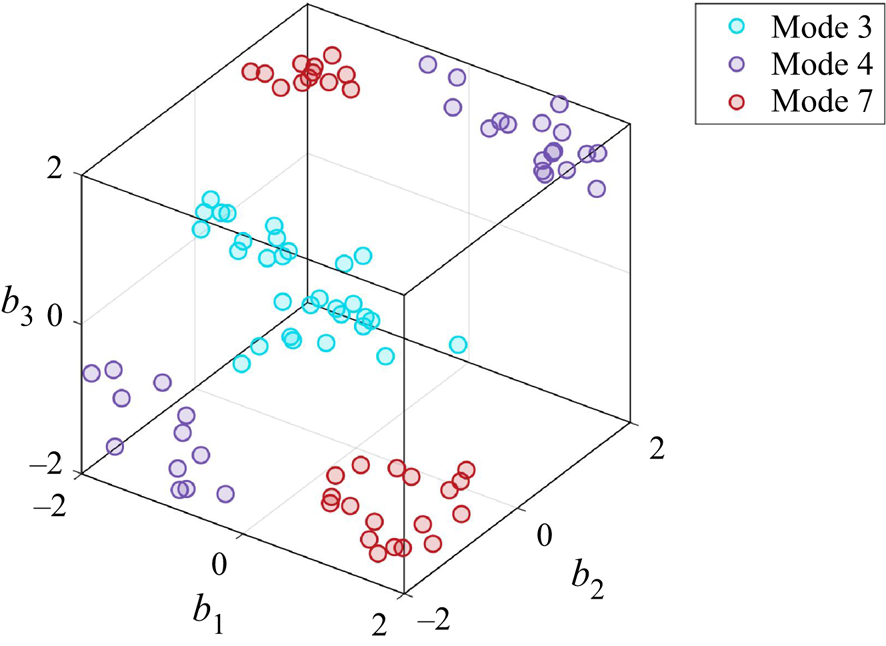
 $\boldsymbol {b}\in \mathcal {B}$. For each mode, we pick the first 30 control laws possessing the highest r.m.s. values, and visualize them in figure 14. In other words, these POD modes become more pronounced under the actuation commands displayed in the figure. Mode 3 plays the role of the shift mode between steady and time-averaged periodic solutions (Noack et al. Reference Noack, Afabasiev, Morzyński, Tadmor and Thiele2003). Furthermore, as the control commands in figure 14 mostly locate around the boundary lines
 $b_2=-2$,
 $b_3=2$ and
 $b_2=2$,
 $b_3=-2$, we find that this shift mode also represents the effect when the two rear cylinders rotate in opposite directions. Mode 4 is more energetic when the control commands approach the boundary points
 $[-2, -2, -2]$ and
 $[2, 2, 2]$, hence this mode is related to the stagnation point control in which all cylinders rotate in a uniform manner. This causal relationship can be confirmed further by its modal shape, where a symmetrical pattern emerges from the separation points of the top and bottom cylinders. Finally, the control commands for mode 7 in figure 14 aggregate near
 $[2,-2,-2]$ and
 $[-2,2,2]$. From this characteristic, we can infer that this mode is highly related to the control when the two rear cylinders rotate in the same direction, and the front cylinder rotates oppositely.
Modal shapes of the first 9 POD modes visualized in vorticity ( $\boldsymbol {\nabla }\times \boldsymbol{u}_k$).

Distribution of the first 30 control commands that possess the highest overall amplitudes of the POD modal coefficients for modes 3, 4 and 7.

The results from the snapshot POD provide a basic understanding of the dominant flow structures under different steady control commands. Based on the information above, in the following we will present the application of estimation methods proposed in § 2 to three representative steady control cases, i.e. boat tailing, stagnation control and base bleeding. To investigate the influence of random initialization on the DNN estimation results, we train the same network architecture 20 times with different randomly generated initial weights, as mentioned in § 2.4. In the following discussions, we use the averaged output from all trained networks as the DNN estimation result and discuss the sensitivity to the initial condition using the corresponding standard deviation.
4.2. Case I: boat tailing
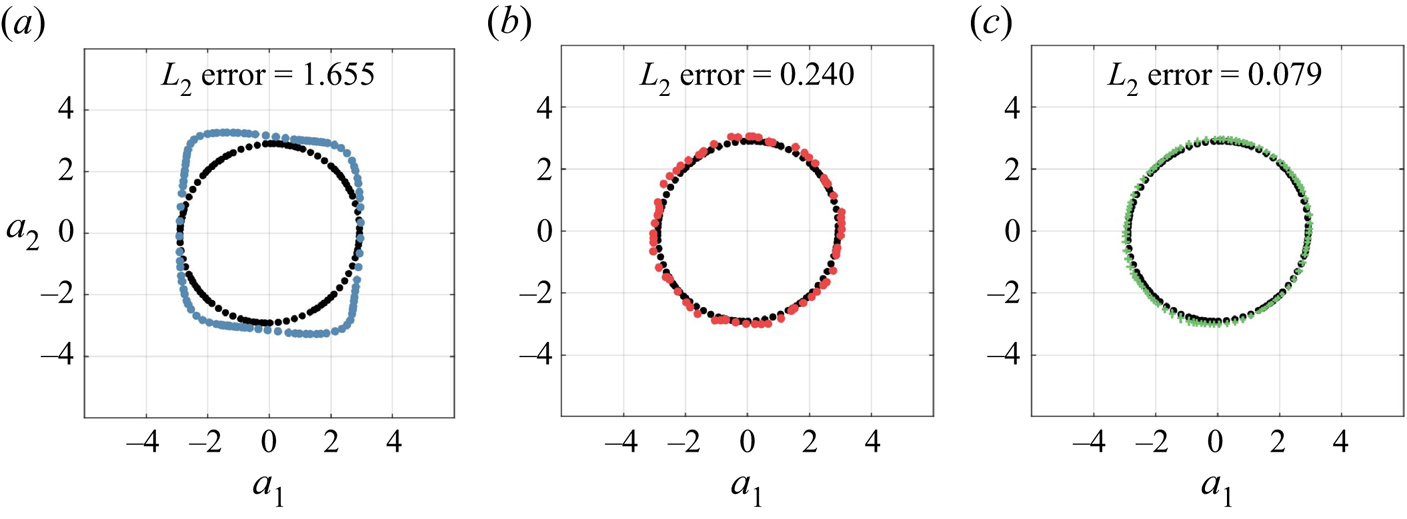
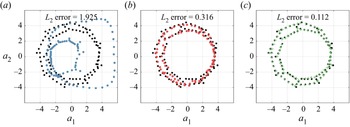
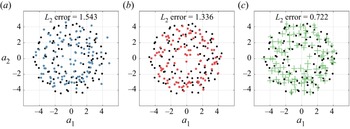
To start with, we apply the flow estimation methods to a boat tailing case where  ${\boldsymbol{b}= [-0.0196, 0.7078, -0.7431]^{\textrm {T}}}$. By rotating the top cylinder in the clockwise direction and the bottom cylinder in the opposite direction, the flow control is realized by the delay of separation on the rearward cylinders in this case. As discussed in § 4.1, the combination of the first two POD modes represents the streamwise propagation of the dominant coherent structures in the flow. Hence, to evaluate the estimation performance, we start with the examination of the phase relationship between
 $a_1$ and
 $a_2$ obtained from each method. Figure 15 presents the estimated phase relationship in comparison to the ground truth provided by direct numerical simulations (DNS). The
 $L_2$ norm of the estimation error from the first two POD modes is also displayed in the figure. The temporal evolution of
 $a_1$ and
 $a_2$ from the simulation data forms a circular pattern in figure 15, which indicates the occurrence of periodic vortex shedding downstream of the cylinders. The phase relationships of
 $k$NN and DNN follow the target outputs in principal, and the estimation errors are relatively small. In comparison, DNN produces a lower estimation error than
 $k$NN in this case. However, LSE misinterprets the circular phase relationship and generates a nearly square pattern. As a result, a relatively large estimation error can be observed from the LSE estimates of the first two POD modes.
Phase relationship ( $a_1$ versus
 $a_2$) obtained from the three estimation methods and the
 $L_2$ error associated with the first two modes in the boat tailing case: (a) LSE, (b)
 $k$NN, (c) DNN. Black dots represent the target outputs from the DNS data. The centre, horizontal and vertical spans of the DNN markers represent the means and standard deviations of
 $a_1$ and
 $a_2$ estimates from 20 trained neural networks with different initializations.

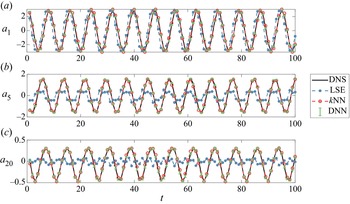
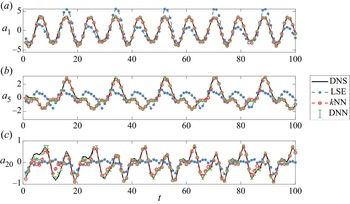
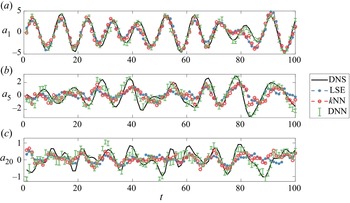
Figure 16 compares the estimated POD modal coefficients and the target outputs from DNS data over all time instances in this boat tailing case. Here, the estimates of three representative POD modes, 1, 5 and 20, are presented in an attempt to evaluate estimation performance at different energy levels. The  $k$NN and DNN estimates are observed to be consistent with the DNS data, and they are able to describe accurately the periodic behaviour of the POD modal coefficients. On the contrary, LSE is observed to generate a relatively large error in the estimation of
 $a_1$, and it can hardly follow the DNS data at higher-order modes
 $a_5$ and
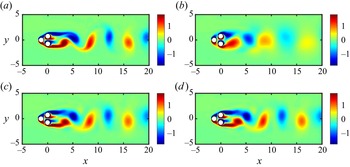
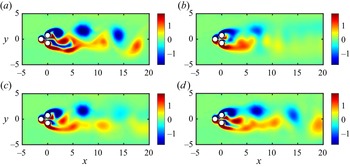
 $a_{20}$. Regarding the variation of the DNN estimates with different initializations, the standard deviations of modal coefficients are hardly recognizable for either leading-order or higher-order POD modes, as shown in figures 15 and 16. Figure 17 displays a comparison between the estimated flow fields and the target DNS data at a randomly selected time instance. The vorticity fields obtained from
 $k$NN and DNN can be seen to remain consistent to the DNS snapshot, while LSE fails to describe accurately the flow state regarding the eddy locations and intensities.
A comparison between estimated POD modal coefficients and the ground truth from DNS data in the boat tailing case. Error bars of the DNN estimates represent the standard deviation from 20 trained neural networks with different initializations.

A comparison between the estimated instantaneous vorticity fields and the DNS data in the boat tailing case: (a) DNS, (b) LSE, (c)  $k$NN, (d) DNN. The DNN estimate is averaged from 20 trained neural networks with different initializations.

4.3. Case II: stagnation point control
In the second case, we investigate the estimation performance when the flow field is under stagnation point control. This strategy represents the uniform rotation of all cylinders, and the control command for this representative case is  $\boldsymbol{b} = [-1.3932 , -1.5026, -1.5952]^{\textrm {T}}$. Figure 18 presents the phase relationship from the three estimation methods as well as the expected outcome from DNS. The phase portrait between
 $a_1$ and
 $a_2$ from DNS is seen to be quasi-periodic, in a sense that the recurring pattern is no longer circular. In this exemplary case, the LSE estimates deviate completely from the true phase pattern, and result in significant estimation error. On the other hand, the two nonlinear methods can faithfully reflect the expected phase relationship. Comparatively,
 $k$NN performs slightly better than DNN regarding the
 $L_2$ errors that are shown on the figure. Figure 19 compares the estimated modal amplitudes to the ground truth for POD modes 1, 5 and 20. Besides the accurate estimation of the first-order modal coefficient,
 $k$NN and DNN also show promising estimation performance at
 $a_5$ and
 $a_{20}$. On the contrary, LSE estimates are seen to deviate much more from the ground truth at
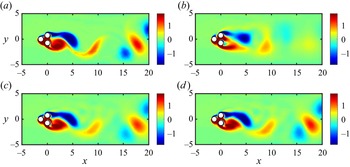
 $a_1$, and can hardly follow the DNS curve at higher-order modes. Regarding the sensitivity to random initialization from DNN estimates, only an insignificant level of uncertainty is observed in figures 18 and 19. The estimation results of an instantaneous flow snapshot are displayed in figure 20, and are compared to the target output from DNS. In the DNS snapshot, the dominant features in the flow are the vortex shedding near
 $x=5$, as well as the downstream eddies appearing after
 $x=15$. The estimated flow fields from LSE and DNN are capable of capturing these dominant flow features from the combined input vector. However, in the LSE estimate, the flow structures before
 $x=10$ can be captured only roughly, with significant inconsistency in shape. At the same time, vortices appearing further downstream can no longer be recognized from this linear estimation approach.
Phase relationship ( $a_1$ versus
 $a_2$) obtained from the three estimation methods and the
 $L_2$ errors associated with the first two modes in the stagnation point control case: (a) LSE, (b)
 $k$NN, (c) DNN. Black dots represent the target outputs from the DNS data. The centre, horizontal and vertical spans of the DNN markers represent the means and standard deviations of
 $a_1$ and
 $a_2$ estimates from 20 trained neural networks with different initializations.

A comparison between estimated POD modal coefficients and the ground truth from DNS data in the stagnation point control case. Error bars of the DNN estimates represent the standard deviation from 20 trained neural networks with different initializations.

A comparison between the estimated instantaneous vorticity fields and the DNS data in the stagnation point control case: (a) DNS, (b) LSE, (c)  $k$NN, (d) DNN. The DNN estimate is averaged from 20 trained neural networks with different initializations.

4.4. Case III: base bleeding
In the last example, we examine a test case that relates to the base bleeding flow control mechanism. For base bleeding, the counter-rotation of rear cylinders enables a streamwise fluidic jet in between, thus attenuating the vortex shedding downstream. In this test case, the control command is  $\boldsymbol{b}= [-0.2382, -1.2296, 1.1534]^{\textrm {T}}$, from which a fully chaotic phase pattern is established in figure 21. For the estimation of the first two POD modal coefficients, although both nonlinear methods still consistently outperform LSE, the estimation errors from
 $k$NN and DNN have been increased notably when compared to the previous examples. Comparatively, DNN provides a slightly lower estimation error than
 $k$NN in this case. Figure 22 presents the estimation of the POD modal coefficients over time in comparison to the ground truth. For POD mode 1, results from all estimation methods can basically follow the trend of the ground truth. However, for higher-order modes, the estimation curves can only roughly reflect the variation of the ground truth. Among these methods, the DNN estimation is more consistent with the DNS data than the other two methods. In addition, the uncertainty of the DNN estimates in figures 21 and 22 becomes more significant in comparison to the previous two cases, indicating that the DNN estimate becomes more sensitive to the initialization in comparison to the previous two cases. The exemplary flow field estimation is presented in figure 23. In this snapshot, the dominant flow feature of the DNS flow snapshot is the streamwise shedding of the smaller-scaled vortical structures generated by the base bleeding mechanism. Yet the LSE estimation can provide only a rough estimation of the flow field before
 $x=5$, and any flow structure appearing downstream can no longer be featured from the estimated flow field.
 $k$NN provides a reasonable flow prediction before
 $x=8$. Beyond this point, significant discrepancy from the DNS snapshot can be observed clearly. Among these estimation methods, DNN can provide a more accurate depiction of the flow. All dominant vortices in the DNS snapshot can be identified clearly from the DNN estimate. However, one can still observe disparities from ground truth regarding the shapes and intensities of downstream eddies in the flow.
Phase relationship ( $a_1$ versus
 $a_2$) obtained from the three estimation methods and the
 $L_2$ error associated with the first two modes in the base bleeding case: (a) LSE, (b)
 $k$NN, (c) DNN. Black dots represent the target outputs from the DNS data. The centre, horizontal and vertical spans of the DNN markers represent the means and standard deviations of
 $a_1$ and
 $a_2$ estimates from 20 trained neural networks with different initializations.

A comparison between estimated POD modal coefficients and the ground truth from DNS data in the stagnation control case. Error bars of the DNN estimates represent the standard deviations from 20 trained neural networks with different initializations.

A comparison between the estimated instantaneous vorticity fields and the DNS data in the base bleeding case: (a) DNS, (b) LSE, (c)  $k$NN, (d) DNN. The DNN estimate is averaged from 20 trained neural networks with different initializations.

4.5. Overall evaluation of the estimation methods
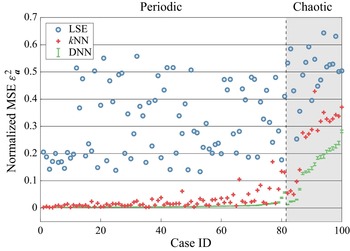
Based on the analysis of the above-mentioned exemplary cases, which correspond to specific flow control strategies, we evaluate the performance of the three estimators from all 100 randomly generated control commands in the test set. As introduced in § 3, each test case is composed of 100 consecutive time instances. For each estimator, the squared estimation error of POD modal coefficients,  $\varepsilon _{\boldsymbol{a}}^2$, is calculated from the flow estimates, and the results are summarized and presented in figure 24. For better comparison, the test cases are classified into periodic and chaotic categories according to the classification criteria described in § 3.3, and all cases in each category are sorted by the error magnitude of DNN in an ascending order. As an analytically simple approach, LSE estimates always lead to relatively larger error than the other two nonlinear approaches. This observation confirms the appearance of strong nonlinearity in the control-oriented flow estimation problem. In most periodic cases, both
 $k$NN and DNN can achieve accurate estimation of the POD modal coefficients with
 $\varepsilon _{\boldsymbol{a}}^2<0.03$. Nevertheless, a few outliers from
 $k$NN can be identified from the figure. As the
 $k$NN estimation relies heavily on the neighbourhood data, the estimation result can be easily biased when the first
 $k$ neighbours are distant from the input data or when a steep variation of the mapping function
 $\mathcal {F}$ occurs in the neighbourhood. On the other hand, by optimizing a generalized model from the database, DNN is more resistant to these challenges and is capable of providing a more robust estimation result. Also, the influence of random initialization on the estimation performance is nearly negligible in all periodic cases. When the flow becomes chaotic, the DNN estimator become more sensitive to different initialization conditions with an increased level of uncertainty. However, the limited level of uncertainty still confirms the robustness of DNN estimation in chaotic cases. In the chaotic regime, the estimation errors from both DNN and
 $k$NN are seen to increase in comparison to the periodic cases. The increased level of estimation error indicates the appearance of more complex vortical structures generated from the cylinder rotations. These structures make it more difficult to identify the correct flow features of the estimators from the pointwise sensor measurements. Nevertheless, DNN shows its advantage on the consistently better estimation of the chaotic forced flow. A comparison of the squared overall estimation error
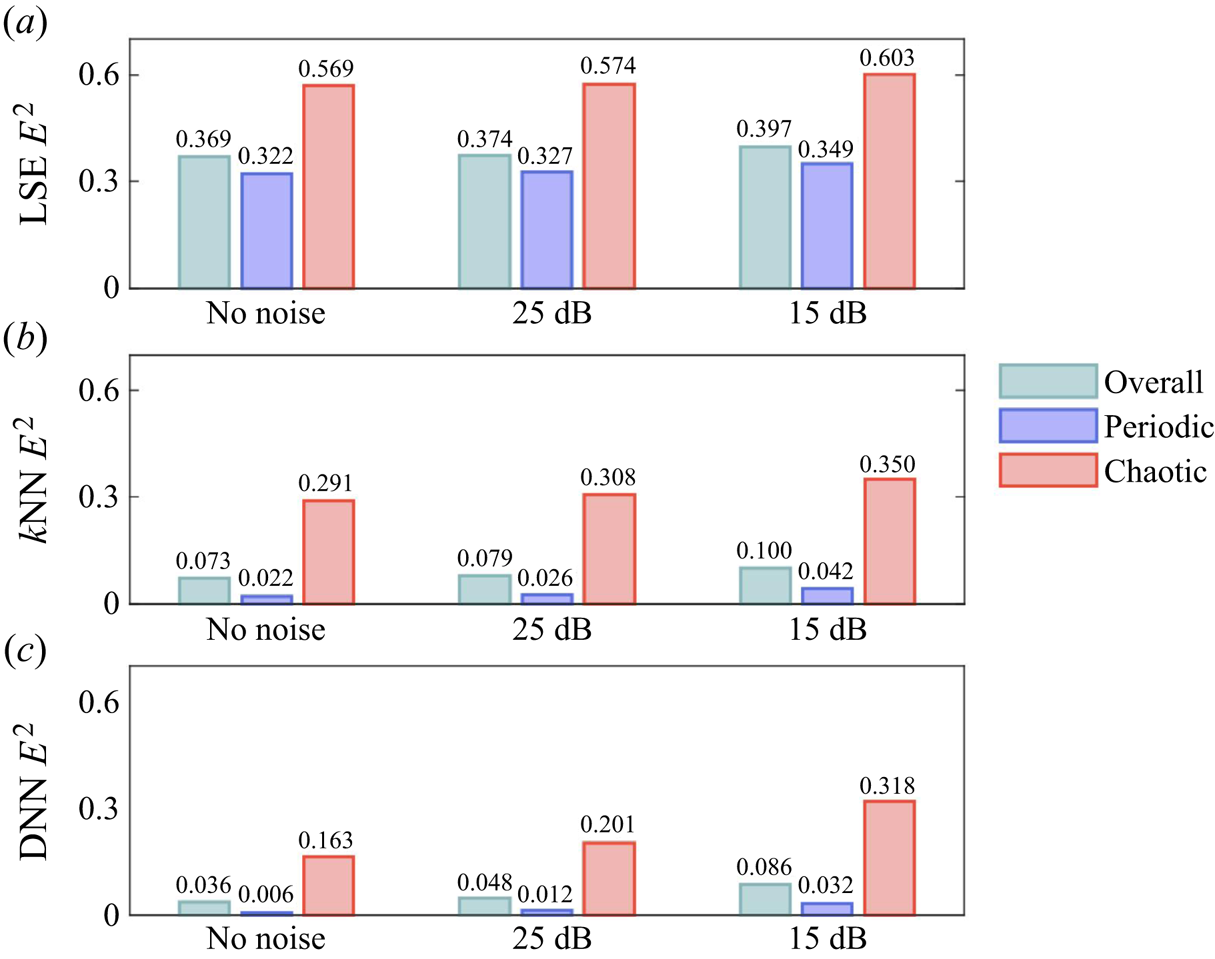
 $E^2$ from all estimators is included in table 4. This comparison includes the errors from all test cases, as well as the periodic and chaotic components. In agreement with the previous analysis, the quantitative assessment of
 $E^2$ confirms (1) the increased difficulty in estimating accurately the flow state under chaotic cases, (2) the improvement of estimation accuracy using nonlinear estimators, and (3) the consistently better performance of DNN. The standard deviations of
 $E^2$ from all 20 trained neural networks are 0.00036, 0.00015 and 0.0016
 $s$ for all test cases, periodic cases and chaotic cases, respectively. Hence the influence of weights initialization on the overall estimation error is negligible in DNN estimation. To help in understanding the error distribution regarding different control commands, figure 25 displays the relationship between the control commands and their associated estimation error
 $E^2$ in the test set. Here, we present only the error associated with the DNN estimator as it provides a consistently better result. Consistent with the previous discussion, almost all control commands having relatively high estimation errors locate inside the chaotic region displayed in figure 9. An increased sampling density of the training dataset in the chaotic region is able to further improve the overall estimation accuracy.
Distribution of normalized mean squared error ( $\varepsilon ^2_{\boldsymbol{a}}$) for the prediction of POD expansion coefficients in all 100 test cases. The cases were classified into periodic (white background) and chaotic (grey background) categories. In each category, case IDs were sorted based on the averaged DNN estimation error. The standard deviations over the 20 trained networks are denoted by the green error bars.

Distribution of squared estimation error  $E^2$ from DNN estimator in the space of control command
 $\boldsymbol {b}$. Error distribution is also projected onto the three orthogonal two-dimensional planes for better visualization.

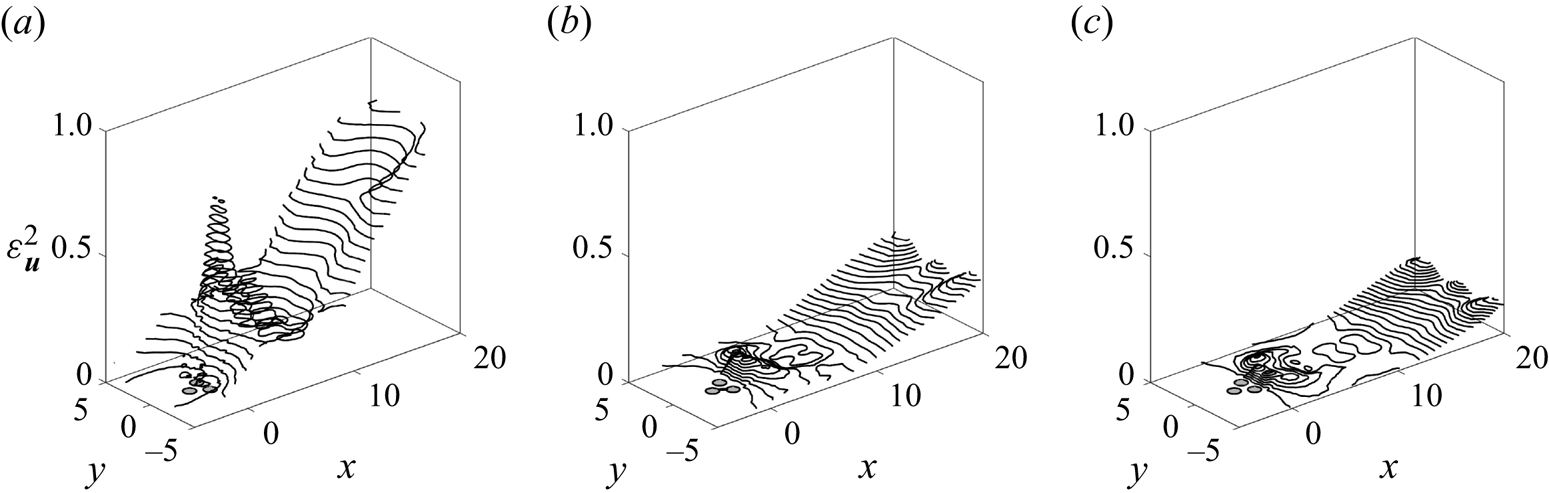
Figure 26 visualizes the distribution of the squared normalized velocity estimation error  $\varepsilon ^2_{\boldsymbol{u}}$ in the spatial domain. The error distribution in space not only evaluates the relative performance of each method, but can also justify the ideal locations of additional sensors once the estimation performances are required be improved further. Among all estimation methods, LSE generates the most significant estimation error in the flow domain, which demonstrates its naiveness to handle the complex nonlinear problem. The most significant estimation error from LSE resides in two regions, one just behind the cylinders, and the other further downstream after
 $x=10$. The dominant error source from both
 $k$NN and DNN resides in the downstream region after
 $x=13$. Comparatively, the estimation error from DNN is slightly lower than that of
 $k$NN thanks to the better performance in the chaotic regime according to figure 24. Since all in-flow sensors are deployed in
 $5< x<8$, the flow structures can be better identified from the sensor measurements. As a result, the estimation error inside this region remains at a relatively low level for all estimation methods. In a similar manner, the estimation performance for chaotic flows can also be improved further by deploying addition sensors after
 $x=10$ to obtain additional input information. The same principle can be used in real-life applications to improve the estimation accuracy in which the flow will be more complex than this two-dimensional benchmark case.
The squared normalized velocity estimation error ( $\varepsilon ^2_{\boldsymbol{u}}$) from each method: (a) LSE, (b)
 $k$NN, (c) DNN.

Besides the error assessment of each method, table 4 also comprehensively concludes the characteristics of three estimators from multiple aspects. This parametric study serves to highlight the relative merits of each method. The comparison includes the complexity (i.e. the number of tunable variables in each method), as well as the time costs. All comparison horizons are evaluated using the same workstation, which has two 2.25 GHz AMD 64-core processors with paralleled computation. The LSE algorithm is implemented in MATLAB, and for the two machine learning methods, Python with scikit-learn (Pedregosa et al. Reference Pedregosa2011) and tensorflow-cpu (Abadi et al. Reference Abadi2015) packages are utilized to achieve the estimation. Regarding the number of tunable parameters, LSE results in a total of 936 parameters, which correspond to all elements in the linear transfer matrix  $T_{ij}$ in (2.7). The only tunable parameter in
 $k$NN is the number of observations
 $k$ in the neighbourhood. As mentioned previously, the value of
 $k$ is determined via a convergence test in this work (see figure 4). Given the complexity of the nonlinear neural network architecture, DNN possesses the largest number of parameters (154 958), which corresponds to the weights and biases from all artificial neurons.
In addition, time consumption of each estimation method is listed in table 4. Here, both offline and online time costs are proposed and counted in terms of CPU time. The offline time represents the time cost to optimize the tunable parameters, and the online time cost stands for the computational time to obtain an output estimate from the test dataset. For LSE, the offline time is equivalent to the time consumption solving for  $T_{ij}$, which is approximately 0.01 s starting from the calculation of correlation matrices in (2.8).
 $k$NN represents a model-free approach and relies only on the observations from the neighbouring observations; no training is necessary for this method. However, in the practical implementation, some preliminary data-processing steps (such as database sorting) are executed in the scikit-learn package before the estimation stage. We count the corresponding pre-processing time as the offline time cost of
 $k$NN in this table, while reminding readers about the training-free nature of this method. The offline training of DNN involves the iterative optimization of the loss function based on the randomly partitioned mini-batches, and this process takes around 3000 CPU s with a total of 500 training epochs. The addition of graphical processing units (GPUs) may alleviate the training time, but the expected training time is still much longer than for the other two methods. However, once the DNN model is well trained, the online estimation can be finished within a short time. In this study, the online estimation of DNN can be realized within 0.4 s CPU time. With model compression techniques, such as the optimization of DNN architecture (Ramchoun et al. Reference Ramchoun, Amine, Idrissi, Ghanou and Ettaouil2016) or symbolic regression (Cranmer et al. Reference Cranmer, Sanchez Gonzalez, Battaglia, Xu, Cranmer, Spergel and Ho2020), the DNN estimation can be accelerated further and potentially can be applied to feedback flow control as described in Samimy et al. (Reference Samimy, Debiasi, Caraballo, Serrani, Yuan, Little and Myatt2007).
 $k$NN represents the most data-intensive mapping, in the sense that the training dataset needs to be kept during the estimation. As
 $k$NN requires intensive computation to search for the neighbourhood observations from the huge database, the corresponding online estimation time becomes significantly longer than the other methods. In this study, the online cost of
 $k$NN is approximately 40 s, and we can conclude that this data-intensive method can be hardly adopted by any closed-loop control application that requires instantaneous feedback. For the purpose of reference, the break-even point in the number of calls to
 $k$NN and DNN estimators is 52 in terms of CPU cost. Although the online time cost for LSE is only 0.008 s, the linear assumption makes this method still difficult to be adopted by any real applications that require promising estimation accuracy.
5. Conclusions and outlook
We propose the first machine-learned, control-oriented flow estimation for multiple-input, multiple-output (MIMO) plants. In this method, the input vector are the MIMO signals, i.e. comprise the sensor signals and actuation commands, and output is the instantaneous flow field. The starting point is a database from simulations with representative steady actuation commands, sensor signals and simultaneously recorded flow snapshots. The estimator mapping employs three representative data-driven methods: an analytically simple approach, a data-centric approach, and a general nonlinear approach. The analytically simple method adopts linear stochastic estimation (LSE) with the addition of the control commands to the input vector. The data-centric method employs  $k$ nearest neighbours (
 $k$NN) regression, which interpolates the flow state based on the closest MIMO signals in the database. The general nonlinear mapping function is established from the deep neural network (DNN), and the weights and biases are optimized from the training data.
As benchmark, the fluidic pinball is chosen (Ishar et al. Reference Ishar, Kaiser, Morzyński, Fernex, Semaan, Albers, Meysonnat, Schröder and Noack2019; Cornejo Maceda et al. Reference Cornejo Maceda, Li, Lusseyran, Morzyński and Noack2021; Li et al. Reference Li, Cui, Jia, Li, Yang, Morzyński and Noack2022). This two-dimensional configuration consists of three parallel cylinders of the same diameter on an equilateral triangle pointing upstream to the uniform flow. The flow may be manipulated by the cylinder rotations, i.e. three actuation commands. The flow is monitored by nine downstream velocity sensors. The reference Reynolds number is 100 based on cylinder diameter. The unforced flow exhibits six different Navier–Stokes solutions, including two stable statistically asymmetric periodic vortex sheddings Deng et al. (Reference Deng, Noack, Morzyński and Pastur2020, Reference Deng, Noack, Morzyński and Pastur2021a). The steady rotations of cylinders lead to rich flow dynamics, e.g. steady, periodic, quasi-periodic and chaotic behaviour with eddies at various scales. The flow estimation problem has a large dynamic complexity despite geometric simplicity. With the application of three estimation methods to the fluidic pinball plant, we conclude the key results in the following.
Figure 4 concludes the major characteristics of three machine-learning estimation methods. As a widely adopted linear reference point, LSE helps to identify the degree of nonlinearity contained in the fluidic pinball plant under different open-loop actuation commands. In comparison to nonlinear estimators, LSE leads to the highest estimation error, albeit being computationally cheap. In all exemplary cases, this method fails to capture faithfully the phase relationship regarding the downstream vortex shedding. From the instantaneous flow fields, LSE estimates can hardly identify the correct locations and intensities of the large-scale vortical structures in the flow. The data-centric ( $k$NN) and globally nonlinear (DNN) estimators have distinctly lower estimation errors. These observations confirm the appearance of strong nonlinearity in the estimation mapping function when the flow is under different control commands.
Both nonlinear estimators based on  $k$NN and DNN are capable of providing more accurate flow field estimates than the generalized linear stochastic estimation. The nonlinear estimators exhibit similar accuracy for forced periodic dynamics. DNN performs consistently better than
 $k$NN for forced chaotic dynamics, albeit at lower accuracy than for periodic flow. DNN seems to have learned a mapping that extrapolates better than
 $k$NN. Apart from the improved accuracy, each nonlinear estimator has its distinct merits.
 $k$NN possesses the simplest architecture, and no training phase is required. In contrast, the network model in DNN is relatively complicated, and requires offline training. Yet the online estimation of DNN is 100 times faster than
 $k$NN. This makes DNN more favourable than
 $k$NN in time-critical engineering applications.
The feasibility of the machine-learned, control-oriented flow estimation suggests exciting future directions. For instance, the noise filtering capability of Kalman filters of (N)ARMAX methods may be integrated by lifting the sensor signals to feature vectors with time-delay coordinates (Loiseau, Noack & Brunton Reference Loiseau, Noack and Brunton2018). Similarly, unsteady actuation may also be incorporated by including time-delay coordinates of the actuation commands. From then on, the control-oriented flow estimation approaches can be integrated into closed-loop control algorithms. The addition of time-delay coordinates also allows an alleviation of the computational cost of the training dataset. The method to generate the training dataset under time-varying control laws has been detailed in Bieker et al. (Reference Bieker, Peitz, Brunton, Kutz and Dellnitz2020).
In addition, the low-dimensional representation of the flow field will become more efficient by using a wide spectrum of dimensionality reduction techniques. A striking example is the transient oscillatory cylinder dynamics, which requires 50 POD modes to resolve a two-dimensional manifold (Loiseau et al. Reference Loiseau, Noack and Brunton2018). Another example is an ensemble of actuated flows: POD modes of all data are less efficient than first clustering the flow snapshots followed by cluster-based (local) POD bases – similar to Hess et al. (Reference Hess, Alla, Quaini, Rozza and Gunzburger2019) for bifurcating flows. Following this path, reduced-order models based on centroidal Voronoi tessellations (Burkardt, Gunzburger & Lee Reference Burkardt, Gunzburger and Lee2006a,Reference Burkardt, Gunzburger and Leeb) constitute an alternative to a monolithic POD model. The Isomap represents another nonlinear dimensionality reduction technique that embeds flow snapshots into a low-dimensional manifold (Farzamnik et al. Reference Farzamnik, Ianiro, Discetti, Deng, Oberleithner, Noack and Guerrero2022). Fukami et al. (Reference Fukami, Nakamura and Fukagata2020) and Murata, Fukami & Fukagata (Reference Murata, Fukami and Fukagata2020) have reported that nonlinear modal decomposition methods based on CNN and Autoencoder (AE) are capable of extracting flow features in a more efficient manner than the POD-based methods. The latent space of AE is the compact representation of the full-state flow field. Different from POD, which decomposes the flow as spatially distributed flow structures, AE explores the low-dimensional feature vectors of the flow.
The combination of control-oriented flow estimation and nonlinear reduced-order modelling will lead to a more compact output vector and accelerate the estimation procedure correspondingly.
For  $k$NN and DNN, their implementations in this study follow the most generally adopted architectures. However, the estimation accuracy can be improved further. The inflexible assignment of the
 $K$ value in (2.5) and the intensive computational cost of searching for neighbours can be cured by the adaptive selection of
 $K$ (Zhang et al. Reference Zhang, Li, Zong, Zhu and Wang2018), as well as the clustering-based searching approach (Deng et al. Reference Deng, Zhu, Cheng, Zong and Zhang2016). The accuracy of DNN may be improved with first principles, i.e. the governing equations, following physical-informed neural networks (Raissi, Perdikaris & Karniadakis Reference Raissi, Perdikaris and Karniadakis2019). This type of network assimilates the flow estimation and the governing equations of the investigated flow, and is capable of enhancing the estimation accuracy.
Finally, this method can be extended easily to experimental flow control plants under steady and periodic actuation. In general, the control commands can be adapted easily to actuation parameters of the most commonly used actuators in engineering applications (Cattafesta & Sheplak Reference Cattafesta and Sheplak2011). For passive control devices such as vortex generators, the control command can be the corresponding design parameters, such as height, length, position and the inclination angle. For active control devices, these parameters include the activation amplitude, frequency and duty cycle, among others. The training database can be constructed from synchronized measurements between particle image velocimetry and sensor signals. The resulting estimators from the machine learning approaches introduced above will provide understanding of relationships between the flow field and sensor signals under various actuation commands in real-world applications, and will guide the design of the model-based, closed-loop flow control (Samimy et al. Reference Samimy, Debiasi, Caraballo, Serrani, Yuan, Little and Myatt2007).
Acknowledgements
We acknowledge valuable discussions with Guy Cornejo Maceda, Nan Deng, Qixin (Kiki) Lin, Marek Morzyński and Luc Pastur. We are indebted to the anonymous referees for ample constructive advice.
Funding
This work is supported by the National Science Foundation of China (NSFC) through grants 12172109 and 12172111, and by the Natural Science and Engineering grant 2022A1515011492 of Guangdong province, China, and by the Shenzhen Research Foundation for Basic Research, China, through grant JCYJ20220531095605012.
Declaration of interests
The authors report no conflict of interest.
Appendix. Effects of sensor noise to the estimation performance
One major concern to apply control-oriented flow estimation techniques to the real experiment is the robustness against sensor noise. To evaluate the performance of the estimation methods under noisy conditions, we add two different levels of Gaussian noise to the velocity measurements from the 9 virtual probes. We adopt two different levels of signal-to-noise ratio (SNR) to all virtual probes, then apply the estimation methods to the noisy dataset following the procedure introduced in § 2. The two different SNRs that we use in this study are 25 and 15 dB, respectively. A 25 dB noise level represents a relatively optimum measurement, and a 15 dB SNR will imply really noisy measurements. Figure 27 displays the squared overall estimation error  $E^2$ from all three estimators under the proposed SNRs. For a complete comparison, the squared estimation error without artificial sensor noise is also presented in this figure. From all methods, the estimation errors increase only slightly with the enhanced noise level. Comparatively, the estimation performance of periodic flows is more robust than that of the chaotic flows as the noise level increases. Among all three methods, LSE always leads to the highest estimation error under different noise levels, in either periodic or chaotic cases. On the other hand, DNN performs consistently better than
 $k$NN and LSE. These results suggest the feasibility of nonlinear, control-oriented flow estimation techniques towards their applications in real experiments.
Squared overall estimation error  $E^2$ with different noise levels in the sensor signals.