



1. Introduction
Droplet deformation and fragmentation are the fundamental building blocks of emulsification. Examples of conventional emulsification methods are the rotor-stator system and the high-pressure valve homogeniser (Vankova et al. Reference Vankova, Tcholakova, Denkov, Ivanov, Vulchev and Danner2007; Ren et al. Reference Ren, Li, Ma, Zhang, Hu, Khan and Liu2022). There, droplets break up into smaller droplets due to intense shear from turbulent flows in fast-rotating mechanical mixers or from high-pressure pumping through the homogenising valves. For instance, the mechanical energy imparted by the rotating rotors generates large eddies with a characteristic length corresponding to the rotor dimension. Through the energy cascade, the flow is driven into increasingly smaller scales down to the Kolmogorov length scales (Kolmogorov Reference Kolmogorov1941). This cascade provides the transfer of the energy necessary to break up the macroscopic phase. Similarly, in a microfluidiser, the transmission and collision of two strongly pressurised streams of emulsions with macro-sized droplets through microchannels result in much finer sized emulsions (Schultz et al. Reference Schultz, Wagner, Urban and Ulrich2004; Evangelio, Campo-Cortés & Gordillo Reference Evangelio, Campo-Cortés and Gordillo2016; Ji et al. Reference Ji, Bellettre, Montillet and Massoli2020; Wang et al. Reference Wang, Semprebon, Liu, Zhang and Kusumaatmaja2020). Here, a combination of strong shear and cavitation in the region of collision between the two streams leads to the disintegration of the macroscopic phases. Localised intense stresses may also be generated by irradiating the liquid with ultrasound. Here, the shear is not generated by the sound field directly. Instead, small gas bubbles in the liquid are driven to large volume oscillations that generate the necessary stresses. For example, during the collapse, mild asymmetries in the flow field are amplified. The resulting liquid jets drive shear flow (Canselier et al. Reference Canselier, Delmas, Wilhelm and Abismail2002; Hijo, Guinosa & Silva Reference Hijo, Guinosa and Silva2022; Perrin et al. Reference Perrin, Desobry-Banon, Gillet and Desobry2022). Insights into the mechanism on how a particular technique leads to droplet deformation and fragmentation are pertinent for improving the current emulsification techniques (Zhou et al. Reference Zhou, Zhang, Wang, Zhang and Zhang2022).
There are several ways to realise the fragmentation of a single droplet. Droplet deformation and breakup could be triggered by either modulating the conditions in the surrounding ambient flow, such as shear flow, which in turn would interact with the droplet. In another approach, localised disturbances are introduced inside or near the droplet interface, which has been widely employed to explore the mechanism and the resulting breakup regimes. For instance, the droplet deformation and breakup in a shear flow has been investigated in great detail (Bentley & Leal Reference Bentley and Leal1986; Stone, Bentley & Leal Reference Stone, Bentley and Leal1986; Renardy & Cristini Reference Renardy and Cristini2001; Cristini et al. Reference Cristini, Guido, Alfani, Bławzdziewicz and Loewenberg2003; Liu et al. Reference Liu, Zhang, Ba, Wang and Wu2020, Reference Liu, Liu, Jiang, Zhu, Ma and Fu2022). The flow-induced stress on the droplet surface leads to either a steady ellipsoidal deformation or, by overcoming interfacial forces, the droplet disintegrates into smaller droplets. The interplay between the viscosity ratio of the continuous and dispersed phases and the shear rate was found to determine the transition between the deformation and the breakup regimes (Taylor Reference Taylor1934; Singh & Narsimhan Reference Singh and Narsimhan2022). The two major droplet fragmentation mechanisms – end pinching and capillary instability – were reported through the experimental findings by Rallison (Reference Rallison1984). Formation and breakup mechanisms of double emulsions in extensional flows have been explored numerically (Stone & Leal Reference Stone and Leal1990; Kim & Dabiri Reference Kim and Dabiri2017). The uniaxial extensional flow deforms the double emulsion into a prolate spheroidal shape while the recirculating flow inside the annular region deforms the core into an oblate spheroid.
Unlike the laminar transition from deformation to breakup observed in shear flow, a complex fragmentation phenomenon is noticed when a droplet encounters a gas stream (Guildenbecher, López-Rivera & Sojka Reference Guildenbecher, López-Rivera and Sojka2009; Kamiya et al. Reference Kamiya, Asahara, Yada, Mizuno and Miyasaka2022; Sharma et al. Reference Sharma, Chandra, Basu and Kumar2022). The intricate synergy between the aerodynamic forces and surface tension-based instabilities leads to varying droplet morphologies which are sensitive to the flow conditions and fluid properties. Aerodynamic droplet fragmentation has been categorised into five breakup modes: vibrational (Shraiber, Podvysotsky & Dubrovsky Reference Shraiber, Podvysotsky and Dubrovsky1996), bag breakup (Jalaal & Mehravaran Reference Jalaal and Mehravaran2012; Kulkarni & Sojka Reference Kulkarni and Sojka2014), multimode breakup (Hirahara & Kawahashi Reference Hirahara and Kawahashi1992; Hsiang & Faeth Reference Hsiang and Faeth1995; Cao et al. Reference Cao, Sun, Li, Liu and Yu2007), sheet thinning (Liu & Reitz Reference Liu and Reitz1997; Han & Tryggvason Reference Han and Tryggvason2001) and catastrophic breakup (Joseph, Belanger & Beavers Reference Joseph, Belanger and Beavers1999; Theofanous & Li Reference Theofanous and Li2008). In certain circumstances, instead of altering the conditions of the surrounding flow, droplet fragmentation is achieved when it undergoes a mechanical impact onto a solid surface (Yarin Reference Yarin2006; Villermaux & Bossa Reference Villermaux and Bossa2011; Josserand & Thoroddsen Reference Josserand and Thoroddsen2016; Soto et al. Reference Soto, Girard, Le Helloco, Binder, Quéré and Varanasi2018; Wang & Bourouiba Reference Wang and Bourouiba2018; García-Geijo et al. Reference García-Geijo, Quintero, Riboux and Gordillo2021). In these scenarios, the rim bordering the radially expanding droplet breaks up into fragments due to Rayleigh–Taylor and Rayleigh–Plateau instabilities.
Droplet fragmentation can also be realised by introducing a localised region of high shear near the droplet surface. Acoustic emulsification is a technique in which large droplets are successively broken down into smaller scales through cavitation bubbles (Li & Fogler Reference Li and Fogler1978a,Reference Li and Foglerb; Canselier et al. Reference Canselier, Delmas, Wilhelm and Abismail2002; Kaci et al. Reference Kaci, Meziani, Arab-Tehrany, Gillet, Desjardins-Lavisse and Desobry2014; Zhao et al. Reference Zhao, Dong, Yao, Wen, Chen and Yuan2018). When acoustic waves travel through the continuous phase with amplitudes above the cavitation threshold, cavitation bubbles are nucleated. The collapse of these bubbles results in localised high pressures and temperatures, high-speed liquid jets, the emission of shock waves, and strong localised shear fields (Rosselló et al. Reference Rosselló, Lauterborn, Koch, Wilken, Kurz and Mettin2018; Taha et al. Reference Taha, Ahmed, Ismaiel, Kumar, Xu, Pan and Hu2020). These intense hydrodynamic effects facilitate droplet breakup and the formation of stable emulsions. As such, ultrasonic cavitation has been employed as an efficient technique to deliver highly localised shear forces to small volumes for emulsification (Li et al. Reference Li, Leong, Kumar and Martin2018).
The quality of the emulsification process may be characterised by the emulsion droplet size and the energy input. Here, we want to obtain a deeper insight into the sequence of hydrodynamic events leading to emulsification. This will be achieved by studying the interaction between a cavitation bubble and a droplet in well-controlled experiments with a single bubble and a single droplet. The ability to precisely regulate the key parameters such as the location of the bubble, its maximum diameter and the time of its inception is vital to reveal the intricate bubble–droplet dynamics. To attain such flexibility and experimental precision, nanosecond pulsed lasers offer a convenient method to generate cavitation bubbles inside a liquid with good control of location and time. For instance, laser-induced bubble generation and its dynamics near a wall have been thoroughly investigated (Tomita et al. Reference Tomita, Robinson, Tong and Blake2002; Lindau & Lauterborn Reference Lindau and Lauterborn2003; Dijkink & Ohl Reference Dijkink and Ohl2008). This flexibility in nucleating cavitation bubbles at specific locations inside a liquid has been used previously to investigate droplet fragmentation. Thoroddsen et al. (Reference Thoroddsen, Takehara, Etoh and Ohl2009) studied the evolution of a cylindrical liquid sheet and spray when a laser is focused below the free surface of a hemispherical droplet. The structure of sheet rupture was found to be similar to the crown structure observed in droplet impact scenarios. The fragmentation dynamics of acoustically levitated water droplets, when irradiated with a laser pulse, was studied by Avila & Ohl (Reference Avila and Ohl2016). They identified three distinct fragmentation scenarios: rapid atomisation, sheet formation and coarse fragmentation. Owing to the substantially short time scales through which the laser-induced nucleation of a cavitation bubble occurs, the fragmentation dynamics of droplets in free fall by laser pulses has been investigated (Gelderblom et al. Reference Gelderblom, Lhuissier, Klein, Bouwhuis, Lohse, Villermaux and Snoeijer2016; Grigoryev et al. Reference Grigoryev2018; Klein et al. Reference Klein, Kurilovich, Lhuissier, Versolato, Lohse, Villermaux and Gelderblom2020).
While most of the works have focused on droplet deformation and breakup dynamics when a laser pulse is irradiated on or in the droplet, the present study investigates the hydrodynamic response of a droplet residing inside another liquid when a laser-induced cavitation bubble is nucleated near its interface. The mechanism of cavitation-induced emulsification has so far been explored only by very few works aiming to address the same. The breakup of millimetre-sized oil droplets in water through ultrasonic cavitation has been recently investigated (Perdih, Zupanc & Dular Reference Perdih, Zupanc and Dular2019). They demonstrated additional intermediate steps for the formation of oil-in-water ( $O/W$) emulsions in which water-in-oil (
 $W/O$) emulsions are formed in the bulk oil phase. These are later separated from the oil phase under the influence of ultrasonic waves and undergo breakdown into
 $O/W$ emulsions. Characteristics of the liquid jet obtained during acoustic cavitation in water/gallium/air and water/silicone oil/air systems were investigated numerically by Yamamoto & Komarov (Reference Yamamoto and Komarov2020). They found that the maximum jet velocity depends on the initial distance between the cavitation bubble and the liquid droplet. Yamamoto, Matsutaka & Komarov (Reference Yamamoto, Matsutaka and Komarov2021) investigated the emulsification process of a water–gallium system using ultrasound irradiation and high-speed imaging. They observed the formation of fine gallium droplets when the maximum radius of the cavitation bubble is large. The emulsification process is initiated during the collapse phase of the cavitation bubble. Further investigations through numerical simulations revealed that the fast-moving liquid jet that forms during the collapse phase of the bubble is responsible for the emulsification. The interaction of cavitation bubbles created by an electrical discharge near a water–oil interface was studied by Han et al. (Reference Han, Zhang, Tan and Li2022). They investigated the interaction dynamics by initiating cavitation bubbles separately in water, oil and at the water–oil interface. Mixing of the fluids was reported when the bubble is initiated at the water–oil interface or in the oil phase below a critical standoff parameter. In addition, the authors identified a secondary emulsification mechanism that occurred due to the formation and pinch-off of an interface jet. Experimental investigation by Orthaber, Zevnik & Dular (Reference Orthaber, Zevnik and Dular2020) further demonstrated these intermediate steps of
 $O/W$ emulsification using laser-induced cavitation bubbles. They attributed the initial jetting of water droplets into the oil medium to primary Bjerknes forces. Later, oil droplets containing large cavitation nuclei enter the bulk water phase due to Rayleigh–Taylor instability. The present situation deviates from these two studies: both of the above-mentioned works start with a cavitation bubble near an oil–water interface visible as a curved line. In the current work, we consider a bubble and a droplet of similar sub-millimetre size. The characteristic length scales of droplet deformation are expected to be similar to that of the collapsing bubble. Therefore, the shear forces created during bubble collapse should lead to vigorous fragmentation and deformation dynamics as they affect the entire droplet. Here we only look into the emulsification of a water-in-oil system. By varying the distance between the bubble and the droplet, the continuous phase viscosity and the size of the cavitation bubble, distinct regimes of interaction are identified. We start with the details of the experimental set-up. We then present the three regimes and subsequently elaborate on each of the regimes using fluid mechanics simulations.
2. Methodology
2.1. Experiment
Figure 1 depicts the central part of the experimental set-up with the droplet dispenser on top and the focusing optics for the laser on the right. The central element is an acrylic cuvette with a square cross-section (1 cm width, 5 cm height) that contains silicone oil (Carl Roth GmbH, Germany) with kinematic viscosities ranging from 5 mm $^2$ s
 $^{-1}$ to 100 mm
 $^2$ s
 $^{-1}$. The water droplets are generated with a dispensing system (BioFluidix, Pipejet toolkit) located above the cuvette. A frequency-doubled Nd:YAG laser (Q2-1064 series, pulse duration 10 ns, wavelength 1064 nm and pulse energy between 0.1 and 1 mJ) is focused into the silicone oil using a microscope objective (Zeiss LD Achroplan 20
 $\times$,
 ${\rm NA} = 0.4,\ \text {focal distance} = 10~{\rm mm}$ ). The bubble is generated to the right of the droplet. By varying the pulse energy, the maximum bubble diameter can be adjusted between 0.95 and 1.7 mm. The laser is triggered once the droplet comes into the field of view of the high-speed camera (AX-Mini 200, Photron) utilising its image trigger functionality. The camera image trigger activates when it detects the change in the image grey levels, starts recording and triggers the laser to fire a single light pulse. The motion of the sinking droplet is sufficiently slow so that the inherent jitter of approximately 25 ms of this triggering technique does not pose a timing problem. The camera is equipped with a macro lens (LAOWA f2.8) with a variable magnification of up to
 $\times$2. It views the dynamics from the same direction as the reader in figure 1. The droplet from the dispensing system can be adjusted in size by varying the shape, amplitude and duration of the current applied. Here we selected parameters to obtain a droplet with a diameter of
 $616 \pm 33\ \mathrm {\mu }$m. Once generated, the droplet impacts on the air–oil interface and slowly sinks into the oil due to gravity. To characterise droplet deformation caused by bubble collapse near its vicinity, we use the elongation parameter
 $E_{l}$. It is defined as the difference between the position of the extreme ends of the droplet along the direction of the line joining the two centres normalised by the initial droplet diameter
 $D_{d}$. The geometric schematic defining this parameter is shown in figure 1(b).
(a) Schematic diagram of the experimental set-up and pertinent geometric parameters of the cavitation-induced microemulsification problem. A droplet of diameter  $D_{d}$ interacts with a bubble whose maximum diameter
 $D_{b}^{max}$ is varied based on the laser energy. The centre-to-centre distance between the bubble and the droplet is denoted by
 $C_{dist}$. (b) Schematic definition of the droplet elongation length (
 $E_{l}\times D_{d}$).

2.2. CFD simulation
Simulations were done using the open-source software OpenFOAM-v2006 (2020). The pressure-based Volume-of-Fluid (VoF) solver multiphaseCompressibleInterFoam for N viscous, compressible, non-isothermal fluid components was modified to suit our purposes. Three components were used to create a numerical representation of the present problem: water, oil and gas representing the bubble contents, i.e. the gas created during the optical breakdown in oil. The component interfaces are modelled using a phase fraction approach, meaning that each component is assigned a field called  $\alpha _i$, which specifies how much of a given cell is filled with that fluid. Each cell of the domain is filled completely with fluid. This demands that the sum of all
 $\alpha _i$ is 1. To model the fluid compressibility, the Tait equation of state (Tait Eos) was used:
 \begin{equation} p=(p_0+B)\left(\frac{\rho}{\rho_0}\right)^\gamma-B.\end{equation}
For  $B=0$, the Tait EoS gets reduced to the ideal-gas EoS. Table 1 shows the parameters used for the different fluid components.
Physical parameters of the different fluid components used in the numerical simulations.

Several modifications from the base solver have been made: the temperature field is omitted for simplicity. The compressibility field  $\kappa =({1}/{\rho })({\partial \rho }/{\partial p})={1}/{\gamma (p+B)}$ for each fluid is calculated in every time step, instead of only once at the beginning of the simulation. This is necessary since a cavitation bubble changes its internal pressure and density over several orders of magnitude, which significantly changes the compressibility. We correct the
 $\alpha$-field to counteract the emergence of small bubbles throughout the domain as a result of numerical errors. This is done by clamping all
 $\alpha$ values below 0.001 (above 0.999) to 0 (1). Furthermore, a correction was introduced to keep the bubble mass
 $m=\sum _i^{cells}\alpha _{{air},i} V_i \rho _{{air},i}$ constant, since the model does not include any phase transitions and all changes to the amount of vapour present in the bubble stem from numerical errors. Apart from the cavitation process itself, significant phase transitions do happen in the experiments, mainly the partial condensation of the bubble contents, which decreases the bubble pressure and thus reduces the bubble size over time. For this reason, once the bubble reaches its first volume maximum, a one-time correction is applied which reduces the bubble pressure by a factor (0.35), which was chosen to fit the bubble size in the second oscillation period to the experiments. This correction accounts for the condensable gas that drives the initial expansion, yet later condenses, and leads to a smaller size for the subsequent oscillation periods.
The problem is modelled with axisymmetry. The axis of symmetry is the line that connects the centres of the bubble and the droplet. The simulation geometry is a thin slice of a cylinder with a radius of 5 mm and a height of 10 mm. The outer boundary conditions are chosen to be open, wave-transmissive boundaries to mimic a larger fluid domain. This geometry is divided into square cells with a width of 40 $\ \mathrm {\mu }$m. Close to the bubble and the droplet, the mesh is refined by successively splitting the cells into four so that a cell width of 2.5
 $\ \mathrm {\mu }$m is reached. Initially, the bubble is at rest and contains a high-pressure gas of
 $p\approx 16$ kBar, which is chosen so that the gas density is equal to the density of the surrounding oil. This is similar to a laser-created bubble, using the assumption that the oil absorbs the energy of the laser pulse much faster than the created bubble seed expands. We smear out the bubble–oil interface to reduce Rayleigh–Taylor instabilities that would otherwise appear during early bubble expansion. In the experiments, the distribution of the energy deposited by the laser is expected to be spread around the point of focus, according to the local laser wave energy density. Thus, just after the energy position, instead of a bubble with a sharp interface, we assume a gradual transition from the liquid to a supercritical fluid to a plasma, having the same effect of mitigating Rayleigh–Taylor instabilities that could form on the later bubble surface.
3. Results
We now discuss the events that occur when a single laser-induced bubble inside silicone oil undergoes multiple cycles of expansion and collapse next to a water droplet. We begin by presenting an overview of three distinct regimes, followed by detailed investigations of each regime.
3.1. Overview of the identified regimes
In the experiments, the maximum diameter of the cavitation bubble ( $D_{b}^{max}$), the centre-to-centre distance between the droplet and the laser focus (
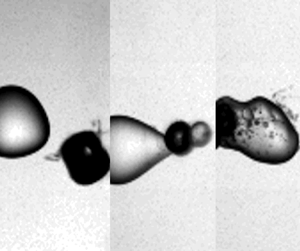
 $C_{dist}$), and the viscosity of the oil are varied. From 106 experiments conducted, recorded and analysed, we can categorise three distinct regimes with typical examples presented in figure 2. These three regimes are the deformation of the droplet by the flow induced by the oscillating cavitation bubble (figure 2a), the ejection of liquid from the droplet into the continuous phase (figure 2b) and the injection of the continuous phase into the droplet (figure 2c). For the latter two processes, we introduce the terms external emulsification and internal emulsification, respectively. In the deformation regime, a bubble collapses near the droplet without interfacial destabilisation that may result in fragmentation or injection of liquid. However, the droplet loses its spherical shape due to the flow created by multiple bubble expansions and rebounds, while the bubble and the droplet remain separated by the continuous phase. After undergoing multiple shape oscillations, the droplet slowly returns back to its spherical shape, see
 $t=2$ ms, the bubble however has fragmented into a number of smaller bubbles. These contain non-condensable carbon-based gases that are created during the laser-induced optical breakdown in the oil.
Three main regimes of interaction are identified when a laser-produced silicone oil vapour bubble collapses near a water–micro-droplet interface: (a) deformation; (b) internal emulsification and (c) external emulsification.

The events leading to the external emulsification regime are distinguished from the deformation regime by an initial physical contact between the bubble and the droplet during the first cycle of expansion, see figure 2(b). As the bubble undergoes its first collapse, the part of the droplet interface which was in contact with the bubble transforms into a protruding ligament pointing outwards into the silicone oil. As time proceeds, the bubble continues to oscillate on this structure resulting in a breakup of this ligament and the formation of a satellite water droplet in the oil.
Parallel to the first cycle of external emulsification, during internal emulsification, the bubble is physically in contact with the droplet as it reaches its maximum radius, see figure 2(c). However, we notice that during the successive collapses and expansions, the bubble penetrates into the droplet. These events lead to the formation of a thick destabilised interfacial region, as observed during the collapse in the third cycle, see figure 2(c). The shearing of this interfacial region and the later expansions and collapses of the bubble result in the formation of an oil-in-water emulsion.
We will now look closer into each of these regimes.
3.2. Deformation regime
Even if there is no contact between the bubble and the droplet, the flow created by the bubble deforms the droplet. Selected snapshots of this bubble–droplet interaction are shown in figure 3 where the frame before the bubble is first seen is defined as time  $t=0$. In figure 3, a single bubble is created in the silicone oil with 20 mm
 $^2$ s
 $^{-1}$ viscosity at a distance
 $C_{dist}=0.91$ mm. During early expansion,
 $t=4.6\ \mathrm {\mu }$s, the bubble is initially elongated due to imperfection of the laser focus, yet at
 $t=63\ \mathrm {\mu }$m, the bubble has expanded to an approximate sphere with a diameter of
 $D_{b}=1.58\ {\rm mm} \pm 33\ \mathrm {\mu }{\rm m}$. The bubble expansion results in a flattening of the droplet on the side facing the bubble. To visualise the extent of droplet deformation and translation, the shape of the droplet before bubble generation is superimposed on the photograph as a dashed curve. During the first bubble collapse at
 $t=125\ \mathrm {\mu }$s, the droplet regains its spherical shape and translates back to its original location. The droplet is flattened again as the bubble undergoes a second expansion, though the deformation is considerably weaker.
(a) Comparison between experiments and numerical simulations illustrating the evolution of the deformation regime. (b) Temporal evolution of the droplet interaction with the collapsing bubble at later times illustrating directional deformation of the droplet towards the oscillating bubble. The diameter of the droplet is  $616\ \mathrm {\mu }{\rm m} \pm 33\ \mathrm {\mu }{\rm m}$ and the video was recorded at 216 000 frames per second. The frame before the first appearance of the bubble is defined as time
 $t= 0$. The maximum bubble diameter is 1583
 $\ \mathrm {\mu }$m which is generated in silicone oil with 20 mm
 $^2$ s
 $^{-1}$ viscosity. The centre-to-centre distance between the bubble and the droplet is 910
 $\ \mathrm {\mu }$m. The sketch of a dashed circle on all the frames represents the droplet shape before the generation of the laser bubble.

A comparison of the experimental images with interfaces obtained from numerical simulations is shown in the second row of figure 3(a). Note that the simulation is axisymmetric and the axis of symmetry is horizontal, while in the experiments, it is under some angle. Overall, a good qualitative agreement between the simulation and the experiment is obtained, especially for the first two cycles of bubble oscillation. The shape of the deformed droplet during primary and secondary expansion matches with the corresponding frames observed experimentally. Similarly, relaxation of the droplet shape to a spherical configuration is noted at  $t=125\ \mathrm {\mu }$s in both situations. At the time
 $t=300\ \mathrm {\mu }$s, the bubble collapses a second time, now showing clear surface instabilities, see figure 3(b), and the droplet is elongated in the direction towards the bubble's centre. As time proceeds and the bubble undergoes subsequent cycles of expansion and collapse, the droplet regains its original spherical configuration. Yet the droplet has translated towards the bubble. It should be noted that the axisymmetric assumption employed in the numerical model holds well for the first two cycles of bubble expansion and collapse. During this time, as can be seen from figure 3(a), the bubble dynamics are approximately axisymmetric. However, in later cycles, the bubble shows surface instabilities and undergoes jetting along non-axial directions. It also breaks down into smaller bubbles. Therefore, for later times, the scenario is no longer axisymmetric and the axisymmetric boundary condition would show deviations from the experimental results.
As the bubble expands and collapses, it acts as a flow source and sink that compresses and elongates the droplet, respectively. We compare the deformation  $E_{l}(t)$ between the experiment and the numerical simulation in figure 4(a). The centre-to-centre distance and the maximum bubble diameter considered here are
 $C_{dist}=1003\ \mathrm {\mu }$m and
 $D_{b}=1.58\ {\rm mm} \pm 33\ \mathrm {\mu }$m, respectively. We see a continuous increase of the droplet elongation until the full expansion of the bubble and a return to a spherical shape during the first bubble collapse at
 $t=125\ \mathrm {\mu }$s. For this analysis, we used a high-speed recording at a lower magnification compared to the close-up frames shown in figure 3 that captures the bubble and droplet in full. Overall, the experimental droplet deformation during the primary and secondary bubble expansion shows a good agreement with the simulation.
Droplet elongation parameter ( $E_{l}$) along the direction of bubble collapse. (a) Comparison between the experimental and numerical temporal evolution of
 $E_{l}$ in 20 mm
 $^2$ s
 $^{-1}$ silicone oil (
 $C_{dist}=1003\ \mathrm {\mu }$m,
 $D_{b}^{max} = 1.58$ mm). (b) Temporal evolution of
 $E_{l}$ for three different cases of varying
 $C_{dist}$ and
 $D_{b}^{max}$ with an oil viscosity of
 $20\ {\rm mm}^2$ s
 $^{-1}$. (c) Effect of viscosity on the droplet elongation with the following parameters: 5 mm
 $^2$ s
 $^{-1} - C_{dist} = 819\ \mathrm {\mu }$m,
 $D_{b}^{max} = 1.45$ mm; 20 mm
 $^2$ s
 $^{-1} - C_{dist}$ = 771
 $\ \mathrm {\mu }$m,
 $D_{b}^{max} = 1.33$ mm; 100 mm
 $^2$ s
 $^{-1} - C_{dist}$ = 883
 $\ \mathrm {\mu }$m,
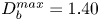 $D_{b}^{max} = 1.40$ mm.

The magnitude of the velocity field generated in the surrounding flow depends on the amplitude and the frequency of the bubble oscillation, which is governed by the value of  $D_{b}^{max}$. Similarly,
 $C_{dist}$ determines the extent to which the surrounding flow field incurs deviations in the droplet's sphericity. Figure 4(b) illustrates the temporal evolution of
 $E_{l}(t)$ for the first few cycles of bubble oscillation in silicone oil with 20 mm
 $^2$ s
 $^{-1}$ viscosity. Three cases with different
 $C_{dist}$ and
 $D_{b}^{max}$ are selected. All cases reveal an initial dip of
 $E_{l}$ during the bubble expansion and recovery during the bubble collapse. A variation of the magnitude and damping of the oscillations of
 $E_{l}(t)$ is clearly observed. Generally, a smaller bubble results in a faster decay of the droplet's surface oscillation and a smaller elongation during primary bubble expansion. For example, for the first case with lowest
 $D_{b}^{max}$ and relatively large
 $C_{dist}$ of
 $963\ \mathrm {\mu }$m, we observe that after the primary dip, the oscillations in
 $E_{l}$ cease quickly. In contrast, the largest amplitude in
 $E_{l}$ is found for a combination of a large bubble and a small distance, i.e.
 $C_{dist} = 771\ \mathrm {\mu }$m and
 $D_{b}^{max} = 1333\ \mathrm {\mu }$m. It is to be noted that even though the maximum bubble diameter considered in this case is lower than the third case with
 $D_{b}^{max} = 1583\ \mathrm {\mu }$m, the maximum elongation is considerably higher than in the other two cases. The deformation also lasts longer for this case than for the other two cases. For the case with
 $C_{dist} = 771\ \mathrm {\mu }$m and
 $D_{b}^{max} = 1333\ \mathrm {\mu }$m, we notice a consistent overshoot in the value of
 $E_{l}$ above 1.0 after the first cycle, signifying that the droplet is being pulled and elongated towards the bubble centre.
The effect of viscosity is demonstrated in figure 4(c), with roughly constant parameters  $C_{dist}$ and
 $D_{b}^{max}$. Both the cases with lower viscosity sustain the oscillatory behaviour in the temporal evolution of
 $E_{l}$. However, for the case with 100 mm
 $^2$ s
 $^{-1}$, we notice stronger damping of the droplet oscillation, as expected.
3.3. External emulsification
In figure 5(a), the bubble is generated closer to the droplet surface with a centre-to-centre distance of 335 $\ \mathrm {\mu }$m. Here the viscosity of the silicone oil is rather high at 100 mm
 $^2$ s
 $^{-1}$ and the applied laser energy generates a bubble with a maximum diameter of 1116
 $\ \mathrm {\mu }$m. Similar to the initial phase in the deformation regime, the droplet flattens on the bubble proximate side during the first expansion. Due to the proximity of the bubble, the droplet becomes crescent-shaped, see
 $t=51\ \mathrm {\mu }$s in figure 5(a) top row. An additional difference as compared to the deformation regime is that during the bubble collapse, only on the bubble distant side, the water droplet regains its spherical shape. The bubble-facing part of the droplet develops an edge as a result of the disturbed and now non-spherical converging flow field,
 $t=97\ \mathrm {\mu }$s. The frame
 $t=157\ \mathrm {\mu }$s in figure 5(a) top row shows the droplet during the second bubble collapse. Between the first and second collapse, the bubble has translated towards the right and pulled the right part of the droplet towards itself, forming a conical shape. Collapsing and translating bubbles are known to develop jets (Benjamin & Ellis Reference Benjamin and Ellis1966). Upon close inspection, one can see a fine protrusion of the droplet pointing out of the right side of the bubble indicated with an arrow in figure 5(a) top row at
 $t=157\ \mathrm {\mu }$s. This protrusion is the result of a thin water jet flow formed during the first bubble collapse. Numerical simulations of the flow allow a look into the bubble. The frames in the lower row of figure 5(a) depict the surfaces of the bubble and the droplet, yet some transparency for the rendering of the bubble offers a peek inside. We already notice the formation of a jet during the first bubble collapse in frame
 $t=98\ \mathrm {\mu }$s. This jet however has not penetrated the opposite side of the bubble and therefore only becomes visible during the second collapse
 $t=158\ \mathrm {\mu }$s.
(a) Comparison of selected frames between experiments and numerical simulations illustrating the evolution of external emulsification. (b) Temporal evolution of the droplet interaction with the collapsing bubble at later time frames illustrates the formation of a water-in-oil emulsion. The diameter of the droplet is 616 $\ \mathrm {\mu }$m. The maximum bubble diameter is 1.11 mm, which is generated in silicone oil with 100 mm
 $^2$ s
 $^{-1}$ viscosity. The centre-to-centre distance between the bubble and the droplet is
 $335\ \mathrm {\mu }$m.

Figure 5(b) shows that over the course of nearly 2 ms, a satellite droplet is drawn from the main water droplet. Early on at  $t=203\ \mathrm {\mu }$s, the bubble collapses a third time during which a thicker liquid filament becomes visible. The bubble continues to undergo subsequent oscillations, albeit at a diminishing amplitude, and from
 $t=374\ \mathrm {\mu }$s, the thick droplet filament gradually grows in size. At
 $t = 532\ \mathrm {\mu }$s, the transformation of the jet tip into a satellite droplet is clearly visible. With the bubble undergoing weaker oscillations, the satellite droplet stops growing leading to the detachment of the satellite droplet from the parent drop. At
 $t = 717\ \mathrm {\mu }$s, the shape of the parent droplet consists of a spherical base and a conical-shaped connecting neck which links to the satellite droplet through the oscillating bubble. Eventually, as the parent droplet relaxes to regain its spherical configuration, a pinch-off of the connecting neck occurs and the satellite droplet is detached. The result of this process is the formation of the water-in-oil emulsion shown at
 $t = 1.96$ ms.
To investigate the mechanism of external emulsification, we show the simulated bubble's interface during the first oscillation cycle at different times in figure 6(a). The direction of the bubble's radial displacement is indicated by the dashed arrow. After the nucleation of the bubble inside the oil, it expands radially and contacts the water droplet. The left part of the bubble surface displaces the oil and thereby forms a water–gas interface. During the expansion phase of the bubble, it is almost spherical. Upon close inspection, the shape of the bubble at maximum expansion is that of two half-spheres with very similar radii of curvature of approximately  $R_{max}=580\ \mathrm {\mu }$m, and their centres are separated by some small distance. A similar behaviour is also reported by Han et al. (Reference Han, Zhang, Tan and Li2022) who proposed an extended Rayleigh–Plesset model to study the dynamics of a bubble initiated at a water–oil interface. During the expansion phase, they observed spherical expansion of the upper half and the lower half of the bubble. During bubble shrinkage, the part of the bubble making contact with the water droplet shrinks faster than the part in contact with oil. The bubble also loses its spherical shape and becomes oval with the longer semi-axis in the radial direction, i.e. at
 $t=92\ \mathrm {\mu }$s in figure 6(a). At
 $t=94\ \mathrm {\mu }$s, an indentation in the bubble surface is observed that develops into a jet directed towards the oil phase,
 $t=96\ \mathrm {\mu }$s. At that time, the bubble part in oil has not yet undergone collapse.
(a) Interface profile of the cavitation bubble during its primary expansion (top) and collapse phase (bottom) taken from the simulation in figure 5. The top part shows the bubble expansion (oil on the left and water on the right) and the lower part the primary bubble collapse. (b) Simulation of a collapsing bubble via the Rayleigh–Plesset equation (A1) in different environments with  $R_{max}(t=44\ \mathrm {\mu }{\rm s})=580\ \mathrm {\mu }$m. The parameters are
 $\mu =1\ {\rm mPa}\ {\rm s}$ and
 $\rho =1000\ {\rm kg}\ {\rm m}^{-3}$ for water, and
 $\mu =100\ {\rm mPa}\ {\rm s}$ and
 $\rho =900\ {\rm kg}\ {\rm m}^{-3}$ for oil, the initial thickness of the oil layer at time
 $t=44\ \mathrm {\mu }$s is
 $40\ \mathrm {\mu }$m.

It is instructive to study the spherical problem of a bubble collapsing in water, in oil and in a droplet of water surrounded by oil. While the first two problems can be solved with the well-known Rayleigh–Plesset model (Brennen Reference Brennen2014), a derivation of the equation of motion for a bubble surrounded by two liquids of different density and viscosity is provided in the Appendix. This derivation follows a model by Church (Reference Church1995) for coated bubbles used in medical diagnostics. Ignoring viscosity, a bubble collapsing in the less dense oil would collapse faster than in water. Yet, the normal viscous stresses oppose the pressure forces and delay the collapse. Let us now compare these two cases of the collapse shown in figure 6(b), where the blue curve is a bubble in oil and the red curve a bubble in water. The initial size of  $R_{max}=580\ \mathrm {\mu }$m is taken from the maximum bubble radius at time
 $t=44\ \mathrm {\mu }$s in figure 6(a). For this viscosity, the bubble collapses later in oil, i.e. the viscous stresses in oil are dominating the higher inertia of water. Yet, the bubble in the experiment is not oscillating in bulk water but only surrounded by a layer of water in the continuous oil phase. We abstract the complex crescent shape of the water layer in the experiment with a concentric shell of oil. This situation is shown in figure 6(b) as a black curve. The initial thickness of the water layer at maximum expansion is
 $40\ \mathrm {\mu }$m. The bubble now experiences lower inertia than water and less viscous stresses than oil. As a result, the bubble covered with a thin layer of water collapses approximately
 $5\ \mathrm {\mu }$s earlier than the same bubble in oil, and approximately
 $3\ \mathrm {\mu }$s earlier than in water. This faster collapse of the water-covered part of the bubble gives an initial clue why eventually a jet flow develops from the water phase towards the continuous oil phase. In reality, the water layer is not a concentric shell and it is expected that the varying thickness of the layer contributes to the jet formation too.
Figure 7 depicts the bubble's and the droplet's interfaces during the primary expansion and collapse phases, the liquid velocity magnitude via a colour scale, and the direction of the velocity field with arrows. At  $t=36\ \mathrm {\mu }$s, the bubble reaches its first maximum expansion. The magnitude of the velocity along the bubble–water interface is almost constant. From
 $t=48\ \mathrm {\mu }$s, the velocity field on the left part of the bubble, i.e. the side in contact with oil, has changed direction and the bubble starts to shrink. This is in contrast to the bubble–water interface where the bubble still expands and a non-uniform velocity distribution with a stagnation point at the central region is visible. Thus, the left part of the bubble is expanding slower in water than in oil. The magnitude of the velocity depends on the thickness of the water layer: along the thinner regions of the droplet, the direction of the velocity vectors indicates an inward flow while the thicker central water layer is approximately stationary. This leads to the formation of an oval-shaped bubble–water interface, see
 $t=88\ \mathrm {\mu }$s in figure 7. As discussed in the solution of theRayleigh–Plesset equation for a bubble surrounded by two liquids in figure 6(b), the presence of a thin water layer leads to lower viscous stress than in bulk oil. This in turn leads to a faster bubble collapse. It is instructive to note that the thickness of the water layer covering the bubble–water interface is a significant parameter. It controls the degree to which the water layer dampens the influence of viscous stresses exerted by the surrounding 100 mm
 $^2$ s
 $^{-1}$ silicone oil. As the bubble continues to collapse, the thickness of the water layer covering the central portion of the bubble–water interface increases. Therefore, a sharp rise in velocity magnitude is observed in the central portion of the bubble–water interface between
 $t = 92\ \mathrm {\mu }$s and
 $t=\ 94\ \mathrm {\mu }$s. We notice the formation of an indentation into the bubble at the axis of symmetry at
 $t=94\ \mathrm {\mu }$s. At the same time, the higher viscous stresses exerted on the bubble–oil interface counteract its radially inward motion. The non-spherical bubble collapse and subsequent expansion accelerate this indentation into a jetting flow clearly visible at
 $t=96\ \mathrm {\mu }$s. As a result, the jetting flow transports some of the water from the droplet into the oil phase.
Numerically obtained interfacial profiles of the droplet and bubble showing the process of the initial jet formation. The velocity field shown in the liquid is coloured by the velocity magnitude.

Figure 8 reveals the second stage of the emulsification process, which starts with the re-expansion of the bubble. Then the jet is stretched and remains entrained within the bubble, see  $t=104 \ldots 144\ \mathrm {\mu }$s in figure 8. During the second collapse phase,
 $t=156\ \mathrm {\mu }$s, the jet eventually penetrates the opposite bubble wall. Simultaneously, the bubble similar to the first collapse shrinks faster on the waterside, resulting in a second jetting from the water to the oil. This flow is nicely visible during the third bubble expansion at
 $t=170\ \mathrm {\mu }$s in figure 8. Here, as in the experiments, we see that the non-spherical bubble oscillation with jetting from the water droplet into the oil results in the formation of a satellite droplet. Over time, the amplitude of the oscillation diminishes and the filament connecting the main droplet with the satellite droplet splits due to the Rayleigh–Plateau instability.
Numerically obtained temporal evolution of the interface profiles illustrating the process of the external emulsification mechanism. The colour map shows the magnitude of the velocity field in the oil.

3.4. Internal emulsification
Figure 9 illustrates the temporal sequence of the internal emulsification regime. In this example, the bubble is generated in silicone oil with a viscosity of 5 mm $^2$ s
 $^{-1}$. Again, the bubble (
 $D_{b}=1283\ \mathrm {\mu }$m) is created at a small distance of
 $C_{dist}=464\ \mathrm {\mu }$m near a droplet of
 $D_{d}=616\ \mathrm {\mu }$m. Similar to the external emulsification regime, the bubble makes contact with the droplet during its first expansion. A deviation in the dynamics from the external emulsification arises at the end of the first collapse as the bubble begins to jet into the droplet. After the first collapse,
 $t = 102\ \mathrm {\mu }$s, the bubble re-expands with nearly half of its surface covered by the droplet, as shown at
 $t= 148\ \mathrm {\mu }$s. We also notice the injection of tiny bubbles from the main bubble into the droplet. The bubble translates towards the water droplet and during its second collapse, it becomes fully encapsulated in the droplet,
 $t= 171\ \mathrm {\mu }$s. A distinct feature at this time is the toroidal rim or lamella of water on the right side of the droplet. During the re-expansion of the bubble within the droplet, we notice the entrainment of tiny oil drops into the water droplet emerging from the bubble's front at
 $t= 212\ \mathrm {\mu }$s. This is in contrast to the external emulsification scenario where the dispersed phase is injected into the continuous phase. During bubble collapse at
 $t= 226\ \mathrm {\mu }$s, these oil droplets are stretched by the radial flow and thereby fragment into smaller droplets due to the Rayleigh–Plateau instability. Simultaneously, the expansion and contraction of the lamella occur on the opposite side of the bubble. Also during bubble collapse,
 $t= 226\ \mathrm {\mu }$s, a finger-like structure of oil is injected from the lamella into the droplet, see
 $t = 282\ \mathrm {\mu }$s. That is likely caused by the translation of the bubble to the left. Over the next couple of bubble oscillations, the bubble moves further to the left and eventually leaves the droplet. The flow induced by the bubble translation stretches the oil finger. At
 $t = 490\ \mathrm {\mu }$s, this structure breaks at the location indicated as the oil finger neck, likely due to the Rayleigh–Plateau instability. As a result, two larger oil droplets are now suspended inside the water droplet, see
 $t=680\ \mathrm {\mu }$s. Through this entire process, an oil-in-water emulsion is formed where the large droplets are due to destabilisation of the entrained column of oil, the oil finger, that is stretched by the translating bubble. In contrast, the fine emulsion is formed due to radial stretching from the translating bubble front. At this point, it is important to comment on the long-term fate of the engulfed gas bubbles inside the droplet during internal emulsification. The entire process of internal emulsification occurs within approximately two milliseconds. At such small time scales, we have observed that the bubbles still remain inside the droplet. However, the engulfed bubbles eventually move into the oil at later times (within a few seconds) due to buoyancy and some get dissolved. We have not observed any entrapped bubbles inside the water droplets in the cuvette at later times.
Internal emulsification regime with maximum bubble diameter of 1.28 mm in silicone oil with 5 mm $^2$ s
 $^{-1}$ viscosity. The centre-to-centre distance between the bubble and the droplet is
 $464\ \mathrm {\mu }$m and the droplet diameter is
 $616\ \mathrm {\mu }$m.

To investigate the mechanism leading to the oil-in-water emulsion as compared to the previously observed water-in-oil emulsion, we perform axisymmetric simulations with the experimental parameters taken from figure 9. The temporal evolution of the flow field and the fluid interfaces is illustrated in figure 10. In the simulation, the bubble reaches its maximum expansion at  $t= 50\ \mathrm {\mu }$s similar to the experiment. At
 $t= 108\ \mathrm {\mu }$s, we observe jetting of the bubble into the droplet at the end of the first collapse. Similar jetting of the bubble into the droplet at the end of the first collapse is also noticed in figure 2(c). Unlike the external emulsification scenario, the inertial forces exerted on the bubble dominate the viscous stresses. Therefore, the bubble jets into the denser water droplet at the end of its first collapse. The bubble proceeds to undergo a secondary expansion and attains its maximum radius in this cycle at
 $t= 148\ \mathrm {\mu }$s. At this time, we notice a tiny bubble fragment transported into the droplet. This matches well with the experimental observation showing the entrainment of bubble fragments just ahead of the bubble into the droplet at
 $t=148\ \mathrm {\mu }$s in figure 9. Nearly complete encapsulation of the bubble inside the droplet is found at
 $t= 190\ \mathrm {\mu }$s. Bubble encapsulation during the second collapse is observed in the experiments as well at
 $t= 171\ \mathrm {\mu }$s. The bubble continues to jet into the droplet as it undergoes multiple cycles of expansion and collapse. This internal bubble jetting creates a pathway for the entrainment of oil inside the droplet. At
 $t= 328\ \mathrm {\mu }$s, we observe entrainment of oil inside the droplet which leads to the formation of the oil finger.
Numerically obtained temporal evolution of the interface profiles illustrating the process of the internal emulsification mechanism. The colour map shows the magnitude of the velocity field in the oil. The simulation parameters are chosen to correspond to the experimental case shown in figure 9.

Clearly, the viscosity of the continuous medium is a critical parameter that decides between the regimes of external and internal emulsification.
3.5. Regimes
After examining 106 experiments, we could identify that the interaction between the cavitation bubble and the water droplet is most sensitive to the distance  $C_{dist}$ and the viscosity of the fluid. For consistency, the regime is observed during the first two oscillation periods of the bubble. If emulsification does not occur during these first two cycles, the case is categorised as deformation. In the experiments, we have varied the bubble diameter between 950
 $\mathrm {\mu }$m and 1733
 $\mathrm {\mu }$m, the distance
 $C_{dist}$ between 330
 $\mathrm {\mu }$m and 1123
 $\mathrm {\mu }$m, and the viscosity between 5 mm
 $^2$ s
 $^{-1}$ and 100 mm
 $^2$ s
 $^{-1}$. The droplet diameter was fixed in all experiments, i.e.
 $D_{d}=616\ \mathrm {\mu }{\rm m} \pm 33\ \mathrm {\mu }{\rm m}$.
For small kinematic viscosities of the continuous phase, i.e. for  $\nu \leq 20$ mm
 $^2$ s
 $^{-1}$, only deformation or internal emulsification are found. In this case, the dynamics is mostly determined by the centre-to-centre distance. An example for
 $\nu =5$ mm
 $^2$ s
 $^{-1}$ is depicted in figure 11(a). Above a value of
 $C_{dist}\approx 650\ \mathrm {\mu }$m, only the deformation regime is observed, while internal emulsification is dominant below this distance. This value is slightly larger than the droplet diameter, i.e. the bubble at maximum expansion forms a large contact area with the droplet. As a result, upon collapse, the bubble jets into the droplet. At such a low viscosity, the inertia-dominated internal emulsification is the only emulsification regime observed.
Regime map obtained between (a) centre-to-centre distance  $C_{dist}$ and maximum bubble diameter
 $D_{max}^{b}$ for silicone oil with viscosity 5 mm
 $^2$ s
 $^{-1}$, (b)
 $\zeta$ and
 $C_{dist}$/
 $D^{max}_{b}$ at
 $D_{d}=616 \pm 33\ \mathrm {\mu }$m (experiments), (c)
 $D_{d}=340\ \mathrm {\mu }$m (simulations), (d)
 $D_{d}=980\ \mathrm {\mu }$m (simulations) for viscosities in the range between
 $5$ mm
 $^2$ s
 $^{-1}$ and
 $100$ mm
 $^2$ s
 $^{-1}$. The regime map illustrates the three different regimes of micro emulsification: (i) deformation (
 $\diamond$), (ii) internal emulsification (
 $\bigtriangleup$) and (iii) external emulsification (
 $\bigcirc$).

For higher viscosities, we observe a transition from the internal to the external emulsification regime. Therefore, it is instructive to look into the role of the two predominant forces acting on the cavitation bubble. Naturally, these are the inertial stress (Brennen Reference Brennen2014) given by
 \begin{equation} \tau_{in}=\tfrac{3}{2}\rho_{oil} \dot{R_{b}}^2,\end{equation}
and the viscous stress
 \begin{equation} \tau_{vis}= 4 \nu \rho_{oil} \frac{\dot{R_{b}}}{R_{b}}.\end{equation}
Let us identify the velocity  $\dot {R_{b}}$ with an average velocity of the bubble wall,
 $\langle \dot {R_{b}}\rangle$, that can be obtained from the maximum bubble radius (
 $R_{b}^{max}$) and the Rayleigh collapse time (
 $T_c^{Rayleigh}$) (Rayleigh Reference Rayleigh1917) while ignoring viscosity:
 $$\begin{gather} T_{c}^{Rayleigh} = 0.91468~R_{b}^{max} \sqrt{\frac{\rho_{oil}}{P_{a}}}, \end{gather}$$
 $$\begin{gather}\langle\dot{R_{b}}\rangle= \frac{R_{b}^{max}}{T_{c}^{Rayleigh}} \approx 1.09\sqrt{\frac{P_{a}}{\rho_{oil}}}, \end{gather}$$
where  $P_{a}$ is the ambient pressure taken as
 $10^{5}$ Pa. Then the ratio of the inertial to viscous stresses is defined as
 \begin{equation} \zeta = \frac{\tau_{vis}}{\tau_{in}} \approx 4.88 \frac{\nu}{D^{max}_{b}}\sqrt{\frac{\rho_{oil}}{P_{a}}}. \end{equation}
The number  $\zeta$ can be considered a cavitation Reynolds number. Please note that the viscosity of the droplet is ignored in this formulation.
Figure 11(b) presents a parameter plot of the cavitation Reynolds number  $\zeta$ as a function of the non-dimensional distance
 $C_{dist}/D_{max}^{b}$ that covers all experiments between
 $5$ mm
 $^2$ s
 $^{-1}$ and
 $100$ mm
 $^2$ s
 $^{-1}$. We notice that around a value of
 $C_{dist}/D_{max}^{b} \approx 0.4$, the bubble–droplet interaction is split between emulsification and deformation, i.e. for distances
 $C_{dist}/D_{max}^{b} \lesssim 0.4$, emulsification is predominantly observed. Notice here the overlap between deformation and internal emulsification near the transition boundary. To be consistent, we have considered only the first two cycles of bubble oscillation to categorise our regimes. In certain cases, we have noticed internal emulsification after the first two cycles. However, based on our criterion to be consistent in defining
 $\zeta$, we have categorised these cases as deformation. Since the first expansion of the bubble is approximately spherical, we can define
 $\zeta$ using its first maximum diameter
 $D_{max}^{b}$. The emulsification regime is additionally split into external and internal emulsification. This is because the direction of the jet depends on whether the forces counteracting the bubble collapse are dominated by viscosity (large
 $\zeta$, jetting away from the droplet, external emulsification) or inertia (small
 $\zeta$, jetting towards the droplet, internal emulsification). It should be noted that the transition boundary between internal and external emulsification lies somewhere between
 $\zeta =0.03$ and
 $0.06$. As we consider a fixed size of droplet diameter, the transition boundary is determined by the ratio of oil viscosity and maximum bubble diameter.
We now look into the role of the droplet diameter in the position of the transition boundary between the deformation and emulsification regimes. Figures 11(c) and 11(d) illustrate the regime maps obtained from numerical simulations for  $D_{d}=340\ \mathrm {\mu }$m and 980
 $\mathrm {\mu }$m, respectively. It is to be noted that
 $D_{d}=616 \pm 33\ \mathrm {\mu }$m for the experimental regime map shown in figure 11(b). When
 $D_{d}$ is decreased to nearly half of this value in figure 11(c), we notice that the transition boundary (
 $C_{dist}/D_{b}^{max}$) shifts from 0.4 to 0.3. Similarly, the transition boundary is found to increase from 0.4 to 0.52 as we increase
 $D_{d}$ to 980
 $\mathrm {\mu }$m. At a given
 $C_{dist}/D^{max}_{b}$, emulsification occurs if the oil–water and oil–gas interfaces come close to each other over a large area, allowing the bubble and the droplet to strongly interact such that a jet is formed. A smaller droplet inhibits this interaction and favours the deformation regime. However, a droplet with a larger diameter facilitates this interaction and promotes emulsification. For example, at
 $C_{dist}/D^{max}_{b}=0.4$, we observe deformation for
 $D_{d}=340\ \mathrm {\mu }$m and emulsification for
 $D_{d}=980\ \mathrm {\mu }$m. Another interesting observation from figures 11(c) and 11(d) is the influence of the droplet on the transition boundary between internal and external emulsification. For
 $D_{d}=340\ \mathrm {\mu }$m, this transition boundary is found for
 $\zeta$ between
 $0.015$ and
 $0.03$, while for
 $D_{d}=980\ \mathrm {\mu }$m, it is found at approximately
 $\zeta =0.04$.
4. Conclusions
We have studied the interaction between water droplets in silicone oil and laser-induced cavitation bubbles that are created near the liquid–liquid interface. From the experiments, we identify three distinct regimes of interaction, namely deformation, external emulsification and internal emulsification. The regimes are sensitive to the maximum bubble diameter  $D_{b}^{max}$, the centre-to-centre distance between the bubble and the droplet
 $C_{dist}$, and the viscosity of the oil
 $\mu$. We observe the deformation regime when the centre-to-centre distance was large. The droplet undergoes flattening and elongation as the cavitation bubble expands and collapses. As the bubble goes through successive cycles of oscillation, it acts as a flow source and sink, leading to a characteristic directional elongation of the droplet towards the bubble centre. For closer distances, the droplet is fragmented, which is primarily caused by a liquid jet formed by the collapsing bubble. The viscosity affects the direction of the jet. High viscosities lead to a jetting into the water droplet, while low viscosities to a jetting into the oil. The former leads to an oil-in-water emulsion (internal emulsification) and the latter to an water-in-oil emulsion (external emulsification). The experimental observations are nicely reproduced by simulations using a three-phase compressible volume of the fluid solver. Particularly, they verify that the decaying rebounds and collapses of the bubble contribute to a continuous transport of the two liquid phases into each other. It is further shown that the three regimes are separated in a parameter plot using the non-dimensional distance and a Reynolds number for cavitation.
The present work looked into the fundamental processes of cavitation bubble-induced emulsification of a low-viscosity droplet into a higher-viscosity liquid. While this was obtained with a laser-generated bubble with diameters in the millimetre range, emulsification based on acoustic cavitation at ultrasound frequencies uses smaller bubbles. We expect that these regimes and their boundaries also hold for ultrasound emulsification, yet this would need to be confirmed. The smaller spatial and shorter temporal scales together with lesser control of the bubble dynamics in acoustic driving add challenges to experiments. Here, simulations using well-tested codes could be a way to understand emulsification from acoustic cavitation.
Funding
K.A.R. and J.M.R acknowledge support by the Alexander von Humboldt Foundation (Germany) through the Humboldt and Georg Forster Research Fellowships. The work was supported in part by the Deutsche Forschungsgemeinschaft (DFG, German Research Foundation) under contract OH 75/4-1.
Declaration of interests
The authors report no conflict of interest.
Appendix A
Church (Reference Church1995) has modelled a spherical bubble shelled with a layer of linear elastic material that is surrounded by a viscous fluid. This model can easily be modified to describe a bubble surrounded by two layers of different viscous fluids by replacing the stresses of the elastic shell with the stresses of the viscous fluid (see figure 12). We start with (5) from Church and replace the stress of the linear elastic solid  $T_{{S},rr}$ with the viscous fluid stress of the shell of liquid 1, i.e.
 $T_{{L}1,rr}=2\mu _1\partial u/\partial r$ and
 $\partial u/\partial r=2\,R^2\,\dot {R}/r^3$. Integrating this expression from the bubble radius
 $R_{b}$ to the shell radius
 $R_{d}$ and keeping all other terms results in the model used for figure 6(b):
 \begin{align} &R_{b}\ddot{R_{b}}\left(1+\frac{\rho_1-\rho_2}{\rho_1}\,\frac{R_{b}}{R_{d}}\right)+\dot{R_{b}}^2 \left(\frac{3}{2}+ \frac{\rho_1-\rho_2}{\rho_1}\, \frac{4\dot{R_{d}}^3-{R_{b}}^3}{2{R_{d}}^3}\, \frac{R_{b}}{R_{d}}\right)\nonumber\\ &\quad = \frac{1}{\rho_1}\left(p_{g}-p_\infty-\frac{2\sigma_1}{R_{b}}-\frac{2\sigma_2}{R_{d}} -4\dot{R_{b}}\left[\frac{\mu_1}{R_{b}}-\frac{{R_{b}}^2}{{R_{d}}^3}\left(\mu_1-\mu_2\right)\right]\right). \end{align}
Schematic representation of an oscillating bubble inside a droplet that is suspended in a continuous phase.

Here, the dynamic viscosity of the droplet is  $\mu _1$ and
 $\mu _2$ for the continuous phase. Similarly, the density of the droplet and the continuous phase are
 $\rho _1$ and
 $\rho _2$, respectively. The surface tension between the gas phase and the droplet phase is
 $\sigma _1$ and the interfacial tension between the droplet and the continuous phase is
 $\sigma _2$. Because the liquid of the droplet is incompressible, the time-dependent droplet radius is a simple function of the bubble radius and the initial radius of the droplet,
 \begin{equation} R_{d}(t)=\sqrt[3]{R_{b}(t)^3+( R_{d}(t=0)-R_{b}(t=0) )^3}. \end{equation}



