


1 Introduction
Microstreaming is a slow mean flow induced by a fast oscillating body. In opposition to acoustic streaming caused by the attenuation of an acoustic wave in the fluid, microstreaming is driven by streaming inside the oscillatory boundary layer around the bubble, the so-called Stokes layer. Nonlinear second-order effects are responsible for extending the streaming patterns much further than the Stokes layer. In this way, outer streaming appears further from a bubble where at leading order, the flow is commonly considered irrotational (Davidson & Riley Reference Davidson and Riley1971).
Microstreaming has first been observed by Kolb & Nyborg (Reference Kolb and Nyborg1956) by placing a bubble on a vibrating tip. Elder (Reference Elder1959) reported on experimental microstreaming observed from the side view around a bubble placed on a boundary and excited by an acoustic wave. The author sketched four different types of streaming patterns and stated that the appearance depends in particular on the bubble surface velocity (through the acoustic amplitude) and the fluid viscosity. The author did not expect to find more than one characteristic regime, but could fit at least one of them to current analytical models. Another systematic study of streaming patterns of bubbles attached to a substrate (from a top view) has been effected much later by Tho, Manasseh & Ooi (Reference Tho, Manasseh and Ooi2007). Also these authors found a large number of streaming patterns, all presented in camera top view. More specifically, the authors studied cases of varying translational and/or oscillating motion. Furthermore, they also showed three examples of surface modes (with some difficulty in keeping the bubbles in a stable position) but their observations did not reveal any particular correlation between the streaming patterns and the mode number. As already stated by Tho et al. (Reference Tho, Manasseh and Ooi2007), no other fundamental studies on streaming patterns exist. Other studies on microstreaming around bubbles focus on one of its applications either in the field of micromixing or medicine. For instance Liu et al. (Reference Liu, Yang, Pindera, Athavale and Grodzinski2002) and later Collis et al. (Reference Collis, Manasseh, Liovic, Tho, Ooi, Petkovic-Duran and Zhu2010) succeeded experimentally in mixing a liquid due to a grid of oscillating bubbles. Microstreaming can also be used to transport and manipulate small objects such as cells (Marmottant & Hilgenfeldt Reference Marmottant and Hilgenfeldt2003; Marmottant et al. Reference Marmottant, Raven, Gardeniers, Bomer and Hilgenfeldt2006a ; Ahmed et al. Reference Ahmed, Ozcelik, Bojanala, Nama, Upadhyay, Chen, Hanna-Rose and Huang2016) and even to create microswimmers (Bertin et al. Reference Bertin, Spelman, Stephan, Gredy, Bouriau, Lauga and Marmottant2015). Further effects of microstreaming around cavitation bubbles in medical applications are discussed by Coussios & Roy (Reference Coussios and Roy2008). Only few experimental studies exist, that demonstrate streaming around acoustically trapped bubbles. However, none of those works contains detailed comparisons or includes time resolved bubble dynamics. Gormley & Wu (Reference Gormley and Wu1998) demonstrated the existence of streaming around contrast agent microbubbles and Verraes et al. (Reference Verraes, Lepoint-Mullie, Lepoint and Longuet-Higgins2000) around sonoluminescent bubbles. More recently, Leong et al. (Reference Leong, Collis, Manasseh, Ooi, Novell, Bouakaz, Ashokkumar and Kentish2011) discussed streaming in the context of surfactants and bubble growth.
Early theoretical work on microstreaming took place in the general framework of fluid–solid interfaces. In this context, Nyborg (Reference Nyborg1958) discussed two cases which are related to bubbles. Firstly, he studied the case of a point source such as a gas bubble close to a solid boundary. This model has been confirmed by one of the experiments conducted by Elder (Reference Elder1959). Secondly, he considered the case of streaming around a solid sphere by placing nodes and antinodes on its surface. Other authors such as Riley (Reference Riley1966) and Lee & Wang (Reference Lee and Wang1990) refined models for solid spheres, but further aspects need to be taken into account for the specific case of gas bubbles. Davidson & Riley (Reference Davidson and Riley1971) were the first to consider bubbles with a fluid–gas interface. Their approach is based on fluid dynamics equations and the matching between an inner solution inside the boundary layer and the outer solution outside the boundary layer. They stated that, for small viscosity, streaming around a bubble has the opposite sign as around a solid sphere. Their model treats a purely translational bubble and the resulting streaming pattern has a cross-like structure. Longuet-Higgins (Reference Longuet-Higgins1998) later refined this mathematical formulation by incorporating the radial oscillations of the bubble. He confirmed the results of Davidson & Riley (Reference Davidson and Riley1971) and further derived a solution for combined radial–translational oscillations which corresponds to a flow in one direction along the bubble. More recently, surface modes have been considered by Maksimov (Reference Maksimov2007) and by Spelman & Lauga (Reference Spelman and Lauga2017) using similar approaches. For a surface mode
 $n$
, streaming patterns showing rotational symmetry with a number of
 $2n$
lobes are obtained. Another approach to describe streaming is based on acoustic formulations and has been developed first by Wu & Du (Reference Wu and Du1997) for pure translation (streaming pattern with a cross-like structure) and pure radial oscillation (pattern corresponding to a flow around the bubble in one direction). Later Doinikov & Bouakaz (Reference Doinikov and Bouakaz2010) extended this approach by taking into account viscosity not only in the boundary layer but in the whole liquid. Furthermore, they included surface modes in their model which result in equations predicting that
 $2n$
lobes around a surface mode
 $n$
should appear.
When summarising the existing literature, it becomes obvious that experimental results are only available for bubbles attached to a surface. Theoretical approximations are usually performed to manage the presence of the solid boundary and capture the radial and translational oscillations of the bubble. The specific case of non-spherical oscillations of substrate-attached bubble is made more difficult to handle due to the complex nature of contact line dynamics, as discussed by Shklyaev & Straube (Reference Shklyaev and Straube2008). For acoustically trapped bubbles, a certain number of theoretical streaming models have been developed considering axisymmetric bubble oscillations in an infinite liquid medium (Maksimov Reference Maksimov2007; Doinikov & Bouakaz Reference Doinikov and Bouakaz2010; Spelman & Lauga Reference Spelman and Lauga2017). However, no experimental studies exist so far. This might be partly due to the fact that studying streaming patterns around an acoustically trapped bubble first requires us to control its dynamics. In particular, surface oscillations have to be triggered and kept stable. Furthermore the orientation of the bubble has to be controlled to properly correlate the modal content of the shape deformation to the corresponding streaming pattern. Versluis et al. (Reference Versluis, Goertz, Palanchon, Heitman, van der Meer, Dollet, de Jong and Lohse2010) have studied the temporal dynamics of surface modes by exposing bubbles to short ultrasound pulses, while Guédra et al. (Reference Guédra, Inserra, Gilles and Mauger2016) drove bubbles with an amplitude-modulated ultrasound field, which allows a periodic onset and extinction of shape modes. These techniques allow detailed studies on the bubble dynamics, however their main default in the view of microstreaming is that no steady-state regime is reached. We recently developed an experimental method based on bubble coalescence which enables us to control non-spherical oscillations in the steady-state regime (Cleve et al. Reference Cleve, Guédra, Inserra, Mauger and Blanc-Benon2018a ). The coalescence of two bubbles is exploited to create one single, initially deformed bubble. When the acoustic pressure and bubble size are correctly chosen this leads to surface modes and the direction of the impact between the two coalescing bubbles defines the orientation of the axis of symmetry. Due to a constant acoustic pressure field, a steady-state regime can be reached. The observed bubble dynamics has been compared to a numerically solved analytical model (Shaw Reference Shaw2006) and shows very good agreement. Bubble coalescence will hence be used in the present work to obtain surface modes.
The present paper aims to visualise experimental microstreaming patterns around an acoustically trapped, non-spherically oscillating microbubble. As might be expected from theoretical models, two types of patterns could occur: patterns with a cross-like structure linked to a translational motion and patterns with a structure of
 $2n$
lobes,
 $n$
being the mode number of the surface oscillations. As will be shown, we indeed observe different types of patterns. However, not all of them are directly covered by existing theoretical models.
2 Experimental set-up and techniques
A schematic of the experimental set-up is given in figure 1. The experimental procedure includes three operating states: the triggering of surface oscillations, the visualisation of the bubble dynamics and the visualisation of the microstreaming. During experiments we switch rapidly between the different operating states, in particular between the two types of visualisation. The different techniques and their respective components are explained in detail in the following sections.
Schematic of the experimental set-up: the arrangement facilitates a fast switch between the different operating states (triggering of surface modes, visualisation of the bubble dynamics and visualisation of the microstreaming). The position of the water tank and the attached ultrasound (US) transducer can be adjusted by millimetre screws in the three directions, the position of the continuous wave laser source including its lenses is adjustable in the
 $y$
-direction.

2.1 Triggering of surface oscillations
An 8 cm-edge cubic water tank is filled with bidistilled undegassed water. The saturation of oxygen in the water is approximately
 $8.2~\text{mg}~\text{l}^{-1}$
depending slightly on temperature. As will be detailed later, tracer particles are added for the visualisation of microstreaming. An ultrasonic plane transducer (SinapTec®, diameter of the active area 35 mm) is attached to the bottom of the tank. The voltage amplitude of the transducer is varied between 1 and 10 V, no gain amplifier is used. All experiments are conducted at a driving frequency set to 31.25 kHz.
For the bubbles, the driving frequency corresponds to a resonant radius
 $R_{res}\approx 104~\unicode[STIX]{x03BC}\text{m}$
according to Minnaert’s theory (Minnaert Reference Minnaert1933). The bubbles considered in this study have radii ranging between
 $40~\unicode[STIX]{x03BC}\text{m}$
and
 $80~\unicode[STIX]{x03BC}\text{m}$
. They are all smaller than resonant size and hence naturally driven towards pressure antinodes due to primary Bjerknes forces.
The distribution of the acoustic field has been simulated with Comsol Multiphysics®. The driving frequency corresponds to a resonance frequency of the water tank, for which a pressure maximum is located on the
 $z$
-axis at a height of approximately 6 cm. This location corresponds to the experimental trapping position. Bubbles are trapped slightly above the pressure maximum, their stable position
 $\unicode[STIX]{x0394}z$
with respect to the pressure maximum can be estimated from an equilibrium between primary Bjerknes forces and buoyancy similar to calculations by (Eller Reference Eller1968),
 $$\begin{eqnarray}\unicode[STIX]{x0394}z=\frac{\unicode[STIX]{x1D706}_{z}}{4\unicode[STIX]{x03C0}}\arcsin \left(\frac{2\unicode[STIX]{x1D70C}gp_{0}\unicode[STIX]{x1D6FE}\unicode[STIX]{x1D706}_{z}\left(1-\displaystyle \frac{\unicode[STIX]{x1D714}^{2}}{\unicode[STIX]{x1D714}_{0}^{2}}\right)}{\unicode[STIX]{x03C0}p_{a}^{2}}\right).\end{eqnarray}$$
Here,
 $g$
is gravity,
 $\unicode[STIX]{x1D70C}$
the density of water,
 $p_{0}$
the static pressure,
 $p_{a}$
the acoustic pressure amplitude,
 $\unicode[STIX]{x1D6FE}=1.4$
,
 $\unicode[STIX]{x1D714}=2\unicode[STIX]{x03C0}f$
the driving frequency,
 $\unicode[STIX]{x1D714}_{0}$
the resonance frequency of the bubble and
 $\unicode[STIX]{x1D706}_{z}$
the wavelength along the
 $z$
-axis. The bubble is trapped between 0.3 mm and 2 mm above the pressure maximum, depending on the acoustic pressure and bubble size.
Single bubbles are nucleated by short laser pulses (
 $\unicode[STIX]{x1D706}=532~\text{nm}$
, second harmonic of a Nd:YAG pulsed laser, New Wave Solo III, 6 ns pulse duration). The laser beam is focused by a set of three lenses: it is enlarged by a first spherical concave lens (
 $f=-25~\text{mm}$
), then collimated by a second spherical convex lens (
 $f=125~\text{mm}$
) and finally focused by an aspherical lens (
 $f=40~\text{mm}$
) to minimise optical aberrations. The size of the nucleated bubble depends strongly on how well focused the laser beam is. Furthermore, the size can be slightly influenced by tuning the energy of the laser. We nucleate bubbles with radii ranging between
 $20~\unicode[STIX]{x03BC}\text{m}$
and
 $40~\unicode[STIX]{x03BC}\text{m}$
. Larger bubbles can be obtained by coalescence of two smaller bubbles. For example, a bubble of radius
 $70~\unicode[STIX]{x03BC}\text{m}$
can typically be obtained from coalescing five to ten individual bubbles.
When bubble coalescence leads to a bubble size where a certain surface mode is expected to be unstable, the respective surface mode is triggered. We exploit this fact to obtain non-spherical bubble oscillations. As the technique is detailed elsewhere (Cleve et al.
Reference Cleve, Guédra, Inserra, Mauger and Blanc-Benon2018a
), we will only recall some of the main features and important parameters. The conditions under which a surface mode
 $n$
can be triggered depend mainly on the bubble radius at rest
 $R_{0}$
, the acoustic driving frequency
 $f_{ac}$
and the acoustic pressure
 $p_{ac}$
(Brenner, Lohse & Dupont Reference Brenner, Lohse and Dupont1995). The driving frequency being a fixed variable in our experiments, a pressure threshold
 $p_{n,thresh}(R_{0})$
can be found above which the steady-state surface mode
 $n$
can be obtained. Consequently, a desired surface mode can be triggered by correctly choosing the bubble size and the acoustic pressure. This is a comparatively fast method to obtain a desired surface mode. As in other experiments, the hereby created surface modes are primarily shape deformations on zonal spherical harmonics and represent hence axisymmetric deformation. We have shown (Cleve et al.
Reference Cleve, Guédra, Inserra, Mauger and Blanc-Benon2018a
) that the axis of symmetry is defined by the rectilinear motion between the two coalescing bubbles. This is a very important feature as the correct orientation of the bubble is essential to obtain unambiguous information on the bubble contour (Guédra et al.
Reference Guédra, Cleve, Mauger, Blanc-Benon and Inserra2017). During our present experiments we thus take care that the bubbles are nucleated in the focal plane of the camera and that they remain in this plane all along their trajectory until coalescence. In conclusion, the bubble coalescence technique allows us to obtain bubbles of appropriate size for surface modes and furthermore to control their axis of symmetry.
The acoustic pressure is obtained indirectly by fitting the measured radial dynamics of bubbles driven at low acoustic amplitude to the analytical Keller–Miksis model (Keller & Miksis Reference Keller and Miksis1980). A large number of preliminary tests reveals a linear pressure–voltage relation.
2.2 Visualisation of the bubble dynamics
Experiments are captured with a CMOS camera (Vision Research® V12.1) equipped with a
 $12\times$
objective lens (Navitar® equipped with an additional 1.5
 $\times$
lens). A frame size of
 $128\times 128~\text{pixels}$
and an acquisition rate of 180 kHz are used for the recordings of motion of the bubble interface. Backlight illumination is assured by a continuous light-emitting diode (LED). For this set-up and operating state, the depth of field of the camera objective and lenses is approximately
 $200~\unicode[STIX]{x03BC}\text{m}$
. The water tank is placed on a movable device which allows us to adjust its position in the three directions
 $x$
,
 $y$
and
 $z$
(defined in figure 1) to correct small variations of the bubble position.
Image processing is applied to extract the centroid and the bubble contour for each snapshot. Once the symmetry axis has been defined correctly, the contour can be described by the polar coordinates
 $(r_{s},\unicode[STIX]{x1D703})$
, (see figure 2). For each frame the contour is expanded on the basis of Legendre polynomials
 $P_{n}$
:
 $$\begin{eqnarray}r_{s}(\unicode[STIX]{x1D703},t)=\mathop{\sum }_{n=0}^{\infty }a_{n}(t)P_{n}(\cos \unicode[STIX]{x1D703}),\end{eqnarray}$$
where
 $a_{n}(t)$
are the modal coefficients (Guédra et al.
Reference Guédra, Inserra, Mauger and Gilles2016)
 $$\begin{eqnarray}a_{n}(t)=\frac{2n+1}{2}\int _{-1}^{1}r_{s}(x,t)P_{n}(x)\,\text{d}x,\quad \text{with }x=\cos \unicode[STIX]{x1D703}.\end{eqnarray}$$
The coefficients can be interpreted as follows. The coefficient
 $a_{0}(t)=R(t)$
corresponds to the volume pulsations of the bubble,
 $a_{1}(t)$
can be related to translational oscillations and
 $a_{n}(t)$
for
 $n\geqslant 2$
are the amplitudes of shape modes. Figure 2(a) illustrates the theoretical shapes of different modes, and figure 2(b–d) presents three examples of modal decompositions obtained by experiments.
(a) Schematic representations of different bubble shape modes: radial mode
 $R$
, translation
 $a_{1}$
and surface modes
 $a_{n}$
for
 $n=2,\ldots ,7$
. The shapes are defined by the respective Legendre polynomial
 $P_{n}$
added to the rest radius
 $R_{0}$
, the two extreme deformations of the bubble are shown. (b–d) Experimentally obtained bubble shapes
 $r_{s}(\unicode[STIX]{x1D703})$
(left) and the respective modal decomposition (right). The dominance of different surface modes can be observed: (b) mode 2 for a bubble
 $R_{0}=46.9~\unicode[STIX]{x03BC}\text{m}$
, (c) mode 3 for a bubble
 $R_{0}=70.5~\unicode[STIX]{x03BC}\text{m}$
and (d) mode 4 for a bubble
 $R_{0}=55.7~\unicode[STIX]{x03BC}\text{m}$
. Note that the radial mode includes the radius at rest
 $R_{0}$
.

2.3 Visualisation of microstreaming
Red fluorescent polymer microspheres (diameter,
 $0.71~\unicode[STIX]{x03BC}\text{m}$
, Duke Scientific) are used to visualise the flow around the oscillating bubbles. The condition for inertial behaviour of the particles is fulfilled as the Stokes number
 $St$
is much smaller than 1,
 $$\begin{eqnarray}St=\frac{\unicode[STIX]{x1D70C}_{p}d_{p}v_{max}}{18\unicode[STIX]{x1D707}}\approx 0.04\ll 1,\end{eqnarray}$$
with
 $\unicode[STIX]{x1D707}\approx 1~\text{mPa}~\text{s}$
the liquid dynamic viscosity,
 $\unicode[STIX]{x1D70C}_{p}\approx 10^{3}~\text{kg}~\text{m}^{-3}$
the density of the particles,
 $d_{p}\approx 0.71~\unicode[STIX]{x03BC}\text{m}$
the diameter of the particles and
 $v_{max}\approx 2~\text{mm}~\text{s}^{-1}$
approximate maximum streaming velocity. In addition, the particles are small enough not to be influenced by the acoustic radiation force, since they are ten times smaller than the critical size estimated following Ben Haj Slama et al. (Reference Ben Haj Slama, Gilles, Chiekh and Béra2017). The particles are illuminated by a continuous wave laser source (
 $\unicode[STIX]{x1D706}=532~\text{nm}$
, DPSS, CNI MLL-FN, 400 mW). A laser sheet is obtained by a cylindrical plano-concave lens (
 $f=250~\text{mm}$
). A cylindrical plano-convex lens (
 $f=-25.4~\text{mm}$
) is inserted just behind the first lens and oriented on the orthogonal axis to reduce the thickness of the laser sheet and obtain a beam waist estimated to approximately
 $250~\unicode[STIX]{x03BC}\text{m}$
. The fluorescence signal is recorded with the camera (see § 2.2) whose objective is equipped with a band reject filter (notch
 $532\pm 12~\text{nm}$
) corresponding to the laser wavelength. A frame size of
 $1024\times 768~\text{pixels}$
and an acquisition rate of 600 Hz are used for the recordings of the motion of the tracer particles. The position of the continuous wave laser source including its lenses can be adjusted by a millimetre screw in order to precisely align the laser sheet with the bubble. Depending on the bubble size and exact position inside the laser sheet a more or less clear shadow might appear behind the bubble (see figure 9(a4) for a pronounced case). Note that all snapshots and streamline plots have been turned by
 $90^{\circ }$
for reasons of a more convenient image format. This has however no impact on the interpretation of the results.
Two types of post-processing for the microstreaming are conducted in the scope of this work, streak imaging and particle image velocimetry (PIV). The purpose of the streak imaging is to visualise the streaming patterns qualitatively. All snapshots of the videos are superposed and for each pixel the maximum value is kept. In this way, the trajectories of the tracer particles become visible. As the flow is a steady flow, trajectories, streaklines and streamlines coincide. PIV is used to obtain quantitative information on the streaming velocities. The software DaVis® is used to extract a velocity vector field. Care has to be taken with the interpretation of the velocity data obtained for very small structures due to a limited number of tracer particles in these areas. Nevertheless, we choose to show PIV results in § 3.1 to give a rough idea about the occurring streaming velocities. The reader should keep in mind that the main aim of this work is not the discussion of streaming velocities but the overall characterisation of different types of streaming patterns.
2.4 Experimental procedure
In order to obtain information on bubble dynamics and microstreaming, the following experimental procedure is applied: a bubble is nucleated and trapped in the acoustic field of a fixed amplitude. This bubble is grown by multiple coalescences until it reaches a size slightly smaller than a bubble likely to show surface oscillations. If necessary, the position of the tank and of the focusing plane of the camera are adjusted. One further bubble is nucleated, which will trigger the surface oscillations. Once a steady-state regime is reached, we capture several sequences in the two operating states, visualisation of the bubble dynamics and visualisation of the microstreaming. Care is taken to rapidly switch between the operating states. A typical sequence is dynamics (a) – streaming (ab) – dynamics (b) – streaming (bc) – dynamics (c). If the bubble dynamics is the same on videos (a), (b) and (c), we can safely associate it with the obtained streaming pattern (ab) and (bc). Figure 3 visualises the experimental procedure with the associated time scales.
Schematic representations of the experimental procedure. As can be seen on the left zoom, the initial bubble shape caused by coalescence will lead to steady-state oscillations once the different modal components have decayed (here mode 2) or grown (here mode 3). After having adjusted the positions of camera and laser sheet, the measurement series begins, varying videos of bubble dynamics (abbreviated by dyn. in the figure) and streaming. The constant modal amplitudes, see superposed zooms on the right, lead us to conclude that we are in the steady-state regime.

2.5 Preliminary test for streaming without the presence of surface modes
Before conducting the experiments of streaming around bubbles with surface modes, we performed some preliminary tests (Cleve et al. Reference Cleve, Guédra, Mauger, Inserra and Blanc-Benon2018b ). For this, we recorded the fluorescent particles without the presence of any bubble and with the ultrasound field turned off. In the ideal case, no particle motion is visible at all. Frequently, a slight parasite flow (clearly smaller than the actual streaming) can be observed, which we suspect to be mainly due to thermal effects from the laser sheet. Switching on the ultrasound field does not lead to any further variations. Last, by adding a bubble that is purely oscillating on a radial mode, we still did not observe any particle motion. This observation is in agreement with several microstreaming models (Longuet-Higgins Reference Longuet-Higgins1998; Maksimov Reference Maksimov2007; Spelman & Lauga Reference Spelman and Lauga2017) that are not defined for purely radial oscillation. Indeed, even though not written explicitly, it becomes obvious from their derived fluid dynamics equations that no vorticity is induced by pure radial oscillations. Flows induced by pure radial motion have however been theoretically evidenced by Wu & Du (Reference Wu and Du1997). As a main difference to other models, their theory takes into account the gas phase inside the bubble as well as the incoming and the scattered acoustic field and it is based on the assumption of resonant size bubbles. As our bubbles are smaller than resonant size, this may explain why such liquid flows around a microbubble experiencing radial oscillations was never obtained in our experimental configuration. It is worth noting that, while focused on near-resonant bubbles, their theory may be applied to non-resonant bubbles as far as the applied acoustic field and the bubble equilibrium radius are known, which leads to small theoretical streaming velocities of the order of few micrometres per second for our experimental data.
In conclusion, in the present experimental conditions for a gas bubble in water and in a standing ultrasound field, other modes than the radial mode need to be present to obtain microstreaming. Note that the present set-up does not allow for pure translational motion.
3 Experimental results
3.1 Complete characterisation of a bubble: dynamics and streaming
The experimental procedure is conducted for approximately a hundred bubbles. Each of them is oscillating predominantly either in a mode 2, mode 3 or mode 4. The excited mode depends on the bubble size and driving pressure amplitude. All results are presented in a radius–pressure map in figure 4. The experimental results are indicated by the markers, and background colours indicate theoretically unstable areas (Brenner et al.
Reference Brenner, Lohse and Dupont1995). The mode 2 and mode 3 presented on the map correspond to the first parametric resonance and the parametrically excited shape mode oscillates at half the driving frequency
 $f_{osc}/2$
. The mode 4 presented here corresponds to the second parametric resonance and the parametrically excited shape mode oscillates at the driving frequency
 $f_{osc}$
. The first parametric resonance of the mode 4 (obtained for bubble radii larger than
 $80~\unicode[STIX]{x03BC}\text{m}$
) has not been investigated experimentally due to difficulties to keep surface oscillations stable for a sufficiently long time. A possible reason is that the first parametric resonance of the mode 4 (red zone on the right of figure 4) is close to the resonance size.
Radius–pressure map presenting experimental results classified according to the predominant mode of deformation (
 $\times$
– mode 2, ▵ – mode 3, ▫ – mode 4) superimposed on numerically computed unstable areas (background colours: blue – mode 2, green – mode 3, red – mode 4).

Characterisation of a bubble (
 $R_{0}=46.9~\unicode[STIX]{x03BC}\text{m}$
,
 $p_{a}=20.6~\text{kPa}$
) oscillating predominantly on a surface mode 2 and its resulting streaming pattern: (a) consecutive snapshots over two acoustic periods
 $2T=0.064~\text{ms}$
recorded at 180 kHz (the axis of symmetry is indicated in the first screen shot, the image size is
 $180~\unicode[STIX]{x03BC}\text{m}\times 180~\unicode[STIX]{x03BC}\text{m}$
); (b) modal decomposition of the bubble shape and (c) ‘zoom’ on two acoustic periods (500 measurement points reported on
 $2T=0.064~\text{ms}$
); (d) streak photography of the streaming pattern (700 images corresponding to 1.2 ms of signal, image size
 $1200~\unicode[STIX]{x03BC}\text{m}\times 900~\unicode[STIX]{x03BC}\text{m}$
); (e) PIV of the streaming flow and (f) velocity profiles along the line indicated in (e). See also supplementary movie 1 and movie 2.

Characterisation of a bubble (
 $R_{0}=70.5~\unicode[STIX]{x03BC}\text{m}$
,
 $p_{a}=12.8~\text{kPa}$
) oscillating predominantly on a surface mode 3 and its resulting streaming pattern: (a) consecutive snapshots over two acoustic periods
 $2T=0.064~\text{ms}$
recorded at 180 kHz (the axis of symmetry is indicated in the first screen shot, the image size is
 $180~\unicode[STIX]{x03BC}\text{m}\times 180~\unicode[STIX]{x03BC}\text{m}$
); (b) modal decomposition of the bubble shape and (c) ‘zoom’ on two acoustic periods (500 measurement points reported on
 $2T=0.064~\text{ms}$
); (d) streak photography of the streaming pattern (700 images corresponding to 1.2 ms of signal, images size
 $1200~\unicode[STIX]{x03BC}\text{m}\times 900~\unicode[STIX]{x03BC}\text{m}$
); (e) PIV of the streaming flow and (f) velocity profiles along the line indicated in (e). See also supplementary movie 3 and movie 4.

Characterisation of a bubble (
 $R_{0}=55.7~\unicode[STIX]{x03BC}\text{m}$
,
 $p_{a}=23.6~\text{kPa}$
) oscillating predominantly on a surface mode 4 and its resulting streaming pattern: (a) consecutive snapshots over two acoustic periods
 $2T=0.064~\text{ms}$
recorded at
 $180~\text{kHz}$
(the axis of symmetry is indicated in the first screen shot, the image size is
 $180~\unicode[STIX]{x03BC}\text{m}\times 180~\unicode[STIX]{x03BC}\text{m}$
); (b) modal decomposition of the bubble shape and (c) ‘zoom’ on two acoustic periods (500 measurement points reported on
 $2T=0.064~\text{ms}$
); (d) streak photography of the streaming pattern (700 images corresponding to 1.2 ms of signal, images size
 $1200~\unicode[STIX]{x03BC}\text{m}\times 900~\unicode[STIX]{x03BC}\text{m}$
); (e) PIV of the streaming flow and (f) velocity profiles along the line indicated in (e). See also supplementary movie 5 and movie 6.

Figures 5 to 7 present complete overviews on the characterisation of a bubble including its dynamics (a–c) and streaming (d–f). Respective videos can be found in the supplementary material (movie 1 to movie 6) available online at https://doi.org/10.1017/jfm.2019.511. Panel (a) presents a series of consecutive snapshots over two acoustic periods of the respective bubble. The modal decomposition over one millisecond is presented in (b). We recall that we restrict our analysis to the steady-state regime and that initial transient effects due to the coalescence process are no longer present. In (b) we only show 1 ms of signal out of 100 ms original recording length. Furthermore, we only present the decomposition of the first eight surface modes, which is sufficient to analyse the surface oscillations possibly generated through nonlinear coupling (Guédra et al.
Reference Guédra, Cleve, Mauger, Blanc-Benon and Inserra2017). Similar information on the modal amplitude is presented in (c) in phase-averaged plots. It can be understood as a zoom on two acoustic periods, but more precisely it shows 2.7 ms of the signal that is recovered over two acoustic periods. This type of plot is introduced here, as it will facilitate the discussion in § 3.2. Panel (d) shows streak images where 700 snapshots covering 1.2 s are superposed to visualise the trajectories of the tracer particles. Panel (e) presents the velocity distribution resulting from PIV. The average over 100 PIV steps has been evaluated. Panel (f) shows the absolute velocity in dependence of the radial coordinate
 $r$
along the red line that is indicated in panel (e), coinciding with the axis of symmetry.
Figure 5 presents experimental results obtained for a bubble of mean radius
 $R_{0}=46.9~\unicode[STIX]{x03BC}\text{m}$
and pressure
 $p_{a}=20.6~\text{kPa}$
which is oscillating predominantly on a mode 2. The bubble dynamics shows the appearance of a radial component
 $R$
, a large modal amplitude
 $a_{2}$
and small modal amplitude
 $a_{4}$
. The parametric excitation of the mode 2 is naturally expected as the applied acoustic pressure is higher than the pressure threshold
 $p_{2,thresh}=17.5~\text{kPa}$
. The acoustic pressure is however below the pressure threshold of the mode 4 (
 $p_{4,thresh}=44.1~\text{kPa}$
), the appearance of the mode 4 is hence evidence of nonlinear coupling. The streaming pattern in figure 5(d) is a large cross-like structure with two pairs of small recirculation zones close to the bubble. The maximum absolute velocity is approximately
 $0.6~\text{mm}~\text{s}^{-1}$
on the axis of symmetry where the flow is flowing away from the bubble. Figure 6 presents experimental results obtained for a bubble of mean radius
 $R_{0}=70.5~\unicode[STIX]{x03BC}\text{m}$
and pressure
 $p_{a}=12.8~\text{kPa}$
which is oscillating predominantly on a mode 3. A large radial amplitude
 $R$
and a large modal amplitude
 $a_{3}$
can be observed. The apparently large translational mode
 $a_{1}$
will be discussed later. Furthermore, a modal amplitude
 $a_{6}$
is clearly visible, and small components of the modes
 $a_{2}$
and
 $a_{4}$
can be observed. The mode 3 is driven by parametric excitation (
 $p_{3,thresh}=9.0~\text{kPa}$
), whereas the other modes appear due to nonlinear coupling (for instance
 $p_{6,thresh}=39.5~\text{kPa}$
). The streaming pattern in figure 6(d) consists of six lobes. Maximum velocities are approximately
 $1~\text{mm}~\text{s}^{-1}$
. Figure 7 presents experimental results obtained for a bubble of mean radius
 $R_{0}=55.7~\unicode[STIX]{x03BC}\text{m}$
and pressure
 $p_{a}=23.6~\text{kPa}$
which is oscillating predominantly on a mode 4. The bubble dynamics shows a radial amplitude
 $R$
, a modal amplitude
 $a_{4}$
and a slightly lower modal amplitude
 $a_{2}$
. The mode 4 is naturally excited (
 $p_{4,thresh}=11.0~\text{kPa}$
) whereas the acoustic pressure is below the threshold for the mode 2 (
 $p_{2,thresh}=29.1~\text{kPa}$
). The streaming pattern shows eight small lobes of the size of the bubble diameter. The PIV analysis results in maximum velocities of approximately
 $0.4~\text{mm}~\text{s}^{-1}$
.
Presentation of two different streaming patterns observed for a bubble oscillating in a mode 2: case (a) – Cross-shaped pattern with four small lobes close to the bubble (
 $R_{0}=49.7~\unicode[STIX]{x03BC}\text{m}$
,
 $p_{a}=34.5~\text{kPa}$
); case (b) – cross-shaped pattern without any lobes (
 $R_{0}=44.0~\unicode[STIX]{x03BC}\text{m}$
,
 $p_{a}=23.4~\text{kPa}$
). For each case (x), the information is structured as follows. (x1) schematic drawing of the bubble dynamics, and (x2) representative snapshot of the dynamics (image size
 $180~\unicode[STIX]{x03BC}\text{m}\times 180~\unicode[STIX]{x03BC}\text{m}$
); (x3) schematic drawing of the streaming patterns, and (x4) streak photography of the streaming pattern (image size
 $1~\text{mm}\times 1~\text{mm}$
, 723 images corresponding to 1.2 ms of signal); (x5) maximum modal amplitudes; (x6) temporal evolution of: black line –
 $\unicode[STIX]{x1D709}_{0}$
, red dashed line –
 $\unicode[STIX]{x1D709}_{2}$
, and blue dotted line –
 $\unicode[STIX]{x1D709}_{4}$
.

Presentation of four different streaming patterns observed for a bubble oscillating in a mode 3: case (a) – pattern with 6 lobes confined around the bubble (
 $R_{0}=70.8~\unicode[STIX]{x03BC}\text{m}$
,
 $p_{a}=9.2~\text{kPa}$
); case (b) – pattern with 8 lobes confined around the bubble (
 $R_{0}=70.1~\unicode[STIX]{x03BC}\text{m}$
,
 $p_{a}=12.4~\text{kPa}$
); case (c) – cross-shaped pattern without any lobes (
 $R_{0}=65.7~\unicode[STIX]{x03BC}\text{m}$
,
 $p_{a}=15.1~\text{kPa}$
); case (d) – cross-shaped pattern with four circular zones of recirculation (
 $R_{0}=68.6~\unicode[STIX]{x03BC}\text{m}$
,
 $p_{a}=13.3~\text{kPa}$
). For each case (x), the information is structured as follows. (x1) schematic drawing of the bubble dynamics, and (x2) representative snapshot of the dynamics (image size
 $180~\unicode[STIX]{x03BC}\text{m}\times 180~\unicode[STIX]{x03BC}\text{m}$
); (x3) schematic drawing of the streaming patterns, and (x4) streak photography of the streaming pattern (image size
 $1~\text{mm}\times 1~\text{mm}$
, 723 images corresponding to 1.2 ms of signal); (x5) maximum modal amplitudes; (x6) temporal evolution of: black line –
 $\unicode[STIX]{x1D709}_{0}$
, red dashed line –
 $\unicode[STIX]{x1D709}_{3}$
, and blue dotted line –
 $\unicode[STIX]{x1D709}_{6}$
.

Presentation of two different streaming patterns observed for a bubble oscillating in a mode 4: case (a) – pattern with 8 small lobes confined around the bubble (
 $R_{0}=56.5~\unicode[STIX]{x03BC}\text{m}$
,
 $p_{a}=17.9~\text{kPa}$
); case (b) – cross-shaped pattern (
 $R_{0}=55.0~\unicode[STIX]{x03BC}\text{m}$
,
 $p_{a}=17.9~\text{kPa}$
,). For each case (x), the information is structured as follows. (x1) schematic drawing of the bubble dynamics, and (x2) representative snapshot of the dynamics (image size
 $180~\unicode[STIX]{x03BC}\text{m}\times 180~\unicode[STIX]{x03BC}\text{m}$
); (x3) schematic drawing of the streaming patterns, and (x4) streak photography of the streaming pattern (image size 1 mm
 $\times$
1 mm, 723 images corresponding to 1.2 ms of signal); (x5) maximum modal amplitudes; (x6) temporal evolution of: black line –
 $\unicode[STIX]{x1D709}_{0}$
, green dash-dotted line –
 $\unicode[STIX]{x1D709}_{2}$
, and red dashed line –
 $\unicode[STIX]{x1D709}_{4}$
.

Such complete characterisations can be obtained for a large number of bubbles. The examples shown in figures 5–7 are representative for several findings. However, it has been observed that the mode number is not the only parameter defining the shape of the streaming pattern. An extended set of different streaming patterns is presented in § 3.2.
3.2 Classification of streaming patterns
The streaming patterns shown in § 3.1 present one possible structure obtained for bubbles oscillating predominantly in mode 2, 3 or 4 respectively. These are, however, not unique possibilities and other streaming patterns can be observed. In this section we will present an extensive set of observed streaming patterns in figures 8 to 10. Figure 8 contains two different streaming patterns, (a) and (b), for a bubble oscillating in a mode 2, figure 9(a–d) shows four cases for a mode 3, and figure 10(a,b) two cases for a mode 4. For each streaming pattern (x), the following information is presented. The bubble dynamics is presented schematically in (x1), and by one representative snapshot in (x2). A schematic drawing of the streamlines is given in (x3) and is representative of the streak photography in (x4). More information on the modal amplitudes is given in (x5) and (x6). Panel (x5) presents the modal amplitudes
 $\hat{a}_{n}=\max (|a_{n}|)$
for the modes
 $n=0,\ldots ,8$
. Note that for the radial oscillation the value is obtained by first subtracting the mean radius
 $R_{0}$
so that
 $\hat{a}_{0}=\max (|a_{0}-R_{0}|)$
. Panel (x6) presents the temporal evolutions of some chosen modal amplitudes, less important modes are left out for clarity. Furthermore the evolutions have been normalised so that normalised temporal amplitude
 $$\begin{eqnarray}\unicode[STIX]{x1D709}_{n}(t)=\frac{a_{n}(t)-R_{0}\unicode[STIX]{x1D6FF}_{n0}}{\hat{a}_{n}}\end{eqnarray}$$
lies between
 $-1$
and 1. The Kronecker delta
 $\unicode[STIX]{x1D6FF}_{n0}$
is used here to subtract the radius at rest for the radial mode.
Figure 8 shows two characteristic streaming patterns for a bubble that is predominantly oscillating in a mode 2. Case 8(a) shows a cross-like structure with two pairs of recirculation zones close to the bubble surface and symmetric with respect to the axis of symmetry of the shape deformation. This case corresponds to the pattern already presented in figure 5 in § 3.1. Case 8(b) also shows a cross-like structure, but no small structures are visible. The main difference in the bubble dynamics between the two cases is that the modal amplitudes
 $a_{2}$
and
 $a_{4}$
are considerably larger for case 8(b) than for case 8(a). Taking into account all experimental results showing a mode 2, we observe that for the cross-like streaming pattern, case 8(a), the modal amplitudes range between
 $3~\unicode[STIX]{x03BC}\text{m}<a_{2}<6~\unicode[STIX]{x03BC}\text{m}$
and
 $a_{4}<2~\unicode[STIX]{x03BC}\text{m}$
. Opposed to those values, the modal amplitudes for the cross-like streaming patterns without any visible substructures, case 8(b), are larger and range between
 $10~\unicode[STIX]{x03BC}\text{m}<a_{2}<13~\unicode[STIX]{x03BC}\text{m}$
and
 $3~\unicode[STIX]{x03BC}\text{m}<a_{4}<4~\unicode[STIX]{x03BC}\text{m}$
.
Figure 9 shows four characteristic streaming patterns for a bubble that is predominantly oscillating in a mode 3. Case 9(a) shows a structure with six lobes. A similar pattern has already been presented in § 3.1 in figure 6. Case 9(b) shows a structure with 8 lobes. This kind of pattern is observed a large number of times. The 8 lobes may be arranged evenly around the circumference or irregularly as can be seen in the example presented here. The two lobes in the perpendicular direction to the axis of symmetry (on its right side) are very close to one another and could be described as one joint structure. Case 9(c) shows a cross-like structure. And finally case 9(d) shows a cross-like structure with four round zones of recirculation in every corner of the cross and close to the bubble. The cases presented here show larger modal amplitudes for the large cross-like structures, cases (c) and (d). These findings are however not representative of all experimental results as will be discussed later in this section. Besides the modal amplitude
 $a_{3}$
and the radial amplitude
 $a_{0}$
, a strong modal amplitude
 $a_{1}$
is visible. The corresponding dimensionless variable
 $\unicode[STIX]{x1D709}_{1}$
is not presented in the temporal information in (x6), as it is always in approximate phase opposition to
 $\unicode[STIX]{x1D709}_{3}$
it has hence been left out for clarity. Possible reasons for the appearance of
 $a_{1}$
will be discussed in § 4. A last look shall be taken at the modal amplitude
 $\unicode[STIX]{x1D709}_{6}$
as it is oscillating at the same frequency as the radial mode and hence at the driving frequency. The phase difference between these two modes
 $\unicode[STIX]{x1D709}_{0}$
and
 $\unicode[STIX]{x1D709}_{6}$
will be discussed later in this section.
Figure 10 shows two characteristic streaming patterns for a bubble that is predominantly oscillating in a mode 4. Case 10(a) shows a structure with 8 small lobes close to the bubble. The same case has already been presented in § 3.1 in figure 7. Case 10(b) is a cross-like structure. Generally, patterns with lobes, case (a), show smaller modal amplitudes (
 $3~\unicode[STIX]{x03BC}\text{m}<a_{4}<8~\unicode[STIX]{x03BC}\text{m}$
,
 $a_{2}<4~\unicode[STIX]{x03BC}\text{m}$
) than the cross-like structures (
 $8~\unicode[STIX]{x03BC}\text{m}<a_{4}<18~\unicode[STIX]{x03BC}\text{m}$
,
 $2~\unicode[STIX]{x03BC}\text{m}<a_{2}<7~\unicode[STIX]{x03BC}\text{m}$
). The modal amplitude
 $a_{8}$
is generally small and is left out in (x6) for clarity. As the mode 4 is a second parametric resonance, it is oscillating at the driving frequency
 $f_{osc}$
. The dimensionless variables
 $\unicode[STIX]{x1D709}_{0}(t)$
,
 $\unicode[STIX]{x1D709}_{2}(t)$
and
 $\unicode[STIX]{x1D709}_{4}(t)$
are oscillating at the same frequency. In all cases,
 $\unicode[STIX]{x1D709}_{0}(t)$
and
 $\unicode[STIX]{x1D709}_{4}(t)$
are in approximate phase opposition. As
 $\unicode[STIX]{x1D709}_{2}(t)$
has been observed to oscillate either in phase with
 $\unicode[STIX]{x1D709}_{0}(t)$
or with
 $\unicode[STIX]{x1D709}_{4}(t)$
for both cross-like structures and structures with 8 lobes, no certain rule can be deduced for the phase of
 $\unicode[STIX]{x1D709}_{2}(t)$
.
We can sort the observed patterns into two classes. The first class gathers patterns that only consist of lobes around the bubble. The streamlines start and end on the bubble surface. The second class gathers patterns that extend much further away from the bubble and have a cross-like structure. Some of those patterns show additional small zones of recirculation with closed streamlines. An overview of this classification is given in table 1. Streaming patterns induced by bubbles with a predominant mode 2 all belong to the second class (large cross-like structure), while patterns induced by modes 3 and 4 can be found in both classes.

All measurement points are reported in a radius–pressure map, figure 11(a), and a distinction between the two classes of patterns becomes visible. The confined lobes patterns are always found for bubbles larger than the
 $n$
th-mode resonance size, that is for frequencies below the
 $n$
th-mode resonance frequency. The large patterns are always found for bubbles smaller than the
 $n$
th-mode resonance size, that is for frequencies above the
 $n$
th-mode resonance frequency. The vertical lines indicated for modes 3 and 4 match well with the respective minima of the pressure threshold deduced from stability analysis by Brenner et al. (Reference Brenner, Lohse and Dupont1995) within the error margin on the bubble size. Furthermore, the line indicated for the mode 3 corresponds exactly to the 3rd-mode resonant radius calculated from first-order approximation analysis by Francescutto & Nabergoj (Reference Francescutto and Nabergoj1978). Note that such a linearised theory is only valid in the vicinity of the first parametric resonance, a similar analysis thus cannot be applied to the mode 4 presented in figure 11.
(a) Radius–pressure map with all results separated:
 $\star$
– large patterns; ○ – confined lobe patterns, (see table 1 for definition); background colours: blue – mode 2, green – mode 3, red – mode 4. (b) Example of one bubble whose pattern changes from a confined lobe pattern to a large pattern while the bubble is diminishing slightly in size, passing from above to below resonant size (within the error of measurement).
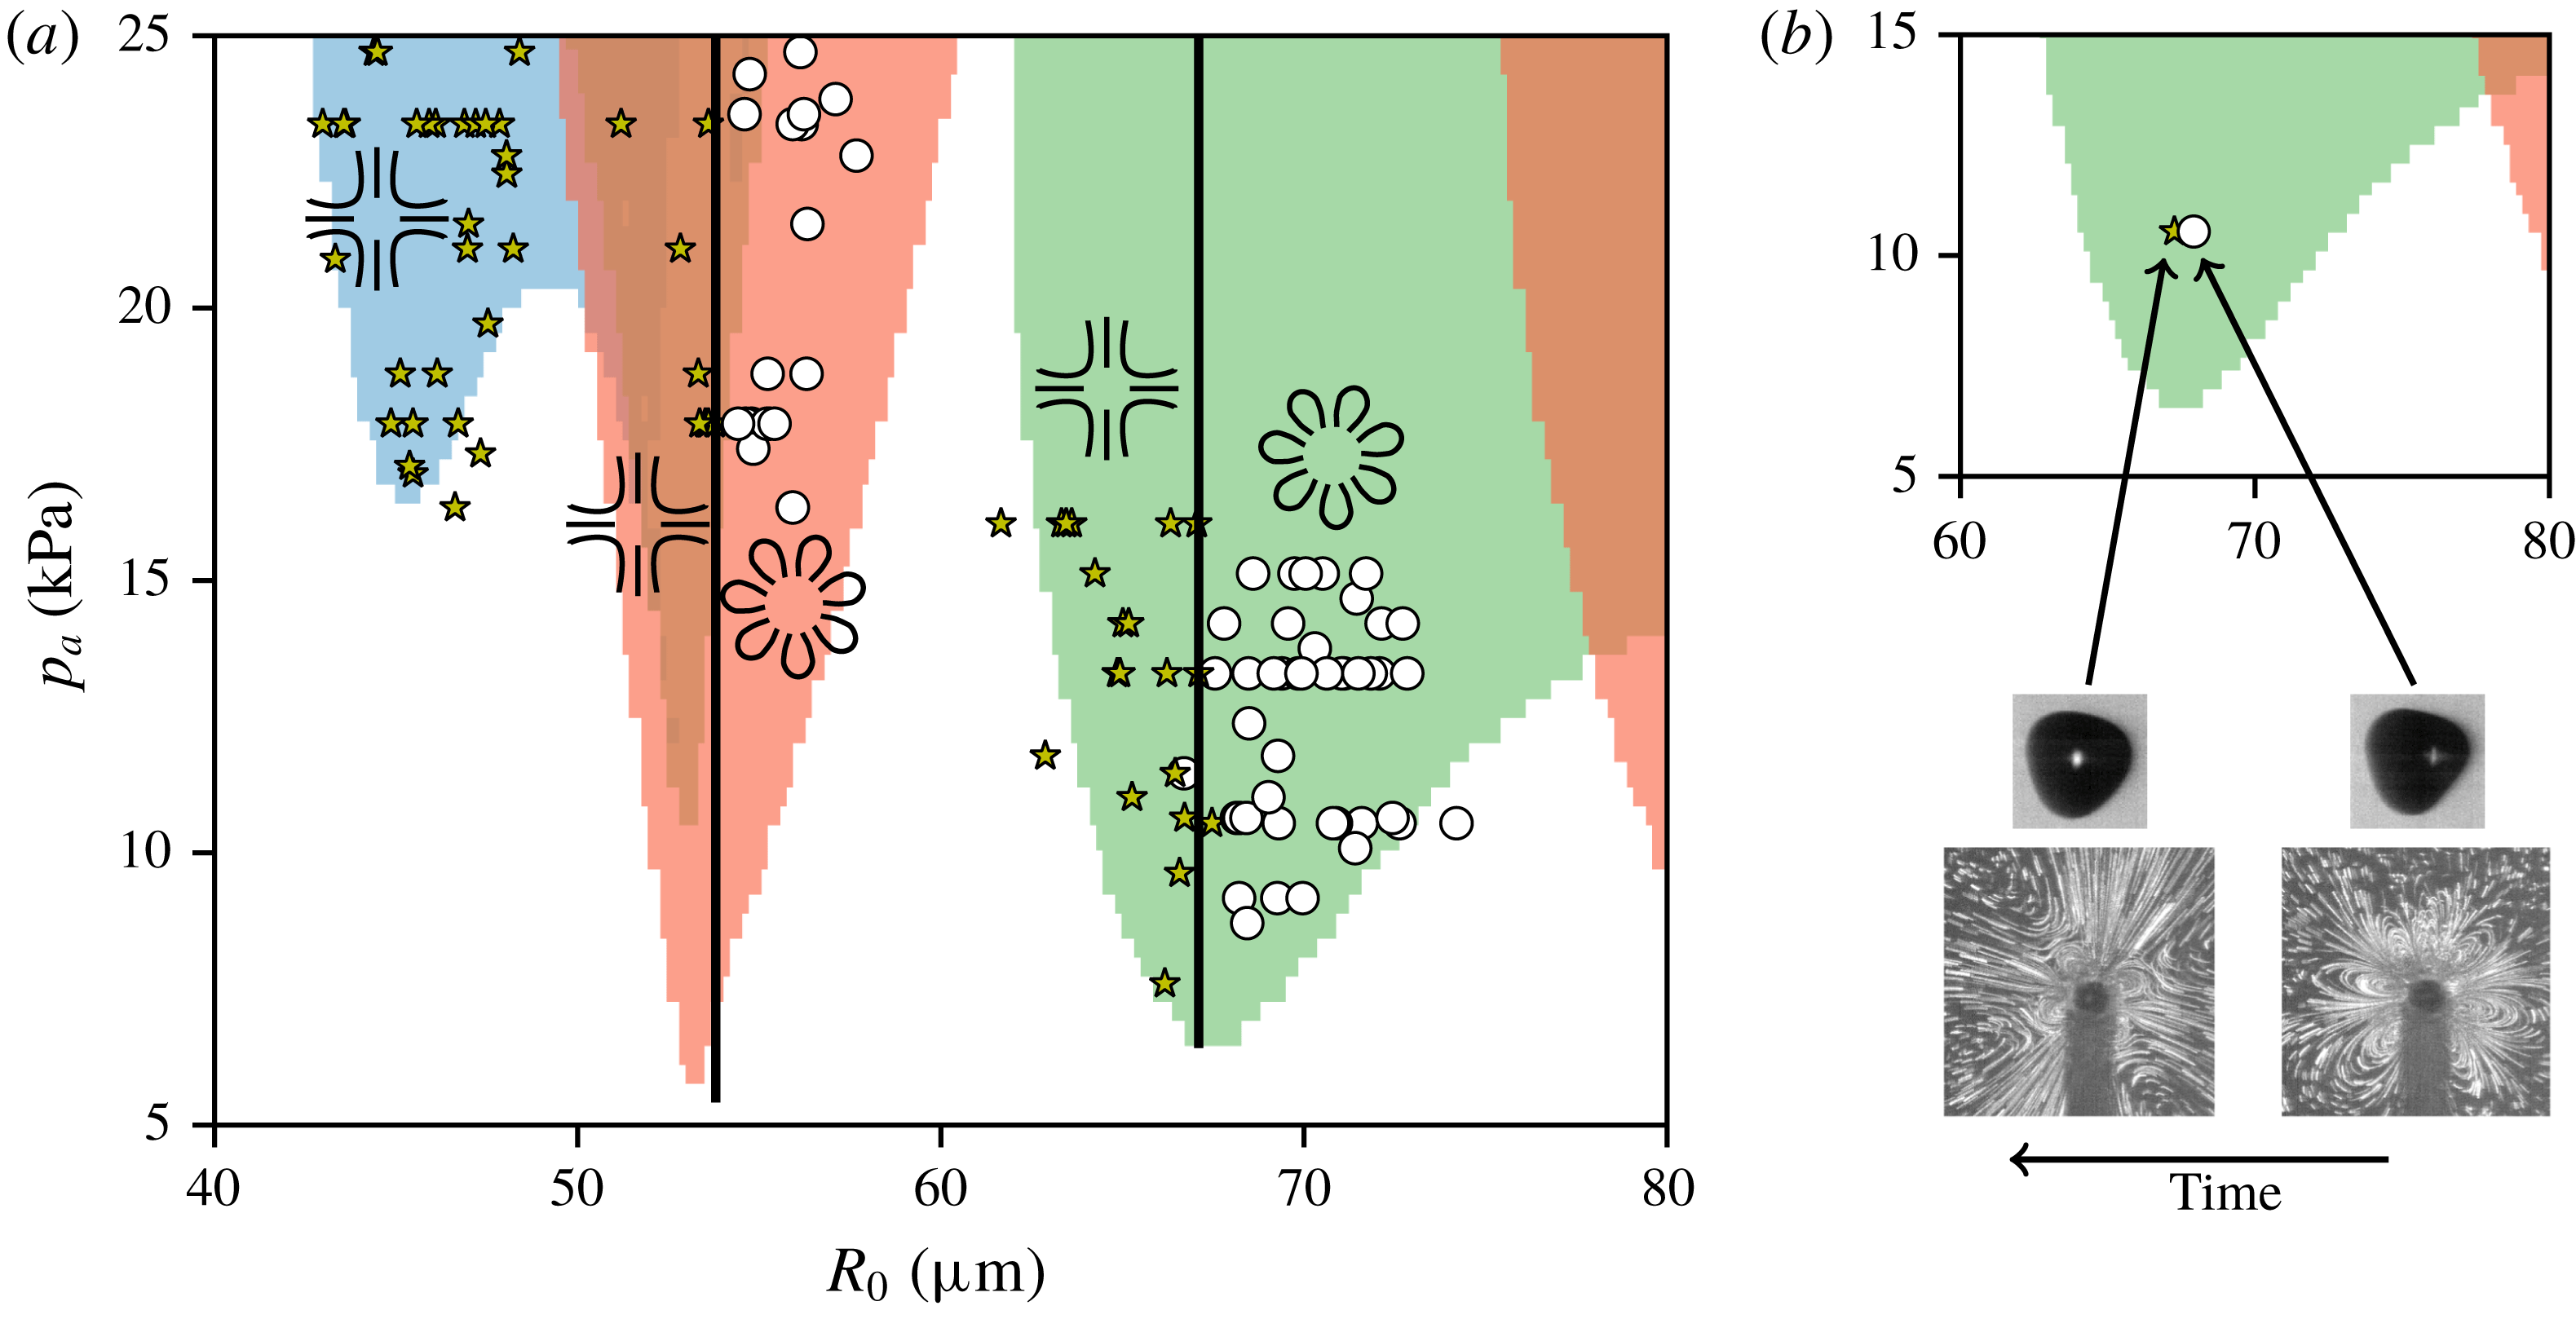
Normally, bubbles maintain an approximately stable size so that they show either lobe-shaped patterns or large patterns throughout one measurement series. However, in a few cases we succeeded in observing a bubble growing or shrinking over time while keeping the bubble oscillations otherwise stable. Such an example is shown in figure 11(b). In this particular case, we even managed to record the relatively fast switch (order of a few hundred milliseconds) between the two types of pattern. The beginning of the 1.2 s recording gives the lobe-shaped pattern on the right of figure 11(b), the end of the recording the large pattern on the left of figure 11(b). The corresponding bubble dynamics before and after the recording of the streaming shows a small decrease of the bubble size (
 $R_{0}=69.2~\unicode[STIX]{x03BC}\text{m}$
and
 $69.0~\unicode[STIX]{x03BC}\text{m}$
). Furthermore the modal amplitudes decrease (4 % for
 $a_{3}$
and 30 % for mode 6), but in particular an increased phase difference between the mode 0 and mode 6 becomes visible.
In figure 11(a), no zones can be seen that would allow us to further distinguish the observed patterns: For a mode 3, the patterns with six lobes and with eight lobes cannot be distinguished. For a mode 2, the cross-like patterns with and without zones of recirculation are in the same region.
We shall now take a closer look at the modal amplitudes and phases, focusing on bubbles in the vicinity of the first parametric resonance of mode 3 as presented in figure 9. As reported in the previous paragraph, the large patterns and lobe-shaped patterns can be distinguished by the bubble size. There are two other important parameters that were left out earlier in this section: the modal amplitudes
 $\hat{a}_{3}$
,
 $\hat{a}_{0}$
and
 $\hat{a}_{6}$
as well as the phase differences between modes. This information is presented in figure 12.
Study of amplitude and phasing for bubbles oscillating in a mode 3 and separated in large patterns –
 $\star$
and lobe pattern – ○. The
 $x$
-axis of all three panels is the maximum modal amplitude
 $\hat{a}_{3}$
, the
 $y$
-axis shows (a) the phase difference between
 $a_{0}$
and
 $a_{6}$
, (b) the maximum modal amplitude
 $\hat{a}_{0}$
and (c) the maximum modal amplitude
 $\hat{a}_{6}$
.

In all three panels the
 $x$
-axis is chosen to be the maximum modal amplitude
 $\hat{a}_{3}$
, which can be considered important information for a bubble oscillating predominantly on a mode 3. However, no distinction between large patterns and lobe patterns can be detected by this parameter. In figure 12(a), the
 $y$
-axis represents the phase difference between the mode
 $a_{0}$
and
 $a_{6}$
. Those two modal components are oscillating at the same frequency
 $f_{osc}$
, whereas
 $a_{3}$
is oscillating at
 $f_{osc}/2$
. A clear distinction between lobe patterns and large patterns can be observed. While lobe patterns range around zero phase difference, large patterns range around a phase difference of
 $\unicode[STIX]{x03C0}/8$
or in terms of acoustic period
 $T/16$
. We also show the modal amplitudes
 $\hat{a}_{0}$
, figure 12(b), and
 $\hat{a}_{6}$
, figure 12(c), as functions of
 $\hat{a}_{3}$
. It can be seen that
 $\hat{a}_{0}$
,
 $\hat{a}_{3}$
and
 $\hat{a}_{6}$
are linearly dependent on one another. However, no rule to distinguish large patterns and lobe patterns becomes obvious.
4 Discussion
In this study we present for the first time experimental observations of microstreaming patterns induced by acoustically trapped bubbles far from any boundary. In addition, we are able to correlate the obtained streaming patterns with the bubble dynamics. All previous works are based on bubbles attached to a wall and are in general limited to qualitative observations without considering the bubble dynamics. Among those works, only a few studies discussed microstreaming and bubble dynamics together, and they mainly focussed on the interaction between volume oscillations and translational motion (Marmottant et al. Reference Marmottant, Versluis, de Jong, Hilgenfeldt and Lohse2006b ; Tho et al. Reference Tho, Manasseh and Ooi2007). In rare cases, bubble dynamics is reduced to the presence of a predominant shape mode without taking into account the temporal characteristics of the surface oscillations (Tho et al. Reference Tho, Manasseh and Ooi2007). Temporal bubble dynamics was partly taken in account by Mekki-Berrada et al. (Reference Mekki-Berrada, Combriat, Thibault and Marmottant2016), however limited to the interaction of a pair of bubbles confined between two walls and without a strong surface mode. Bubbles attached to a wall are not ideal candidates to understand streaming induced by interactions including surface instabilities. In fact, those cases can become more complex due to the potential predominance of spherical harmonics of high order (Maksimov & Leighton Reference Maksimov and Leighton2012). In the present work, we use acoustic trapping of a single bubble in an infinite liquid. As observed in previous studies (Guédra et al. Reference Guédra, Cleve, Mauger, Blanc-Benon and Inserra2017) the surface modes that are predominantly excited are zonal harmonics and hence axisymmetric. Consequently, in order to avoid elaborate three-dimensional methods, the axis of symmetry is required to be in the two-dimensional plane of the camera. This is achieved by the method of bubble coalescence (Cleve et al. Reference Cleve, Guédra, Inserra, Mauger and Blanc-Benon2018a ).
A further important result is the observation and classification of the different types of streaming patterns. The three patterns presented in § 3.1 are results that we might expect to observe when considering theoretical models (Maksimov Reference Maksimov2007; Doinikov & Bouakaz Reference Doinikov and Bouakaz2010) that predict the generation of a 2
 $n$
-lobes structure from a shape mode
 $n$
. Indeed we observe four small zones of recirculation for the mode 2, six lobes for the mode 3 and eight lobes for the mode 4. Even though the models contain simplifying assumptions such as small modal amplitudes, the qualitative agreement between experimental and theoretical observations suggests that the models can at least partly account for the observed patterns. They are, however, not adapted for a far-reaching comparison as none of the models contains the complete set of experimental specifications such phase shifts and interactions between several modes.
As then presented in § 3.2, the variety of pattern types is much larger and does not always seem linked to the predominantly oscillating mode at a first glance. To reduce complexity, all patterns can be separated in (i) either lobe patterns with defined lobes around the bubble and streamlines starting and ending on the bubble surface or in (ii) large patterns with streamlines clearly going out of the area of observation. For modes 3 and 4, a distinction between the two types is found. Large patterns are found for bubble sizes below the resonance size of the respective mode, lobe patterns are found for bubble sizes above the resonance size of the respective mode. As presented in figure 11(b), one bubble might produce different types of patterns over time if the bubble size increases or decreases. Transition between different patterns for one and the same bubble have already been observed by Elder (Reference Elder1959) and more recently by Tho et al. (Reference Tho, Manasseh and Ooi2007) for substrate-attached bubbles. Whereas both studies put mode number variations forward to explain the changing patterns, the example presented by Tho et al. (Reference Tho, Manasseh and Ooi2007) also concerns a bubble growing over time.
Because the pattern transition occurs at the resonant radius of the shape mode
 $n$
, intuitive thinking would link this behaviour to a phase shift on the non-spherical oscillation when passing through its modal resonance frequency. A close look at the differential equation ruling the dynamics for shape mode oscillation reveals that such a phase inversion does occur (Guédra & Inserra Reference Guédra and Inserra2018). However, it must be recalled that no microstreaming should be generated from the interaction between two modes oscillating at different frequencies, namely, radial oscillations at the driving frequency and parametrically excited surface oscillations at half the driving frequency. (The calculation of microstreaming always involves time averaging of the product of the two modal components in question, if they oscillate at a different frequency the result is zero.) Other possible explanations are hence needed. In the following we discuss three of them.
(i) At first glance, the classification of the streaming patterns can be linked to the number of excited non-spherical modes and their respective modal amplitudes. Recent theoretical asymptotic developments on non-spherically oscillating bubbles (Guédra & Inserra Reference Guédra and Inserra2018) revealed that higher amplitudes and a richer modal content are expected for bubbles smaller than the resonant size of a given shape mode. Such richer modal content might lead to a larger number of interactions that could possibly induce streaming. Indeed, this might apply for the examples of mode 4. This can however not be generalised for all studied cases. For bubbles with a predominant mode 3, the modal amplitude alone is not sufficient to explain the different classes of patterns (lobe patterns/large patterns) as can be seen in figure 12(b–c).
(ii) Translational oscillation is known to create large-scale streaming patterns when interacting with radial motion (Longuet-Higgins Reference Longuet-Higgins1998). Experimentally, radial motion is present for all bubbles due to acoustic field excitation. Translational motion
 $a_{1}$
is only observed for bubbles showing a predominant shape mode 3 (figures 6 and 9). For a mode 3, theoretical studies predict the appearance of all other modes including translational motion due to nonlinear effects (Shaw Reference Shaw2006). However, the observed translation is not oscillating at the same frequency as the radial mode. It is oscillating at the same frequency as and in phase opposition to the parametrically excited mode 3 and its presence is at least partly due to the post-processing. A bias is induced by the projection of the three-dimensional zonal harmonics of a mode 3 on the two-dimensional projection plane. The two main reasons are, firstly that the projected bubble contour does not equal the theoretical cut through the bubble centre and secondly that the centre of the projected/theoretical area is not equal to the centre of the bubble volume. A short demonstration of those effects is added in appendix A. As it would only be possible to partly correct these effects, we prefer to present the unfiltered results here. Yet, large patterns are also observed for a mode 4, for which energy transfer to translational motion is not expected and not observed. Translational motion alone is hence no global explanation for the differentiation of the pattern types.
(iii) A good candidate to explain why bubbles larger than resonant size (for the corresponding surface mode) lead to lobe patterns and bubbles smaller than resonant size (for the corresponding surface mode) lead to large patterns is the phase difference between different modal components. The strongest modal components are in general those of modes 0 and
 $n$
. But as they do not oscillate at the same frequency, secondary modes have to be considered as well. As presented in figure 12(a), clear evidence is obtained for the phase difference between mode 0 and mode 6 from the present experimental results of a predominant mode 3. This observation cannot be further backed up by the data for predominant mode 4 bubbles due to difficulties in the correct definition of the phase delay. However, the importance of phase differences is also addressed in some theoretical studies, for instance for the radial mode and translation (Longuet-Higgins Reference Longuet-Higgins1998) or for non-spherical modes (Spelman & Lauga Reference Spelman and Lauga2017). Understanding the impact of the phase difference on microstreaming characteristics (patterns and velocities) requires us to control this phase delay. This has been scarcely done in the past and will be of interest for further investigations.
An influence of the bubble position with respect to the pressure maximum as predicted by Rednikov et al. (Reference Rednikov, Zhao, Sadhal and Trinh2006) and Lee & Wang (Reference Lee and Wang1990) could not be observed. This is mainly due to the fact that, experimentally, the bubble stays very close to the pressure maximum whereas those theoretical models suppose large displacements (typically half the distance between a successive pressure node and antinode), which then lead to deformations of the streaming field.
5 Conclusion
We present for the first time a detailed study on streaming patterns induced by an acoustically trapped bubble. We take advantage of the axisymmetry of surface modes to reduce our study to two-dimensional observations, which can also be predicted by existing theoretical models. Our experimental technique allows us to correlate the streaming to the temporal bubble dynamics. We observe different types of streaming patterns. In particular, a classification into two classes of patterns, lobe patterns and large patterns, can be made. Bubbles oscillating predominantly on a mode 2 always lead to large-scale patterns. For higher modes large patterns appear for bubbles smaller than the resonant size of the respective mode, while lobe patterns appear for bubbles larger than resonant size. We further discuss some possible physical mechanisms that lead to this distinction. A good candidate is the observed phase difference between two modes oscillating at the same frequency. A complete theoretical study on the above-mentioned parameters would be necessary to confirm these experimental findings. The derivation of such a model is currently under progress (Doinikov et al. Reference Doinikov, Cleve, Regnault, Mauger and Inserra2019a ,Reference Doinikov, Cleve, Regnault, Mauger and Inserra b ). For practical use in medical applications such as targeted and localised ultrasound-mediated drug delivery a safe prediction between larger and smaller streaming patterns can be very useful as it is important to localise the region of impact.
Acknowledgement
This work was performed within the framework of the Labex CeLyA of the Université de Lyon, within the programme ‘Investissements d’Avenir’ (ANR-10-LABX-0060/ANR-11-IDEX-0007) operated by the French National Research Agency (ANR).
Supplementary movies
Supplementary movies are available at https://doi.org/10.1017/jfm.2019.511.
Appendix
Figure 13 illustrates the bias mentioned in the discussion in § 4, which occurs when projecting a three-dimensional (3-D) bubble oscillating on a mode 3 onto a two-dimensional (2-D) plane. Figure 13(a) shows a theoretical cut through the bubble centre, which would give the exact decomposition over the basis of Legendre polynomials. However, we only see a projection of the bubble, figure 13(b). The most important bias inducing a non-physical translational mode comes from the fact that the 3-D bubble volume has a centre different from the centre of the 2-D bubble projection, see figure 13(c).
Illustration of the two main effects leading to the appearance of a mode 1 while post-processing bubble dynamics of a pure mode 3 (2-D, two-dimensional; 3-D, three-dimensional).



