
1. Introduction
Azimuthally organised coherent structures in the form of wavepackets are shown to play a central role in turbulent jet dynamics where sound generation is concerned (Mollo-Christensen Reference Mollo-Christensen1967). These structures have correlation lengths greater than the integral scales of the turbulence field in which they evolve. Flow visualisations supporting their existence have been reported in studies of forced and natural jets by Crow & Champagne (Reference Crow and Champagne1971) and Moore (Reference Moore1977). Since the first efforts by Crow & Champagne (Reference Crow and Champagne1971), Michalke (Reference Michalke1971) and Crighton & Gaster (Reference Crighton and Gaster1976), wavepacket modelling has relied on some form of the linearised Navier–Stokes equations. Wavepackets are thus interpreted as small amplitude perturbations that evolve on the turbulent mean flow, which acts as an ‘equivalent laminar base flow’ (Crighton & Gaster Reference Crighton and Gaster1976). Recent reviews have been provided by Jordan & Colonius (Reference Jordan and Colonius2013) and Cavalieri, Jordan & Lesshafft (Reference Cavalieri, Jordan and Lesshafft2019).
In subsonic turbulent jets wavepackets undergo spatial growth in the initial region downstream of the jet exit. Studies by Suzuki & Colonius (Reference Suzuki and Colonius2006), Gudmundsson & Colonius (Reference Gudmundsson and Colonius2011) and Cavalieri et al. (Reference Cavalieri, Rodríguez, Jordan, Colonius and Gervais2013) used mean-flow based linear analysis to describe near-field pressure and velocity fluctuations associated with wavepackets; their results illustrate that Kelvin–Helmholtz instability is the main driving mechanism for wavepacket growth until the point at which the wave becomes naturally stable (Crow & Champagne Reference Crow and Champagne1971). Further downstream, various studies show that non-modal mechanisms play an important role for wavepacket dynamics (Jordan et al. Reference Jordan, Zhang, Lehnasch and Cavalieri2017; Tissot et al. Reference Tissot, Lajús, Cavalieri and Jordan2017a; Schmidt et al. Reference Schmidt, Towne, Rigas, Colonius and Brès2018; Lesshafft et al. Reference Lesshafft, Semeraro, Jaunet, Cavalieri and Jordan2019). These non-modal effects are shown to stem from nonlinearities that may be associated with nonlinear wave interactions, or background turbulence. The recent emergence of resolvent analysis of turbulent flows provides a means by which to link the nonlinear and linear dynamics that underpin wavepackets in jets; the nonlinear terms are interpreted as an external forcing that drives the linear flow response (Sharma & McKeon Reference Sharma and McKeon2013). Applications in wall-bounded flows, flow over backward-facing steps, and more recently, in turbulent flames are reported in the works of McKeon & Sharma (Reference McKeon and Sharma2010), Beneddine et al. (Reference Beneddine, Sipp, Arnault, Dandois and Lesshafft2016) and Kaiser, Lesshafft & Oberleithner (Reference Kaiser, Lesshafft and Oberleithner2019).
Spectral proper orthogonal decomposition (SPOD), first proposed by Lumley (Reference Lumley1967), proves to be an effective tool for educing coherent structures in turbulent flows, and has been employed frequently in the analysis of numerical and experimental data of turbulent jets and wall-bounded flows (Citriniti & George Reference Citriniti and George2000; Towne, Schmidt & Colonius Reference Towne, Schmidt and Colonius2018; Lesshafft et al. Reference Lesshafft, Semeraro, Jaunet, Cavalieri and Jordan2019; Muralidhar et al. Reference Muralidhar, Podvin, Mathelin and Fraigneau2019; Abreu et al. Reference Abreu, Cavalieri, Schlatter, Vinuesa and Henningson2020). Furthermore, recent works by Semeraro et al. (Reference Semeraro, Lesshafft, Jaunet and Jordan2016), Towne et al. (Reference Towne, Schmidt and Colonius2018) and Lesshafft et al. (Reference Lesshafft, Semeraro, Jaunet, Cavalieri and Jordan2019) have drawn a parallel between resolvent and SPOD analyses: resolvent response modes and SPOD modes are equivalent if the nonlinear forcing field is spatially white. However, it is clear that the forcing in turbulent flows is not white noise in space, and recent works in wall-bounded turbulence have shown that nonlinear terms are quite structured (Morra et al. Reference Morra, Nogueira, Cavalieri and Henningson2021; Nogueira et al. Reference Nogueira, Morra, Martini, Cavalieri and Henningson2021). Nonetheless, if the resolvent operator has significant gain separation, studied in detail in § 4, the leading response mode from resolvent analysis is expected to be close to the first SPOD mode regardless of the specific details of the forcing, as the much larger gain of the first mode leads to its dominance in the fluctuation statistics (Beneddine et al. Reference Beneddine, Sipp, Arnault, Dandois and Lesshafft2016; Cavalieri et al. Reference Cavalieri, Jordan and Lesshafft2019). Such observations identify SPOD as an ideal signal-processing tool for use in parallel with resolvent analysis.
For Strouhal numbers – based on jet-exit values – above  $St>0.3$ and a range of azimuthal modes, wavepacket development appears to undergo a two-stage process (Schmidt et al. Reference Schmidt, Towne, Rigas, Colonius and Brès2018; Lesshafft et al. Reference Lesshafft, Semeraro, Jaunet, Cavalieri and Jordan2019): initial wavepacket evolution can be characterised using an optimal resolvent response mode with an associated forcing mode, either localised near (Schmidt et al. Reference Schmidt, Towne, Rigas, Colonius and Brès2018) or distributed within (Lesshafft et al. Reference Lesshafft, Semeraro, Jaunet, Cavalieri and Jordan2019) the nozzle, and with virtually zero support in the downstream region. This leads to spatially amplifying disturbances due to the Kelvin–Helmholtz instability mechanism. Beyond the point where the turbulent mean flow becomes locally, neutrally stable, non-modal effects become important and wavepackets may undergo a spatial non-modal growth underpinned by the Orr mechanism (Tissot et al. Reference Tissot, Lajús, Cavalieri and Jordan2017a,Reference Tissot, Zhang, Lajús, Cavalieri and Jordanb), which is activated/excited by nonlinear flow interactions that can be modelled as a volumetric forcing of the linear operator in the resolvent framework. The same non-modal mechanism is also shown to underlie wavepacket development at low frequencies in the initial shear-layer region of the jet, which the modal stability models fail to characterise (Cavalieri et al. Reference Cavalieri, Rodríguez, Jordan, Colonius and Gervais2013; Breakey et al. Reference Breakey, Jordan, Cavalieri, Nogueira, Léon, Colonius and Rodríguez2017).
1.1. Nozzle-exit conditions and their effect on sound generation
Many studies have explored the effect of (initial) nozzle-exit conditions on flow development in jets (Bradshaw Reference Bradshaw1966; Batt Reference Batt1975; Hill, Jenkins & Gilbert Reference Hill, Jenkins and Gilbert1976; Hussain & Zedan Reference Hussain and Zedan1978a,Reference Hussain and Zedanb). These studies have informed and guided research efforts to explore the sensitivity of jet-noise radiation to the initial conditions. The state of the nozzle-exit boundary layer is documented to impact sound generation in subsonic jets (Mollo-Christensen Reference Mollo-Christensen1967; Maestrello & McDaid Reference Maestrello and McDaid1971; Grosche Reference Grosche1974).
Jets with initially laminar boundary layers are shown to emit greater far-field noise than those with disturbed laminar boundary layers with high turbulence intensities ( $u^{\prime }/{U_j} \approx 0.1$) (Zaman Reference Zaman1985; Viswanathan & Clark Reference Viswanathan and Clark2004; Zaman Reference Zaman2012). The augmented noise is shown to be associated with vortex roll-up and pairing dynamics in the initial region of the jet, observed experimentally by Zaman & Hussain (Reference Zaman and Hussain1981), Bridges & Hussain (Reference Bridges and Hussain1987) and in numerical simulations (Bogey & Bailly Reference Bogey and Bailly2010). The observed differences are particularly pronounced at higher frequencies (
 $St>1$). Fontaine et al. (Reference Fontaine, Elliott, Austin and Freund2015) studied the effect of turbulent boundary layers with different thicknesses but with similar turbulence intensities, and showed that a thicker boundary layer resulted in up to 3 dB reduced far-field sound at low polar angles. The authors assert that because the thicker shear layer has a missing ‘initial thickness’ at the nozzle exit, the potential core closes earlier, leading to a more constricted volume for sound generation. This results in noise reduction at high frequencies; the associated sound was found to scale with the momentum thickness of the exit shear layer.
Drawing on a wide range of numerical and experimental studies cited above, Brès et al. (Reference Brès, Jordan, Jaunet, Le Rallic, Cavalieri, Towne, Lele, Colonius and Schmidt2018) recently explored the relevance of nozzle-exit conditions for jet-noise radiation using a large-eddy simulation of an isothermal  $M=0.9$ jet, and provided a meticulous account of the relation between jet noise and boundary layers at the nozzle exit. The authors conducted a parametric study to characterise the effects of wall modelling, grid refinement near the nozzle interior surface and implementation of synthetic turbulence on the downstream flow development and far-field noise. Comparisons with a companion experiment with a turbulent nozzle-exit boundary layer (Cavalieri et al. Reference Cavalieri, Rodríguez, Jordan, Colonius and Gervais2013) emphasised the importance of application of the three methods for predicting flow development and sound radiation. Consistent with the earlier findings in the literature, initially laminar jets are found to emit more noise at high frequencies. Results of the linear stability analysis of the near-nozzle mean flow for the low azimuthal modes, which are shown to be important for sound generation, suggest that this difference is associated with greater amplification of the Kelvin–Helmholtz mode near the nozzle exit at high frequencies for laminar jets.
Over the past decades, significant insights are obtained on wavepackets and their importance for sound radiation in turbulent jets. Their signatures, both in the near and far fields, are observed; and the associated dynamics can be described using linear models. But there remain many questions, and among these: What fixes the amplitudes of wavepackets? Nonlinear turbulent interactions in the region downstream of the jet exit and/or upstream conditions? Nozzle-exit boundary-layer conditions are shown to influence both noise generation and jet turbulence. However, it is not clear what role upstream conditions play in the evolution of downstream wavepackets. This raises a question regarding the eventual presence of wavepackets in the upstream region of the nozzle exit, the relationship between these and downstream wavepackets, and the modelling framework that would describe such structures within the nozzle.
With these questions in mind, we explore the dynamics of a turbulent nozzle boundary layer of a  $M=0.4$ jet and broadly address the following three research questions using a high-fidelity large-eddy simulation database. (1) Characterisation of the dynamics of the nozzle boundary layer for low azimuthal wavenumbers. (2) The connection between the associated flow structures in the nozzle and wavepackets in the downstream region of the jet. (3) Modelling these structures using the linearised Navier–Stokes equations.
The paper is organised around four sections. Section 2 introduces the large-eddy simulation. We characterise the mean nozzle boundary-layer properties and its azimuthal structure, and move on to explore how low-order nozzle dynamics are connected to wavepackets in the downstream region of the jet in § 3. The last section is devoted to the characterisation and modelling of flow structures identified in the preceding section. Motivated by the success of linear theory in modelling wavepackets downstream of the jet exit, § 4 attempts to model low-order azimuthal nozzle boundary-layer structures using input–output or resolvent analysis. Conclusions and future avenues for research close the paper.
2. Numerical database: large-eddy simulation of a  $M=0.4$ turbulent jet

The numerical database used is provided by a high-fidelity large-eddy simulation (LES) of a subsonic isothermal axisymmetric turbulent jet, using the compressible flow solver ‘Charles’ developed at Cascade technologies (Brès et al. Reference Brès, Ham, Nichols and Lele2017; Brès & Lele Reference Brès and Lele2019). The characteristic scales used in the non-dimensionalisation of velocity, length and time are jet-exit velocity  $U_j$, jet diameter
 $D$ and
 $t=D/U_j$, respectively. The Reynolds and Mach numbers of the jet with the selected scales are
 $Re={U_{j}D}/{\nu } \simeq$ 450 000
 $M=U_j/{c_{\infty }}=0.4$, respectively. This database is an extension of the previous work by Brès et al. (Reference Brès, Jordan, Jaunet, Le Rallic, Cavalieri, Towne, Lele, Colonius and Schmidt2018) and validated for the same nozzle configuration at
 $M=0.9$. The cylindrical coordinate system is centred at the jet exit in the computational domain which extends over
 $-10< x<50$ in the axial direction and spreads from
 $r=20$ to
 $r=50$ in the radial direction in the jet.
Wall modelling and near-wall adaptive mesh refinement are employed on the internal nozzle surface, in addition to synthetic turbulence boundary conditions over  $-2.8< x<-2.5$ to mimic the boundary-layer trip in the experiment. The near-wall resolution was chosen based on an initial estimate of the nozzle-exit boundary-layer thickness in the companion experiment by Cavalieri et al. (Reference Cavalieri, Rodríguez, Jordan, Colonius and Gervais2013) to produce approximately 10–20 LES cells in the developing boundary-layer region. The resulting wall-normal grid spacing in wall units
 $y^{+}_{LES}$ is of order O(70), and of order O(100) for the streamwise and azimuthal grid spacings for the present case. Therefore, the physics of the viscous sublayer is described using wall modelling, and, therefore, the results in the (very) near-wall region should be considered with caution. Nevertheless, main boundary-layer dynamics, and in particular structures as large as the boundary-layer thickness are well resolved and accurately captured in the LES, as comparison with experimental measurements will show in a later stage of the paper. The total simulation time in acoustic units is
 ${t}={t{c_{\infty }}/D}=2000$ and the flow field is sampled with time intervals of
 ${\Delta t}={\Delta t{c_{\infty }}/D}=0.2$, where
 ${c_{\infty }}$ denotes the free-stream speed of sound. The corresponding sampling Strouhal number
 $St_{s}$ based on jet-exit velocity and diameter is
 $St_{s}=\,f_{s}D/{U_j}=12.5$ (
 $\,f_{s}=1/{\Delta t}$), providing 10 000 snapshots of the flow. The flow is simulated on an unstructured mesh; the LES data are interpolated onto a structured cylindrical grid and its parameters are summarised in table 1. A comprehensive description of the numerical simulation and the nozzle interior flow modelling can be found in Brès et al. (Reference Brès, Ham, Nichols and Lele2017, Reference Brès, Jordan, Jaunet, Le Rallic, Cavalieri, Towne, Lele, Colonius and Schmidt2018).
Grid parameters of the large-eddy simulation of the  $M=0.4$ jet.

3. Analysis of nozzle flow
3.1. Nozzle mean-flow properties and single-point statistics
The objective of this section is to characterise the mean-flow state throughout the nozzle. Displacement  $\delta _1$ and momentum
 $\theta$ thicknesses of the nozzle boundary layer are estimated as
 $$\begin{gather} {\delta_{1}}(x)=\int_{0.5}^{0} \left(1-\frac{\overline{u_{x}}(x,r)}{\overline{u_{x}}(x,0)} \right) \textrm{d}r, \end{gather}$$
 $$\begin{gather}{\theta}(x)=\int_{0.5}^{0} {\frac{\overline{u_{x}}(x,r)}{\overline{u_{x}}(x,0)}} \left(1-\frac{\overline{u_{x}}(x,r)}{\overline{u_{x}}(x,0)} \right) \textrm{d}r, \end{gather}$$
where  $\overline {(.)}$ refers to time- and azimuthal-averaged values;
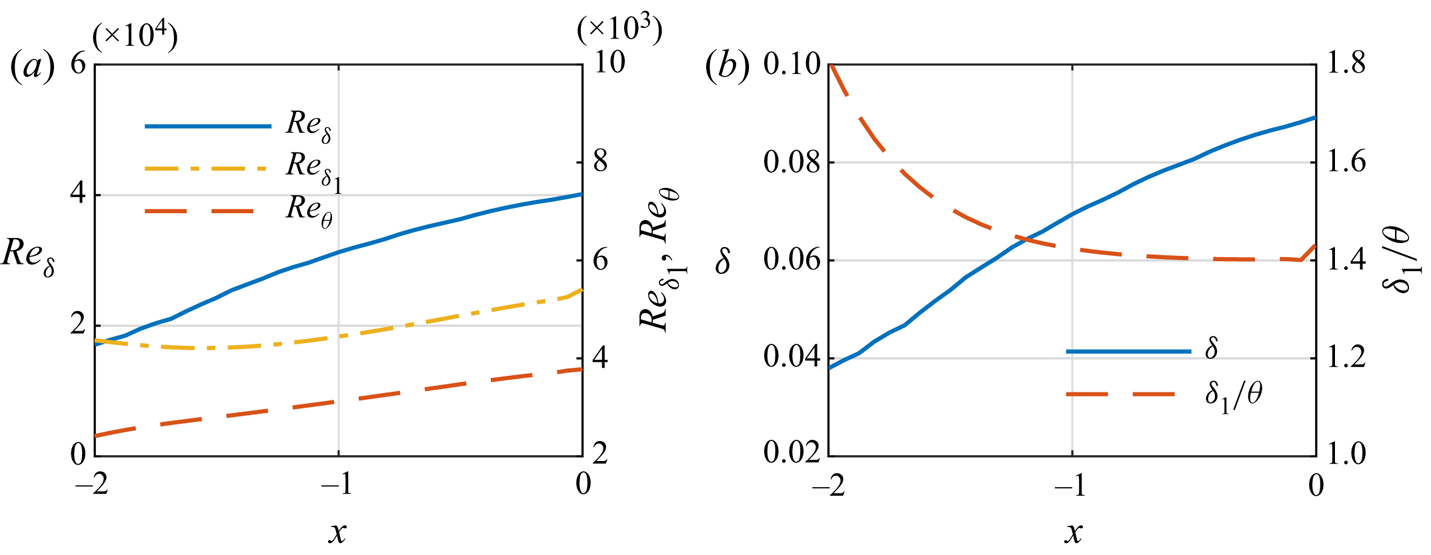
 $u_x$ denotes streamwise velocity. Figure 1(a) shows the streamwise evolution of Reynolds number in terms of boundary-layer units. Nozzle-exit values of the boundary-layer parameters are summarised in table 2; these are compared with estimations made from hot-wire measurements in the corresponding experiment (Cavalieri et al. Reference Cavalieri, Rodríguez, Jordan, Colonius and Gervais2013), revealing a good agreement and suggesting that the boundary layer is turbulent at the nozzle exit, which is also corroborated by the value of shape factor
 $H=\delta _{1}/\theta$ approaching a value typical for zero-pressure-gradient boundary layers in figure 1(b) (Schlichting & Gersten Reference Schlichting and Gersten2016, p. 423). The LES of the same nozzle with an operation condition
 $M=0.9$ has been previously validated against the experiments in terms of nozzle-exit conditions. Here the current comparisons serve as a prior validation of these conditions for
 $M=0.4$ so they are not analysed further – rather the object of the analysis is the interior nozzle dynamics.
Streamwise evolution of (a) Reynolds number based on nozzle boundary-layer outer units and (b) nozzle boundary-layer thickness and shape factor  $H={{\delta }_{1}}/{\theta }$ for
 $M=0.4$ jet.

Nozzle-exit boundary-layer integral parameters for the  $M=0.4$ turbulent jet. Experimental results are reported in Cavalieri et al. (Reference Cavalieri, Rodríguez, Jordan, Colonius and Gervais2013). Boundary-layer thickness
 $\delta _{99}$ is estimated as the wall-normal distance at which velocity reaches 99 % of the local mean centreline velocity
 $U_c$. The Reynolds number based on the integral parameters is defined as
 $Re_{\delta }={U_{c}{\delta }}/{\nu }$ and
 $Re_{\theta }={U_{c}{\delta }}/{\nu }$.

The straight circular cross-section and thin boundary layer ( $\delta /r\ll 1$) allows curvature effects to be neglected and the mean turbulent nozzle boundary layer to be approximated as a flow over a flat plate (see Schlichting & Gersten Reference Schlichting and Gersten2016, p. 446). Velocity profiles can thus be compared with results obtained from experimental and numerical data available in the literature. Schlatter & Örlü (Reference Schlatter and Örlü2010) computed a canonical flat-turbulent-boundary layer using direct numerical simulation (DNS), providing well-resolved boundary-layer profiles at varying momentum-thickness-based Reynolds numbers, that facilitate an evaluation of the current nozzle profiles in terms of inner and outer units. The velocity scale for inner units is given by friction velocity
 $u_{\tau }/{U_c}=\sqrt {c_f/2}$, where
 $c_f$ refers to the skin-friction coefficient with local nozzle centreline velocity
 $U_{c}$. The associated length scale simply becomes
 $\nu /u_{\tau }$ and the distance from the nozzle surface (
 $y=0.5-r$) and mean velocity scaled in inner units are written respectively as
 $y^{+}={u_{\tau }} {y}/{\nu }$ and
 $U^{+}=U/{u_{\tau }}$.
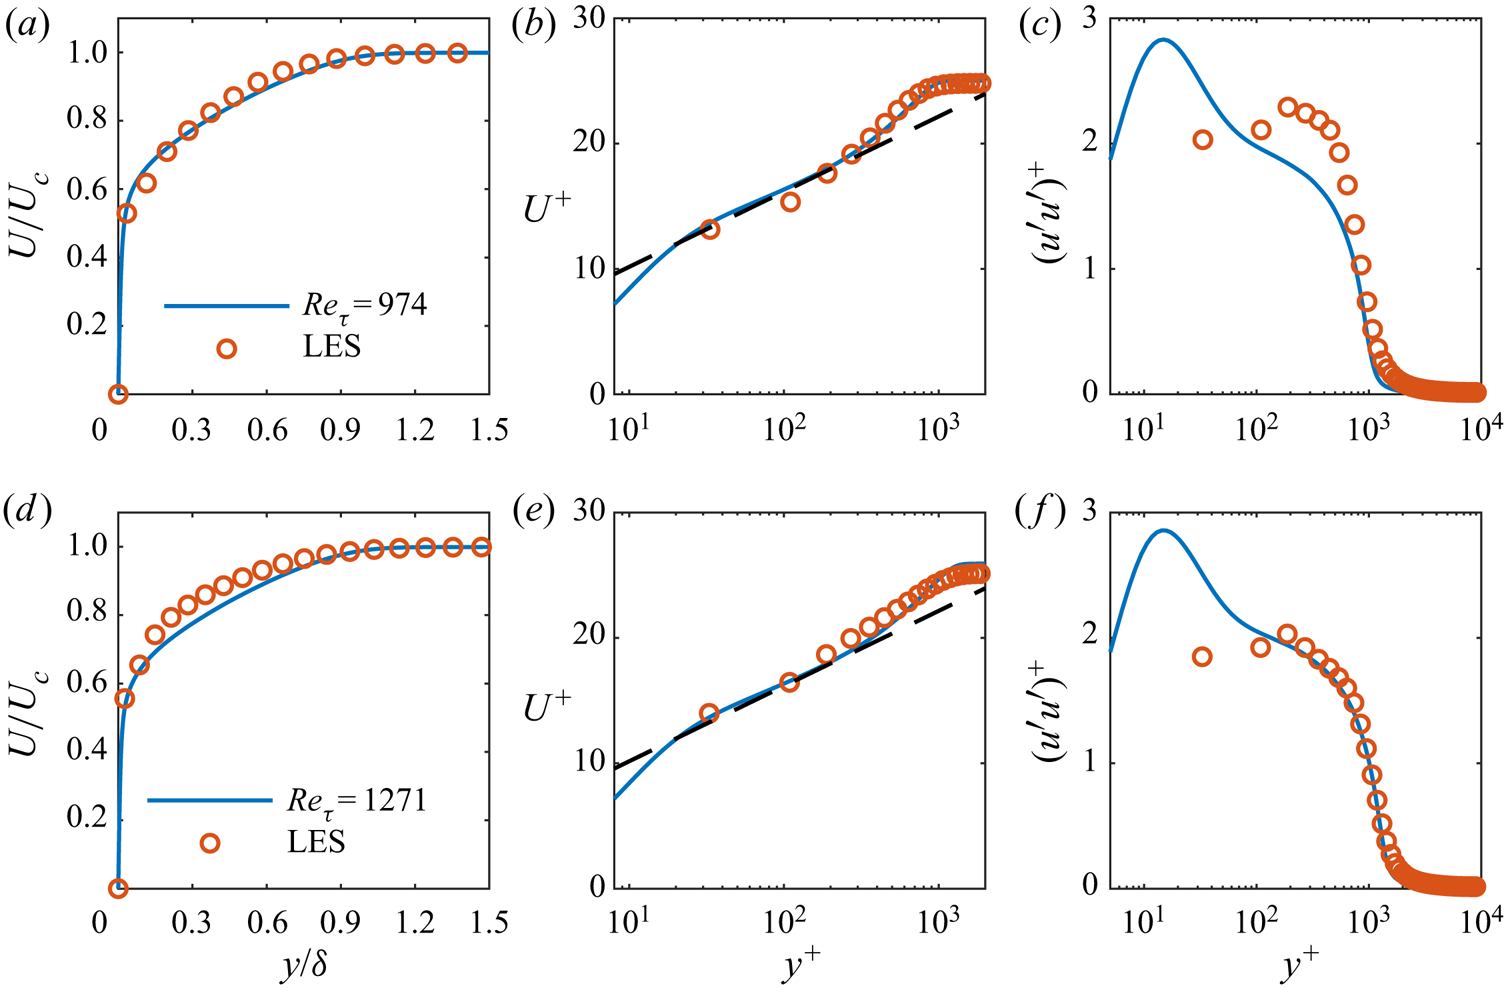
The mean LES and DNS profiles are compared for two streamwise positions, at which the friction Reynolds numbers  $Re_{\tau }={u_{\tau }{\delta }/{\nu }}$ are equivalent. At
 $x=-1.5$, the LES mean velocity profile already shows reasonable agreement with the DNS profile in figure 2 and collapses with a slope proportional to
 $1/\kappa$ in the overlap region – though the variance of streamwise velocity fluctuations is overestimated (figure 2c). Further downstream at
 $x=-0.95$, figure 2(f) shows that the LES variance profile compares very well with those of DNS, and likewise the mean velocity profile fits reasonably to the power and log laws (figure 2d,e). Overall, the comparisons corroborate the idea that the LES nozzle boundary layer develops into a turbulent regime far upstream of the nozzle exit and its large-scale dynamics are captured by the LES.
Nozzle boundary-layer profiles at  $x=-1.5$ (a–c) and
 $x=-0.95$ (d–f): mean velocity in (a,d) outer and (b,e) inner variables; (c,f) streamwise Reynolds stress in inner variables. Direct numerical simulation data are taken from Schlatter & Örlü (Reference Schlatter and Örlü2010) at
 $Re_{\tau }=974$ and
 $1271$. Dashed lines in (b,e) are logarithmic law
 $U^{+}=({{1}/{\kappa }})\log (y^{+})+C$ with
 $\kappa =0.384$ and
 $C=4.17$.

3.2. Azimuthal structure of nozzle flow
The azimuthally periodic fluctuation field  $q(x,r,\theta ,t)$ – containing streamwise, radial and azimuthal velocities
 $u_x$,
 $u_r$,
 $u_{\theta }$, respectively, density
 $\rho$ and temperature
 $T$ – is first decomposed into Fourier modes
 \begin{equation} q(x,r,\theta,t)={\sum_m}{\tilde{q}}_{m}(x,r,t) \textrm{e}^{\textrm{i}m\theta}, \end{equation}
where  ${\tilde {q}}_{m}$ is the modal amplitude associated with azimuthal wavenumber
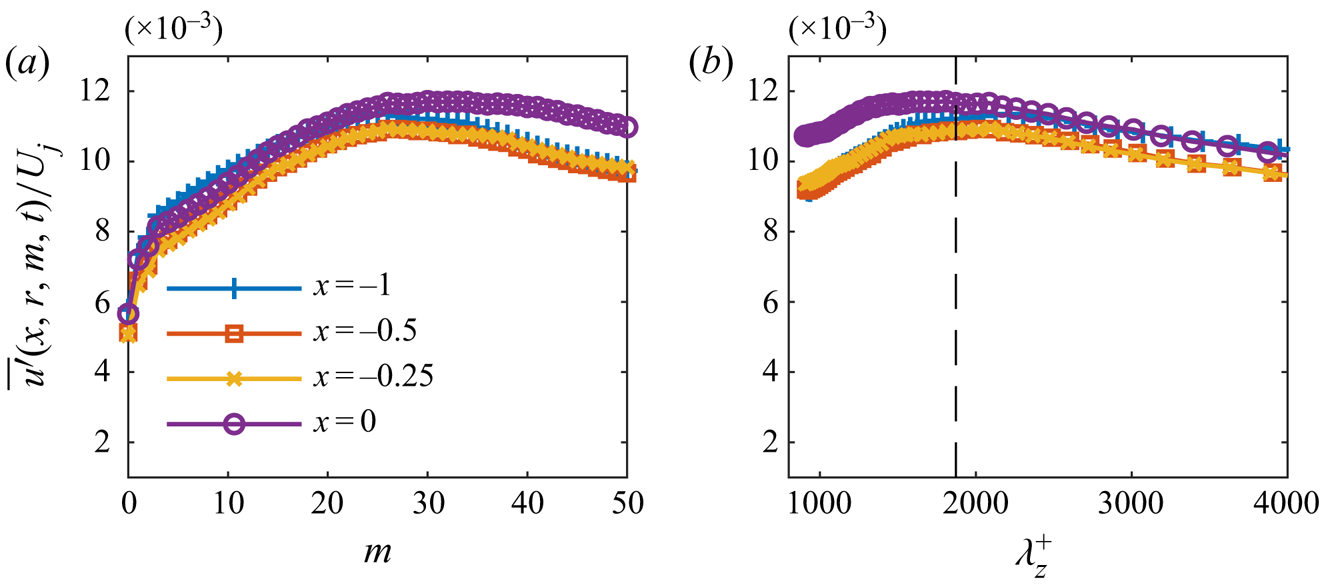
 $m$. Figure 3 shows the energy distribution of streamwise velocity fluctuations as a function of azimuthal wavenumber along
 $y^{+} \approx 185$ at several axial positions. It is seen that a large proportion of energy resides predominantly in higher-order azimuthal modes, and the peak is located at
 $m\approx 23$ for
 $x=-1$. Once the spectrum is presented as a function of the pseudo-spanwise wavenumber,
 $\lambda _z=2{\rm \pi} r/m$, the peak scales with boundary-layer thickness
 $\lambda _z / \delta \approx 1.5$. This matches results for the outer peak at
 $\lambda _z / \delta \approx 1$ in turbulent boundary layers (Eitel-Amor, Örlü & Schlatter Reference Eitel-Amor, Örlü and Schlatter2014). These fluctuations, with azimuthal wavelength of the order of the boundary-layer thickness, correspond to turbulent motions referred to as superstructures (Smits, McKeon & Marusic Reference Smits, McKeon and Marusic2011), which are elongated in the streamwise direction. These are the dominant structures in the velocity fluctuations far from the wall. However, with respect to the question we address, low azimuthal wavenumbers have non-zero amplitudes throughout the nozzle. Since the jet wavepackets related to the peak sound radiation have a low azimuthal wavenumber, it is indeed these components of the nozzle flow that we explore, in terms of their connection with downstream wavepackets and the modelling framework that would describe their behaviour within the nozzle.
Root mean square of streamwise velocity fluctuations as a function of azimuthal wavenumber at  $r=0.4895$,
 $y^{+} \approx 185 - 188$: (a) scaled with the jet radius, (b) in pseudo-spanwise coordinates. The dashed line indicates 1.5
 $\delta _{99}$ at
 $x=-1$.

3.3. Wavepackets in the nozzle
Under the assumption of ergodicity, different temporal segments of the signal can be treated as statistically independent realisations. The entire time signal is partitioned into 50 % overlapping blocks containing 256 snapshots, providing  $N_b=78$ independent realisations. Short-time Fourier transforms are applied to each realisation to obtain the Fourier modes
 ${\hat {q}}_{m\omega }$,
 \begin{equation} {\tilde{q}}_{m}(x,r,t)=\int_{\omega}{\hat{q}}_{m\omega}(x,r) \textrm{e}^{-\textrm{i}\omega t}\,\textrm{d}\omega, \end{equation}
where  $\omega =2 {\rm \pi}St$ refers to angular frequency. A Hann window is applied to time segments to mitigate spectral leakage. Estimates of power spectral density (PSD) for a given frequency – azimuthal wavenumber (hereafter
 $m-\omega$) pair can be found using
 \begin{equation} {\hat{P}}_{qq}(x,r)=\frac{1}{N_{b}}\sum_{i=1}^{N_{b}} {\hat{q}}_{m\omega}^{(i)}(x,r){\hat{q}}_{m\omega}^{*(i)}(x,r), \end{equation}
where  ${\hat {q}}_{m\omega }^{(i)}$ is the
 $i$th segment,
 ${\hat {q}}_{m\omega }^{*(i)}$ its complex conjugate and
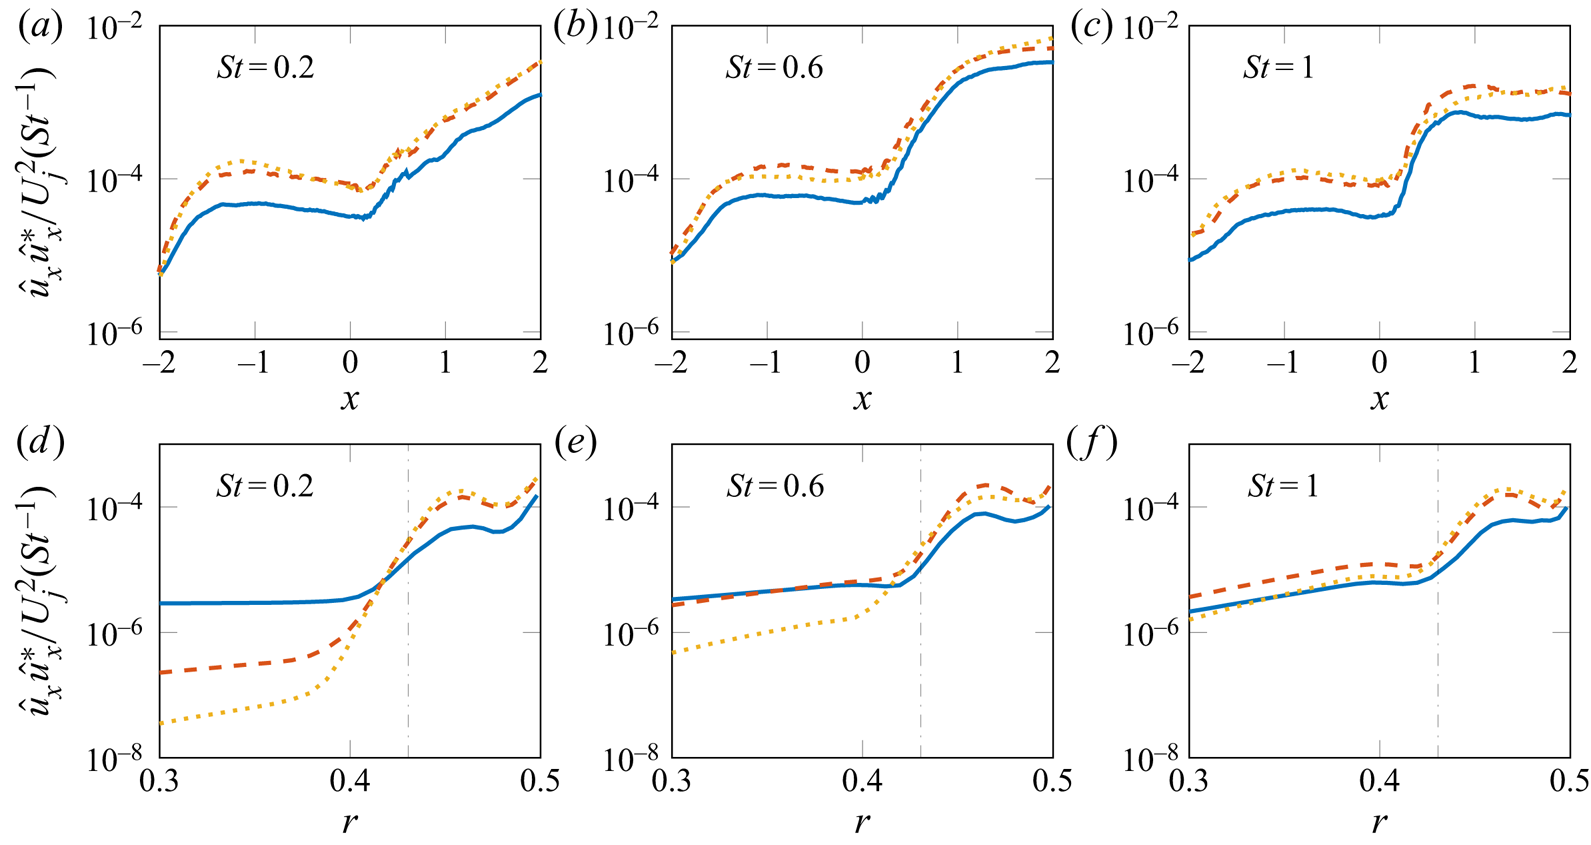
 $N_b$ is the total number of realisations. Figure 4(a–c) tracks the axial envelope of the streamwise velocity fluctuations of the first three azimuthal modes along
 $r=0.45$, for three representative frequencies. All
 $m-\omega$ pairs of interest undergo a similar evolution: fluctuations experience a steep exponential growth in the initial region of the nozzle that ceases approximately around
 $x=-1$; there is then a slower amplitude decline – with frequency dependent decay rate – towards the jet-exit plane. Their amplitudes then amplify dramatically downstream of the jet exit. Finally, figure 4(d–f) presents the radial structure of the streamwise velocity component of the modes in the nozzle, revealing structures as large as the local boundary-layer thickness. In what follows, we explore whether the dynamics of these low-order nozzle structures are correlated with the downstream jet dynamics.
Power spectral density of streamwise velocity fluctuations for  $M=0.4$ jet. (a–c) Axial envelopes at
 $r=0.45$. (d–f) Radial profiles at
 $x=-1$; local boundary thickness (dash dotted). Azimuthal mode
 $m=0$ represented by a blue solid line,
 $m=1$ by an orange dashed line and
 $m=2$ by a yellow dotted line.

The foregoing results provide an initial characterisation of the flow dynamics upstream of the nozzle exit, that shows the turbulent nozzle flow to contain low-order azimuthal structures comparable in size to the thickness of the nozzle boundary layer. The first three azimuthal modes ( $m=0,1,2$), whose downstream jet counterparts are important for sound generation, comprise a small percentage of the total turbulent kinetic energy, similar to what is observed in the jet. We now look to establish whether the dynamics of these low-order nozzle structures are correlated with their counterparts in the free jet by means of cross-spectral density (CSD).
Using the Fourier modes obtained from (3.4), CSD between a correlation point ( $x^{\prime },r^{\prime }$) and all other points (
 $x$,
 $r$) in the flow domain for a given
 $m-\omega$ pair can be computed as
 \begin{equation} {\hat{C}}_{qq}(x,r,x^{\prime},r^{\prime},m,\omega)=\frac{1}{N_{b}}\sum_{i=1}^{N_{b}} {\hat{q}}_{m\omega}^{(i)}(x,r){\hat{q}}_{m\omega}^{*(i)}(x^{\prime},r^{\prime}). \end{equation}
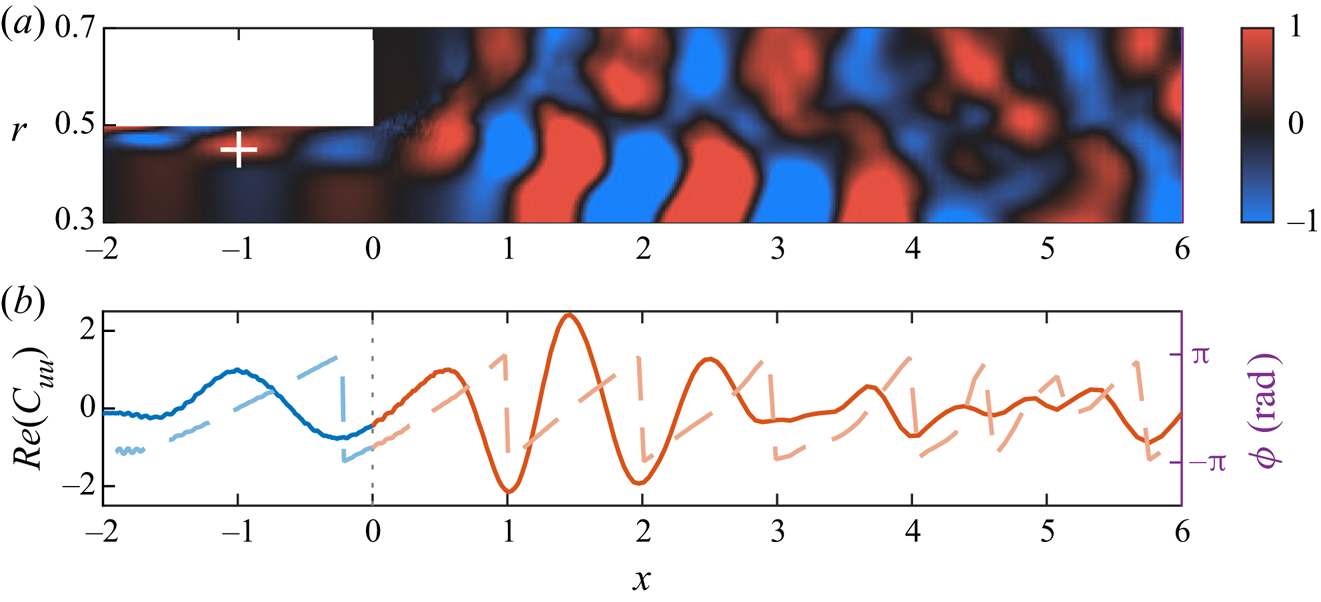
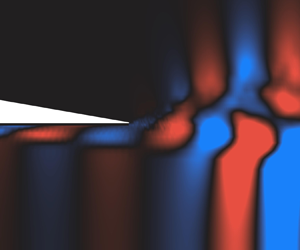
Figure 5 shows the CSD of the axisymmetric streamwise velocity field with respect to a reference correlation point within the nozzle boundary layer for  $St=0.6$, highlighting wavepacket activity both upstream and downstream of the jet exit, and significant correlations between these. This and the axial envelope plotted in figure 5(b) illustrate a synchronisation between structures in the nozzle boundary layer and jet wavepackets, suggesting that internal nozzle dynamics are strongly related to external jet dynamics.
Cross-spectral density of axisymmetric streamwise velocity fluctuations with the ‘ $+$’ indicating the reference point for
 $St=0.6$: (a) CSD animation: blue-black-red colour map,
 $\pm$ 1 of the PSD at the reference point (supplementary movie available at https://doi.org/10.1017/jfm.2021.566); (b) axial envelope on
 $r=0.45$: real part (solid line); phase angle (dashed line). The vertical dotted line indicates the nozzle exit. Colour map is courtesy of Kovesi (Reference Kovesi2015).

3.4. Spectral proper orthogonal decomposition
We now use SPOD as a basis to find coherent structures of low azimuthal order in the nozzle boundary layer and the downstream region of the turbulent jet, and to further probe the connection between the nozzle and the jet regions. Similar to the previous section, this analysis is concerned with the first three azimuthal modes of the flow field. Spectral proper orthogonal decomposition provides an orthogonal basis of modes according to their energy at a given frequency. The basis provides an optimal compression in terms of the fluctuation energy with respect to a specified norm. Our SPOD analysis draws on the procedure proposed by Towne et al. (Reference Towne, Schmidt and Colonius2018), which we briefly outline here.
To perform SPOD, the Fourier realisations obtained in (3.4) are first stored in a matrix  $Q_{m\omega }$ for each
 ${m-{\omega }}$ pair,
 \begin{equation} {\boldsymbol{Q}}_{m\omega}=\left[{\hat{q}}_{m\omega}^{(1)}, {\hat{q}}_{m\omega}^{(2)}, {\hat{q}}_{m\omega}^{(3)}, \ldots.. , {\hat{q}}_{m\omega}^{(N_{b})}\right]. \end{equation}
From this, a global two-point CSD matrix  ${\boldsymbol {S}}_{m\omega }$ is calculated as
 \begin{equation} {\boldsymbol{S}}_{m\omega}= {\boldsymbol{Q}}_{m\omega} {\boldsymbol{Q}}_{m\omega}^{\mathsf{H}}, \end{equation}
with  $(\cdot ){{}^{\mathsf {H}}}$ denoting Hermitian transpose. Finally, SPOD modes are obtained through eigendecomposition of the weighted CSD matrix,
 \begin{equation} {\boldsymbol{S}}_{m\omega}{\boldsymbol{W}}= {\boldsymbol{\varPsi}}_{m\omega} {\boldsymbol{\varLambda}}_{m\omega} {\boldsymbol{\varPsi}}_{m\omega}^{{-}1}. \end{equation}
Here,  ${\boldsymbol {\varPsi }}_{m\omega }$ is the set of SPOD modes for a given
 $m-\omega$ pair, and its
 $i\textrm {th}$ column corresponds to the
 $i\textrm {th}$ SPOD mode
 ${\psi }^{i}$. The modes are ranked according to their energies contained in the diagonal eigenvalue matrix
 ${\boldsymbol {\varLambda }}_{m\omega }=\textrm {diag}(\lambda ^{1},\lambda ^{2},\ldots ,\lambda ^{N_b})$. The mode with the highest energy is referred to as the leading or optimal mode and the lower energy modes are accordingly called suboptimal modes. Here
 ${\boldsymbol {W}}$ is the weight matrix associated with numerical spatial integration and the compressible energy norm (Chu Reference Chu1965; Hanifi, Schmid & Henningson Reference Hanifi, Schmid and Henningson1996) based on which an inner product is defined. The SPOD modes satisfy the orthogonality relation under this weight,
 \begin{equation} {\langle \psi^{i},\psi^{j} \rangle}_{\boldsymbol{W}}={\delta}_{ij}, \end{equation}
with  $\langle \cdot ,\cdot \rangle$ the inner product. As shown by Towne et al. (Reference Towne, Schmidt and Colonius2018), the modified cross-spectral matrix
 ${\hat {\boldsymbol {S}}}_{m\omega }= {\boldsymbol {Q}}_{m\omega }^{\mathsf {H}} {\boldsymbol {W}} {\boldsymbol {Q}}_{m\omega }$ has the same non-zero eigenvalues as (3.9),
 \begin{equation} {\hat{\boldsymbol{S}}}_{m\omega}{\boldsymbol{\xi}}_{m\omega}= {\boldsymbol{\xi}}_{m\omega} {\tilde{\boldsymbol{\varLambda}}}_{m\omega}, \end{equation}
and the eigenvectors associated with the non-zero eigenvalues can be obtained through
 \begin{equation} {\tilde{\boldsymbol{\varPsi}}}_{m\omega}= {\boldsymbol{Q}}_{m\omega} {\boldsymbol{\xi}}_{m\omega} {\tilde{\boldsymbol{\varLambda}}}_{m\omega}, \end{equation}
which renders the extraction of SPOD modes from large data more straightforward.
The weight matrix  ${\boldsymbol {W}}$ allows extracting SPOD modes to optimally describe dynamics in a specified flow domain (Freund & Colonius Reference Freund and Colonius2009). Two choices are considered in employing this weight. Firstly, we seek modes that maximise the energy downstream of the jet exit and, hence, attribute zero weight to the nozzle region. These modes are referred to as ‘jet-weighted’ SPOD modes. Subsequently, the region downstream of the jet exit is excluded to identify energy maximising modes in the nozzle; these are accordingly called ‘nozzle-weighted’ SPOD modes.
3.4.1. Convergence analysis
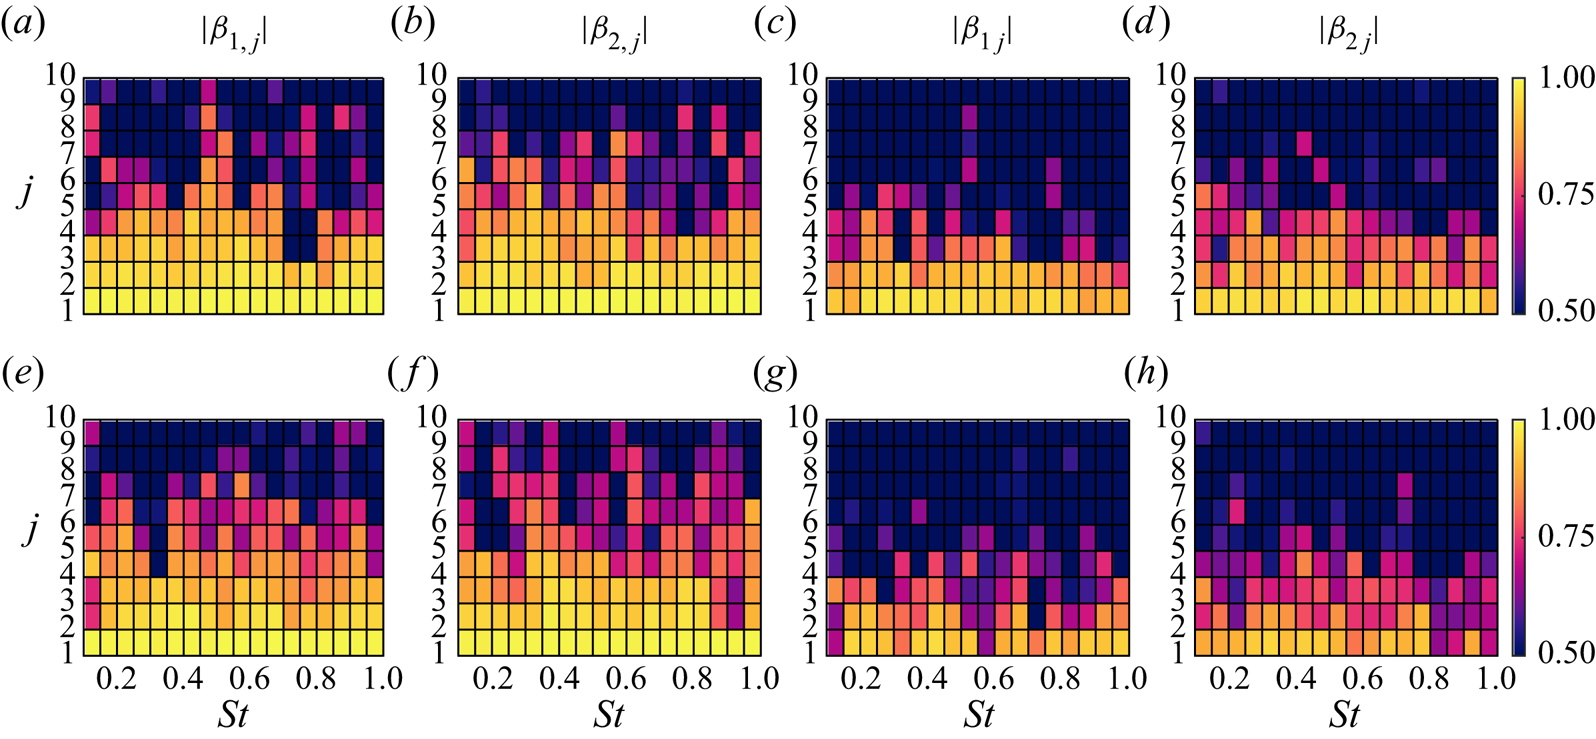
In addition to the SPOD analysis with the full data, we also conduct a convergence study by splitting the data into two subsets, each comprising half of the original set, and compute SPOD modes using each subset. A normalised inner product  $\beta _{i,j}$ between each SPOD mode
 $\psi _j$ educed from the full data and
 $\psi _{i,j}$ from subsets is then computed to evaluate the convergence for every
 $m-\omega$ pair,
 \begin{equation} \boldsymbol{\beta}_{\boldsymbol{i},\boldsymbol{j}}(m,St)=\frac{\langle \psi_{i,j}, \psi_{j} \rangle}{{\left \| \psi_{i,j} \right \|}_{W} {\left \| \psi_{j} \right \|}_{W}}, \end{equation}
where the subscript  $i$ denotes the indices of subsets,
 $j$ corresponds to the
 $j\textrm {th}$ SPOD mode and
 ${ \| \cdot \|}$ refers to modulus. This expression leads to correlation coefficients with values between 0 and 1, where
 $\boldsymbol {\beta }\approx 1$ for a given SPOD mode indicates a statistical convergence, i.e. the SPOD mode maintains its spatial organisation with an increasing number of realisations.
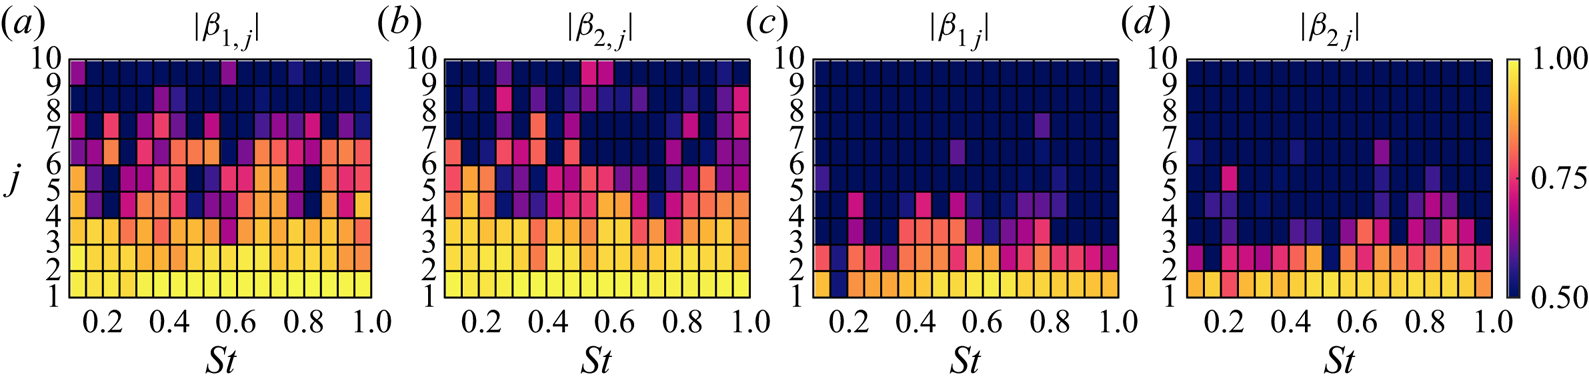
Figure 6 shows the correlation map obtained for the axisymmetric mode. It shows reasonably converged optimal modes both in ‘jet-weighted’ and ‘nozzle-weighted’ SPOD analyses, with correlation coefficients greater than 0.8. In the ‘nozzle-weighted’ SPOD the level of agreement is retained for the first two suboptimal modes for most frequencies; whereas in the ‘jet-weighted’ SPOD the correlation is around 0.6–0.7 for the first suboptimal modes, and drops to low levels for higher-order modes. The results altogether indicate that both SPOD analyses provide converged optimal modes for the modes we focus on throughout the paper. We observe similar trends for other  $m-\omega$ modes, and provide their convergence maps in Appendix A.
Convergence maps of SPOD modes for  $m=0$: (a,b) ‘nozzle-weighted’ SPOD modes; (c,d) ‘jet-weighted’ SPOD modes.

3.4.2. Energy spectra
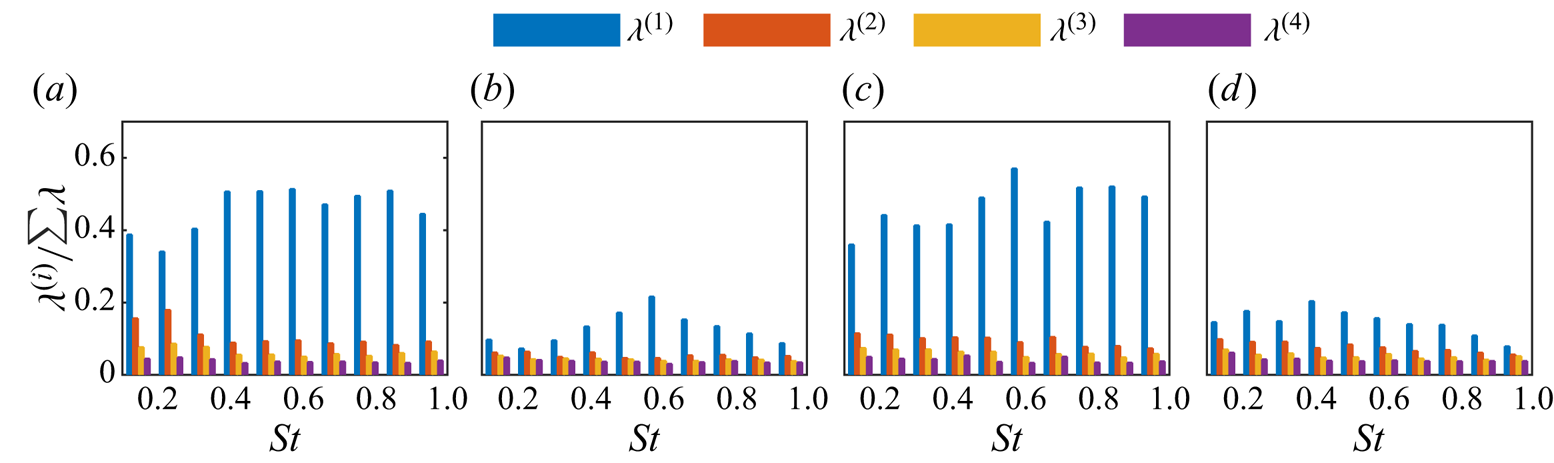
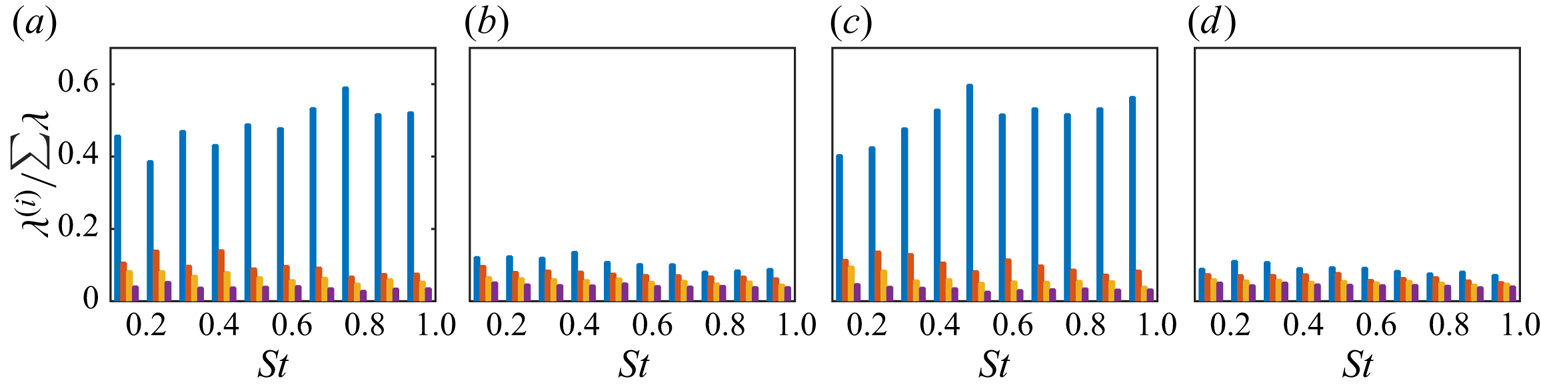
The SPOD eigenvalue spectra resolved as a function of frequency, for the axisymmetric and the first helical mode, is presented in figure 7. The energies are shown as a fraction of total energy for each  ${m-{\omega }}$. Towne et al. (Reference Towne, Schmidt and Colonius2018) have shown in their SPOD analysis of the same jet, analogous to ‘jet-weighted’ SPOD considered here (figure 7b,d), that low azimuthal dynamics show a low-rank behaviour over a frequency range
 $0.2< St<2$, i.e. a small number of modes account for the large proportion of the energy at a given frequency. In the free-jet region the associated physical mechanism is mostly due to the inflectional mean velocity profile that leads to a well-known Kelvin–Helmholtz instability. On the other hand, we observe a low-rank behaviour in a more pronounced way in the ‘nozzle-weighted’ SPOD spectrum: the leading SPOD mode has at least more than one-third of the total fluctuation energy over a range of frequencies. It is accordingly anticipated that low azimuthal nozzle dynamics would be predominantly characterised by this mode, and we aim to understand its underlying mechanism.
Spectral proper orthogonal decomposition eigenvalue spectra for ‘nozzle weighted’ (a,c) and ‘jet weighted’ (b,d) as a function of frequency: (a,b)  $m=0$; (c,d)
 $m=1$.

The analysis in § 4 will evaluate if the leading SPOD mode may be approximated by the optimal response obtained using resolvent analysis. While it would be desirable to also model the second and higher SPOD modes, this is usually more challenging, as amplification mechanisms become significantly weaker (Schmidt et al. Reference Schmidt, Towne, Rigas, Colonius and Brès2018; Lesshafft et al. Reference Lesshafft, Semeraro, Jaunet, Cavalieri and Jordan2019). These trends persist also for other azimuthal modes, and their eigenvalue spectra are shown in Appendix A.
3.5. The link between nozzle structures and downstream wavepackets
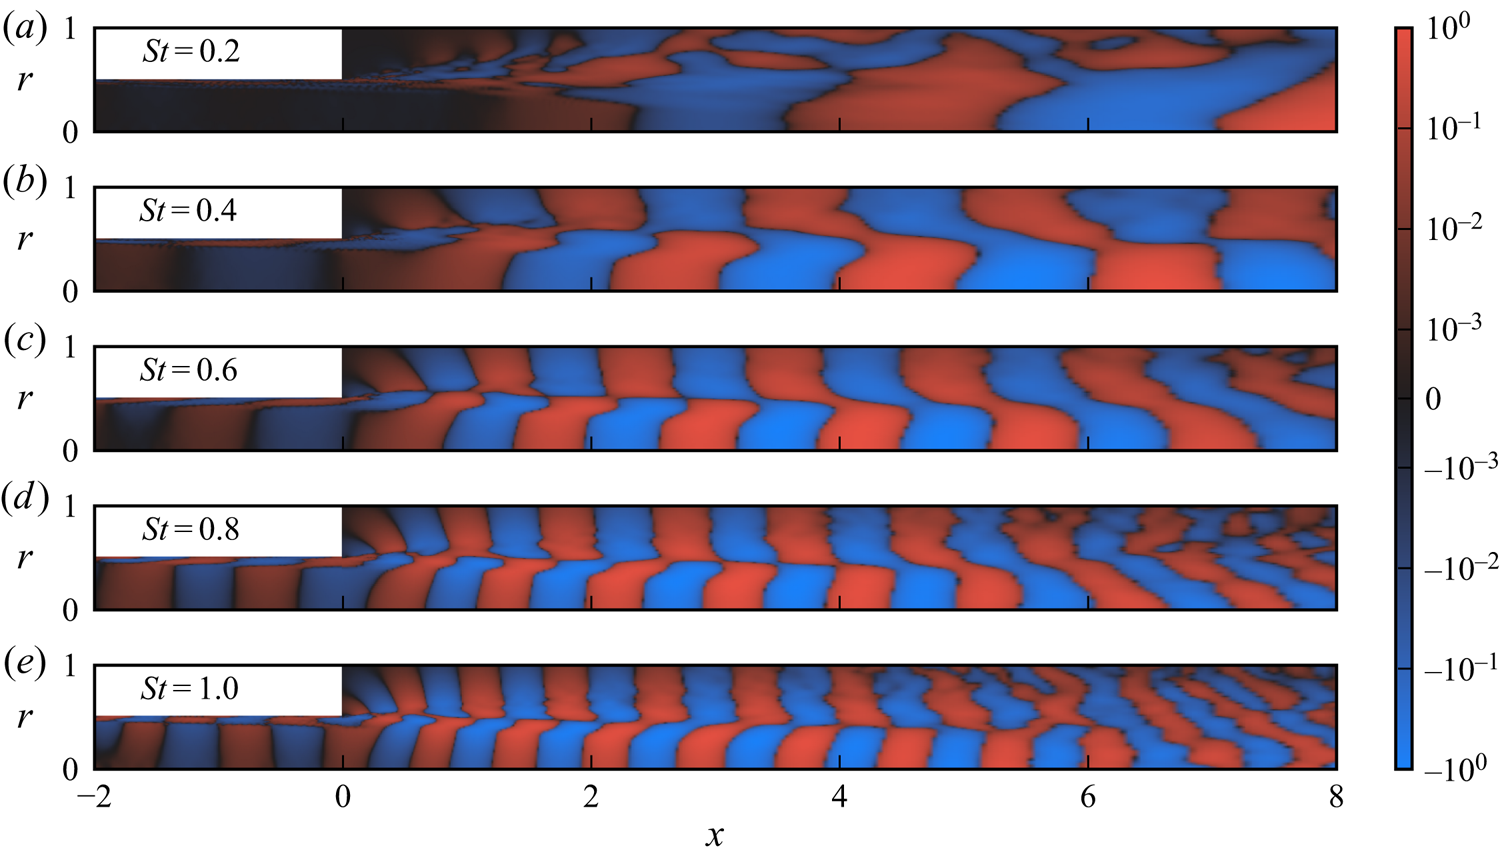
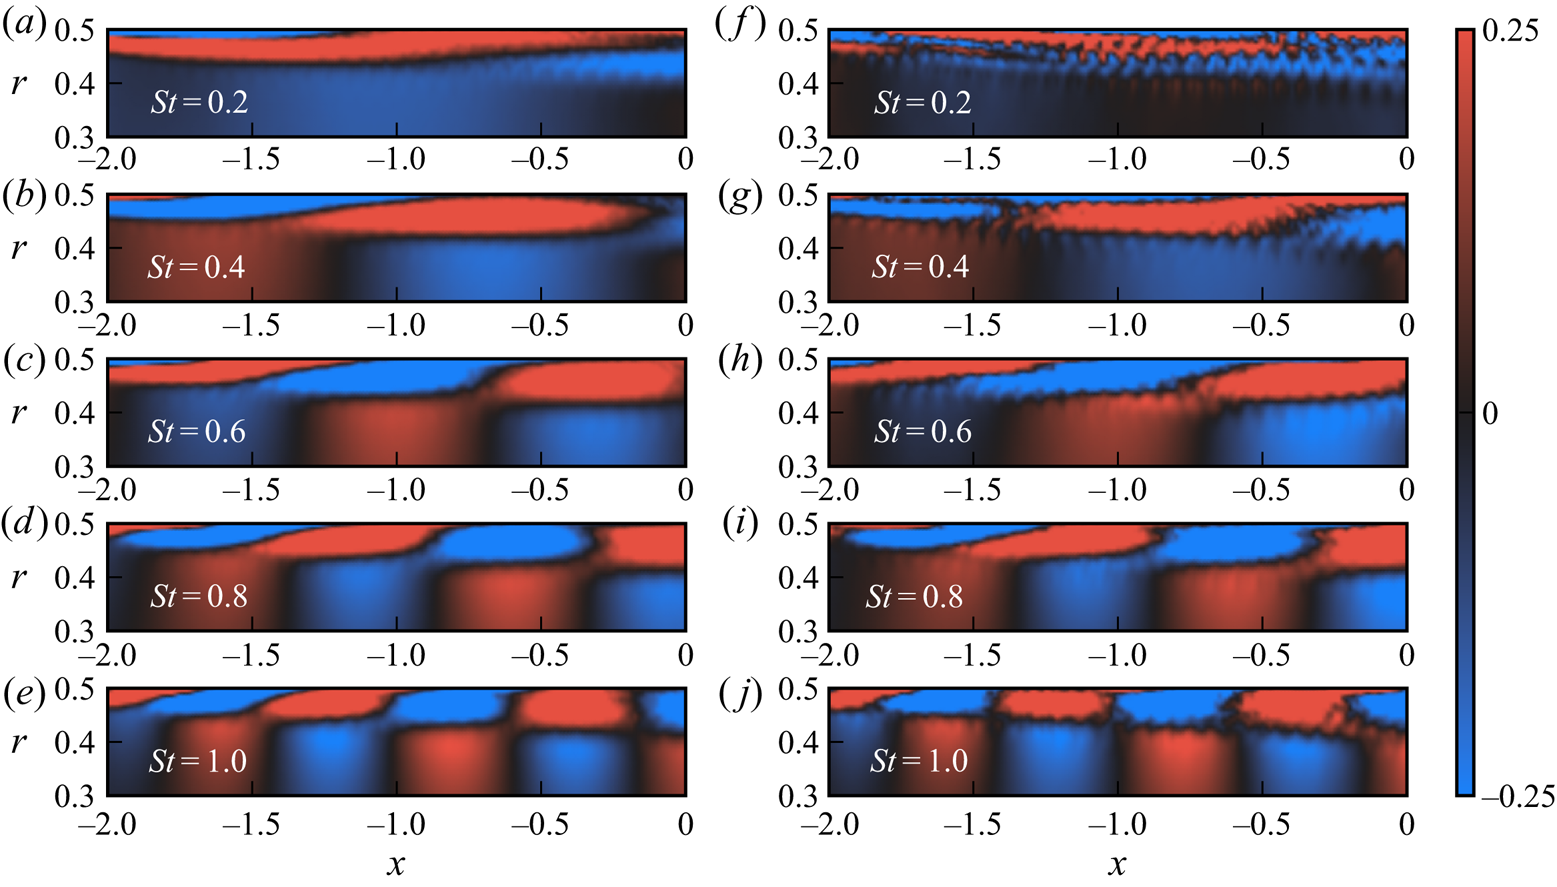
Figure 8 shows the streamwise velocity component of the leading axisymmetric ‘jet-weighted’ SPOD mode for a range of frequencies. Wavepackets are clearly seen in the nozzle boundary layer and further downstream in the jet, and more pronounced compared with CSD, as SPOD filters out uncorrelated fluctuations. Wavepackets in the initial shear layer are known to be associated with the Kelvin–Helmholtz instability mechanism, as the leading SPOD mode is accurately modelled as a Kelvin–Helmholtz wave with exponential growth in space (Gudmundsson & Colonius Reference Gudmundsson and Colonius2011; Cavalieri et al. Reference Cavalieri, Rodríguez, Jordan, Colonius and Gervais2013; Sasaki et al. Reference Sasaki, Cavalieri, Jordan, Schmidt, Colonius and Brès2017). Further downstream their dynamics exhibit the characteristics of non-modal evolution following the Orr mechanism, with further amplitude growth underpinned by the tilting of structures by the sheared mean flow (Tissot et al. Reference Tissot, Lajús, Cavalieri and Jordan2017a,Reference Tissot, Zhang, Lajús, Cavalieri and Jordanb; Schmidt et al. Reference Schmidt, Towne, Rigas, Colonius and Brès2018; Lesshafft et al. Reference Lesshafft, Semeraro, Jaunet, Cavalieri and Jordan2019). These wavepackets appear to be coupled with wavepackets mainly supported within the nozzle boundary layer, which are clearly seen to tilt into the mean-flow direction for  $St=1$ (figure 8e). Wavepackets in both regions are characterised by an increasing wavenumber with increasing frequency: this explains the poor wavepacket eduction within the nozzle at low frequencies both in SPOD and CSD (e.g.
 $St=0.2$), for which wavelengths extend up to approximately five to six jet diameters from the nozzle-exit plane.
Streamwise velocity component of the leading ‘jet-weighted’ SPOD modes for  $m=0$. The modes maximise the energy in the free-jet region, i.e.
 $x \in [0,30]$ and
 $r \in [0,6]$. Each field is normalised with its absolute value in the domain and the contour levels are distributed logarithmically.

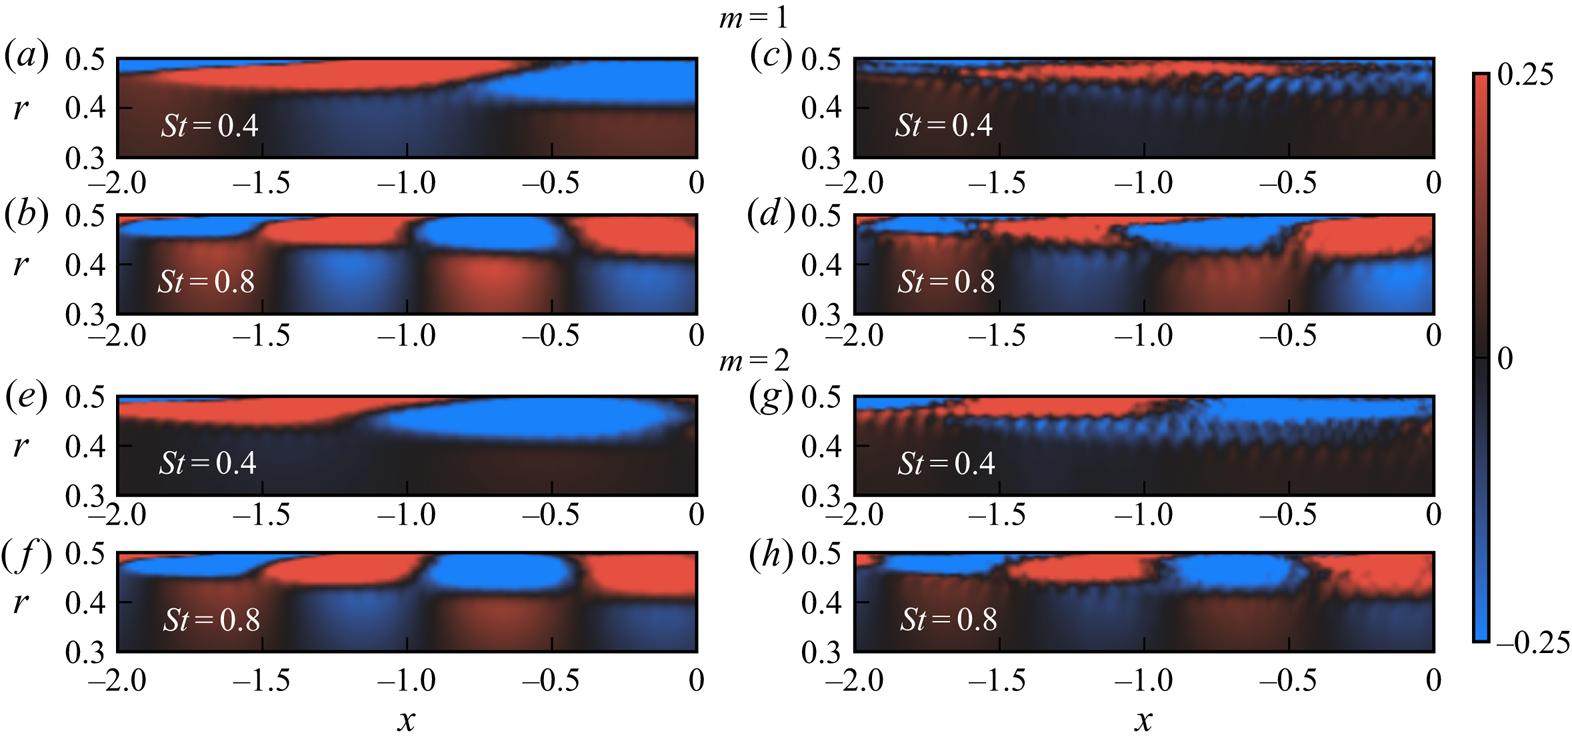
To determine whether the nozzle structures associated with jet wavepackets – educed via ‘jet-weighted’ SPOD – correspond to the most-energetic axisymmetric nozzle structures, figure 9 compares the streamwise velocity fields of the leading ‘jet-weighted’ (taken from figure 8) and ‘nozzle-weighted’ SPOD modes within the nozzle. This comparison clearly reveals, over a range of frequencies, that the leading axisymmetric SPOD modes within the nozzle, which the ‘jet-weighted’ SPOD modes show to be connected to the downstream axisymmetric jet dynamics, are also the most-energetic axisymmetric nozzle structures. Moreover, a similar conclusion can be made where the higher-order azimuthal modes are concerned (figure 10). Differences between the fields appear mainly as noise for the ‘jet-weighted’ modes inside the nozzle. Such modes have lower amplitudes inside the nozzle, as shown in figure 8, and this region is thus more prone to convergence issues. The dominant features inside the nozzle are nonetheless captured in a similar manner by both ‘nozzle-weighted’ and ‘jet-weighted’ SPOD modes.
Streamwise velocity component of the leading SPOD mode in the nozzle at different frequencies for  $m=0$: (a–e) ‘nozzle-weighted’ SPOD; (f–j) ‘jet-weighted’ SPOD. The ‘nozzle-weighted’ SPOD modes maximise the energy in the nozzle region, i.e.
 $x \in [-2.8,0]$ and
 $r \in [0,0.5]$. Each field is normalised with its absolute value in the nozzle.

Streamwise velocity component of the leading SPOD mode in the nozzle at different frequencies for  $m=1$ (a–d) and
 $m=2$ (e–h): ‘nozzle-weighted’ SPOD (a,b,e,f); ‘jet-weighted’ SPOD (c,d,g,h). Each field is normalised with its absolute value in the nozzle.

The SPOD modes inside the nozzle have a wave behaviour. The phase speed is lower than the jet velocity, which characterises a predominantly hydrodynamic phenomenon. Such waves are similar to the spanwise coherent structures in the turbulent boundary layer over an airfoil, extracted by SPOD by Sano et al. (Reference Sano, Abreu, Cavalieri and Wolf2019). As in the cited work, the streamwise velocity displays a change of phase in the wall-normal direction, with near-wall  $u$ fluctuations nearly in phase opposition with fluctuations for larger wall distances. Such a phase jump of
 ${\rm \pi}$ is consistent with a critical-layer mechanism (Tissot et al. Reference Tissot, Zhang, Lajús, Cavalieri and Jordan2017b). Despite the low overall energy of azimuthal modes
 $m=0,1,2$ in the nozzle (as seen from figure 4), such coherent waves inside the nozzle are clearly connected to the downstream jet wavepackets, as seen in the SPOD modes displayed in figures 8–10.
We thus establish a connection between downstream wavepackets and structures observed in the turbulent nozzle boundary layer. It appears that where the nozzle region is concerned, the structures that dominate its low-order dynamics are also those that connect with the downstream wavepackets. Global resolvent analysis is used to model the nozzle boundary-layer structures educed using the ‘nozzle-weighted’ SPOD in the following section. Here and throughout, the results concerning this SPOD are reported and the prefix ‘nozzle-weighted’ is dropped.
4. Global resolvent analysis
We now model the educed nozzle boundary-layer structures through a global resolvent analysis, in which linearised Navier–Stokes equations are recast as an input–output system. This framework is useful for the description of coherent structures in fluid systems with stable eigenvalues, and has been extensively employed in the study of turbulent jets (Garnaud et al. Reference Garnaud, Lesshafft, Schmid and Huerre2013; Schmidt et al. Reference Schmidt, Towne, Rigas, Colonius and Brès2018; Cavalieri et al. Reference Cavalieri, Jordan and Lesshafft2019; Lesshafft et al. Reference Lesshafft, Semeraro, Jaunet, Cavalieri and Jordan2019; Nogueira et al. Reference Nogueira, Cavalieri, Jordan and Jaunet2019; Pickering et al. Reference Pickering, Rigas, Nogueira, Cavalieri, Schmidt and Colonius2020) and wall-bounded flows (Hwang & Cossu Reference Hwang and Cossu2010; McKeon & Sharma Reference McKeon and Sharma2010; Abreu et al. Reference Abreu, Cavalieri, Schlatter, Vinuesa and Henningson2020). The dynamics are conceptually understood as being excited by external forcing that may be associated with ambient noise or nonlinear flow interactions. We show that the locally parallel turbulent nozzle mean flow is marginally stable to the incompressible disturbances in Appendix B. We also regard the flow as incompressible in the resolvent analysis on account of the fact that the jet is isothermal and that density variation in the nozzle is almost negligible. Moreover, the compressibility effects on the stability characteristics of turbulent jets play a little role at the Mach number of the studied jet (Michalke Reference Michalke1984, figure 17).
Homogeneity of the mean flow in time and azimuthal direction permits the use of normal modes
 \begin{equation} \tilde{q}(x,r,\theta,t)=\hat{q}(x,r)\exp({\textrm{i}(m{\theta}-{\omega}t)}), \end{equation}
where  $q$ is the state vector containing the primitive flow variables –
 $u_x$,
 $u_r$,
 $u_{\theta }$ and
 $p$ that denote streamwise, radial, azimuthal velocities and pressure;
 $m$ and
 $\omega$ refer to azimuthal wavenumber and angular frequency, respectively. With the substitution of the perturbation ansatz, the incompressible linearised Navier–Stokes equations are arranged in matrix form as an input–output system that relates nonlinear forcing terms and associated flow responses
 $$\begin{gather} (-\textrm{i}\omega{\boldsymbol{I}} - {\boldsymbol{A}}){\hat{\boldsymbol{q}}}=\boldsymbol{{{L}}}{\hat{\boldsymbol{q}}}=\boldsymbol{B}\hat{\boldsymbol{f}}, \end{gather}$$
 $$\begin{gather}\hat{\boldsymbol{y}}=\boldsymbol{{C}}{\hat{\boldsymbol{q}}}, \end{gather}$$
where we seek most amplified linear responses to an associated forcing, considering a base flow that depends on  $x$ and
 $r$. The linear operators in the global analysis relate response and forcing in frequency – azimuthal wavenumber space, with
 $\boldsymbol {{{L}}}$ the linearised Navier–Stokes operator,
 $\hat {\boldsymbol {q}}$ flow response and
 $\hat {\boldsymbol {f}}$ unknown input/forcing associated with nonlinear terms. Note that the frequency and azimuthal wavenumber dependence of the operators is implicit, and all the related subscripts are dropped in the interest of simplicity. Matrices
 $\boldsymbol {B}$ and
 $\boldsymbol {C}$ are used to spatially restrict forcing and associated responses, which we define in a later stage of the paper. The relation between input and output can be established by introducing the resolvent operator
 $\boldsymbol {{{R}}}$ as
 \begin{equation} \hat{\boldsymbol{y}}=\boldsymbol{{C}} \boldsymbol{{{L}}}^{{-}1} \boldsymbol{{B}} \hat{\boldsymbol{f}}=\boldsymbol{{{R}}} \hat{\boldsymbol{f}}. \end{equation}
The objective of the resolvent analysis is to obtain a forcing of minimum norm that maximises the norm of an associated response. To this end, starting from the direct input–output system in (4.2), an adjoint input–output system is first given by
 $$\begin{gather} \boldsymbol{L}^{{{\dagger}}} \boldsymbol{q}^{{{\dagger}}} = \boldsymbol{B}^{{{\dagger}}} \boldsymbol{f}^{{{\dagger}}}, \end{gather}$$
 $$\begin{gather}\boldsymbol{y}^{{{\dagger}}} = \boldsymbol{C}^{{{\dagger}}} \boldsymbol{q}^{{{\dagger}}}, \end{gather}$$
with adjoint operators given in discrete form by  $\boldsymbol {L}^{{\dagger} } = \boldsymbol {L}{{}^{\mathsf {H}}}$,
 $\boldsymbol {B}^{{\dagger} } = {\boldsymbol {C}{{}^{\mathsf {H}}}}\boldsymbol {W}_q$ and
 $\boldsymbol {C}^{{\dagger} } = \boldsymbol {W}_f^{-1}\boldsymbol {B}{{}^{\mathsf {H}}}$. Using the resolvent operator
 $\boldsymbol {{{R}}}$, an adjoint resolvent operator is thus defined as
 \begin{equation} \boldsymbol{R}^{{{\dagger}}} = \boldsymbol{C}^{{{\dagger}}}(\boldsymbol{L}^{{{\dagger}}})^{{-}1}\boldsymbol{B}^{{{\dagger}}}, \end{equation}
which allows us to obtain forcing modes as eigenfunctions of the eigenvalue problem
 \begin{equation} \boldsymbol{R}^{{{\dagger}}}\boldsymbol{R}\boldsymbol{f} = \sigma^{2} \boldsymbol{f}. \end{equation}
For a global analysis, with two-dimensional base flow and eigenfunctions, this is a large eigenvalue problem more conveniently solved with iterative methods. We have applied the Arnoldi algorithm described by Martini et al. (Reference Martini, Rodríguez, Towne and Cavalieri2021), but differently from that work we have explicitly constructed sparse matrices, with  $x$ and
 $r$ derivatives obtained with fourth-order finite differences and Chebyshev polynomials, respectively. Such sparse matrices allow fast solutions of linear systems using a sparse-matrix lower-upper (LU) decomposition, and reduce memory requirements (Gennaro et al. Reference Gennaro, Rodríguez, Medeiros and Theofilis2013). For each iteration in the Arnoldi method, the action of
 $\boldsymbol {R}^{{\dagger} }\boldsymbol {R}$ onto a test forcing
 $\boldsymbol {f}_i$ is obtained by computing
 $$\begin{gather} \boldsymbol{L} \boldsymbol{q}_i = \boldsymbol{B} \boldsymbol{f}_i, \end{gather}$$
 $$\begin{gather}\boldsymbol{y}_i = \boldsymbol{C} \boldsymbol{q}_i, \end{gather}$$
 $$\begin{gather}\boldsymbol{L}^{{{\dagger}}} \boldsymbol{w}_i = \boldsymbol{B}^{{{\dagger}}} \boldsymbol{y}_i, \end{gather}$$
 $$\begin{gather}\boldsymbol{f}_{i+1} = \boldsymbol{C}^{{{\dagger}}} \boldsymbol{w}_i, \end{gather}$$
such that  $\boldsymbol {f}_{i+1} = \boldsymbol {R}^{{\dagger} }\boldsymbol {R}\boldsymbol {f}_i$. Thus, the inverses of
 $\boldsymbol {L}$ and
 $\boldsymbol {L}^{{\dagger} }$ are not computed, as successive solutions of the above equations in Arnoldi iterations are obtained in an efficient manner by using the LU decompositions of
 $\boldsymbol {L}$ and
 $\boldsymbol {L}^{{\dagger} }$.
A computational domain with  $-5 \leqslant x \leqslant 4.1$ and
 $0 \leqslant r \leqslant 0.5$ was used, with a physical domain given by
 $-3.5 \leqslant x \leqslant 0$ and sponge zones upstream and downstream of this region. The forcing matrix
 $\boldsymbol {B}$ restricts the spatial support of the forcing to lie within the computational domain, by taking
 $\boldsymbol {B}$ as a diagonal matrix with 1 to consider forcing in the momentum equations inside the computational domain, and 0 for points in the sponge zones, or for the continuity equation. Similarly, the observation matrix
 $\boldsymbol {C}$ considers only responses within the domain
 $-2.8 \leqslant x \leqslant 0$ used in the SPOD analysis, with a similar diagonal matrix with 1 and 0 elements. Despite such abrupt transitions, the linearised operator considers the entire domain; as such, flow responses are smooth functions, extending into the sponge zones, but only fluctuations inside the region of interest determined by the
 $\boldsymbol {C}$ matrix are considered in the computation of the gains. The turbulent mean flow obtained from the LES was interpolated on a grid where a discretisation in 200 points in the streamwise and 100 points in the radial direction was used. The mean flow from the LES is also used in the sponge zone with
 $x>0$; for the upstream sponge zone with
 $x<-3.5$, the LES mean profile taken at
 $x=-3.5$ was used as a parallel flow. As these sponge-zone regions have zero forcing, as specified by the
 $\boldsymbol {B}$ matrix, they serve solely to damp outgoing disturbances and, thus, the specific details of the mean flow do not matter. The sponge zones were implemented as damping terms in the momentum equation, with magnitude increasing as a quadratic function in
 $x$, such that damping and its
 $x$ derivative are zero at the ends of the computational domain, and increase progressively as fluctuations enter a sponge zone. The damping magnitude was adjusted to avoid spurious reflections, and, for the lengths of sponge zones used here, changes in the magnitude around the chosen value do not lead to observable changes in the results. Homogeneous Dirichlet boundary conditions were applied at the end of the sponge zones. The Arnoldi method was set up using 50 iterations, which was sufficient to converge the leading modes. Changes in the numerical parameters led to negligible differences in the results.
A Reynolds number of  $3 \times 10^{4}$ was considered, as in the global resolvent analysis of jets by Schmidt et al. (Reference Schmidt, Towne, Rigas, Colonius and Brès2018). This value was seen in that work to be sufficiently high to attain asymptotic trends in the resolvent analysis, while maintaining at the same time a moderate computational cost. Although not shown here, higher values of
 $Re$ did not lead to significant changes for global resolvent modes inside the nozzle.
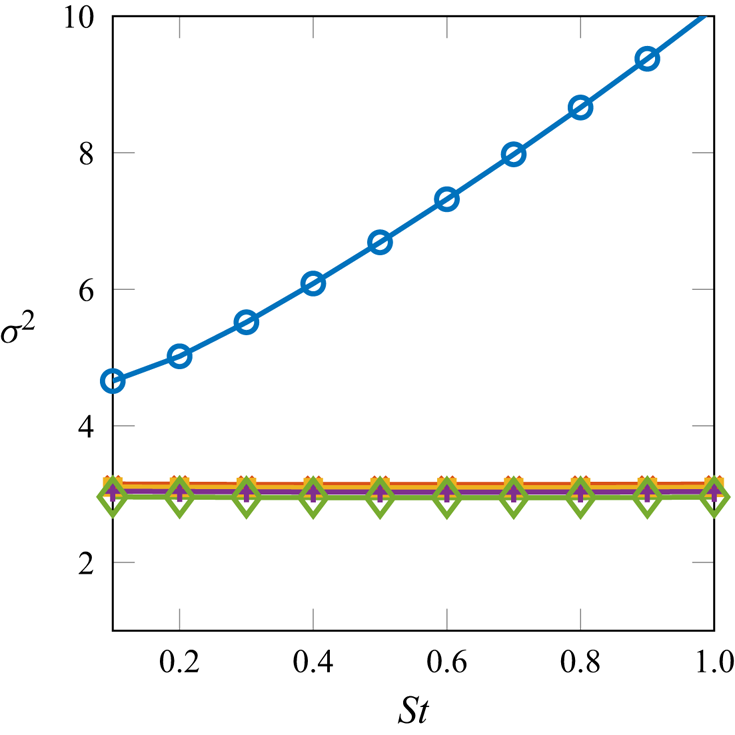
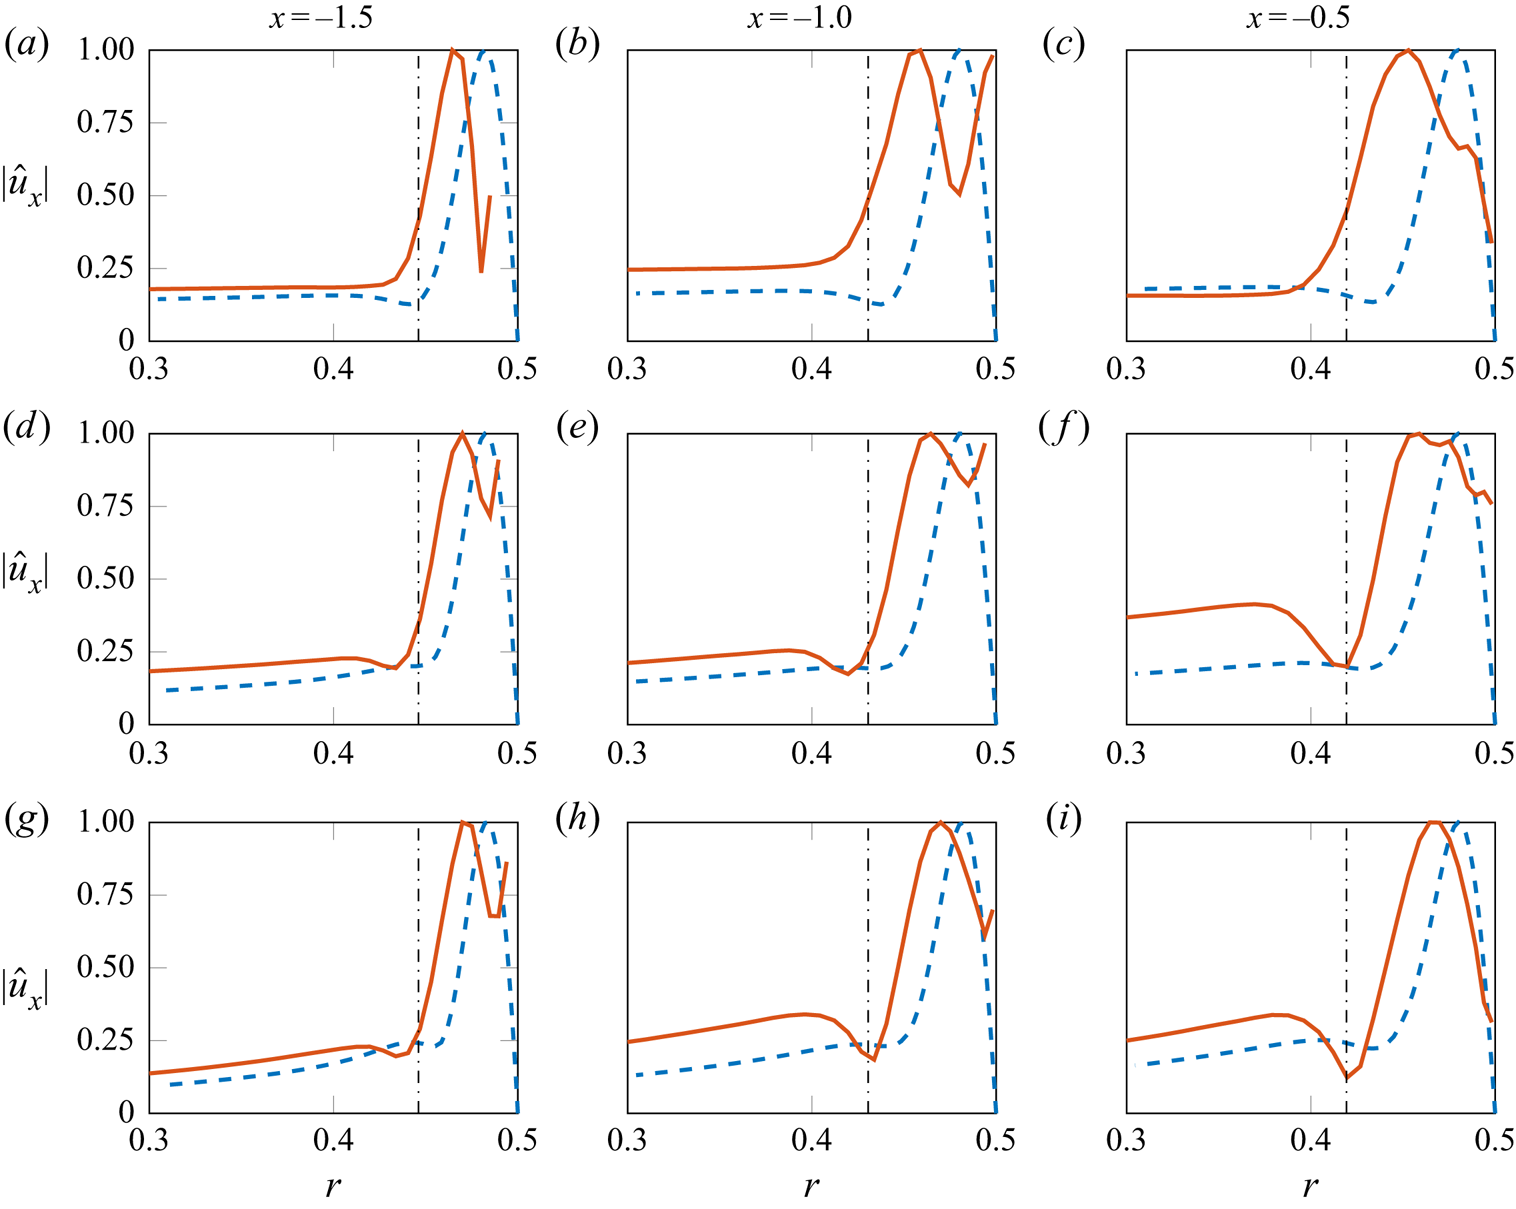
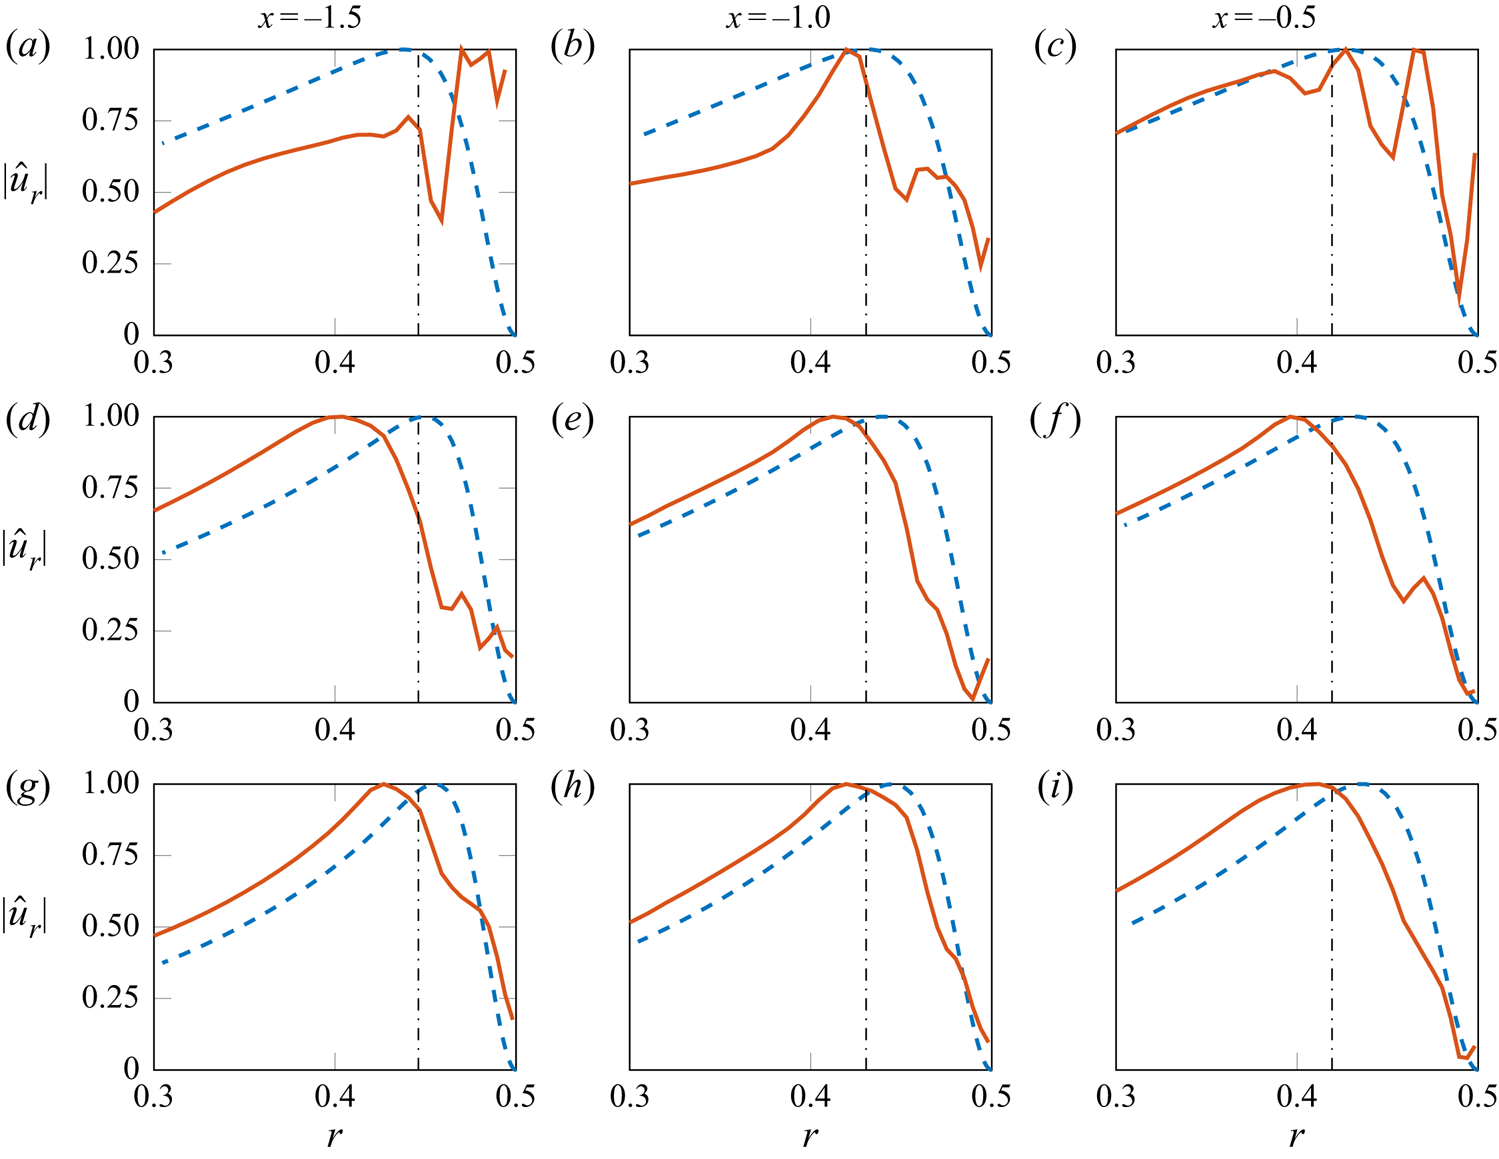
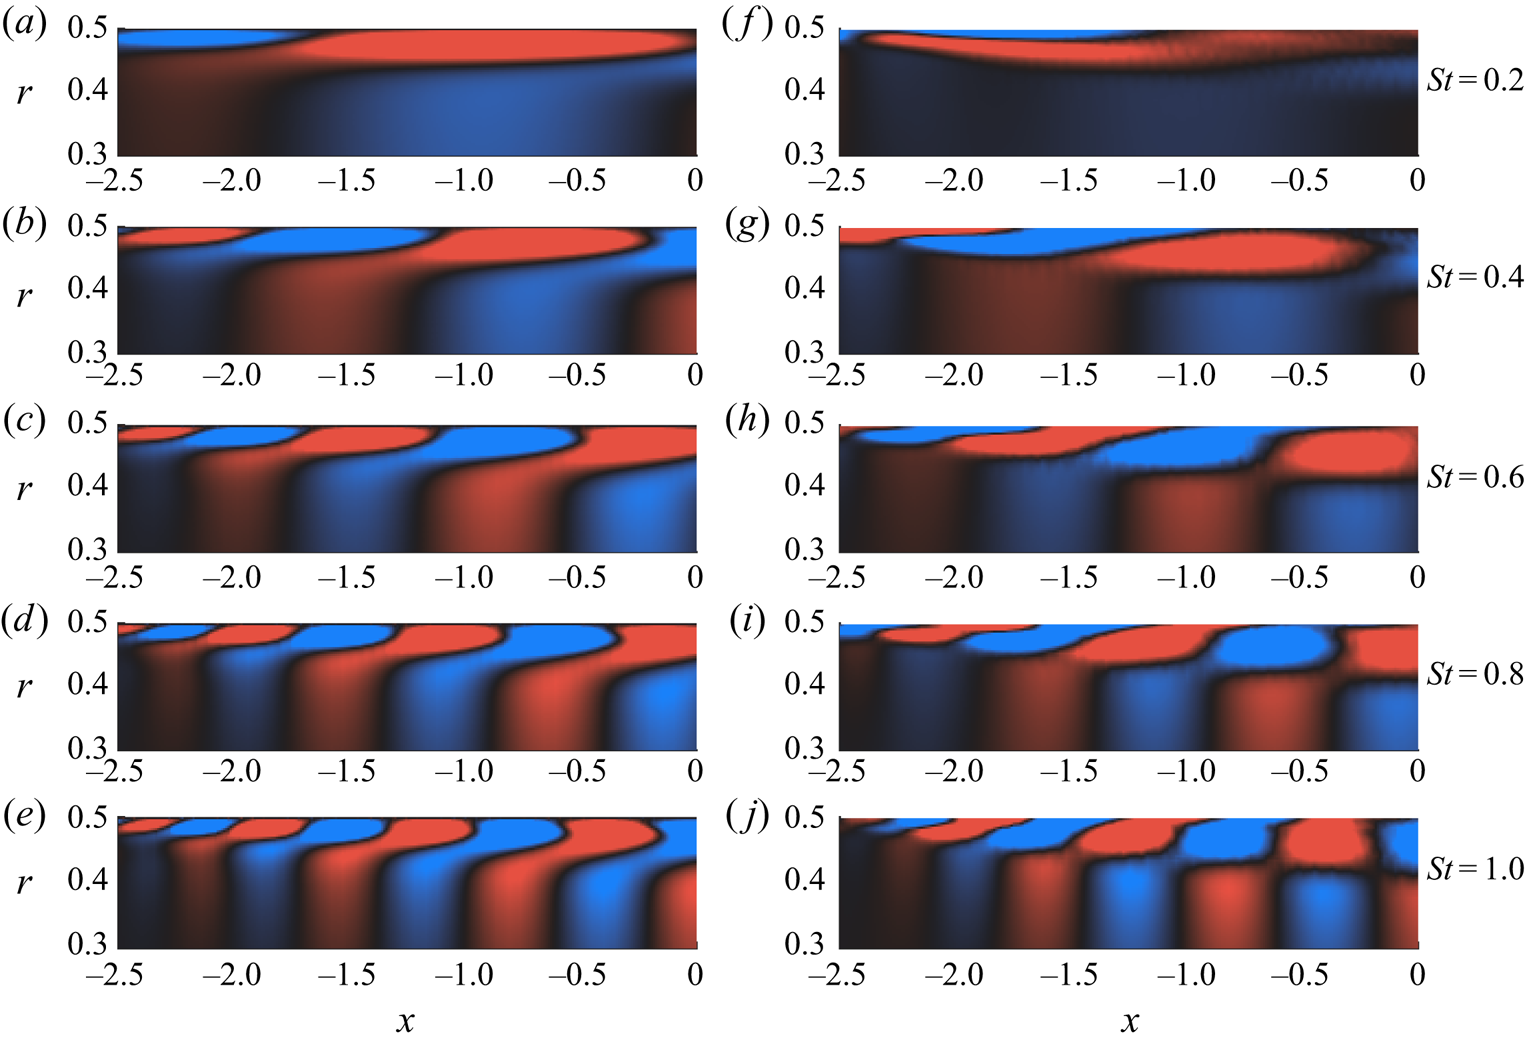
Gain curves, resolved as a function of frequency, for the axisymmetric disturbances are shown in figure 11. It is seen that the gain ratio between the optimal and suboptimal resolvent modes are of the same order. This is particularly pronounced at lower  $St$: the low-gain separation suggests that the specific details of the forcing will likely be of significance for the linear flow response mode. Suboptimal modes show very similar gains and, thus, no clear amplification mechanism appears other than the leading one. Accordingly, we will not attempt to compare suboptimal resolvent modes with higher-order SPOD modes, and focus instead on the leading SPOD and resolvent modes. Figure 12 shows a comparison of velocity fluctuation profiles between the resolvent response and SPOD modes. Over a range of frequencies, radial envelope and support of the nozzle wavepackets are retained by the resolvent modes, although they do not precisely capture the peak radial position of the SPOD modes. A comparison of radial velocity fluctuations similarly show a fair agreement (figure 13), indicating that local characteristics of the nozzle wavepackets can be approximated by the resolvent response modes. We next compare global shapes of the leading SPOD and the optimal resolvent modes in figure 14. The figure shows that spatial organisation and essential characteristics of the nozzle wavepackets are reproduced by the resolvent response modes: the resolvent analysis provides axially organised structures that match SPOD modes, and these structures tilt into the mean-flow direction towards the nozzle-exit plane. In the global resolvent analysis the gain ratio between the optimal and suboptimal modes for low St becomes close to 1 (figure 11), and the streamwise support of both resolvent and SPOD modes exceed the nozzle length, which help explain the discrepancies.
Gain curves of the global resolvent analysis for  $m=0$:
 $\circ$ (blue circle) optimal mode;
 $\times ,{\scriptsize {\square }},{\scriptsize {+}},{\scriptsize {\diamond }}$ (brown, orange, purple, green) suboptimal modes in sequential order.

Comparison of streamwise velocity ( $m=0$): leading SPOD (red solid lines) and optimal resolvent response modes (blue dashed lines);
 $St=0.2$ (a–c),
 $St=0.5$ (d–f),
 $St=0.8$ (g–i). Dotted line is the local boundary-layer thickness.

Comparison of radial velocity ( $m=0$): leading SPOD (red solid lines) and optimal resolvent response modes (blue dashed lines);
 $St=0.2$ (a–c),
 $St=0.5$ (d–f),
 $St=0.8$ (g–i). Dotted line is the local boundary-layer thickness.

Streamwise velocity of (a–e) optimal resolvent response and (f–j) SPOD modes within the nozzle ( $m=0$), real part is shown. (Blue-black-red colour map,
 $\pm$ 0.25 of the maximum absolute value in the nozzle.)

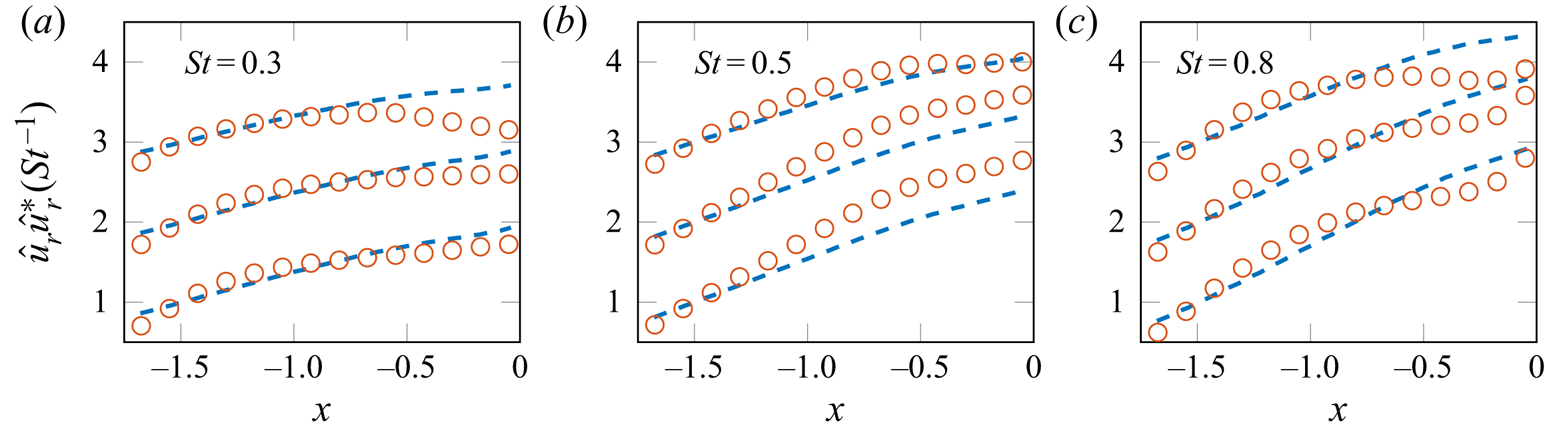
Several studies have shown that in the downstream region of turbulent jets, and particularly in regions where the Kelvin–Helmholtz mode becomes stable, the downstream evolution of wavepackets is underpinned by the Orr mechanism which is responsible for non-modal growth of disturbances in a convectively stable turbulent mean flow (Tissot et al. Reference Tissot, Lajús, Cavalieri and Jordan2017a; Schmidt et al. Reference Schmidt, Towne, Rigas, Colonius and Brès2018; Towne et al. Reference Towne, Schmidt and Colonius2018; Lesshafft et al. Reference Lesshafft, Semeraro, Jaunet, Cavalieri and Jordan2019), and also appears to play a key role in the evolution of perturbations in the logarithmic layer of turbulent boundary layers (Jiménez Reference Jiménez2013). One of its defining features is the successive amplification and decay of radial/wall-normal velocity fluctuations, accompanied by streamwise tilting of boundary-layer structures into the mean-flow direction. A comparison is therefore made between the leading SPOD and resolvent response modes in terms of streamwise envelopes of radial velocity fluctuations to determine whether this mechanism is active in the nozzle boundary layer. In figure 15 we select three frequency/wavenumber pairs from the axisymmetric optimal resolvent response and SPOD modes and compare their streamwise evolution of radial velocity fluctuations at several radial positions  $r > 0.38$ in the nozzle region. It is seen that the optimal response follows the initial trend of amplitude growth of the SPOD modes; the discrepancies further downstream may be attributed to the fact that the resolvent modes are calculated in a fully internal flow, hence, the amplitude saturation of SPOD modes associated with nozzle-lip effects are not captured in the resolvent analysis. An extension of this analysis including the downstream jet, similarly to Garnaud et al. (Reference Garnaud, Lesshafft, Schmid and Huerre2013) and Lesshafft et al. (Reference Lesshafft, Semeraro, Jaunet, Cavalieri and Jordan2019), is thus of interest. However, this would lead to a significantly higher computational cost in order to accurately resolve the thin boundary and shear layer close to the nozzle lip, which is outside the scope of the present work.
Evolution of radial velocity fluctuations ( $m=0$) along several axial slices: leading SPOD (red dots) and optimal response modes (blue dashed lines). From bottom to top for each subplot:
 $r=0.38,0.4,0.42$. The curves are shifted by an increment of 1 with increasing
 $r$. The modes are normalised by their corresponding amplitudes at
 $x=-1.5$.

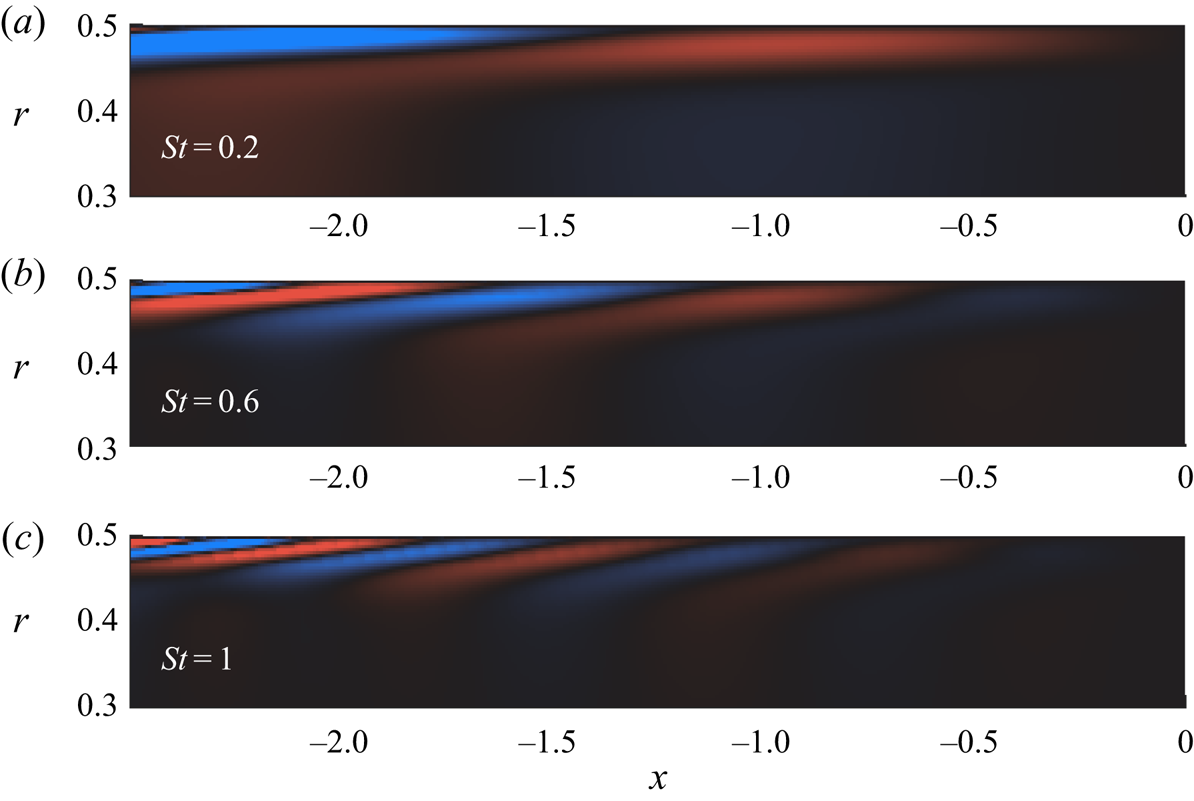
Finally, optimal forcing fields are shown in figure 16, where a tilting of the forcing modes against the mean shear at angle  $45^{\circ }$, characteristic of the Orr mechanism, is evident. Equally informative is the overlap of the forcing and responses: the response modes are mostly activated near their spatial support (figures 14 and 16). This suggest that an analysis based on a locally parallel mean flow may also be an appropriate departure point for modelling nozzle wavepackets. Although such forcing modes are optimal in driving structures inside the nozzle, they are similar to the optimal forcing inside the nozzle that excite downstream wavepackets, as found in global resolvent analysis by Garnaud et al. (Reference Garnaud, Lesshafft, Schmid and Huerre2013) and Lesshafft et al. (Reference Lesshafft, Semeraro, Jaunet, Cavalieri and Jordan2019). They showed that the associated Kelvin–Helmholtz instability mechanism is most efficiently activated by the Orr mechanism inside the nozzle. The present analysis with the turbulent nozzle mean flow confirms that the forcing excite wavy disturbances inside the nozzle, which are advected and trigger the jet wavepackets.
Optimal forcing modes associated  $x$ with the largest gain for
 $m=0$. (Blue-black-red colour map,
 $\pm$ 0.25 of the maximum absolute value in the nozzle.)

5. Conclusions and outlook
We have considered a subsonic turbulent jet issuing from a cylindrical nozzle at high Reynolds number, by exploiting LES data, to study how fluctuations in the turbulent boundary layer inside the nozzle excite large-scale structures responsible for sound generation in the jet.
The nozzle mean flow is first characterised in terms of integral boundary-layer quantities, and comparisons with canonical zero-pressure-gradient turbulent boundary layers in the literature confirm the turbulent state of the nozzle flow upstream of the jet exit. Azimuthal decomposition of the streamwise velocity field reveals that low azimuthal wavenumbers contain significantly lower, but non-zero, fluctuation levels with respect to the higher wavenumbers, similar to the azimuthal structure observed downstream of the jet exit (Cavalieri et al. Reference Cavalieri, Rodríguez, Jordan, Colonius and Gervais2013).
The fluctuations of low azimuthal wavenumbers in the nozzle boundary layer are shown to have significant CSD with fluctuations in the region downstream of the jet exit, indicating that two dynamics are connected. Spectral proper orthogonal decomposition analysis, used to educe wavepackets in both regions, reveals a link between coherent structures in the nozzle and jet regions. The analysis shows that the most-energetic, low-order azimuthal nozzle boundary-layer structures are those that drive the downstream jet dynamics.
The nozzle wavepackets are characterised using a global resolvent analysis of the turbulent mean flow, in which non-modal linear dynamics are understood to be driven by nonlinear flow interactions treated as an external forcing. The results show that salient features of the educed nozzle boundary-layer structures can be described by optimal response modes in the resolvent framework. The associated forcing structures are found to tilt against mean shear in the boundary layer. This, along with streamwise growth and decay of radial velocity fluctuations seen in the data and described by resolvent response modes, suggest that the nozzle boundary-layer structures that excite wavepackets downstream of the jet exit are underpinned by non-modal dynamics; specifically, the Orr mechanism.
The results suggest that reduced-order modelling frameworks for wavepackets should include the flow within the nozzle as the dynamics here likely play an important role in fixing the amplitude of wavepackets in turbulent jets, consistent with other studies that highlight the importance of the nozzle boundary layer (Fontaine et al. Reference Fontaine, Elliott, Austin and Freund2015; Brès et al. Reference Brès, Jordan, Jaunet, Le Rallic, Cavalieri, Towne, Lele, Colonius and Schmidt2018). The global resolvent analysis, restricted to the region inside the nozzle, leads to structures in fair agreement with the SPOD modes. This suggests that a global analysis including the downstream jet may capture the excitation process of Kelvin–Helmholtz wavepackets. However, proving this last point is beyond the scope of the present work, which shows, for the first time, boundary-layer structures connected to the downstream wavepackets. The presence of wavepackets as large as nozzle boundary-layer thickness also raises the question of their exploitation for flow and noise control.
Supplementary movie
Supplementary movie is available at https://doi.org/10.1017/jfm.2021.566.
Funding
The LES studies were supported by NAVAIR SBIR projects with computational resources provided by DoD HPCMP. This work was partially supported by a PhD grant to O.K. by the Nouvelle-Aquitaine region of France.
Declaration of interests
The authors report no conflict of interest.
Appendix A. SPOD of helical modes
Convergence analyses of SPOD are made for the first two helical modes ( $m=1,2$) and figure 17 shows the associated convergence maps. Similar to the axisymmetric disturbances, the leading modes in both ‘nozzle weighted’ and ‘jet weighted’ are seen converged for the frequencies we analyse throughout the paper. The energy spectra presented in figure 18 show that the ‘nozzle-weighted’ leading mode contains the large fraction of the energy over a range of frequencies, similar to the observations made for the axisymmetric mode.
Convergence maps of SPOD modes for  $m=1$ (a–d) and
 $m=2$ (e–h): (a,b,e,f) ‘nozzle-weighted’ SPOD modes; (c,d,g,h) ‘jet-weighted’ SPOD modes.

Spectral proper orthogonal decomposition eigenvalue spectra for ‘nozzle weighted’ (a,c) and ‘jet weighted’ (b,d) as a function of frequency: (a,b)  $m=2$; (c,d)
 $m=3$.

Appendix B. Local linear stability analysis
We first consider the linear spatial stability of incompressible disturbances on a locally parallel mean flow in a circular nozzle. Homogeneity of the mean flow in time, streamwise and azimuthal directions permits the use of normal modes
 \begin{equation} \tilde{q}(x,r,\theta,t)=\hat{q}(r)\exp({\textrm{i}({\alpha} x + m {\theta}-{\omega} t)}), \end{equation}
where we maintain the notation introduced in the resolvent analysis. In addition,  $\alpha$ refers to the streamwise wavenumber. Following the substitution of the perturbation ansatz into the linearised, incompressible Navier–Stokes equations, the equation system can be recast as a generalised eigenvalue problem as
 \begin{equation} \mathcal{L}\hat{q}_{m\omega}=\alpha\mathcal{F}\hat{q}_{m\omega}, \end{equation}
whose solution for a given Reynolds number, real angular frequency  $\omega$ and azimuthal wavenumber
 $m$ results in eigenmodes
 $\hat {q}_{m\omega }(r)$ with associated complex eigenvalues
 $\alpha$. Spatial growth or decay of a stability eigenmode is governed by the imaginary part of the streamwise wavenumber: if
 ${\alpha }_i<0$ the disturbance will grow exponentially in the positive streamwise direction, whereas it will experience a decay if
 ${\alpha }_i>0$. The complete form of (B2) includes
 ${\alpha }^{2}$ viscous terms associated with second-order axial derivatives of perturbations, which are excluded in the current analysis, similar to what has been done in Rodríguez et al. (Reference Rodríguez, Cavalieri, Colonius and Jordan2015) and Gudmundsson & Colonius (Reference Gudmundsson and Colonius2011). Li & Malik (Reference Li and Malik1997) have shown that excluding these terms removes the upstream travelling vorticity and entropy waves from the spectrum, and has a negligible effect on other branches. This is also verified in the current work; omitting these terms does not influence the boundary-layer and free-stream modes we consider.
A pseudospectral method is used for the discretisation of the system of equations. This results in differentiation matrices for derivatives along the radial direction. Chebyshev collocation points are used to discretise the computational domain, with a numerical grid spanning from the nozzle centreline up to the nozzle wall ( $0.5\geqslant r >0$). The convergence of the boundary-layer and free-stream eigenmodes is achieved with
 $N_c=181$ discretisation points. The discrete form of the set of equations in (B2) and the mean flow used in the analysis are reported in Appendix B.2.
On the wall  $(r=0.5)$, the no-slip condition is applied for three velocity components in conjunction with the Neumann boundary condition for pressure (Khorrami, Malik & Ash Reference Khorrami, Malik and Ash1989),
 \begin{equation} {\hat{u}}_{x}={\hat{u}}_{r}={\hat{u}}_{\theta}=0 \quad \hat{p}^{\prime}=0. \end{equation}
At the jet centreline ( $r\rightarrow 0$), particular treatment is required to obtain a bounded solution. For an incompressible flow, these conditions are applied following Khorrami et al. (Reference Khorrami, Malik and Ash1989),
 $$\begin{gather} m=0 : \ \hat{u}_{x}^{\prime}=\hat{u}_{r}=\hat{u}_{\theta}=0, \quad \hat{p}^{\prime}=2 \hat{u}_{r}^{\prime \prime} / Re, \end{gather}$$
 $$\begin{gather}{|m|=1} :\ \hat{u}_{x}=\hat{p}=\hat{u}_{r}^{\prime}=0, \quad \hat{u}_{\theta}=\textrm{i} \hat{u}_{r}, \end{gather}$$
 $$\begin{gather}{|m|>1} :\ \hat{u}_{x}=\hat{u}_{r}=\hat{u}=\hat{p}=0. \end{gather}$$
The governing equations are made non-dimensional using the local mean nozzle centreline velocity  ${U^{\ast }_{c}}$ and displacement thickness of the boundary layer
 $\delta _{1}^{\ast }$ at a given axial position
 $x_0^{\ast }$: this leads to a Reynolds number of
 $Re_{{\delta }_{1}}={U^{\ast }_{c}}{\delta }_{1}^{*}/{\nu }$. Using these characteristic scales, angular frequency
 $\omega$, streamwise wavenumber
 $\alpha$ and velocity simply become
 \begin{equation} U=\frac{U^{*}}{U^{*}_{c}}, \quad {\delta_{1}}={\delta^{*}_{1}/D^{*}}, \quad \omega=2{\rm \pi} St {\delta^{x_0}_{1}}, \quad \alpha_{D}={\alpha}^{*}D^{*}, \quad \alpha=\alpha_{D}{\delta^{x_0}_{1}}. \end{equation}
Note that the Strouhal number is based on the nozzle diameter  $D^{*}$ and the jet-exit centreline velocity
 $U_{j}^{*}$, i.e.
 $St=f^{*}D^{*}/U_{j}^{*}$. The turbulent mean nozzle flow is approximated by a velocity function for zero-pressure-gradient boundary-layer flows (Monkewitz, Chauhan & Nagib Reference Monkewitz, Chauhan and Nagib2007). The composite function can be simply written in terms of wall distance in inner units and displacement-thickness-based Reynolds number,
 \begin{equation} U=f(y^{+},Re_{{\delta}_{1}}). \end{equation}
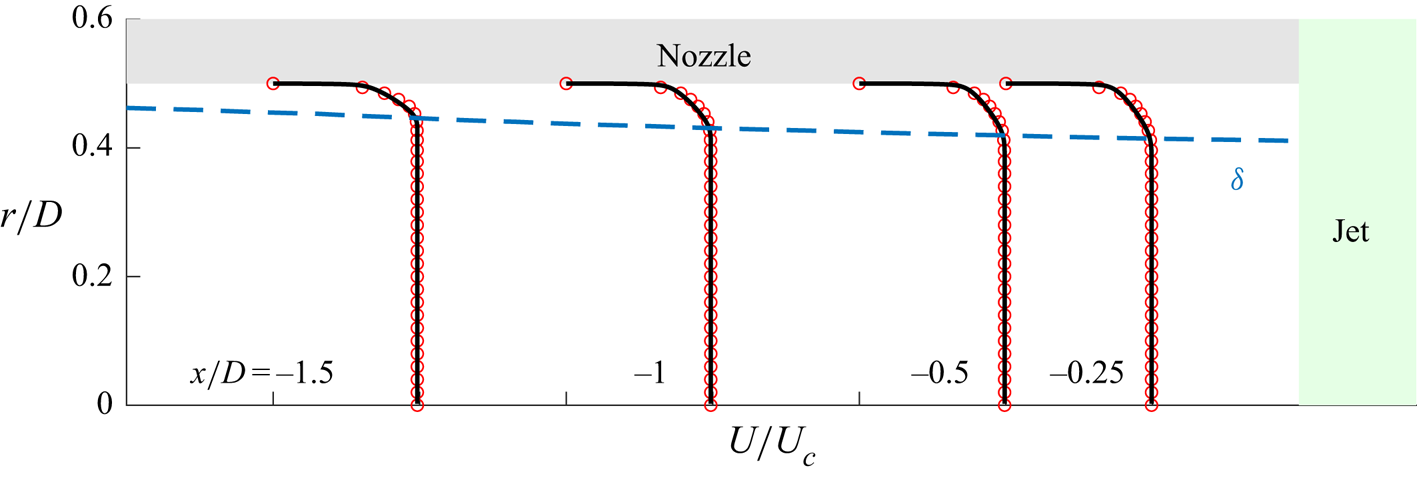
The analytical velocity function ensures well behaved and smooth radial derivatives and can be found in concise form in Cossu, Pujals & Depardon (Reference Cossu, Pujals and Depardon2009). Figure 19 presents a comparison between the fit and the LES mean nozzle flow at several streamwise stations.
Streamwise mean-flow profiles in the nozzle. Here  $U/U_{c}$ is plotted with
 $U_c$ as the local nozzle centreline velocity. Black solid lines are velocity profiles obtained through the analytical fit of Monkewitz et al. (Reference Monkewitz, Chauhan and Nagib2007).

B.1. Eigenvalue spectra
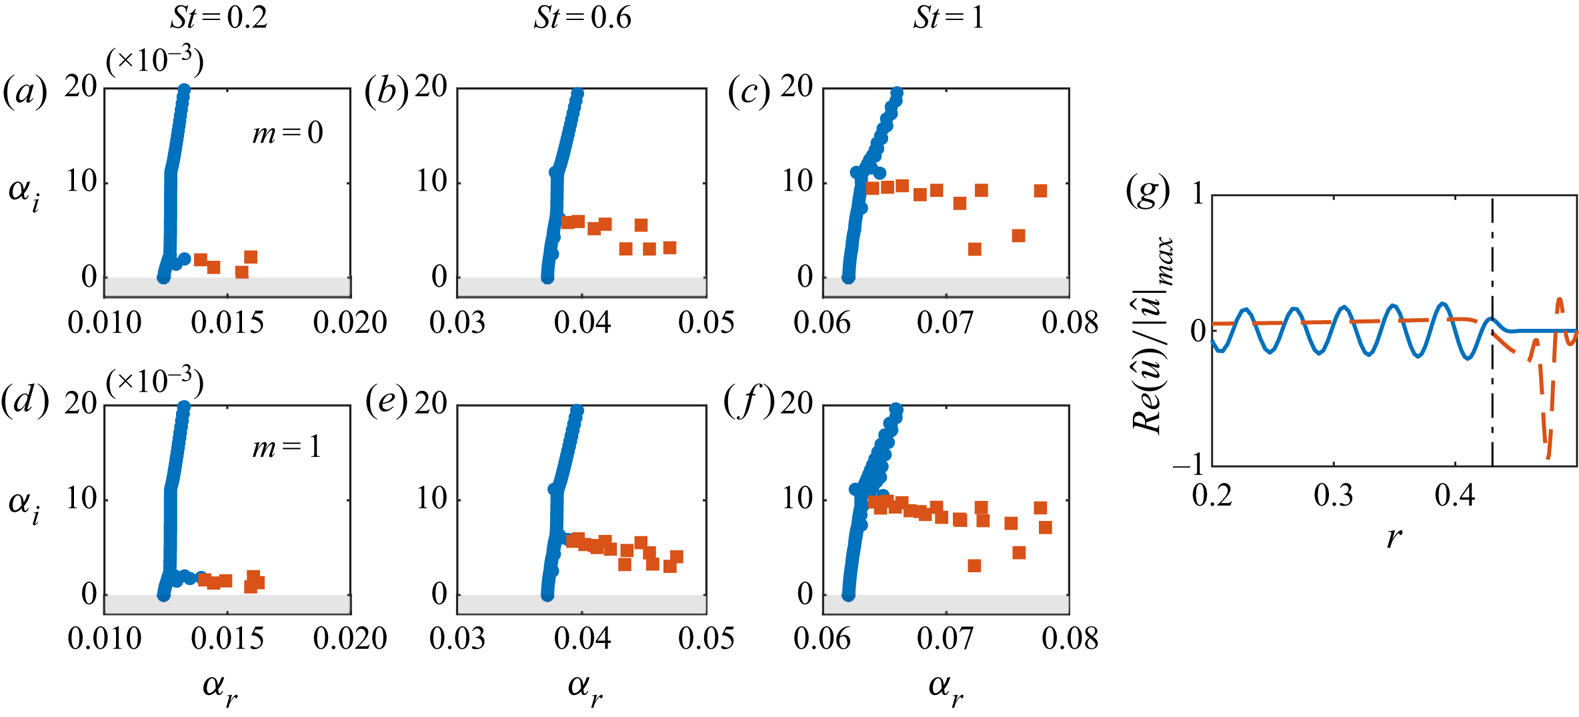
Since the mean boundary-layer profiles at different axial positions are qualitatively similar, solution of the eigenvalue problem in different turbulent regions of the nozzle produces nearly indistinguishable eigenspectra. The first quadrant of the spectra for axisymmetric disturbances at  $x=-1$ is shown in figure 20. Eigenvalues can be readily classified into two families: free-stream and boundary-layer modes, and both branches are stable. Modes in the free-stream branch lie roughly on a line parallel to the
 ${\alpha }_i$ axis, with a phase speed
 $c_p={\omega /k}$ approximately equal to the mean centreline velocity. These modes are advected by uniform mean flow and eventually damped by viscosity in the streamwise direction (Grosch & Salwen Reference Grosch and Salwen1978). The boundary-layer branch consists of a cluster of modes with varying phase speeds. The streamwise velocity component of the least-stable eigenmodes from each branch are plotted in figure 20(g).
Eigenvalue spectra at  $x_0=x=-1$ for (a–c)
 $m=0$ and (d–f)
 $m=1$. Boundary-layer modes (orange square); free-stream modes (blue circle). (g) Real part of streamwise velocity: eigenmodes from free-stream (solid line) and boundary-layer (dashed line) branches.

Besides the class of eigenmodes introduced above, the axisymmetric eigenmodes can be further regrouped into two families: pairs of meridional and torsional modes (Böberg & Brosa Reference Böberg and Brosa1988; Tumin Reference Tumin1996). A meridional mode has  $\hat {u}_{x},\hat {u}_{r},\hat {p}$ components with non-zero amplitudes and azimuthal velocity component
 $\hat {u}_{\theta }$ equal to zero. On the other hand, a torsional mode has
 ${\hat {u}}_{\theta }$ with non-zero amplitude, while the other velocity and pressure components are equal to zero. The torsional modes appear due to the decoupling of the azimuthal momentum conservation equation from other equations for
 $m=0$.
B.2. Matrix operators for linearised Navier–Stokes equations
The matrix form of the eigenvalue problem considered in (B2) is given as
 \begin{equation}
\left[\begin{array}{@{}cccc@{}} L_{11} & L_{12} & 0 & 0 \\ 0 &
L_{22} & L_{23} & L_{24} \\ 0 & L_{32} & L_{33} & L_{34} \\
0 & L_{42} & L_{43} & L_{44} \end{array}
\right]\left[\begin{array}{@{}c@{}} \hat{u} \\ \hat{v} \\ \hat{w}
\\ \hat{p} \end{array} \right]=\alpha
\left[\begin{array}{@{}cccc@{}} F_{11} & 0 & 0 & F_{14} \\ 0 &
F_{22} & 0 & 0 \\ 0 & 0 & F_{33} & 0 \\ F_{41} & 0 & 0 & 0 \end{array} \right] \left[\begin{array}{@{}c@{}} \hat{u} \\
\hat{v} \\ \hat{w} \\ \hat{p} \\ \end{array}
\right],
\end{equation}
with  $0$ and
 $I$ as, respectively, zero and identity matrices of
 $N\times N$ dimensions. Here
 $N$ is the number of Chebyshev collocation points;
 $D$ denotes the first-order derivative in the radial direction;
 $m$ and
 $\omega$ are azimuthal wavenumber and angular frequency, respectively, and
 $Re$ is the Reynolds number. The matrix operators in (B9) are defined as
 $$\begin{gather} \varDelta ={-}\dfrac{m^{2}}{r^{2}} + \dfrac{1}{r}\dfrac{\partial}{\partial r} + \dfrac{\partial^{2}}{\partial r^{2}}, \end{gather}$$
 $$\begin{gather}C = \dfrac{2 \textrm{i} m}{r^{2}}, \end{gather}$$
 $$\begin{gather}L_{11} ={-}\textrm{i}\omega I - \dfrac{\varDelta}{Re} , \quad L_{12} = \dfrac{\partial u}{\partial r}, \end{gather}$$
 $$\begin{gather}L_{33} = L_{22} ={-}\textrm{i}\omega I - \left(\varDelta - \dfrac{1}{r}\right)\dfrac{1}{Re} , \quad L_{23} = \dfrac{C}{Re}, \end{gather}$$
 $$\begin{gather}L_{24} = \dfrac{\partial}{\partial r}, \quad L_{32} = \dfrac{-C}{Re}, \end{gather}$$
 $$\begin{gather}L_{34} = L_{43} = \dfrac{\textrm{i} m}{r}, \quad L_{42} = \dfrac{1}{r} + \dfrac{\partial}{\partial r}, \end{gather}$$
 $$\begin{gather}F_{11} = F_{22}= F_{33} ={-}\textrm{i}U \quad F_{14}=F_{41}={-}\textrm{i}I. \end{gather}$$