1. Introduction
The basic mechanism of the thin-layer, shear-flow instability, known as the Kelvin–Helmholtz (KH) instability, refers to the fluid motion generated at a shear zone separating two uniform layers, of generally different density, moving in equal and opposite directions. If the shear layer is taken to have zero thickness, the flow is termed a ‘vortex-sheet’ instability. Helmholtz (Reference Helmholtz1868) first discussed the fluid dynamical prototype while Lord Kelvin (Thompson Reference Thompson1871) later developed the linear theory for vortex-sheet KH instability. The KH instability is important and often dominant in many atmospheric and oceanic fluid phenomena that often involve the transition to and production of turbulence.
Vortex-sheet instability is known to exhibit ill posedness in general, in the sense of unbounded growth of arbitrarily small-wavelength disturbances. Consequently, the fluid dynamics beyond the linear growth stage has been widely studied. See; Moore (Reference Moore1978), Krasny (Reference Krasny1986b), Baker & Shelley (Reference Baker and Shelley1990), Sohn (Reference Sohn2016) and Caflisch, Lombardo & Sammartino (Reference Caflisch, Lombardo and Sammartino2020). Rosenhead (Reference Rosenhead1931) performed a numerical simulation using twelve point vortices per wavelength, observing a tendency of the vortex sheet to roll up into vortex cores. Calculations with up to twenty vortices were discussed by Birkhoff (Reference Birkhoff1962), who reported the onset of non-smooth, random-like motion, behaviour later associated with loss of analyticity (Ely & Baker Reference Ely and Baker1994) in the vortex-sheet evolution.
An advance in understanding was made by Moore (Reference Moore1979), who showed that a small-amplitude initial disturbance to an initially flat vortex sheet whose evolution was governed by the Birkhoff–Rott (BR) equation (Rott Reference Rott1956; Birkhoff Reference Birkhoff1962) produced a curvature singularity in a finite (critical) time  $t_c$ proportional to the logarithm of the inverse disturbance amplitude. Verification of this prediction has been the subject of several high fidelity numerical simulations (Krasny Reference Krasny1986a; Shelley Reference Shelley1992; Nitsche Reference Nitsche2001). Meiron, Baker & Orszag (Reference Meiron, Baker and Orszag1982) solved the BR equation using a high-order Taylor series, finding singularity formation in a finite time. Existence of solutions up to a near-singularity formation time for a slightly perturbed, flat vortex sheet was demonstrated by Caflisch & Orellana (Reference Caflisch and Orellana1986). Exact solutions of the BR equation that show singularity formation have been reported by Duchon & Robert (Reference Duchon and Robert1988) and also Caflisch & Orellana (Reference Caflisch and Orellana1989). Cowley, Baker & Tanveer (Reference Cowley, Baker and Tanveer1999) explored the dynamics of the singularity formation event, showing that it can be interpreted as the convergence of a
 $3/2$-power singularity in the extended complex plane of the Lagrangian vortex sheet parameter, onto the real axis at
 $t=t_c$. They also estimated the vortex-sheet shape as
 $t\to t_c^-$ from below, giving a local form of the curvature singularity formed by a perturbation from a locally flat sheet.
Vortex-sheet motion for  $t>t_c$ has been studied using the vortex-blob formulation (Krasny Reference Krasny1986a; Baker & Pham Reference Baker and Pham2006; Sohn Reference Sohn2016), which removes singularity formation, allowing long-time numerical simulation. Blob-based simulations show fine-scale geometry near the singularity formation region for
 $t>t_c$ at scales below the blob size. Whether the sub-blob evolution scales faithfully depict the immediate post-singularity vortex-sheet evolution very near the point of singularity formation, or are a blob-size-dependent artefact of the blob approximation, remains an open question. See Caflisch et al. (Reference Caflisch, Gargano, Sammartino and Sciacca2022) for discussion and Baker & Pham (Reference Baker and Pham2006) for detailed comparative numerical simulations.
Alternative approaches study the limit when a small parameter approaches zero, of initial-value solutions of either the Euler or Navier–Stokes equations. Baker & Shelley (Reference Baker and Shelley1990) solve the Euler equations describing the motion of a thin, uniform vorticity layer whose thickness is small compared with the local layer-centreline curvature, observing the formation of a central bulge in the region where singularity formation is expected for the vortex-sheet limit. Within the bulge exists a double-branched spiral curve whose material initial condition corresponds to the initial centreline of the perturbed layer. Using numerical Navier–Stokes simulations, Caflisch et al. (Reference Caflisch, Gargano, Sammartino and Sciacca2022) report the formation of an inner core with internal properties scaling on the Reynolds number. Their intermediate Reynolds number simulations reveal the formation of dual, separated vorticity cores that later merge.
Both the blob and physical-parameter simulations indicate that, prior to the singularity formation event, there is convergence to the vortex-sheet limit when the regularization parameter approaches zero; see Baker & Pham (Reference Baker and Pham2006) for blob calculations. Finite-time analyticity of the BR vortex-sheet problem with analytic initial data has been established; see Sulem et al. (Reference Sulem, Sulem, Bardos and Frisch1981), Majda & Bertozzi (Reference Majda and Bertozzi1992) and Wu (Reference Wu2006). Owing to the singular nature of the initial condition generated by singularity formation, the problem of continuing the solution of the BR equation for  $t>t_c$ may not be unique, resulting in the existence of several, many and possibly infinitely many admissible classical continuation solutions. Hence, convergence of regularized solutions to one or more classical BR solutions in the immediate vicinity of the singularity formation region remains uncertain, and may be regularization dependent.
Presently, we describe the construction of a solution of the BR equation as a viable continuation of the Moore solution, valid for arbitrarily small time beyond  $t_c$. The arguments and analysis comprise Taylor-series expansion, series summation, analytic continuation of summed expressions and numerical solution of both nonlinear and linear forms of the BR equation in several different but overlapping solution regimes. A summary of the role played by these elements is as follows.
(i) The full solution domain consists of a single spatial period of an infinite, flat vortex sheet in an incompressible, inviscid fluid of uniform density, that is subject to a generalized, single mode, periodic disturbance of small amplitude
 $\epsilon$ at $t=0$. Defining $\tau =t-t_c$, then for $\tau >0$ this is partitioned into three sub domains:
(a) An outer domain denoted region I comprising the single-period sheet.
(b) An intermediate domain denoted region II. This is defined as the region of validity of a solution comprising the most singular term in the time-wise Taylor-series expansion of the BR equation, using the inner expansion of the Moore solution at
$t=t_c$ as initial condition.(c) An inner domain, denoted region III, that is close to, and includes the singular point generated at
$t=t_c$.
Region III exists only for
$t>t_c$. A proper description of region II requires a prior derivation of an appropriate solution. Quantitative definitions of the three sub-domains will be given at the end of § 2.(ii) In § 2 we extend the series approach of Moore (Reference Moore1979) using a generalized, single-mode initial condition. The series can be summed to provide a small-
$\epsilon$ solution for the full-sheet structure near $t=t_c$ in terms of polylogarithm functions. This enables determination of the leading-order (in the cumulative circulation variable $\varGamma$) sheet shape near the point of curvature singularity formation at $t=t_c$. This is termed an intermediate initial condition for a region-II solution, comprising a flat sheet with an added $\varGamma ^{3/2}$ term that contains the singular behaviour. The polylog solution can be analytically continued for $t>t_c$ outside the range of convergence of the generating Fourier series. This shows sheet-branch separation or tearing at the sheet symmetry point at $t=t_c^+$.(iii) Next, in § 3, the first two terms of a Taylor series in time are found based on repeated time-wise differentiation of the BR equation for
$t>t_c$. These give the sheet velocity and acceleration at $t=t_c$ that are compared in § 4 with numerical evaluation of the Biot–Savart induced velocity from the Moore solution. In § 5, this analysis is extended to give the full Taylor-series solution for the most singular term of the BR equation. This series is shown to have a finite radius of convergence in a similarity parameter $\eta \sim \varGamma /(t-t_c)$, but can be summed to provide a closed-form expression defined as a region-II solution. The radius of convergence is taken as the inner bound of region II. This solution can also be analytically continued inside the series radius of convergence towards $\eta \to 0$, which is equivalent to $\varGamma \to 0$ for $t>t_c$. Sheet tearing is also found, which is shown in an appendix to be in quantitative agreement with the analytic continuation of the extended Moore solution in region I.(iv) An inner solution in region III is developed in § 6. It is noted that the analytically continued region-I and region-II solutions display free vortex-sheet endpoints or tips that, without endpoint vortex-sheet roll up, are considered non-physical. The tearing feature, together with the perturbed similarity form of the region-II solution, nonetheless suggest an inner similarity expansion of the BR equation, leading to a nonlinear equation that describes a dominant or zeroth-order inner solution, together with a first-order correction in the small parameter
$(t-t_c)^{1/2}$, defined by a linearized BR equation. It is argued that a solution of the zeroth-order equation based on double-spiral, vortex-sheet roll up about the singular point does not exist. The only available alternative is a sheet geometry comprising a pair of spatially separated, antisymmetric algebraic spirals. This structure is interpreted as consistent with the sheet tearing suggested by the analytically continued region-II solution, while restoring the physically expected, end-sheet roll up.(v) Numerical solutions to both the nonlinear zeroth- and linear first-order equations in region III are obtained that effectively match the corresponding region-II solution components for large
$\eta$. When the similarity plane is transformed back to the physical plane using a compression factor proportional to $\tau$, the zeroth-order, spiral vortices show roll-up centres that mutually recede as $t-t_c$, together with a $(t-t_c)^{3/2}$ correction provided by the outer flow. Near the sheet endpoints, the order-$(t-t_c)^{3/2}$ solution component agrees qualitatively but not quantitatively with the analytically continued region-II solution.(vi) The composite region-II–region-III solutions are discussed in § 6.4 while conclusions are summarized in § 7.


2. Moore solution in region I
2.1. Problem definition
First, we extend Moore's solution for the evolution of a spatially periodic vortex sheet with a family of initial perturbations. Evolution of the vortex sheet in two-dimensional potential flow is described by a parameterized complex curve
 \begin{equation} z(\varGamma,t) = x(\varGamma,t)+{\rm i}y(\varGamma,t), \end{equation}
where  $t$ is time and
 $\varGamma$ measures the circulation in the sheet between an arbitrary point with coordinate
 $z$ and a reference fluid particle chosen as
 $\varGamma =0$. The sheet shape evolution in time is governed by the BR equation
 \begin{equation} \frac{\partial {\bar{z}}(\varGamma,t)}{\partial t}=\frac{1}{2{\rm \pi} {\rm i}}{\int\hskip -1,05em -\,}_{-\infty}^{\infty}\frac{{\rm d}\hat{\varGamma}}{z(\varGamma,t)-z(\hat{\varGamma},t)}, \end{equation}
where  ${\bar {z}}$ is the complex conjugate of
 $z$ and the right-hand side is understood as a Cauchy principal-value (CPV) integral. We will assume that
 $z(\varGamma,t)$ satisfies two conditions
 \begin{equation} z(\varGamma+2{\rm \pi},t) = 2{\rm \pi} + z(\varGamma,t),\quad z(-\varGamma,t) ={-}z (\varGamma,t). \end{equation}
Using the second condition, (2.2) can be written in the form
 \begin{equation} \frac{\partial {\bar{z}}(\varGamma,t)}{\partial t}=\frac{1}{2{\rm \pi} {\rm i}}{\int\hskip -1,05em -\,}_0^{\infty}\left(\frac{1}{z(\varGamma,t)-z(\hat{\varGamma},t)} +\frac{1}{z(\varGamma,t)+z(\hat{\varGamma},t)}\right)\,{\rm d}\hat{\varGamma}. \end{equation}
We consider an initial-value problem that uses a general initial sinusoidal perturbation of the form
 \begin{equation} z(\varGamma,0)=\varGamma+ {\rm e}^{{\rm i}\phi} \epsilon \sin(\varGamma), \end{equation}
with initial amplitude  $0<\epsilon \ll 1$ and phase
 $\phi \in [0,2{\rm \pi} )$. The real component
 $\epsilon \cos \phi$ stretches the circulation distribution while the imaginary component
 $\epsilon \sin \phi$ perturbs the sheet shape. Moore (Reference Moore1979) studied the particular case where
 $\phi ={\rm \pi} /2$. See Krasny (Reference Krasny1986b), Cowley et al. (Reference Cowley, Baker and Tanveer1999) and Shelley (Reference Shelley1992) for discussion of and results for alternative initial conditions. The unperturbed sheet with
 $\epsilon =0$ corresponds to the uniform shear flow with velocity field given by
 \begin{equation} \boldsymbol{u}(x,y)=\left\{ \begin{array}{@{}ll@{}} \displaystyle\left(-\frac{1}{2},0\right), & y>0,\\ \displaystyle\left(\frac{1}{2},0\right), & y<0. \end{array} \right. \end{equation}
2.2. Fourier expansion
For  $t>0$, Moore (Reference Moore1979) expresses the sheet function in a Fourier series
 \begin{equation} z(\varGamma,t)=\varGamma+\sum_{n={-}\infty}^{\infty}\mathcal{A}_n(t) {\rm e}^{{\rm i}n\varGamma}, \end{equation}
here with initial conditions according to (2.5)
 \begin{equation} \mathcal{A}_{{\pm} 1}(0)={\mp} \frac{{\rm i}\,{\rm e}^{{\rm i}\phi} \epsilon}{2},\quad \mathcal{A}_n(0)=0,\quad (n\neq{\pm} 1). \end{equation}
It immediately follows from symmetry that
 \begin{equation} \mathcal{A}_0(t)=0,\quad \mathcal{A}_{{-}n}(t)={-}\mathcal{A}_n(t). \end{equation}
Substituting (2.7) into (2.2) leads to a system of ordinary differential equations (ODEs) for the Fourier coefficients  $\mathcal {A}_n$
 \begin{equation} \frac{{\rm d}\bar{\mathcal{A}}_{{-}n}}{{\rm d}t}=\frac{{\rm i}}{2{\rm \pi}}\left[\mathcal{A}_nI_1+\sum_{r_1+r_2=n}\mathcal{A}_{r_1}\mathcal{A}_{r_2}I_2+\cdots+ \sum_{r_1+r_2+\cdots+r_K=n}\left(\prod_{p=1}^{K}\mathcal{A}_{r_p} I_K\right)+\cdots\right], \end{equation}
where  $I_K$ is the principal-value integral with respect to
 $\xi =\hat {\varGamma }-\varGamma$
 \begin{equation} I_K={\int\hskip -1,05em -\,}_\infty^\infty \prod_{p=1}^K(1-{\rm e}^{{\rm i}r_p \xi})\xi^{{-}K-1}\,{\rm d}\xi, \end{equation}
where  $r_p=1,2,3,\ldots$ are indices of
 $\mathcal {A}$, and
 $p=1,2,3,\ldots$ are sub-indices for
 $r$.
To estimate  $\mathcal {A}_n$, the system of (2.10) can be further partitioned by the power series expansion
 \begin{equation} \mathcal{A}_n(t)=\sum_{j=0}^\infty \epsilon^{|n+2j|}\mathcal{A}_{n,{2j}}(t), \end{equation}
giving subsystems of ODEs for each  $\mathcal {A}_{n,0}$,
 $\mathcal {A}_{n,2}$,
 $\mathcal {A}_{n,4}$,…. In particular, at leading order,
 $O(\epsilon ^{|n|})$, the corresponding integral defined in (2.11) can be calculated using residues as
 \begin{equation} I_K={\rm \pi} {{\rm i}^{K+1}} ({-}1)^{K} \prod_{p=1}^Kr_p,\quad (r_p\geq 1), \end{equation}
leading to the following evolution equations for  $\mathcal {A}_{n,0}$:
 \begin{align} \frac{{\rm d}\bar{\mathcal{A}}_{n,0}}{{\rm d}t}=\frac{1}{2}\left[\!\mathcal{A}_{n,0}(-{\rm i})n+\cdots+\left(\!\sum_{\substack{r_1+r_2+\cdots+r_K=n\\r_1,r_2,\ldots,r_K\geq 1}}(-{\rm i})^K\prod_{p=1}^K \mathcal{A}_{r_{p},0}\,r_p\!\right)+\cdots+\mathcal{A}_{1,0}^n(-{\rm i})^n\!\right]\!. \end{align}
The first two equations read explicitly as
 \begin{equation} \frac{{\rm d}\bar{\mathcal{A}}_{1,0}}{{\rm d}t}={-}\frac{{\rm i}}{2}\mathcal{A}_{1,0},\quad \frac{{\rm d}\bar{\mathcal{A}}_{2,0}}{{\rm d}t}={-}{\rm i}\mathcal{A}_{2,0}-\frac{1}{2}\mathcal{A}_{1,0}^2. \end{equation}
2.2.1. Asymptotic coefficients
The ODE system (2.14) and (2.8) can be solved recursively to give, for example, the asymptotic  ${\mathcal {A}}_{1,0}$ and
 ${\mathcal {A}}_{2,0}$ for large
 $t$ as follows:
 \begin{equation} \left. \begin{gathered} \mathcal{A}_{1,0}=\frac{(1+{\rm i}){\rm e}^{t/2}}{4}\lambda_{1,0}+O({\rm e}^{{-}t/2}),\\ \mathcal{A}_{2,0}=\frac{(1+{\rm i}){\rm e}^{t}}{16}(\lambda_{2,0}\,t+\lambda_{2,1})+O({\rm e}^{{-}t}), \end{gathered} \right\} \end{equation}
where
 \begin{equation} \left. \begin{gathered} \lambda_{1,0} \equiv \lambda_1= \sin\phi-\cos\phi,\\ \lambda_{2,0}=\frac{\lambda_1^2}{2}=\frac{1-\sin 2\phi}{2},\quad\lambda_{2,1}=\frac{4 \cos 2 \phi -\sin 2 \phi -1+(1-\sin 2 \phi ){\rm i}}{4}. \end{gathered} \right\} \end{equation}
Here, we require  $\lambda _1\neq 0$, i.e.
 $\phi \neq {\rm \pi}/4, 5{\rm \pi} /4$, to retain the leading-order behaviour. Special cases with
 $\lambda _1=0$ are not considered in this study.
Moore (Reference Moore1979) showed by induction that the solution for the leading-order  $\mathcal {A}_{n,0}$ takes the form
 \begin{equation} \mathcal{A}_{n,0}\sim \frac{(1+{\rm i}){\rm e}^{nt/2} }{4^n}[\lambda_{n,0}t^{n-1}+\lambda_{n,1}t^{n-2}+\cdots], \end{equation}
where, by abbreviating  $\lambda _{n} \equiv \lambda _{n,0}$, the leading-order coefficient
 $\lambda _n$ for
 $n\geq 2$ is given by the following recursion:
 \begin{equation} \lambda_n=\frac{1}{2(n-1)}[(n-1)\lambda_1 \lambda_{n-1}+2(n-2)\lambda_2\lambda_{n-2}+\cdots+(n-1)\lambda_{n-1}\lambda_1]. \end{equation}
To determine the large  $n$ behaviour of
 $\lambda _n$, Moore (Reference Moore1979) proposed a generating function
 $g(x)$ defined for
 $x\in \mathbb {R}$ as
 \begin{equation} g(x)=\sum_{n\geq 1} \lambda_n x^n, \end{equation}
with
 \begin{equation} g'(0) = \lambda_1, \end{equation}
given by (2.17). The recursion (2.19) thus implies
 \begin{equation} g'(x) = \frac{1-\sqrt{1-2g(x)}}{x}. \end{equation}
Equations (2.22) and (2.21) can be solved in closed form as
 \begin{equation} g(x)={-}\tfrac{1}{2} W_0(-\lambda_1 x) \left[W_0(-\lambda_1 x)+2\right], \end{equation}
where  $W_0$ is the Lambert W function. Taylor expanding (2.23) around
 $x=0$ yields
 \begin{equation} g(x)=\sum_{n\geq 1}c_n\lambda_1^n x^n =\lambda_1 x+\frac{\lambda_1^2 x^2}{2}+\frac{\lambda_1^3 x^3}{2}+\frac{2\lambda_1^4 x^4}{3}+\cdots.\end{equation}
Therefore, comparing (2.20) and (2.24) shows
 \begin{equation} \lambda_n =c_n \lambda_1^n. \end{equation}
Here,  $c_n>0$ given in (2.24) also corresponds to the special case
 $\lambda _1=1$ (i.e.
 $\phi ={\rm \pi} /2$) studied by Moore (Reference Moore1979), where it is shown that
 \begin{equation} c_n\sim \frac{e^n}{\sqrt{2{\rm \pi}}n^{5/2}}, \end{equation}
as  $n\to \infty$. Finally, substituting (2.26), (2.25) and (2.18) into (2.12) completes the following asymptotic Fourier coefficients
 $\mathcal {A}_n$ for
 $t\gg 1$,
 $n\gg 1$ and
 $t\gg n$:
 \begin{equation} \mathcal{A}_n(t)\sim \frac{(1+{\rm i})[\text{sign}(\lambda_1)]^n}{\sqrt{2{\rm \pi}}n^{5/2} t}\exp\left\{n\left[1+\frac{t}{2}+\ln \left(\frac{|\lambda_1|\epsilon t}{4}\right)\right]\right\}. \end{equation}
Compared with the special case of  $\lambda _1=1$, it is seen that a general
 $\lambda _1\neq 0$ simply rescales the initial perturbation size
 $\epsilon$ to
 $|\lambda _1|\epsilon$ for the coefficients
 $|\mathcal {A}_n(t)|$.
2.2.2. Critical time of singularity formation
Owing to correction terms contained in (2.18), the leading-order  $\mathcal {A}_{n,0}$ given by (2.27), as an approximation of
 $\mathcal {A}_{n}$, deteriorates in accuracy as
 $n\to \infty$ for fixed
 $t$. Moore (Reference Moore1979) resolved this non-uniformity by introducing a strained time
 $s$, and consequently obtained
 \begin{align} \mathcal{A}_{n,0}(t)=\frac{1}{\sqrt{2{\rm \pi}}}n^{-({5}/{2})}\left(\frac{\lambda_{1}}{4}s {\rm e}^{{s}/{2}+1}\right)^n\left[\frac{1+{\rm i}}{s}+O\left(\frac{1}{s^2}\right)\right],\quad s=t+\frac{\alpha_1}{t}+O(t^{{-}2}), \end{align}
where  $\lambda _{1}=1$ and
 $\alpha _1=2$. In Appendix A, we show that (2.28) also holds for the general case of
 $\lambda _{1}\neq 1$, where the constant
 $\alpha _1=\alpha _1(\phi )$ as a function of
 $\phi$ is given by (A13).
Equations (2.12) and (2.28) imply that, in contrast to (2.27), the uniformly convergent Fourier coefficients are expressed in terms of  $s$ as follows:
 \begin{equation} \mathcal{A}_n(t(s))\sim \frac{(1+{\rm i})[\text{sign}(\lambda_1)]^n}{\sqrt{2{\rm \pi}}n^{5/2} s}\exp\left\{n\left[1+\frac{s}{2}+\ln \left(\frac{|\lambda_1|\epsilon s}{4}\right)\right]\right\}. \end{equation}
Therefore, at a critical time  $t_c(\epsilon )$ defined by
 \begin{equation} 1+\frac{s_c}{2}+\ln s_c=\ln\left(\frac{4}{|\lambda_1|\epsilon}\right), \quad t_c=s_c+O(s_c^{{-}1}), \end{equation}
the  $\mathcal {A}_n$ values for the Fourier series (2.7) given by (2.29) lose their exponential decay for
 $t\ge t_c$, and transition to algebraic decay as
 $O(n^{-5/2})$. Consequently, the initially smooth vortex sheet spontaneously loses analyticity of its shape function
 $z$ at
 $t_c$, when a singularity develops. This singularity is of the same form as that exhibited in (2.27), but occurs at a slightly different time. For small perturbation size
 $\epsilon$, and consequently large critical time,
 $t_c$ can be well approximated by solving (2.30) at leading order to give
 \begin{equation} t_c=2W_0\left(\frac{2}{e|\lambda_1 |\epsilon}\right), \end{equation}
where  $W_0$ is again the Lambert W function.
2.3. Sheet structure at critical time
Using (2.7), (2.8) and (2.12), the series describing the vortex-sheet shape can be asymptotically summed for small  $\epsilon$ as
 \begin{equation} z(\varGamma,t)=\varGamma+2{\rm i}\sum_{n=1}^\infty \mathcal{A}_n(t) \sin(n\varGamma)\simeq \varGamma+2{\rm i}\sum_{n=1}^\infty \mathcal{A}_{n,0}(t)\epsilon^n \sin(n\varGamma). \end{equation}
With  $\mathcal {A}_{n,0}$ given by (2.28), the Fourier series (2.32) converges uniformly to
 \begin{gather}
z(\varGamma,t) \simeq \varGamma-\frac{\begin{array}{l}\left(1+{\rm
i}\right) \left[\text{Li}_{{5}/{2}}\left(\frac{\text{sign}(\lambda_1)t|\lambda_1|\epsilon}{4}
{\rm e}^{-{\rm i} \varGamma+1+({t}/{2})}\right) -\text{Li}_{{5}/{2}}\left(\frac{\text{sign}(\lambda_1)t|\lambda_1|\epsilon}{4}
{\rm e}^{{\rm i}
\varGamma+1+({t}/{2})}\right)\right]\end{array}}{\sqrt{2 {\rm \pi}} t},
\end{gather}
for all  $t\leq t_c$ up to the critical time
 $t_c$ given by (2.31), where
 $\textrm {Li}_n(s)\equiv \sum _{p=1}^\infty s^p/p^n$ is the polylogarithm function. Evaluating (2.33) at
 $t=t_c$ yields the critical sheet shape,
 ${z_c=z(\varGamma,t_c)}$, as follows:
 \begin{equation} z_c(\varGamma) \simeq \varGamma-\frac{\left(1+{\rm i}\right) \left[\text{Li}_{{5}/{2}}\left(\text{sign}(\lambda_1) {\rm e}^{-{\rm i} \varGamma}\right)-\text{Li}_{{5}/{2}}\left(\text{sign}(\lambda_1) {\rm e}^{{\rm i} \varGamma}\right)\right]}{\sqrt{2 {\rm \pi}} t_c}. \end{equation}
Equation (2.28) is valid for  $n$ large, and the addition of low-mode corrections would modify (2.34). This is expected to be analytic and so will not change the nature of the singularity.
If  $\lambda _1>0$ then, near the origin, where
 $0 \le \varGamma \ll 1$, (2.34) takes the asymptotic form
 \begin{equation} z_c({\varGamma}) \sim b(\varGamma+A \varGamma^{3/2} )+O(\varGamma^2), \end{equation}
where
 \begin{align}
b(\lambda_1\epsilon) = 1 - \frac{(1-{\rm i})\,\zeta\left(\frac{3}{2} \right)}
{\sqrt{2{\rm \pi}}\,W_0\left( \frac{2}{{\rm e}\,\lambda_1\epsilon} \right)} ,\quad
A(\lambda_1\epsilon) = \frac{1} {\frac{3}{4}\, (1+{\rm i})\,W_0\left(\frac{2}{ {\rm e}\,\lambda_1\epsilon} \right)
- \frac{3\zeta\left( \frac{3}{2} \right)
}{2\,\sqrt{2{\rm \pi}}}} ,
\end{align}
and  $\zeta (3/2)\approx 2.61238$ is a constant following the Riemann zeta function
 $\zeta ({\cdot })$. Both (2.33) and (2.34) satisfy
 $z(-\varGamma,\tau ) = -z(\varGamma,\tau )$ as required but (2.35) does not because the complex constants are tailored to
 $\varGamma \ge 0^+$. This will not affect the subsequent analysis. An expression for the sheet shape at
 $t=t_c$,
 $\varGamma <0$ which satisfies the proper symmetry can be obtained but is not needed. Equation (2.35) agrees with a similar result at
 $t=t_c$ obtained by Cowley et al. (Reference Cowley, Baker and Tanveer1999), although estimates of constants differ.
Similarly, if  $\lambda _1<0$, (2.34) can be expanded around
 $\varGamma ={\rm \pi}$ to show the same power series as (2.35). Since the role of
 $\lambda _1\neq 1$ in both cases is to rescale
 $\epsilon$ while preserving the same sheet shape near the singularity, we subsequently commit to the Moore (Reference Moore1979) initial value with
 $\lambda _1=1$, i.e.
 $\phi ={\rm \pi} /2$, without loss of generality. The variation of both the real and imaginary parts of
 $b(\epsilon )$ and
 $A(\epsilon )$ (
 $\lambda _1=1$) are displayed in figure 1. For
 $\epsilon \le 0.0439064$, the argument of
 $A$ lies in the fourth quadrant, crossing to the third quadrant for larger values. Later the special case
 $\mathrm {Re}[A]=\mathrm {Im}[A]$ or
 $\arg [A] = 5{\rm \pi} /4$ will arise. This occurs with
 $\epsilon = 0.248985,A = -0.639680 - 0.639680\textrm {i}, b=i$ which is nominally out of range of the present discussion. Calculations will generally use
 $\epsilon = 10^{-3}$ for which
 $b = 0.791266 + 0.208734\textrm {i}$,
 $A = 0.116149 - 0.199386\textrm {i}$. Asymptotic results with
 $\epsilon \to 0$ will also be presented.
(a) Real (solid) and imaginary (dashed) parts of  $b(\epsilon )$ vs
 $\epsilon$. (b) Real (solid) and negative imaginary (dashed) parts of
 $A(\epsilon )$ vs
 $\epsilon$.

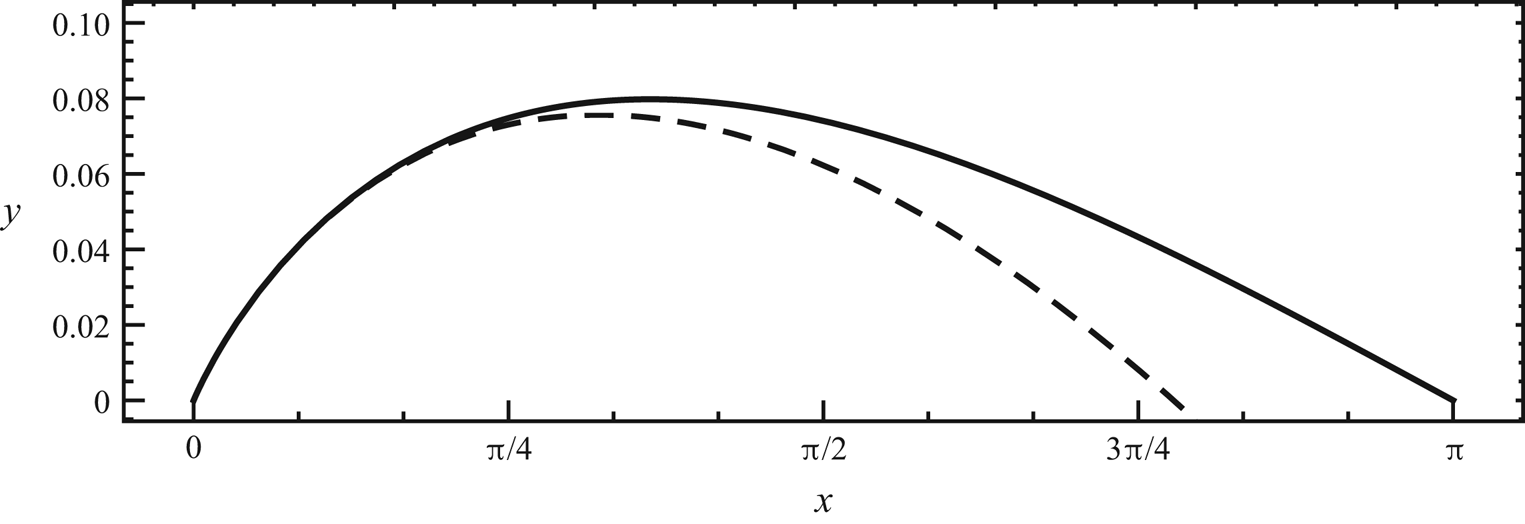
Figure 2 shows the sheet shape in  $0\le x \le {\rm \pi}$ for
 $\epsilon = 10^{-3}$ given by both (2.34) and the leading-order approximation (2.35). With
 $\epsilon = 10^{-3}$, the sheet angle at the origin at
 $t=t_c$ is
 $\arg [b(10^{-3})] = 0.257922$ radians or
 $14.7779^\circ$. The vortex-sheet strength,
 $\gamma \equiv |\partial z/\partial \varGamma |^{-1}$, which measures the jump in tangential velocity across the sheet, can be calculated from (2.34) at
 $t=t_c$ as
 \begin{equation} \gamma_c= \left| \frac{(1+{\rm i}) \sqrt{{\rm \pi} } {t_c}}{(1+{\rm i}) \sqrt{{\rm \pi} } {t_c}-\sqrt{2} [\text{Li}_{{3}/{2}}({\rm e}^{-{\rm i} \varGamma})+\text{Li}_{{3}/{2}} ({\rm e}^{{\rm i} \varGamma})]}\right|,\end{equation}
which is continuous for all  $\varGamma \in [0,2{\rm \pi} ]$. From (2.37) or using (2.35)–(2.36a,b) it can be shown that, with
 $t=t_c$, as
 $\epsilon$ increases and
 $A$ crosses the imaginary axis at
 $\epsilon = 0.0439064$, then
 $\gamma _c$ changes from a local maximum, with negative singular gradient at
 $\varGamma \to 0^+$, to a local minimum while the sheet angle at the singular point passes through
 $\arg [b] = 45^\circ$. Since
 $\epsilon <<1$ for the Moore solution we will generally consider
 $\mathrm {Re}[A]>0$.


Using (2.35), the sheet curvature  $\kappa$ for small
 $\varGamma$ follows as
 \begin{equation} \kappa\sim \frac{t_c^2}{\left(2 \alpha ^2-2 \alpha t_c+t_c^2\right){}^{3/2} \sqrt{\varGamma}}=O\left(\frac{1}{\sqrt{\varGamma}}\right), \end{equation}
with  $\alpha =\sqrt {2/{\rm \pi} }\zeta (3/2)\approx 2.084$, which is singular when
 $\varGamma \to 0^+$.
2.4. Continued solution beyond critical time
We now address the motion of the sheet near  $\varGamma \to 0$ for small times after
 $t_c$,
 $t>t_c$ where
 $\tau \equiv t-t_c\ll 1$. This is first explored by analytically continuing the Fourier series solution for the sheet shape
 $z$ obtained in (2.32) and (2.33) outside its domain of uniform convergence. Indeed, for
 $t< t_c$, the polylogarithm function
 $\textrm {Li}_{{5}/{2}}(w)$ contained in the summed form (2.33) with varying
 $\varGamma \in [0,2{\rm \pi} ]$ is evaluated inside the complex unit disk
 $\{w\in \mathbb {C},\,|w|<1\}$, where
 $\textrm {Li}_{{5}/{2}}({\cdot })$ remains a holomorphic function of
 $\varGamma$. When
 $t=t_c$,
 $\textrm {Li}_{{5}/{2}}({\cdot })$ is accessed along the unit circle, and its branch point
 $w=1$ is approached from both sides as
 $\varGamma \to 0$ in (2.33). As a result, the critical sheet shape
 $z_c$ loses analyticity at
 $\varGamma =0$, but remains continuous. For
 $t > t_c$, i.e.
 $\tau >0$, the asymptotic Fourier coefficients
 $\mathcal {A}_{n,0}$ given in (2.28) diverge as
 $n\to \infty$, and therefore the series solution breaks down. The summed form (2.33), originally obtained for
 $t < t_c$ can nonetheless be evaluated when
 $t>t_c$ as an analytic continuation because
 $\textrm {Li}_{{5}/{2}}(w)$ is in fact holomorphic for all
 $w\in \mathbb {C}\backslash (1,\infty )$. With
 $\lambda =1$ and
 $t= t_c+\tau$, this gives
 \begin{equation} z_{AC}(\varGamma,\tau)
= z(\varGamma,t_c+\tau) \simeq \varGamma-\frac{\left(1+{\rm
i}\right) [\text{Li}_{{5}/{2}}(J {\rm e}^{-{\rm
i} \varGamma})-\text{Li}_{{5}/{2}}(J {\rm
e}^{{\rm i} \varGamma})]}{\sqrt{2 {\rm \pi}}
\left[2 W_0\left(\frac{2}{e \epsilon }\right)+\tau\right]},
\end{equation}
where (2.31) is used, and
 \begin{equation}
J=J(\tau)= {\rm e}^{\tau /2} \left(\frac{\tau
}{2W_0\left(\frac{2}{e \epsilon }\right)}+1\right).
\end{equation}
At the origin  $z_{AC}(\varGamma \to 0^+,0)=0$ but since
 $J>1$ when
 $\tau >0$ the branch cut discontinuity along
 $w\in (1,\infty )$ of
 $\textrm {Li}_{{5}/{2}}(w)$ is crossed as
 $\varGamma \to 0^+$ in (2.39), leading to a discontinuous jump of the vortex-sheet profile at the origin. Specifically, this discontinuity at
 $\tau =0^+$ is given by
 $z_{AC}(0^+,0)=0$ when
 $\tau =0$ and
 \begin{equation}
z_{AC}(0^+,\tau)=\lim_{\varGamma\to 0^+}\left[
z_{AC}(\varGamma,\tau)\right]=\frac{\sqrt{2}(1-{\rm
i})\mathrm{Im}[\text{Li}_{{5}/{2}}(J(\tau))]}{\sqrt{\rm \pi}\left[2
W_0\left(\frac{2}{e \epsilon }\right)+\tau\right]},
\end{equation}
when  $\tau >0$. Immediately after the critical time
 $t_c$, (2.41) is expanded for
 $\tau \ll 1$ as
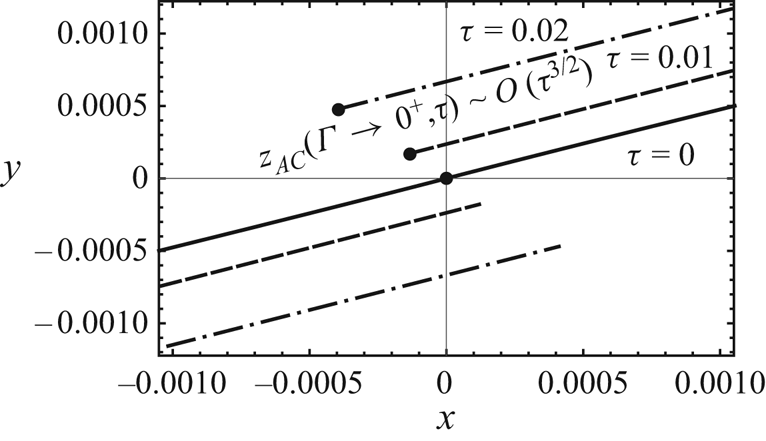
 \begin{equation} z_{AC}(0^+,\tau)\sim \frac{({-}1+{\rm i})\left(\frac{1}{W_0\left(\frac{2}{e \epsilon }\right)}+1\right)^{3/2} \tau ^{3/2}}{3W_0\left(\frac{2}{e \epsilon }\right)}+O(\tau^2), \end{equation}
suggesting that, when  $\tau > 0$, the vortex sheet, which passes through the coordinate origin at
 $\tau = 0$, separates into two distinct branches (sheet tearing) whose ends or tips separate as
 $\tau ^ {3/2}$. This is shown in figure 3, where the analytically continued sheet shape is shown near the origin for two values of
 $\tau$.


In the following we put  $b = |b|\exp (\textrm {i}\,\theta )$,
 $A = |A|\exp (\textrm {i}\,\chi )$, where
 $|b|$,
 $|A|$,
 $\theta$ and
 $\chi$ are known functions of
 $\epsilon$. We will refer interchangeably to variable sets
 $(\varGamma,\tau )$ and
 $(\eta,\tau )$ where
 \begin{equation} \tau = t - t_c,\quad \tau\ll1,\quad \eta = \frac{\varGamma\,|b|^2}{\tau}. \end{equation}
For clarity, we will refer to three regions defined for now by
(i)
$\textrm {I}\quad \textrm {Outer:} \quad \eta \gg 1,\quad 2{\rm \pi} >\varGamma >0,\quad \varGamma \gg \tau$;(ii)
$\textrm {II}\quad \textrm {Intermediate:}\quad \eta = {O}(1),\quad \varGamma = {O}(\tau )$;(iii)
$\textrm {III}\quad \textrm {Inner:} \quad 0\le \eta <1,\quad 0\le \varGamma <\tau$.


Region I may be considered as one full spatial period of the infinite vortex sheet. The Moore approximation outlined above gives the region-I solution at  $\tau =0^-$. Region II can be taken here as described by the initial condition (2.35) but more accurately as the region of validity of the region-II solution to be developed in § 5. There, it will be shown that analytic continuation of the region-II solution also exhibits sheet tearing. In Appendix B it is shown that sheet tearing noted above for the Moore solution and that for the region-II solution are somewhat different but agree in the limit
 $\epsilon \to 0$. Region III is to be discussed in § 6.
3. Intermediate problem: region II
A small-time solution in region II is sought as an expansion in a Taylor series about  $\tau = 0$. This will be expressed by successive differentiation with respect to
 $\tau$ of the BR equation, leading to a formal expression for
 $\partial z^n(\varGamma,\tau \to 0)/\partial \tau ^n$ in terms of the partial Bell polynomials
 $B_{n,k}$. Evidence for the equivalence of the leading-order solution for the intermediate problem in region II and the small-time motion of the full initial-value vortex-sheet evolution in region I will be established by demonstrating close numerical agreement, when
 $\varGamma \to 0$, of the first two time derivatives for regions I and II for several
 $\epsilon$. These correspond to the initial angular velocity and angular acceleration, respectively, of the sheet motion near
 $\varGamma =0$. These terms will be seen to be singular as
 $\varGamma ^{-1/2}$ and
 $\varGamma ^{-3/2}$ respectively.
3.1. Expansion as a Taylor series
Since the integration domain is fixed and the integral is well defined in the Cauchy sense, the time derivative and the integral commute. We can then form the  $n$th time derivative of (2.4) evaluated at
 $\tau =0$ as
 \begin{equation} \frac{\partial^n {\bar{z}}(\varGamma,\tau)}{\partial \tau^n}=\frac{1}{2{\rm \pi} {\rm i}}{\int\hskip -1,05em -\,}_0^{\infty} \frac{\partial^n}{\partial \tau^n} \left( \frac{1}{z(\varGamma,\tau)-z(\hat{\varGamma},\tau)} +\frac{1}{z(\varGamma,\tau)+z(\hat{\varGamma},\tau)} \right)|_{\tau=0}\,{\rm d}\hat{\varGamma}. \end{equation}
The time derivative inside the integral can be expressed by making use of the Faà di Bruno (Johnson Reference Johnson2002) formula for the time derivative of the composite function  $f(Z(t))$
 \begin{equation} \frac{{\rm d}^m}{{\rm d}\tau^m}\,f(Z(t))= \sum_{k=0}^m f^{(k)}(Z(\tau))B_{m,k}(Z^{(1)}(\tau),Z^{(2)}(\tau),\ldots,Z^{(m-k+1)}(\tau)),\end{equation}
where  $f,Z$ are functions for which all derivatives are defined, the superscript written as
 $(k)$ denotes the
 $k$th time derivative and
 \begin{equation} B_{m,k}\left(x_1,x_2,\ldots\ldots x_{m-k+1}\right)= \frac{1}{k!}\sum_{j_1+\cdots\cdots+j_k=m; j_i\ge1}\binom{m}{\,j_1,\ldots,j_k}\,x_{j1}\ldots x_{jk} , \end{equation}
are the partial Bell polynomials (Bell Reference Bell1927).
We apply (3.3) to evaluate the  $n$th time derivative inside the integral in (3.1) by identifying
 $f=1/Z(t)$, where
 $Z(\tau ) \to z(\varGamma,\tau )\pm z(\hat {\varGamma },\tau )$ separately for each of the two terms, followed by summation. Use of (3.2) in (3.1) then gives an explicit expression
 \begin{align}
\left.\frac{\partial^n {\bar{z}}(\varGamma,\tau)}{\partial
\tau^n}\right|_{\tau=0}&=\frac{1}{2{\rm \pi} {\rm
i}}{\int\hskip -1,05em -\,}_0^{\infty}\sum_{k=1}^m
\frac{({-}1)^k\,k!}{(z(\varGamma,0)-z(\hat{\varGamma},0))^k}\nonumber\\
&\quad \times B_{m,k}(z^{(1)}(\varGamma,0)-z^{(1)}(\hat{\varGamma},0),\ldots\ldots
z^{(m-k+1)}(\varGamma,0)\nonumber\\
&\quad -z^{(m-k+1)}(\hat{\varGamma},0))\,{\rm
d}\hat{\varGamma} + (\cdots\cdots+\cdots) ,
\end{align}
where  $(\cdots \cdots +\cdots )$ denotes a second term with
 $z(\varGamma,0)-z(\hat {\varGamma },0)$ and associated time derivatives replaced by
 $z(\varGamma,0)+z(\hat {\varGamma },0)$, as per the second term in (2.4).
The first four time derivatives can be written as
 $$\begin{gather} \frac{\partial {\bar{z}}(\varGamma,0)}{\partial \tau}=\frac{1}{2{\rm \pi} {\rm i}}{\int\hskip -1,05em -\,}_0^{\infty}\left(\frac{1}{z-\hat{z}} +[\cdots + \cdots]\right)\,{\rm d}\hat{\varGamma}, \end{gather}$$
 $$\begin{gather}\frac{\partial^2 {\bar{z}}(\varGamma,0)}{\partial \tau^2}=\frac{1}{2{\rm \pi} {\rm i}}{\int\hskip -1,05em -\,}_0^{\infty}\left(\frac{z^{(1)}-\hat{z}^{(1)}}{(z-\hat{z})^2} +[\cdots + \cdots]\right)\,{\rm d}\hat{\varGamma}, \end{gather}$$
 $$\begin{gather}\frac{\partial^3 {\bar{z}}(\varGamma,0)}{\partial \tau^3}=\frac{1}{2{\rm \pi} {\rm i}}{\int\hskip -1,05em -\,}_0^{\infty}\left(\frac{2\,(z^{(1)}-\hat{z}^{(1)})^2}{(z-\hat{z})^3} +[\cdots + \cdots] -\frac{z^{(2)}-\hat{z}^{(2)}}{(z-\hat{z})^2}-[\cdots + \cdots] \right)\,{\rm d}\hat{\varGamma}, \end{gather}$$
 $$\begin{gather}\frac{\partial^4 {\bar{z}}(\varGamma,0)}{\partial \tau^4}=\frac{1}{2{\rm \pi} {\rm i}}{\int\hskip -1,05em -\,}_0^{\infty}\left(\frac{6\,(z^{(1)}-\hat{z}^{(1)})^3}{(z-\hat{z})^4} +[\cdots +\cdots] -\frac{6\,(z^{(1)}-\hat{z}^{(1)})(z^{(2)}-\hat{z}^{(2)} )}{(z-\hat{z})^3} \right. \nonumber\\ \left. +[\cdots + \cdots] -\frac{z^{(3)}-\hat{z}^{(3)}}{(z-\hat{z})^2}-[\cdots + \cdots] \right)\,{\rm d}\hat{\varGamma}, \end{gather}$$
where all are understood to be evaluated at  $\tau =0$ with
 $z\to z(\varGamma,0)$,
 $\hat {z}\to z(\hat {\varGamma },0)$ and where the notation
 $[\cdots + \cdots ]$ indicates an addition of the preceding term with the minus sign replaced by plus. In principle, all derivatives can be evaluated sequentially. The first two terms of (2.35) are used in the kernel on the right-hand side of (3.5) and the integral evaluated to give
 $z^{(1)}(\varGamma,0)$. This can then be used in (3.6) to evaluate
 $z^{(2)}(\varGamma,0)$ and the process repeated. Each successive stage leads to increased complexity and, additionally, we cannot prove that all integrals converge.
3.2. Sheet velocity at $\tau =0$

Substituting (2.35) into the right-hand side of (3.5) and using the change of variables  $\hat {\varGamma }=x\varGamma$ and
 ${\zeta } = A\sqrt {\varGamma }$ gives the complex velocity
 $u-\textrm {i}\,v$ at
 $\tau =0$ as
 \begin{align} u-{\rm i}\,v = \left.\frac{\partial {\bar{z}}}{\partial \tau}\right|_{\tau=0}= \frac{1}{2{\rm \pi} {\rm i} b }{\int\hskip -1,05em -\,}_0^\infty \left(\frac{1}{1-x+\zeta\left(1-x^{3/2}\right)}+\frac{1}{1+x+\zeta\left(1+x^{3/2}\right)}\right)\,{{\rm d}\,x}. \end{align}
Expanding the integrand for small  $|\zeta |$ gives
 \begin{equation} \left.\frac{\partial {\bar{z}}}{\partial \tau}\right|_{\tau=0} = \frac{1}{2{\rm \pi} {\rm i} b }{\int\hskip -1,05em -\,}_0^\infty \left(\frac{2}{1-x^2}+\zeta\left(-\frac{1-x^{3/2}}{(1-x)^2}-\frac{1+x^{3/2}}{(1+x)^2}\right)\right)\,{{\rm d}\,x}+O\left(\zeta^2\right). \end{equation}
Using
 \begin{equation} {\int\hskip -1,05em -\,}_0^{\infty}\frac{{\rm d}\kern0.05em x}{1-x^2}=0,\quad {\int\hskip -1,05em -\,}_0^{\infty}\left(\frac{1-x^{3/2}}{(1-x)^2}+\frac{1+x^{3/2}}{(1+x)^2}\right)\,{{\rm d}\,x}={-}\frac{3{\rm \pi}}{2}, \end{equation}
then gives
 \begin{equation} \bar{z}^{(1)}(\varGamma,0) = \left.\frac{\partial {\bar{z}}}{\partial \tau}\right|_{\tau=0} ={-}\frac{3{\rm i} A}{4{b}}\sqrt{\varGamma}+O(\varGamma). \end{equation}
The sheet velocity vanishes at the origin as  $\varGamma \to 0$ at the critical time, but its angular velocity of order
 $z^{(1)}/\varGamma$ diverges as
 $O(1/\sqrt {\varGamma })$. So, for sufficiently small
 $0<\varGamma \ll 1$ and
 $\tau$, the vortex sheet admits the form
 \begin{equation} z(\varGamma,\tau)={b}(\varGamma+{A} \varGamma^{3/2}+ A_1 \varGamma^{1/2}\tau),\quad A_1 = \frac{3\,{\rm i}{\bar{A}}}{4|b|^2}. \end{equation}
3.3. Sheet acceleration at $\tau =0$

Equation (3.6) can be written in full as
 \begin{equation} \left.\frac{\partial^2
\bar{z}}{\partial \tau^2}\right|_{\tau=0}={-}\frac{1}{2{\rm \pi}
{\rm i}}{\int\hskip -1,05em -\,}_0^\infty
\left(\frac{z^{(1)}(\varGamma,0)-z^{(1)}(\hat{\varGamma},0)}{(z(\varGamma,0)-
z(\hat{\varGamma},0))^2}+\frac{z^{(1)}(\varGamma,0)+z^{(1)}(\hat{\varGamma},0)}{(z(\varGamma,0)
+z(\hat{\varGamma},t))^2}\right)\,{\rm
d}\hat{\varGamma}.
\end{equation}
Using (3.13) at  $\tau =0$ in (3.14) gives
 \begin{align} \left.\frac{\partial^2
\bar{z}}{\partial \tau^2}\right|_{\tau =0} ={-} \frac{A
A_1}{2{\rm \pi} {\rm
i}b\zeta}{\int\hskip -1,05em -\,}_0^\infty\left(\frac{1-x^{1/2}}{(1-x-\zeta(1-x^{3/2}))^2}+\frac{1+x^{1/2}}{(1+x+\zeta(1+x^{3/2}))^2}
\right)\,{{\rm d}\,x}.
\end{align}
Again expanding the integrand for  $|\zeta | \ll 1$ and evaluating the CPV integrals gives, after some algebra,
 \begin{equation} \left.\frac{\partial^2 \bar{z}}{\partial \tau^2}\right|_{\tau=0}=\frac{{\rm i} A}{4{b}\sqrt{\varGamma}}-\frac{{\rm i} {A}{A}_1}{2{b}}+O(\zeta). \end{equation}
Retaining only the leading-order term in (3.16), we can then extend (3.13) as
 \begin{equation} z(\varGamma,t)={b}\left(\varGamma+ A \varGamma^{3/2}+ \frac{3\,{\rm i}\bar{A}}{4\,|b|^2} \varGamma^{1/2}\tau -\frac{3A}{32|b|^4\,\varGamma^{1/2}}\tau^2 +\cdots \right) . \end{equation}
When the ordered expansions in  $\tau \ll 1$,
 $\varGamma \ll 1$ are taken in (2.39), and then the
 $\epsilon \to 0$ asymptotes of both the resulting expression and (3.17) obtained, then asymptotic matching at least up to
 $O(\tau ^2)$ is found. A numerical example is discussed in Appendix B.
4. Numerical comparison at $\tau =0$

4.1. Periodic parametrization
The accuracy of (3.12) and (3.16) is tested by high-precision numerical evaluation of the BR integral (2.2). We periodically parameterize the interface shape  $z(a)=x(a)+\textrm {i}y(a)$ and circulation
 $\varGamma (a)$ using ‘Lagrangian markers’,
 $a\in [0,2{\rm \pi} ]$, such that
 $x(a+2{\rm \pi} )=x(a)+2{\rm \pi}$,
 $y(a+2{\rm \pi} )=y(a)$ and
 $\varGamma (a+2{\rm \pi} )=\varGamma (a)+2{\rm \pi}$. The integral (2.2) can then be reduced to the finite domain
 \begin{equation} \left.\frac{\partial {\bar{z}}}{\partial \tau}\right|_{\tau=0} =\frac{1}{4 {\rm \pi}{\rm i}}{\int\hskip -1,05em -\,} _0^{2{\rm \pi} }\sigma(\hat{a})\cot\left(\frac{z(a,t)-z(\hat{a},t)}{2}\right)\,{\rm d}\hat{a}, \end{equation}
where  $\sigma (a)=\textrm {d}\varGamma /\textrm {d}a$. Similarly, the acceleration integral becomes
 \begin{equation} \left.\frac{\partial^2 {\bar{z}}}{\partial \tau^2}\right|_{\tau=0}={-}\frac{1}{8{\rm \pi} {\rm i}}{\int\hskip -1,05em -\,}_0^{2{\rm \pi}} \frac{\hat{\sigma}(\hat{a})(z^{(1)}-\hat{z}^{(1)})}{\sin^2 [(z-\hat{z})/2]}\,{\rm d}\hat{a}, \end{equation}
where  $z = z(a,t)$,
 $\hat {z}=z(\hat {a},t)$,
 $z^{(1)} = \partial z/\partial \tau$,
 $\hat {z}^{(1)} = \partial \hat {z}/\partial \tau$ and
 $\hat {\sigma }=\sigma (\hat {a})$. For numerical purposes, the introduction of interface markers
 $a$ allows discretized
 $\varGamma$ values to be distributed using a nonlinear monotonic stretching function of
 $a$, such as
 \begin{equation} \varGamma(a)=a-\beta\sin(\textit{a}), \quad \beta\in[0, 1]. \end{equation}
4.2. Complex velocity near $\varGamma =0$

To evaluate the vortex-sheet velocity at the critical time  $t = t_c (\tau =0)$,
 $z=z_c$ given by (2.34) is substituted into (4.1). With the choice of
 $\beta =0$, the principal-value integral can be evaluated directly for all
 $0\leq \varGamma \leq 2{\rm \pi}$ to arbitrary precision in a symbolic environment powered by mathematica®. A comparison between numerical evaluation of (4.1), denoted by
 $z^{(1)}_{num}$ and the intermediate-problem asymptotic approximation given by (3.12), and denoted presently by
 $z^{(1)}_{asy}$, is shown in figure 4(a), using
 $\epsilon =0.001, 0.01, 0.1$, where the
 $O(\sqrt {\varGamma })$ convergence of
 $z^{(1)}$ is clearly seen. Accuracy of the analytical estimate can be established for small
 $\varGamma$ in figure 4(b,c), where the relative error against
 $z^{(1)}_{num}$ decreases for both velocity components as
 $\varGamma \to 0$. For a given
 $\varGamma$,
 $z^{(1)}_{asy}$ associated with smaller initial perturbation
 $\epsilon$ has lower relative error dominated by the imaginary part.
Vortex-sheet velocity (in a–c) and acceleration (in d–f) at the critical time for small  $\varGamma$, obtained using
 $\epsilon =0.1, 0.01, 0.001$. Comparison is made between the asymptotic approximations found in (3.12), (3.16) and numerical integration of (4.1), (4.5) for velocity and acceleration, respectively. Relative error for both real and imaginary components of the asymptotic estimates is assessed against the numerical results.

4.3. Acceleration
The acceleration requires more care. An efficient numerical scheme to compute (4.2) was developed by first removing the singularity at  $a= \hat {a}$ using the identity
 \begin{equation} {\int\hskip -1,05em -\,}_0^{2{\rm \pi}}\cot\left(\frac{a-\hat{a}}{2}\right)\,{\rm d}\hat{a}=0. \end{equation}
Equation (4.2) can then be written as
 \begin{equation} \left.\frac{\partial^2 {\bar{z}}}{\partial \tau^2}\right|_{\tau=0}=\frac{{\rm i}}{8{\rm \pi}}\int_0^{2{\rm \pi}}\left\{\frac{\hat{\sigma}(z^{(1)} -\hat{z}^{(1)})}{\sin^2[(z-\hat{z})/2]}-\frac{2(\partial z^{(1)}/\partial a)}{\sigma(\partial z/\partial a)^2}\cot\left(\frac{a-\hat{a}}{2}\right)\right\}\,{\rm d}\hat{a}, \end{equation}
where the integrand is continuous at  $\hat {a}=a$ and takes the limit
 \begin{equation} -\left[4\frac{{\rm d}\sigma}{{\rm d}a}\frac{\partial z}{\partial a}\frac{\partial z^{(1)}}{\partial a}+2\sigma\left(\frac{\partial z}{\partial a}\frac{\partial^2 z^{(1)}}{\partial a^2}-2\frac{\partial z^{(1)}}{\partial a}\frac{\partial^2 z}{\partial a^2}\right)\right]{\left(\frac{\partial z}{\partial a}\right)^{{-}3}}. \end{equation}
Next, a uniform grid  $\{a_k=2k{\rm \pi} /N\mid k=0,1,\ldots,N-1\}$ is formed, over which
 $z$ and
 $z^{(1)}$ at the critical time can be calculated with high precision using (2.34) and (4.1), respectively, as discussed in §4.2. This leads to the discrete sets
 $\{z_k\}$ and
 $\{z^{(1)}_k\}$, from which the
 $a$-derivatives of
 $z$ and
 $z^{(1)}$ are obtained using a Fourier method. Finally, (4.5) is summed with spectral convergence using the trapezoidal rule.
The difficulty with integrating (4.5) for small  $\varGamma$ is that the desingularized kernel still exhibits sharp boundary layers near
 $\hat {a}=a$ and
 $\hat {a}=2{\rm \pi} -a$ when
 $a\ll 1$, which increase the truncation error. This is not surprising since
 $z^{(2)}$ is expected to be asymptotically divergent when
 $\varGamma \to 0$. The desingularized kernel, however, shows increasingly smooth behaviour for points
 $a_k$ further away from the origin. Therefore, the truncation error is mollified by choosing aggressive stretching
 $\beta =1$ in (4.3) and a large grid size
 $N=10^5$. The minimum
 $\varGamma$ obtained at
 $a=a_1$ is found at order
 $O(10^{-14})$, ensuring convergence of results obtained for the range of interest, e.g.
 $\sigma \gtrsim O(10^{-9})$. The comparison made between the analytic acceleration given by (3.16) and its numerical counterpart in figure 4(d–f) shows satisfactory agreement between the two for small
 $\varGamma$. Relative errors comparable to those seen for the asymptotic velocities are also observed here, where the accuracy of the analytic estimate suffers significantly when
 $\epsilon$ and
 $\varGamma$ are increased.
5. Further Taylor-series expansion in region II
We now extend the analysis of § 3.1 by considering a series solution of the form
 \begin{equation} z_{II}(\varGamma,\tau) = b\left( \varGamma + A\varGamma^{3/2} + D_{1,1}\varGamma^{1/2}\tau + \sum_{n=2}^\infty \sum_{m=1}^\infty D_{n,m}\tau^n\varGamma^{1-n+m/2}\right) .\end{equation}
Use of (5.1) in (3.4) gives a triple series resulting in, at order  $n$, a combinatorial explosion which is presently intractable. In order to make progress, simplifications are implemented. The first is truncation of the inner series in (5.1) at
 $m=1$ to give a series that can be rearranged and expressed as
 \begin{equation} z_{II}(\varGamma,\tau) = b\left( \varGamma + \varGamma^{3/2} \sum_{n=0}^\infty C_n\left(\frac{\tau}{\varGamma} \right)^n\right), \end{equation}
with  $C_0,C_1,C_2$ known and
 $C_n,n>2$ to be determined. The first four terms of (5.2) agree with (3.17), the first two of which are the region-II initial condition, while the second two were shown in § 4 to give good agreement with numerical calculations. We now proceed to extend the preliminary solution (3.17) using (5.2). This will later be shown to provide a good approximate solution of an appropriate linearized BR equation in region II.
When (5.2) is used in (3.4), at each order  $\tau ^n$, the Bell-polynomial expansion produces a series in
 $\varGamma$ in a sum over negative powers for
 $n\ge 2$:
 ${\varGamma ^{3/2-n},\, \varGamma ^{2-n},\varGamma ^{5/2-n},\ldots}$ At order
 $n$ we consider only the most singular term of order
 $\varGamma ^{3/2-n}$,
 $\varGamma \to 0$, which is expected to be dominant in the subsequent analysis. Further, an induction-based analysis of the Bell-polynomial expansion (3.4) indicates that, at the order of the
 $n$th
 $\tau$-derivative, the most singular term of order
 $\varGamma ^{3/2-n}$ is contained in the
 $k=2$ term displayed as the right-most term with denominator
 $(z(\gamma,0)-z({\hat {\varGamma }}))^2$ in the four
 $\tau$-derivatives given in (3.5)–(3.8). For general
 $n\ge 2$, this can be expressed as
 \begin{align} \left.\frac{\partial^n \bar{z}}{\partial \tau^n}\right|_{\tau=0}={-}\frac{1}{2{\rm \pi} {\rm i}}{\int\hskip -1,05em -\,}_0^\infty \left(\frac{ \frac{\partial^{n-1} z}{\partial \tau^{n-1}}|_{\tau=0}-\frac{\partial^{n-1}\hat{z}}{\partial \tau^{n-1}}|_{\tau=0} }{(z(\varGamma,0)- z(\hat{\varGamma},0))^2}+\frac{ \frac{\partial^{n-1}z}{\partial \tau^{n-1}}|_{\tau=0}+\frac{\partial^{n-1} \hat{z}}{\partial \tau^{n-1}}|_{\tau=0} }{(z(\varGamma,0) +z(\hat{\varGamma},0))^2}\right)\,{\rm d}\hat{\varGamma}, \end{align}
where, for clarity and until otherwise needed, the ‘II’ subscript has been suppressed. Equation (5.3) is the basis of further analysis.
5.1. Recurrence relations
From (5.2) we can write
 \begin{equation} \left.\frac{\partial^n \bar{z}}{\partial \tau^n}\right|_{\tau=0} = n! \bar{b}\bar{C}_n\varGamma^{3/2-n}.\end{equation}
In the following, we make the further approximation that, in the denominator of (5.3), we can write  $z(\varGamma,0)- z(\hat {\varGamma },0) \approx b(\varGamma -\hat {\varGamma })$. This can be justified by observing that the additional
 $\varGamma ^{3/2}$ term in the initial condition (2.35) will, for small
 $\varGamma$, produce a first correction consisting of an additional power
 $\varGamma ^{1/2}$, as was seen in the earlier calculation of the initial velocity and acceleration terms. At the time derivative of
 $o(n)$, this will not affect the most singular contribution proportional to
 $\varGamma ^{3/2-n}$, but will contribute to less singular powers of
 $\varGamma$.
Using (5.4) on the left-hand side of (5.3) and its complex conjugate with  $n\to n-1$ in the integrand on the right-hand side, leads to cancellation on both sides of factors
 $\varGamma ^{3/2-n}$ and, after some algebra, to the recurrence relation
 \begin{equation} \bar{C}_n ={-} \frac{1}{2{\rm \pi} {\rm i}|b|^2}\frac{I(n)}{n}\,C_{n-1},\quad I(n) = {\int\hskip -1,05em -\,}_0^\infty \left(\frac{1-x^{5/2-n} }{(1-x)^2} +\frac{1+x^{5/2-n} }{(1+x)^2} \right)\,{{\rm d}\,x}.\end{equation}
The integral exists as an CPV integral for  ${\tfrac {1}{2}} < n < {\tfrac {9}{2}}$. Presently, we consider only the finite part, taken as its analytic continuation for
 $n>{\tfrac {9}{2}}$. For real integer
 $n$ this is
 \begin{equation} I(n) =({-}1)^n\, {\rm \pi}\left(\frac{5}{2}-n \right). \end{equation}
Now make the change of variables
 \begin{equation} C_n = \frac{K_n}{|b|^{2n}},\quad K_0 = A,\quad K_1 = \frac{3{\rm i}}{4}\bar{A}, \end{equation}
so that (5.2) can be written as
 \begin{equation} z(\varGamma,\tau) = b\left( \varGamma + \varGamma^{3/2} \sum_{n=0}^\infty K_n\eta^{{-}n}\right) ,\quad \eta = \frac{|b|^2 \varGamma}{\tau}. \end{equation}
The similarity variable  $\eta$ will be used throughout the sequel. Using (5.5) and
 $n\to n+1$, the recurrence relation for
 $K_n$ is
 \begin{equation} \bar{K}_{n+2} = {\rm i}({-}1)^n\frac{(n-3/2)}{2(n+1)}\,K_{n+1} , \end{equation}
which, with iteration, can be written as
 \begin{equation} K_{n+2} ={-} \frac{\left(n-{\frac{1}{2}} \right)\left(n- {\frac{3}{2}} \right)}{4(n+1)(n+2)}K_n,\quad n = 2,3,\ldots\ldots, \end{equation}
where we note that the recursion coefficient is real.
The above suggests splitting (5.8) into two series as
 $$\begin{gather} z(\varGamma,\tau) = b( \varGamma + \varGamma^{3/2} (AS_1 + {\rm i}\,\bar{A}S_2 )), \end{gather}$$
 $$\begin{gather}S_1 = \sum_{n=0}^\infty \hat{K}_{2n}\eta^{{-}2n}, \quad S_2 = \sum_{n=0}^\infty \hat{K}_{2n+1}\eta^{-(2n+1)} , \end{gather}$$
with  $\hat {K}_0=1$,
 $\hat {K}_1=3/4$ and the
 $\hat {K}_n$ satisfy the same recurrence relation as do the
 $K_n$, namely (5.10). Solution of (5.10) gives for
 $n$ even and odd, respectively,
 \begin{equation} \hat{K}_n = \frac{3\,{\rm i}^n\,2^{-(n+2)}{\hat{\varGamma}}\left(- {\frac{3}{2}}+n\right)}{{\rm \pi}^{1/2}{\hat{\varGamma}}(1+n)},\quad \hat{K}_n = \frac{3\,{\rm i}^{n+1}2^{-(n+2)}{\hat{\varGamma}}\left(- {\frac{3}{2}}+n\right)}{{\rm \pi}^{1/2}{\hat{\varGamma}}(1+n)}, \end{equation}
where  ${\hat {\varGamma }}$ here denotes the complete gamma function, to be distinguished from the circulation variable
 $\varGamma$. Substitution of (5.13a,b) into (5.12a,b) shows that both series converge for
 $\eta >1/2$ or for
 $\varGamma > \tau /(2\,|b|^2)$. Hence,
 $\eta =1/2$ is now defined as the inner boundary of region II. For finite
 $\tau >0$ (5.11) cannot be extended to
 $\varGamma \to 0$.
5.2. Closed-form solution
The two series (5.12a,b) with  $\hat {K}_n$ given by (5.13a,b) can be summed analytically, and when multiplied by
 $\eta ^{3/2}$ as suggested by (5.11), can be expressed as
 $$\begin{gather} Q_1(\eta) \equiv \eta^{3/2}\,S_1 = \frac{1}{2\,\sqrt{2}}\,( 4 \eta^2+1 )^{3/4}\,\cos\left[ {\frac{3}{2}}\operatorname{ArcCot}\left(2\,\eta \right) \right] , \end{gather}$$
 $$\begin{gather}Q_2(\eta) \equiv \eta^{3/2}\,S_2 =\frac{1}{2\,\sqrt{2}}\,( 4 \eta^2 +1 )^{3/4}\,\sin\left[ {\frac{3}{2}}\operatorname{ArcCot}\left(2\,\eta \right) \right] . \end{gather}$$
The functions  $Q_1(\eta ),\,Q_2(\eta )$ have fractional-power branch-point singularities in the complex
 $\eta$-plane at
 $\eta = \pm \textrm {i}/2$ and at
 $\eta =0$, confirming the radius of convergence of the series (5.12a,b). When used in (5.11), this gives
 \begin{equation} z_{II}(\varGamma,\tau) = b\varGamma +b \frac{\tau^{3/2}}{|b|^3} \left[AQ_1\left(\frac{|b|^2 \varGamma}{ \tau }\right) + {\rm i}\bar{A}\,Q_2\,\left(\frac{|b|^2\,\varGamma}{ \tau } \right) \right] . \end{equation}
In the complex  $\varGamma$ plane, with
 $\tau$ considered a real, positive parameter, the right-hand side of (5.16) has fractional-power branch points at
 $\varGamma = \pm \textrm {i}\tau /(2\,|b|^2)$ and at
 $\varGamma \to \infty$. When
 $\tau$ increases from
 $\tau =0^+$, the branch point at
 $\varGamma =0$ at
 $\tau =0$ splits into two points, each moving away from
 $\varGamma =0$ along the positive and negative imaginary axes, respectively, and
 $z(\varGamma,\tau )$ given by (5.16) is analytic at
 $\varGamma =0$.
5.3. Analytic continuation
We take (5.16) as the region-II solution for  $\eta \ge {\tfrac {1}{2}}$, which corresponds to
 $\varGamma \ge \tau /(2\,|b|^2)$. This equation can nonetheless can be evaluated inside the circle
 $|\eta | < {\tfrac {1}{2}}$ in the complex
 $\eta$-plane or
 $|\varGamma |< \tau /(2|b|^2)$, and therefore gives the analytic continuation of (5.12a,b)–(5.13a,b) in this region. This function is finite valued and analytic on the real line in
 $0 \le \varGamma <\infty$. Its properties and relation to (2.39) when
 $\varGamma \to 0$ at fixed
 $\tau$ are discussed Appendix B where it is shown that this solution gives sheet rupture and separation into two branches at
 $\varGamma = 0^+$ for
 $\tau >0$.
In  $(\eta,\tau )$ variables we write (5.16) as
 $$\begin{gather} z_{II}(\eta,\tau) = \frac{\tau}{|b|}\varOmega_{II}(\eta,\tau)\quad \varOmega_{II}(\eta,\tau) = {\rm e}^{{\rm i}\theta}\left(w_0(\eta) +\frac{ \tau^{{1}/{2}}}{|b|}\,w_1(\eta) \right) , \end{gather}$$
 $$\begin{gather}w_0(\eta) = \eta,\quad w_1(\eta) = A\,Q_1(\eta) + {\rm i}\,\bar{A}Q_2(\eta), \end{gather}$$
where, for convenience, the  $\exp ({\textrm {i}\,\theta })$ term is included in the definition of
 $\varOmega _{II}$ to denote rotation to the sheet tangent at
 $z=0$, allowing for clarity in the discussion of the
 $w_0(\eta )$ and
 $w_1(\eta )$ functions. Expressing the first few terms of the series ((5.12a,b)–(5.13a,b)) gives in
 $(\varGamma -\tau )$ variables
 $$\begin{align}
z_{II}(\varGamma,t)&=b\varGamma + b
\varGamma^{3/2}\Bigg({A}+ \frac{3\,{\rm i}\bar{A}}{4}
\left(\frac{\tau}{|b|^2\varGamma} \right)
-\frac{3A}{32}\left(\frac{\tau}{|b|^2\varGamma} \right)^2 +
\frac{{\rm i}
\bar{A}}{128}\left(\frac{\tau}{|b|^2\varGamma} \right)^3
\nonumber\\ &\quad+ \frac{3A
}{2048}\left(\frac{\tau}{|b|^2\varGamma} \right)^4 -
\frac{3\,{\rm i}
\bar{A}}{8192}\left(\frac{\tau}{|b|^2\,\varGamma} \right)^5
- \frac{7A}{65\,536}\left(\frac{\tau}{|b|^2\,\varGamma}
\right)^6 \quad \cdots\cdots\Bigg) ,
\end{align}$$
the first four terms of which agree with (3.17). In terms of  $(\eta -\tau )$ variables, the first few terms of
 $w_1(\eta )$ are
 \begin{align} w_1(\eta) = \eta^{{3}/{2}}\left( A+ \frac{3\,{\rm i}\bar{A}}{4} \eta^{{-}1} -\frac{3A}{32} \eta^{{-}2} + \frac{{\rm i} \bar{A}}{128}\eta^{{-}3} + \frac{3A }{2048}\eta^{{-}4} - \frac{3\,{\rm i} \bar{A}}{8192}\,\eta^{{-}5} + \ldots \right). \end{align}
6. Inner solution: region III
6.1. Separated algebraic-spiral structure
Here, we discuss an inner region III defined presently by  $0 \le \varGamma < O( \tau /(2\,|b|^2))$, which exists only for
 $\tau >0$. The analytic behaviour of (5.16) when
 $\eta \to 0$ at fixed
 $\tau$, equivalent to
 $\varGamma \to 0$, is discussed in Appendix B, where it is shown that, provided
 $A_r \ne A_i$ (recall
 $A= A_r + \textrm {i}\,A_i$), this shows sheet end separation at
 $\tau = 0^+$ into two distinct branches whose endpoints move away from the origin as
 $\tau ^{3/2}$. This is non-physical because a vortex sheet with a free-end point is expected to roll up. Further, in Appendix C, it is shown that (5.18a,b) is an accurate approximate solution of a linearized BR equation for
 $\eta >1/2$ but generally fails when
 $\eta < 1/2$. An exceptional case is an initial condition (2.35) with
 $A_r = A_i$, where (5.16) then joins the origin smoothly. An alternative structure is required for the general case
 $A_r \ne A_i$, which is now discussed.
Equation (5.17a,b) suggests a general ansatz for an inner solution of the form
 $$\begin{gather} z_{III}(\eta,t) = \frac{\tau}{|b|}\,\varOmega_{III}(\eta,\tau), \end{gather}$$
 $$\begin{gather}\varOmega_{III}(\eta,\tau)= {\rm e}^{{\rm i}\,\theta} \left(\omega_0(\eta)+ \frac{\tau^{{1}/{2}}}{|b|}\omega_1(\eta)+ \frac{\tau}{|b|^2} \,\omega_2(\eta) + \cdots\right). \end{gather}$$
Truncating (6.2) at  $\tau ^{1/2}$ inside the outer brackets and substituting into (2.4) gives
 $$\begin{gather} \bar{\omega}_0 - \eta
\frac{{\rm d} \bar{\omega}_0}{{\rm d} \eta} +\frac{
\tau^{{1}/{2}}}{|b|}\left( \frac{3}{2}\,\bar{\omega}_1-\eta
\frac{{\rm d}\bar{\omega}_1}{{\rm d} \eta}
\right)\nonumber\\ =\frac{1}{2{\rm \pi} {\rm
i}}{\int\hskip -1,05em -\,}_0^{\infty}\left(\frac{1}{\omega_0-\omega_0'
+\frac{ \tau^{{1}/{2}}}{|b|}(\omega_1-\omega_1'
) } +\frac{1}{\omega_0+\omega_0' +\frac{
\tau^{{1}/{2}}}{|b|}( \omega_1+\omega_1'
)}\right)\,{\rm d}\eta' ,
\end{gather}$$
where  $\omega _0 = \omega _0(\eta ),\omega _1 =\omega _1(\eta ),\omega _0' = \omega _0(\eta '),\omega _1' = \omega _1(\eta ')$. Equation (6.3) is a single equation for two functions
 $\omega _0(\eta ),\omega _1(\eta )$. For
 $\tau \ll 1$ (6.2) is considered as the leading order in an expansion of an inner solution in the small parameter
 $\tau ^{{1}/{2}}/|b|$. Further terms
 $\tau /|b|^2\,\omega _2(\eta ), \tau ^{{3}/{2}}/|b|^3 \omega _3(\eta )\,\ldots$ can be added but are not considered presently.
Expanding the integrand of the right-hand side of (6.3) and equating powers in  $\tau ^{{1}/{2}}/|b|$ gives, to order one and
 $\tau ^{{1}/{2}}/|b|$, respectively,
 $$\begin{gather} \bar{\omega}_0 - \eta \frac{{\rm d} \bar{\omega}_0}{{\rm d} \eta} =\frac{1}{2{\rm \pi} {\rm i}}{\int\hskip -1,05em -\,}_0^{\infty}\left(\frac{1}{\omega_0-\omega_0' } +\frac{1}{\omega_0+\omega_0' }\right)\,{\rm d}\eta' , \end{gather}$$
 $$\begin{gather}\frac{3}{2} \bar{\omega}_1-\eta \frac{{\rm d}\bar{\omega}_1}{{\rm d} \eta}={-}\frac{1}{2{\rm \pi} {\rm i}}{\int\hskip -1,05em -\,}_0^{\infty}\left(\frac{\omega_1-\omega_1'}{(\omega_0-\omega_0')^2 } + \frac{\omega_1+\omega_1'}{(\omega_0+\omega_0')^2 } \right)\,{\rm d}\eta' . \end{gather}$$
Equations (6.4) and (6.5) are nonlinear and linear singular integral-differential equations for  $\omega _0(\eta )$,
 $\omega _1(\eta )$, respectively. Equation (6.4) is a special case with
 $p=1$ of a more general similarity integro-differential equation with dimensionless parameter
 $p$ such that
 $\omega _0(\eta )\sim \eta ^{1/p}$,
 $\eta \to \infty$ (Pullin & Phillips Reference Pullin and Phillips1981; Pullin Reference Pullin1989). Boundary conditions with
 $p=1$ for
 $\eta \to \infty$ are given by matching to the intermediate solution in region II giving
 $\omega _0\sim \eta$ (first of (5.18a,b)),
 $\omega _1 \sim A \eta ^{{3}/{2}}$ (5.20). Equation (6.4) has the exact solution
 $\omega _0= \eta$ matching (5.18a,b). This corresponds to a uniform, flat vortex sheet. The status of (5.18a,b) as an approximate solution to (6.5) in region II but with
 $(\omega _0,\omega _1)$ replaced by
 $(w_0, w_1)$, respectively, is discussed in Appendix C. It is concluded that, with
 $\omega _0= \eta$, smooth solutions of (6.5) that match the region-II solution and that are bounded when
 $\eta \to 0$, do not exist. Hence,
 $\omega _0=\eta$ cannot provide a basis for an admissible region-III solution.
6.2. Numerical solution: zeroth order
Pullin (Reference Pullin1989) reported numerical evidence that an alternative solution to (6.4) exists, satisfying  $\omega _0\sim \eta$, and taking the form of two distinct and separated vortex cores, each with centres of counter-clockwise roll-up removed from the origin. We denote these roll-up points in the
 $\eta$ plane as
 $\omega _{0,c} = \omega _0(\eta =0)$ and
 $-\omega _0(\eta =0)$ for the right-hand (
 $\mathrm {Re}(\omega _{0,c})>0$) and left-hand (
 $\mathrm {Re}(\omega _{0,c})<0$) sheet sections, respectively, consistent with the required symmetry of the overall solution. Evidence was also provided (Pullin & Phillips Reference Pullin and Phillips1981; Pullin Reference Pullin1989) that solutions with
 $\omega _{0,c}=0$, and satisfying the same far-field boundary condition, which corresponds to spiral roll up about the origin, do not exist.
Non-existence was inferred in the sense that, with fixed  $\omega _{0,c}=0$, while double-spiral solutions were found for
 $p<1$, in the limit
 $p\to 1^-$ from below their spatial scale in the
 $\omega$ plane shrunk to zero. In contrast, numerical solutions on a different branch showed smooth variation as
 $p$ passed through unity from above (
 $p \to 1^+$), giving a particular solution with
 $p=1$ consisting of separated algebraic spirals of finite scale and with
 $\omega _{0,c}\ne 0$. This vortex structure is consistent with end-sheet separation of the
 $\eta \to 0$ continuation of the region-II solution, while exhibiting free-end roll up expected on physical grounds. The above does not rule out that a double-spiral solution to (6.4) may exist either in isolation or on an undiscovered solution branch, but, despite searching, none has been found. We will interpret the separated-sheet solution as the only available and admissible zeroth-order, region-III solution that allows matching to the region-II solution.
6.2.1. Numerical method
The calculations of Pullin (Reference Pullin1989) have been reproduced to give a solution for  $\omega _0$. The original code and specific results are no longer available, and so independent coding was implemented using the same method. This is now summarized briefly. The real line
 $\eta \ge 0$,
 $(0,\infty )$ is divided into three contiguous sections
 $(0,\eta _N),(\eta _N,\eta _0)$ and
 $(\eta _0,\infty )$. The vortex sheet in these sub-domains is represented by three parts: (i) an inner section in
 $0\le \eta \le \eta _N$ modelled by a point vortex of strength
 $\eta _N$ located at
 $\omega _{0,c}=\omega _{0,N+1}$, (ii) an intermediate, continuous section in
 $\eta _N\le \eta \le \eta _0$ represented by
 $N$ straight segments,
 $(\omega _{0,j}-\omega _{0,j-1}), j = 1,\ldots,N$ and (iii) an outer section
 $\eta _0\le \eta \le \infty$ modelled by
 $\omega _0(\eta ) = \eta$. In part (i),
 $\omega _{0,N}$ is joined to
 $\omega _{0,N+1}$ by a cut in the
 $\omega$-plane in order to define a single-valued complex velocity potential. The unknowns are the
 $2N+2$ quantities given by the real and imaginary parts of
 $\omega _{0,j}$,
 $j=1\ldots N+1$.
In (ii), a finite-difference form of (6.4) is satisfied at the midpoint of each segment using a two-point rule for derivatives on the left-hand side, a trapezoidal rule for the Cauchy principal-value integral contributed from (ii), and a point-vortex contribution from (i). The contribution from (iii) can be evaluated analytically. This gives  $2 N$ nonlinear equations. The trapezoidal rule incurs error owing to neglected logarithmic corrections arising from proximity of a point on the sheet to nearby segments on adjacent spiral turns. This is somewhat relieved by cancellation since, as will be seen, most points lie inside a tightly wound spiral with many individual turns on either side. In (i), pointwise representation of (6.4) is replaced by an integrated approximation over
 $0 \le \eta \le \eta _N$, giving two additional equations. The
 $2(N+1)$ equations are solved by a Newton–Raphson method with analytical calculation of the Jacobian.
Numerical solutions produce a tightly wound, algebraic spiral with many turns. Related BR solutions driven by singularity formation have been reported by Pullin & Phillips (Reference Pullin and Phillips1981), Pullin (Reference Pullin1989) and Pullin & Sader (Reference Pullin and Sader2021), using a similar numerical method. Convergence with respect to  $N$ and the number of spiral turns captured was documented by Pullin & Sader (Reference Pullin and Sader2021). Present solutions use
 $N=1016$ to
 $N= 2816$ with
 $\eta _0 = 12.5$ chosen to be remote from where the solution shows significant deviation from
 $\omega _0 = \eta$. Testing with different values of
 $\eta _0$ showed negligible difference provided
 $\eta _0 \ge 2$. With
 $\eta _0=12.5$ numerical solutions near this value agree with the asymptotic form
 $\omega _0=\eta$ to order
 $10^{-6}$ for
 $\mathrm {Re}[\omega _0]$ and order
 $10^{-4}$ for
 $\mathrm {Im}[\omega _0]$. Some parameters for numerical solutions are listed in table 1. The portrait of the parametric solution in the
 $\omega _0$ plane is shown in figure 5 for
 $N = 2816$. Solutions with
 $N = 1916-2216$ are indistinguishable to plotting accuracy. The shape closely resembles the same flow as in Pullin (Reference Pullin1989), who used
 $N= 170$ with a few turns. In the present scaling his solutions show
 $\omega _{0,N+1} \approx (0.22+ 0.075\,\textrm {i})$ compared with the more accurate values listed in table 1. The non-zero value
 $\omega _{0,N+1}$ for the right-hand sheet branch can be interpreted as a balance between the Biot–Savart induction of the far-field circulation distribution and that of the compact, left-hand vortex core.
Calculated numerical values of parameters in numerical solutions of (6.4). Here,  $N$, number of points on the sheet;
 $\eta = \eta _N$ on the last, inner point on the sheet;
 $\omega _{0,N+1}$, position of the roll-up centre of the right-hand vortex. All solutions obtained with
 $\eta _0=12.5$.

Portrait of geometrical shape of  $\omega _0(\eta )$. Here,
 $N =2816$.

6.2.2. Inner structure of zeroth-order solution
An image of the inner portion of the sheet geometry of the right-hand core is shown by the solid line in figure 6, which indicates a tightly wound, almost circular spiral with structure strongly dominated by the Biot–Savart induction at a point  $\omega _0(\eta )$, provided by the cumulative sheet circulation (
 $\eta$) that lies inside a circle that passes through
 $\omega _0(\eta )$ and is centred on
 $\omega _{0,c}=\omega _{0,N+1}$. This model approximation goes back to Kaden (Reference Kaden1931). It does not include the induction effects of the remainder of the spatial circulation distribution that lies outside this circle and that includes the left-hand rolled-up vortex. The inner portion can then be analysed by replacing (6.4) by the model equation
 \begin{equation} \tilde{\omega}_0 - \eta \frac{{\rm d} \bar{\tilde{\omega}}_0}{{\rm d} \eta} =\frac{1}{2{\rm \pi} {\rm i}}\frac{\eta}{\widetilde{\omega_0}}, \end{equation}
where  $\tilde {\omega }_0 = \omega _0 - \omega _{0,N+1}$, with exact solution for
 $\tilde {\omega }_0(\eta )$ and corresponding zeroth-order
 $\tilde {z}_{III}(\varGamma,\tau )$ given by
 $$\begin{gather} \tilde{\omega}_0(\eta) = \alpha \eta \exp\left({{\rm i}\left(\frac{1}{2{\rm \pi}\alpha^2\eta}+\phi_0\right)}\right), \end{gather}$$
 $$\begin{gather}\tilde{z}_{III}(\varGamma,\tau) = \alpha b\varGamma \exp\left({{\rm i}\left(\frac{\tau}{2{\rm \pi}\alpha^2|b|^2\varGamma}+\phi_0\right)}\right) , \end{gather}$$
where  $\alpha,\,\phi _0$ are arbitrary, real parameters. Sohn (Reference Sohn2016) shows that (6.7) satisfies (6.4) to a good approximation. Here, we patch (6.7) to an arbitrary point on the inner part of our numerical solution for
 $\omega _0$. We use
 $\eta = 0.02389, \omega _0= 0.2197-0.07855\textrm {i}$, which is well inside the rolled-up sheet. Other choices show numerically similar results. This gives two equations for
 $\alpha,\phi _0$ with numerical solution
 $\alpha =0.2397\,,\phi _0 = 0.7886$. In figure 6, the patch point is marked by a black dot. The numerical solution with
 $N=2816$ contains
 $15$ sheet turns inside the black dot. Equation (6.7) is plotted as a dashed line in the range
 $0.008\le \eta \le 0.023886$. The agreement with the numerical solution is satisfactory with systematic differences attributable to a slight ellipticity in the numerical solution produced by the combined straining effect of the vorticity structure that lies outside the inner portion, and that includes the other vortex core.
Inner portion of sheet shape  $\omega _0(\eta )$ with
 $N = 2816$. Solid line: numerical solution. Dashed line: equation (6.7) patched to the numerical solution at the point shown by the black dot. Dashed line solution plotted in
 $0.008\le \eta \le 0.023886$.

The inner structure of the vortex core in the  $\omega$ plane can be estimated using (6.7) where the radius of the spiral decreases as
 $|\omega _0|\sim \alpha \eta$ while its angle relative to an arbitrary datum increases as
 $\theta _s \sim 1/(2\,{\rm \pi} \alpha ^2 \eta )$. Hence, the ratio of local spiral turn spacing to local radius decreases as
 $\delta |\widetilde {\omega _0}|/|\widetilde {\omega _0}| \sim \theta _s^{-1}$, which decreases rapidly as
 $\theta _s$ increases. This variation, a result of the essential-singularity (in a complex
 $\eta$ plane) character of the
 $\eta \to 0$ limit solution, suggests potential difficulties in time-domain numerical solutions of the BR initial-value problem from
 $\tau = 0^- \to \tau =0^+$. In the
 $z$-plane, (6.8) shows that the smoothed azimuthal velocity distribution is
 $u_\theta =1/(2\,{\rm \pi} \alpha |b|)$ (with jumps across each sheet turn) and is independent of radius and
 $\tau$ while the smoothed vorticity distribution is singular as
 $u_\theta /r$, where
 $r$ is the radius to the roll-up centre. If one considers a finite portion of the right side (
 $x>0$), almost flat vortex sheet bounded at
 $\tau =0$ by the origin (singular point) and an arclength
 $x=S$ along the sheet, then this will contain circulation
 $\varGamma (S) \approx S/|b|$. This portion will roll up to constant radius
 $r(S) =\alpha \,S$. The quantity
 $\beta = 1/(2\alpha )$ is known as the Betz constant (see Moore & Saffman Reference Moore and Saffman1973) with value
 $\beta \approx 2.08$.
6.3. Numerical solution: linearized first-order equation
The numerical solution for  $\omega _0(\eta )$ can now be substituted into (6.5) to give an equation for
 $\omega _1(\eta )$. This was solved presently with essentially the same numerical method described above for
 $\omega _0$, except that Newton iteration is not required owing to linearity. At
 $\eta =\eta _0$, the boundary condition is
 $\omega _1(\eta ) = w_1(\eta )$ given by the second of (5.18a,b), allowing effective matching of the region-III solution with that in region II. The
 $\eta \to 0$ limit for each solution is represented by the isolated point
 $\omega _{1,N+1}$ which is determined as part of the solution. Because the constant
 $A$ is a function of
 $\lambda _1\epsilon$, then solutions to the linearized equation will be a one-parameter family. An asymptotic limit solution will be discussed subsequently. Testing of the numerical method for the solution of (6.5) is described in Appendix C where it is shown that only first-order convergence is achieved. With
 $N$ large, this is considered satisfactory.
Solution portraits in the  $\omega _1$ plane are shown in figure 7(a–c). These panels show self-intersection, which would be unacceptable for the full-sheet shape but not for the linearized solution in the form shown. Figure 8 gives the variation of both
 $\mathrm {Re}[\omega _1(\eta )]$ and
 $\mathrm {Im}[\omega _1(\eta )]$ for several values of
 $\epsilon$ in the range
 $10^{-2}-10^{-10}$, with
 $\lambda _1=1$. Dashed lines are the region-II solutions given by the second of (5.18a,b). Numerical solutions show oscillation about
 $\omega _{1,N+1}$. In fact the plots in figure 8 suggest that, as
 $\epsilon$ is reduced,
 $\omega _{1,N+1}$ appears to approach close to the limit of the region-II solution for
 $w_1(\eta \to 0)$. In turn this suggests the existence of an
 $\epsilon \to 0$, asymptotic solution.
Shape portrait of numerical solutions to (6.5) in the  $\omega _1$ plane; (a)
 $\epsilon =10^{-2}$, (b)
 $\epsilon =10^{-3}$, (c)
 $\epsilon =10^{-6}$. (d) Limit solution in
 $\hat {\omega }_1$ plane.

(a) Value of  $\mathrm {Re}[\omega _1(\eta )]$ obtained with decreasing
 $\epsilon =10^{-3},10^{-6},10^{-10}$; (b)
 $\mathrm {Im}[\omega _1(\eta )]$ with
 $\epsilon =10^{-3},10^{-6},10^{-10}$. Solid lines: numerical solutions. Dashed lines: region-II linear solution, second of (5.18a,b).

This can be explored by taking the limit  $\epsilon \to 0$ of
 $(b(\epsilon ),A(\epsilon ))$ defined by (2.36a,b), giving
 \begin{equation} b = 1 + O({\hat{\varepsilon}}),\quad A = \frac{2}{3}(1- {\rm i}){\hat{\varepsilon}} + O({\hat{\varepsilon}})^2,\quad {\hat{\varepsilon}} = \frac{1}{W_0\left( \frac{2}{ {{\rm e}}\lambda_1\epsilon} \right)}. \end{equation}
The  $\epsilon \to 0$ asymptotic form of (5.18a,b) then becomes
 \begin{equation} w_1(\eta) = \frac{2}{3}{\hat{\varepsilon}}\hat{w}_1(\eta), \quad \hat{w}_1(\eta) = (1-{\rm i})(Q_1(\eta)-Q_2(\eta)). \end{equation}
This gives the  ${\hat {\varepsilon }}\to 0$ limit solution
 $\omega _1(\eta ) = 2{\hat {\varepsilon }}\hat {\omega }_1(\eta )/3$ which scales
 $\epsilon$ out of the linear problem. Equation (6.5), (with
 $\omega _0(\eta )$ given by the numerical zeroth-order solution) was solved numerically for
 $\hat {\omega }_1(\eta )$ with boundary condition given by
 $\hat {\omega }_1(\eta _0) = \hat {w}_1(\eta =\eta _0)$. The portrait of the solution in the
 $\hat {\omega }_1$ plane, obtained with
 $N= 2816$,
 $\eta _0= 12.5$, is shown in figure 7(d). The calculated value of the end or centre point is
 $\hat {\omega }_{(1,N+1)} = -0.5607+ 0.5278\textrm {i}$ compared with
 $\hat {w}_1(\eta \to 0) = -0.5+ 0.5\textrm {i}$, giving limit ratios
 $\mathrm {Re}[\hat {\omega }_{(1,N+1)}]/\mathrm {Re}[ \hat {w}_1(0)] = 1.121$ and
 $\mathrm {Im}[\hat {\omega }_{(1,N+1)}]/\mathrm {Im}[ \hat {w}_1(0)] = 1.056$. Figure 9 shows the ratios
 $\mathrm {Re}[\omega _{(1,N+1)}]/\mathrm {Re}[ w_1(0,\epsilon )]$ and
 $\mathrm {Im}[\omega _{(1,N+1)}]/\mathrm {Im}[ w_1(0,\epsilon )]$ obtained from numerical solutions for finite
 $\epsilon$. The latter shows rapid convergence towards the asymptotic limit, while the convergence of the ratio of the real components is much slower.
Open squares: ratio  $\mathrm {Re}[\omega _{(1,N+1)}]/\mathrm {Re}[ w_1(0,\epsilon )]$ vs
 $\epsilon$. Dashed line: limit ratio
 $R= 1.121$. Filled squares: ratio
 $\mathrm {Im}[\omega _{(1,N+1)}]/\mathrm {Im}[ w_1(0,\epsilon )]$ vs
 $\epsilon$. Dash-dotted line: limit ratio
 $R= 1.055$. All solutions with
 $N=2816$.

6.4. Composite solutions
We illustrate the composite solutions for  $\tau >0$ with
 $\epsilon = 10^{-3},\lambda _1=1$. These are calculated using (6.1) with (6.2) truncated at order
 $\tau ^{1/2}$. It is noted that the basic solutions
 $\omega _0,\omega _1$ described earlier were obtained, for convenience, in a reference frame where the zeroth order is
 $w_0=\eta$. In order to properly match the region-II solution given in (5.18a,b), (6.2) shows that these must be rotated anticlockwise by
 $\theta (\epsilon )= \arg (b(\epsilon ))$
Figure 10 shows two images of the sheet evolution at in the  $\varOmega$ plane at
 $\tau = 0.001, 0.01$. The dashed line shows the zeroth-order sheet shape represented by
 $\omega _0$. The order
 $\tau ^{1/2}$ correction by the outer flow appears to shift the sheet profile, relative to its zeroth-order position, towards the origin. Since this will be active for both sheet branches, the overall effect is to convect the two sheets towards each other. Successively expanded views of the double-sheet structure are shown in figures 11 and 12 at
 $\tau = 0.01$, where the intermediate sheet profile
 $\varOmega _{II}(\eta )$, defined in (5.18a,b), is also shown as dashed lines. Figure 11 displays the scale of the separated spirals and also the matching of the inner region-III solution onto the region-II solution. Figure 12 illustrates the spatial scale of the rolled-up spiral in comparison with the large radius of curvature of the region-II solution. Time-domain images can be obtained by multiplying the
 $\varOmega$ solutions by
 $\tau /|b|$. These are shown in figure 13 for
 $\tau = 0.0005 ,0.001,0.0025 ,0.005,0.0075,0.01,0.0125$. The effect of the region-II correction is discernable but is small.
Inner composite sheet shape in  $\varOmega$-plane at (a)
 $\tau = 0.001$ and (b)
 $\tau = 0.01$ (see (6.2)). Here,
 ${\epsilon =10^{-3}}$. Solid line: sheet shape profile at given
 $\tau$. Dashed line: zeroth-order solution
 $\omega _0$ rotated by angle
 $\theta = \arg (b(\epsilon ))$.

Two branches of sheet geometry for  $\epsilon =10^{-3},\tau = 0.01$. Solid: inner sheet shape
 $\varOmega _{III}$. Dashed:
 $\varOmega _{II}$ continued to
 $\eta \to 0$. Note separated sheet end at
 $\eta =0$.

Two branches of sheet geometry for  $\epsilon =10^{-3},\tau = 0.01$. Solid: inner sheet shape
 $\varOmega _{III}$. Dashed:
 $\varOmega _{II}$ continued to
 $\eta \to 0$.

Time-domain evolution. Here,  $\epsilon = 10^{-3}$. Centre to outer;
 $\tau = 0.0005,0.001,0.0025,0.005,0.0075,0.01,0.0125$.

7. Conclusion
We have considered the evolution of a periodically disturbed vortex sheet during the nonlinear stage of spatially periodic, KH instability for small times  $\tau = t-t_c$ subsequent to the formation of a curvature singularity as analysed by Moore (Reference Moore1979), for an initial sheet perturbation defined by the small parameter
 $\epsilon \ll 1$. The time-continued solution is itself singular, comprising three regions in the space of the variables
 $\eta \sim \varGamma /\tau$ and
 $\tau$. The outer region I denotes the full extent of a single spatial period of the vortex sheet whose shape and strength at
 $\tau =0$ are defined by an extension of Moore's asymptotic solution for a general initial condition, giving a closed expression for the sheet evolution up to
 $t=t_c$ in terms of the polylogarithm function. Its analytic continuation beyond the radius of convergence of Moore's Fourier series solution corresponds to
 $\tau >0$. This shows sheet rupture with end separation proportional to
 $\tau ^{3/2}$.
An intermediate domain (region II) is identified as a vortex-sheet evolution with initial condition at  $\tau =0$ given by the first two terms of the expansion of the region-I solution near the singular point
 $z=0$ in the Lagrangian circulation variable
 $\varGamma$. This contains the essential elements of the singularity structure as a
 $\varGamma ^{3/2}$ term added to the otherwise locally flat sheet, including known quantitative dependence of coefficients on the small-amplitude parameter
 $\epsilon$ contained in the region-I initial condition. This is done for a general initial sheet-shape perturbation. For small
 $\tau >0$, this initial condition is evolved to
 $\tau >0^+$ using a Taylor-series expansion based on the dominant term arising from time-wise differentiation of the governing BR equation. The first two terms corresponding to the velocity and acceleration show good agreement with Biot–Savart numerical calculations using the full region-I solution. Both terms contain singular features.
The Taylor series has a finite inner radius of convergence in the complex  $\eta$ plane, but can be summed to provide a closed-form expression which can be analytically continued to
 $\eta \to 0$, equivalent to continuation to zero circulation
 $\varGamma$ at fixed
 $\tau >0$. This also shows sheet tearing or jumping at
 $\tau =0^+$, in qualitative agreement with the behaviour of the Moore (Reference Moore1979) solution, analytically continued to
 $\tau >0$. The closed-form expression is shown in Appendix C to be an accurate approximate solution of the linearized BR equation in region II, but generally fails for
 $\eta \to 0$. With one exceptional case, a solution of the linearized BR equation that both matches the region-II solution, and also is bounded near the point of original singularity formation, could not be found. This exceptional case corresponds to
 $\arg (A)= {\rm \pi}/4,\, 5{\rm \pi} /4$ where
 $A(\epsilon )$ is the strength of the singular part of the sheet-shape function at the critical time. This case is not encountered within the class of initial conditions with
 $\mathrm {Re}[A]>0$.
The tearing scenarios found from both the analytically continued region-I and region-II solutions show flat sheet ends, without vortex-sheet roll up. While considered non-physical in itself, this points to the existence of a distinct, inner region III with a local solution structure that incorporates an analogue tearing event. An inner solution in a region III is explored with analytical form suggested by the structure of the region-II solution. In the  $z$-plane, but expressed in terms of
 $(\eta,\tau )$ variables, this is proportional to
 $\tau$ times the first two terms of a perturbation series in
 $\tau ^{1/2}$ with coefficients defined by functions determined respectively and recursively by solutions to a nonlinear zeroth-order (
 $O(\tau ^{0})$) and a first-order (
 $O(\tau ^{1/2})$) linearized BR equation, both in similarity form with independent variable
 $\eta$. The region-III solution exists only for
 $\tau >0$.
Numerical solutions of both region-III similarity equations are obtained that effectively match the corresponding region-II solutions at  $\eta \to \infty$. The zeroth-order solution is independent of
 $\epsilon$, showing an antisymmetric pair of separated, algebraic-spiral vortex sheets of well-known form, each with its own roll-up centre. Tearing or rupture at
 $\tau =0^+$ is interpreted as the response of the vortex sheet, which is continuous at the origin at
 $\tau =0^-$, to the onset of singularity formation which prevents its smooth and contiguous continuation for
 $\tau >0$. It is argued that an inner, zeroth-order solution based on finite-sized self-similar, double spiral roll-up about a common centre at the origin does not exist, although no proof is given. At first order
 $\tau ^{1/2}$, numerical solutions of the linearized BR equation exhibit oscillatory behaviour forced by the spiral form of the zeroth-order solution. These show dependence on
 $\epsilon$. An asymptotic form is obtained with explicit analytic dependence on
 $\epsilon$.
In summary, at  $\tau =0^-$ the vortex sheet is continuous but with singular curvature (Moore Reference Moore1979), angular velocity, acceleration and other higher-order derivatives at the local centre of antisymmetry. At each point of infinite curvature at
 $t=t_c$ (
 $\tau =0$), this singular behaviour generates local sheet rupture at
 $\tau =0^+$ into two distinct branches at the central singular point with separation distance of the branch endpoints, or roll-up centres, scaling as
 $\tau$ together with a non-local,
 $\tau ^{3/2}$ correction. In the complex
 $\varGamma$ plane this can be interpreted as the spontaneous appearance of a pair of isolated, essential singularities. In the extended complex
 $z$-plane, with a periodic initial perturbation, one singular point exists in each spatial period. The vortex sheet, continuous and of infinite streamwise extent for
 $t\le t_c$, fractures at
 $\tau =0^+$ into an infinite array of identical vortex sheets, each with two algebraic-spiral, roll-up endpoints generated at neighbouring singular points. While no attempt has been made presently to determine the character of the complex velocity for
 $t>t_c$, it is plausible, at least for sufficiently small
 $\tau$, that this is analytic on a Riemann surface defined on a strip of width
 $2{\rm \pi}$ streamwise and of infinite extent in the
 $\pm \mathrm {Im}[z]$ direction. The vortex sheet connecting the two roll-up centres would define the locus of a branch cut. Without further analysis it is not clear if the spiral centres themselves are standard branch points or conform to a different singular form.
Finally, we remark that the present solution provides a classical vortex-sheet evolution from a singular initial condition at  $t=t_c$. Its uniqueness has not been demonstrated. A further interesting question is whether this solution is, in some properly defined sense, the unique limit solution of either the Euler or Navier–Stokes equations at some fixed
 $t>t_c$ when an appropriate regularizing parameter tends to zero. This remains open.
Acknowledgement
The authors thank G.R. Baker for helpful discussions.
Declaration of interests
The authors report no conflict of interest.
Appendix A. Uniformly convergent Fourier series
In order to extend the Moore (Reference Moore1979) analysis to a general initial condition, we briefly derive (2.28). Following Moore (Reference Moore1979), we first construct a generating function  $G(x,t)\in \mathbb {C}$, with real
 $x$ and
 $t$, as follows:
 \begin{equation} G(x,t) = \sum_{n\geq 1} \mathcal{A}_{n,0}(t) x^n, \end{equation}
where  $\mathcal {A}_{n,0}$ are the leading-order Fourier coefficients defined in (2.12). As a result, the ODE system (2.14) for
 $\mathcal {A}_{n,0}$ is equivalent to
 \begin{equation} \frac{\partial \bar{G}}{\partial x}=\frac{-{\rm i}x}{2}\frac{\partial G}{\partial x}\left(1+{\rm i}x\frac{\partial G}{\partial x}\right)^{{-}1}, \end{equation}
where the overline denotes complex conjugate. To obtain the asymptotic form of  $G(x,t)$ for large
 $t$, (2.18) is substituted into (A1), giving
 \begin{equation} G(x,t) = (1+{\rm i}) \sum_{r\geq 0}\frac{\hat{h}_r(\hat{\mu})}{t^{r+1}}, \end{equation}
where
 \begin{equation} \hat{\mu} = \frac{t{\rm e}^{t/2}x}{4}, \quad \hat{h}_r(\hat{\mu})= \sum_{j\geq r+1}\lambda_{j_r}\hat{\mu}^j, \end{equation}
and  $\lambda _{j_r}$ are the constants found in (2.18). However, as discussed in § 2.2.1, expansion (A3) leads to non-uniformly valid coefficients
 $\mathcal {A}_{n,0}$.
To resolve this issue, a strained time  $s(t)$ is introduced
 \begin{equation} \frac{{\rm d}s}{{\rm d}t}=1+\sum_{n\geq 1} \frac{\alpha_n}{s^{n+1}}, \end{equation}
where constant coefficients  $\alpha _n$ are to be determined. Integrating (A5) leads to
 \begin{equation} t=s+\frac{\alpha_1}{s}+\frac{\alpha_2}{2s^2}+O\left(\frac{1}{s^3}\right). \end{equation}
Consequently, (A3) can be rearranged as
 \begin{equation} G(x,t) = (1+{\rm i}) \sum_{r\geq 0}\frac{{h}_r({\mu})}{s^{r+1}}, \end{equation}
where
 \begin{equation} {\mu} = \frac{se^{s/2}x}{4}, \quad \hat{\mu}=\mu\left(1+\frac{\alpha_1}{2s}+\frac{\alpha_1+\alpha_1^2/8+\alpha_2/4}{s^2}+\cdots\right), \end{equation}
and  $h_r$ can be obtained by matching (A7) with (A3). As
 $\mu \to 0$, one has for example,
 \begin{equation} h_0=\lambda_{1,0}\,\mu+O(\mu^2),\quad h_1 = \frac{\alpha_1\lambda_{1,0}}{2}\mu+\left(\alpha_1\lambda_{2,0}+\lambda_{2,1}\right)\mu^2+O(\mu^3), \end{equation}
where  $\lambda _{1,0}$,
 $\lambda _{2,0}$ and
 $\lambda _{2,1}$ are given in (2.17).
Alternatively, directly substituting (A7) into (A2) gives a recursive ODE system for  $h_r$, where the first two equations read,
 \begin{equation} \left. \begin{gathered} \frac{{\rm d} \bar{h}_0}{{\rm d} \mu}-\frac{{\rm d} {h}_0}{{\rm d} \mu}=0,\\ \frac{\mu}{2}\left(\frac{{\rm d} \bar{h}_1}{{\rm d} \mu}-\frac{{\rm d} {h}_1}{{\rm d} \mu}\right)+\mu\frac{{\rm d} \bar{h}_0}{{\rm d} \mu}-\bar{h}_0-\frac{1-{\rm i}}{2}\left(\mu\frac{{\rm d}h_0}{{\rm d}\mu}\right)^2=0. \end{gathered} \right\} \end{equation}
Solutions of (A10) subject to initial values (A9a,b) are
 \begin{equation} h_0(\mu) = g(\mu), \end{equation}
where  $g(\mu )$ is given by (2.23), and
 $$\begin{gather} h_1(\mu) = \frac{1}{2}\left[\frac{\mathrm{Re}(\lambda_{2_1})}{\lambda_{2}}W_0^2(-\lambda_{1}\mu)-W_0(-\lambda_{1}\mu)(\alpha_1+W_0^2(-\lambda_{1}\mu))\right]\nonumber\\ +{\rm i}\left[\frac{W_0^2(-\lambda_{1}\mu)}{4}+\frac{W_0^3(-\lambda_{1}\mu)}{6}\right]. \end{gather}$$
The constant  $\alpha _1$ is determined by expanding (A12) around the branch point
 $\mu =-1/(\lambda _{1} e)$ and requiring that the most singular term in the expansion is no worse than that of (A11), i.e.
 $O(-1/e+\lambda _{1}\mu )^{3/2}$. This produces
 \begin{equation} \alpha_1 = \alpha_1(\lambda_{2_0},\lambda_{2_1}) ={-}4+\frac{2-4\cos 2\phi}{1-\sin 2\phi}, \end{equation}
which is non-zero in general. For the Moore case of  $\phi ={\rm \pi} /2$, we recover
 $\alpha _1 = 2$. Finally, substituting (A11) and (A12) into (A1) leads to the desired result (2.28).
Appendix B. Analytic continuation of region-II solution within region III
B.1. Inner expansion of analytically continued region-II solution
The right-hand side of  $w_1(\eta )$ given by the second equation in (5.18a,b) can be expanded about
 $\eta =0$ to give
 \begin{equation} w_{1,{Inner}}(\eta) ={-} A\left(-\frac{1}{4} + \frac{3}{4}\eta + \frac{3}{8}\eta^2 + \cdots\right) + {\rm i} \bar{A}\left(\frac{1}{4} + \frac{3}{4}\eta - \frac{3}{8}\eta^2+ \cdots\right), \end{equation}
which then gives, for the inner expansion of  $z_{II}(\varGamma,\tau )$
 $$\begin{gather} z_{II}(\varGamma,\tau) = b\varGamma + b\left(\frac{\tau}{|b|^2}\right)^{3/2} \left[ A\left(-\frac{1}{4} + \frac{3}{4}\left(\frac{\varGamma\,|b|^2}{\tau}\right) + \frac{3}{8}\left(\frac{\varGamma|b|^2}{\tau}\right)^2 + \cdots\right)\right.\nonumber\\ \left. \quad + {\rm i} \bar{A}\,\left(\frac{1}{4} + \frac{3}{4}\left(\frac{\varGamma\,|b|^2}{\tau}\right) - \frac{3}{8}\left(\frac{\varGamma\,|b|^2}{\tau}\right)^2+ \cdots\right)\right] . \end{gather}$$
When  $\varGamma \to 0^+$ we find that
 \begin{equation} z_{II}(\varGamma\to 0^+,\tau) ={-}\frac{b}{4}\left(\frac{\tau}{|b|^2}\right)^{3/2}(A_r-A_i)(1 - {\rm i})). \end{equation}
This result states that, when  $\tau >0^+$, the vortex sheet, which passes through the coordinate origin at
 $\tau =0^-$, separates into two distinct branches whose ends or tips separate as
 $\tau ^{3/2}$. An exceptional case is
 $A_r = A_i$. A similar result was also obtained as (2.42) from the analytic continuation of the Moore solution. The real and imaginary parts of both expressions are plotted vs
 $\epsilon$ in figure 14. When
 $\epsilon \to 0$ both expressions can be shown to be asymptotic to
 \begin{equation} z_{II}(\varGamma\to 0^+,\tau) \sim{-} \frac{1-{\rm i}}{3W_0\left(\frac{2}{e|\lambda_1 |\epsilon}\right)}\tau^{{3}/{2}}. \end{equation}
Agreement between the two expressions is better for the imaginary part. The sheet separation at  $\tau = 0^+$ appears to be an inescapable consequence of the analytic continuation of Moore's solution (2.33) which we expect to be asymptotically accurate when
 $\epsilon \to 0$.


In fact the correspondence of two solutions can be taken further. If from (2.39) we form  $z_{AC}(\varGamma,\tau )-z_{AC}(\varGamma,0)$, then this will give the change in sheet shape from its initial condition at time
 $\tau$. We can do the same by subtracting (2.35) from (5.16). Real and imaginary parts of these difference expressions are plotted in figure 15 for
 $\tau = 10^{-4}, \epsilon = 10^{-3}$, where it can be seen that relative differences are generally
 $O(1)$. In figure 16 using
 $\epsilon = 10^{-20}$, differences are smaller especially for the imaginary part. The reasons for this are not clear but are perhaps that first, that the assumption
 $\epsilon \ll 1$ is built into the Moore solution but not explicitly assumed in the Taylor-series expansion leading to (B2). Second, the main results of the Moore solution, surprisingly, follow from linear equations given by (2.14) while (5.16) is expected to be valid only for small
 $\tau$. We note that the series form of (5.16) is convergent only for
 $\varGamma > \tau /(2|b(\epsilon )|^2)$. With
 $\epsilon = 10^{-3}, 10^{-20}$ this gives
 $\varGamma > 7.46\times 10^{-5}$,
 $\varGamma > 5.25\times 10^{-5}$ respectively. These values both lie within the range of
 $\varGamma$ plotted in figures 15 and 16.
Real (a) and imaginary (b) parts of the change in the sheet position as functions of  $\varGamma$, from
 $\tau = 0$ to
 $\tau = 10^{-4}$ with
 $\epsilon = 10^{-3}$. Dashed: analytically continued solution from Moore (Reference Moore1979). Solid: using (5.16).

Real (a) and imaginary (b) parts of the change in the sheet position as functions of  $\varGamma$, from
 $\tau = 0$ to
 $\tau = 10^{-4}$ with
 $\epsilon = 10^{-20}$. Key: see figure 15.

B.2. Sheet strength, $\varGamma \to 0$, $\tau >0$


From (B2) we find that to  $O(\eta )$
 \begin{equation} \frac{\partial z_{II}}{\partial \varGamma} = b + b\left( \frac{\tau}{b\bar{b}} \right)^{1/2}\,\left( A\left(\frac{3}{4}+ \frac{3}{4}\eta + \cdots\right) +{\rm i}\bar{A}\left( \frac{3}{4}-\frac{3}{4} \eta +\cdots\right)\right).\end{equation}
The vortex-sheet strength  $\gamma (\varGamma,\tau ) = |\partial z_{II}/\partial \varGamma |^{-1}$ for small
 $\eta$ can be estimated. At the right-hand sheet tip when
 $\eta \to 0$
 \begin{equation} \gamma(0,\tau) = \frac{1}{\left|b\left(1 + \frac{3}{4}(A+{\rm i}\bar{A})\left( \frac{\tau}{b\bar{b}} \right)^{1/2}\right)\right|}.\end{equation}
This is finite for  $\tau =0^+$ with an order
 $\tau ^{1/2}$ correction for
 $\tau >0^+$.
Appendix C. Linearized BR equation in region II
We investigate  $w_1(\eta )$ given by the second of (5.18a,b) as a solution of (6.5), written here with
 $w_0 = \eta$ as
 \begin{equation} \frac{3}{2}\bar{w}_1-\eta \frac{{\rm d}\bar{w}_1}{{\rm d} \eta}={-}\frac{1}{2{\rm \pi} {\rm i}}{\int\hskip -1,05em -\,}_0^{\infty}\left(\frac{w_1-w_1'}{(\eta-\eta')^2 } + \frac{w_1+w_1'}{(\eta+\eta')^2 } \right)\,{\rm d}\eta' . \end{equation}
Using that
 \begin{equation} {\unicode{x2A0E}}_0^\infty \left(\frac{1}{(\eta - \eta')^2}+ \frac{1}{(\eta + \eta')^2} \right) \,{\rm d}\eta'\equiv0 , \end{equation}
we obtain
 \begin{equation} \frac{3}{2}\bar{w}_1-\eta \frac{{\rm d}\bar{w}_1}{{\rm d} \eta}=\frac{1}{2{\rm \pi} {\rm i}}{\unicode{x2A0E}}_0^{\infty} w_1(\eta')\left(\frac{1}{(\eta' - \eta)^2}- \frac{1}{(\eta' + \eta)^2} \right) . \end{equation}
The double bar indicates a generalized Cauchy principal-value integral interpreted as the average of values obtained when approaching  $\eta$ on the real line from above and below, in the complex
 $\eta$ plane.
To proceed, we employ an approach utilized by Cowley et al. (Reference Cowley, Baker and Tanveer1999, § 5). First write  $w_1 = w_r +\textrm {i}\,w_i$ and introduce the splitting
 $$\begin{gather} g^+= w_r + w_i,\quad g^-= w_r- w_i , \end{gather}$$
 $$\begin{gather}w_r ={\tfrac{1}{2} }( g^++ g^- ),\quad w_i ={\tfrac{1}{2} } ( g^+ - g^- ) , \end{gather}$$
which, when used in (C3), gives real and imaginary parts respectively as
 $$\begin{gather} \frac{3}{2}g^+-\eta \frac{{\rm d}g^+}{{\rm d} \eta}=\frac{1}{2{\rm \pi} }{\unicode{x2A0E}}_0^{\infty} g^+(\eta')\left(\frac{1}{(\eta' - \eta)^2}- \frac{1}{(\eta' + \eta)^2} \right){\rm d}\eta' , \end{gather}$$
 $$\begin{gather}\frac{3}{2}g^- -\eta \frac{{\rm d}g^-}{{\rm d} \eta}={-} \frac{1}{2{\rm \pi} }{\unicode{x2A0E}}_0^{\infty} g^-(\eta')\left(\frac{1}{(\eta' - \eta)^2}- \frac{1}{(\eta' + \eta)^2} \right)\,{\rm d}\eta' . \end{gather}$$
With the constant  $A = A_r+\textrm {i}\,A_i$, (5.18a,b) and (C4a,b) gives test solutions as
 $$\begin{gather} g^+_s = (A_r+A_i)\left(Q_1(\eta) + Q_2(\eta)\right) , \end{gather}$$
 $$\begin{gather}g^-_s = (A_r-A_i)\left(Q_1(\eta) - Q_2(\eta)\right) , \end{gather}$$
which can be expressed as
 $$\begin{gather} g^+_s = (A_r+A_i)\,F_1(\eta) , \quad F_1(\eta) = \textstyle{\frac{1}{2}}( 4 \eta^2+1 )^{3/4}\,\sin\left[ \textstyle{\frac{3}{2}}\arctan\left(2\,\eta \right) \right] , \end{gather}$$
 $$\begin{gather}g^-_s = (A_r-A_i) F_2(\eta) ,\quad F_2(\eta) ={-} \textstyle{\frac{1}{2}}\,( 4 \eta^2+1 )^{3/4}\cos\left[ \textstyle{\frac{3}{2}}\arctan\left(2\,\eta \right) \right] . \end{gather}$$
With these expressions the integrals on the right-hand sides of both (C6) and (C7) converge at both  $\eta ' =0,\infty$. Cowley et al. (Reference Cowley, Baker and Tanveer1999) used a Fourier-transform method to show that
 $F_1(\eta )$ is an exact solution of (C6). This has been verified presently both using the sine transform on
 $0\le \eta <\infty$ and also numerically. The function
 $F_2(\eta )$ is not an exact solution of (C7). However, a series solution of (C7) in inverse powers of
 $\eta$ can be constructed for large
 $\eta$. This is straightforward and details are omitted. The series is convergent for
 $\eta >{\tfrac {1}{2}}$ and sums to
 $F_2(\eta )$, which is then presently interpreted as an accurate approximate solution to (C7) for
 $\eta > {\tfrac {1}{2}}$ (this is verified numerically below) and therefore an asymptotic solution when
 $\eta \to \infty$. We conclude that
 $w_1(\eta )$ given by the second of (5.18a,b) is generally a very good approximate solution of the linearized BR equation (C3) for
 $\eta >{\tfrac {1}{2}}$ in region II, an asymptotic solution when
 $\eta \to \infty$ but fails for
 $\eta \to 0$. The exceptional case is
 $A_r = A_i$ when
 $g^-_s =0$ and
 $g^+_s$ gives an exact solution for all
 $\eta$.
The solution  $F_1(\eta )$ for (C6) can be used as a test for the numerical method used for the solution of the linearized BR equation described in § 6.3. This was implemented as a numerical solution of (C6) in real variables on the real line
 $0\le \eta \le 2$ (
 $\eta _0=2)$ with boundary condition
 $F_1(\eta =2)$. The solution value at
 $\eta =0$ was computed as part of the overall solution. In figure 17(a) the square root of the
 $L_2$ error norm (with respect to
 $F_1(\eta )$) is shown, where it is seen it is seen that the convergence is first order. Also shown in figure 17(b) is the result of an attempted solution of (C7). There is good agreement with
 $F_2(\eta )$ given by (C11a,b) for
 $\eta > 0.5$ but oscillatory behaviour with large amplitude for smaller values. This behaviour was found for all
 $N$ and for different
 $\eta _0$.