1 Introduction
Gas–solid fluidized beds are common in industry because they are useful for catalytic reactions, granulation, particle coating processes, drying and mixing. Although fluidization technology has been widely used in industry for many years, our understanding of gas–solid hydrodynamics is still far from complete because of the complex nature of gas–solid flows. In recent decades, computational fluid dynamics (CFD) has been used extensively to explore the physics of gas–solid flows. However, gas–solid flows are notoriously difficult to model, primarily because of the spatio-temporal scale gap that exists between the micro- and/or mesoscales where physical laws are given and the much larger macroscale phenomena that we wish to understand. This gap implies that multiscale simulation strategies are necessary (Li & Kwauk Reference Li and Kwauk1994; Van der Hoef et al. Reference Van der Hoef, van Sint Annaland, Deen and Kuipers2008). Numerous methods have been developed to explore the nature of gas–solid flow at different spatio-temporal scales, amongst which the Navier–Stokes order continuum theory (NS theory for short) is one of the most popular approaches (Anderson & Jackson Reference Anderson and Jackson1967; Gidaspow Reference Gidaspow1994).
NS theory treats both the gas and solid phases in a gas–solid flow as interpenetrating continua. The conservation equations of mass, momentum and energy are obtained through an appropriate averaging process and the constitutive relations for particle phase stress are usually closed using the kinetic theory of granular flow (KTGF) (Gidaspow Reference Gidaspow1994; Rao & Nott Reference Rao and Nott2008). According to the classical thermodynamics of irreversible processes (De Groot & Mazur Reference De Groot and Mazur1984), the NS theory has been established based on the local thermodynamic equilibrium (LTE) postulate; however, the LTE postulate breaks down if the states of local systems are far from equilibrium. The NS theory is normally valid for the gas phase, except for certain extreme circumstances such as rarefied flow, shock waves, flow under very large shear or flow in sufficiently small devices. However, because of the lack of scale separation and formation of bubbling and/or clustering structures, NS theory is usually claimed to be insufficient for the solid phase (Tan & Goldhirsch Reference Tan and Goldhirsch1998). Therefore, it is important to quantify the valid range of NS theory for the solid phase.
The LTE postulate (De Groot & Mazur Reference De Groot and Mazur1984) assumes that the parameters of the studied system vary in space and time so slowly that the system under study can be split into a series of representative volume elements, each of which is sufficiently large to allow it to be treated as a macroscopic thermodynamic system at equilibrium. Qualitatively, the LTE postulate is valid for systems that are sufficiently close to equilibrium. However, continuum theory provides no information on how small these deviations from equilibrium should be; instead, the problem should be explored using statistical mechanics. Studies using statistical mechanics like kinetic theory have shown that the LTE postulate is satisfactory provided that the velocity distribution function of the particles in the representative volume element is nearly Maxwellian. More precisely, it is the first-order Chapman–Enskog expansion of the Maxwellian velocity distribution in terms of a small parameter, such as the ratio of the mean free path of molecules to a characteristic length of macroscopic inhomogeneities (referred to as the Knudsen number) or the ratio of the molecular relaxation time to the characteristic macroscopic time (Chapman & Cowling Reference Chapman and Cowling1970). Assuming the validity of the LTE postulate, the resultant constitutive relations are Newton’s law of viscosity used in the momentum equation, Fourier’s law of heat conduction used in the granular temperature equation and Fick’s law of diffusion used in the species equation. All of these constitutive relations are used extensively in NS theory.
Criteria have been proposed to quantify the local non-equilibrium characteristics of single-phase flow. Following the studies on kinetic theory (Chapman & Cowling Reference Chapman and Cowling1970), researchers have used the Knudsen number as the criterion for the breakdown of the LTE postulate. The Knudsen number
 $Kn=\unicode[STIX]{x1D706}/L$
should be smaller than
 $0.05$
,
 $0.1$
or
 $0.2$
(those values are the thresholds used by different researchers) to ensure the validity of NS theory with appropriate velocity-slip and temperature-jump boundary conditions (if no-velocity-slip and no-temperature-jump boundary conditions are used, the
 $Kn$
should be smaller than 0.001) (Boyd, Chen & Candler Reference Boyd, Chen and Candler1995; Lockerby, Reese & Struchtrup Reference Lockerby, Reese and Struchtrup2009). There is a consensus that the microscopic length scale should be chosen as the mean free path
 $\unicode[STIX]{x1D706}$
, but the macroscopic characteristic length scale
 $L$
has different choices.
 $L$
can be defined on a length scale in terms of the gradient of local temperature, velocity, density or pressure. Different choices of
 $L$
result in different
 $Kn$
; therefore, it remains generally unclear how to properly select
 $L$
in a specific case. To address this issue, criteria based on entropy-related quantities (Camberos & Chen Reference Camberos and Chen2003; Carr, Branam & Camberos Reference Carr, Branam and Camberos2007; Niazmand, Mohammadzadeh & Roohi Reference Niazmand, Mohammadzadeh and Roohi2013) have been proposed, where all of the non-equilibrium effects can be included in a single formula. In addition, extensive molecular dynamics simulations have been performed to test the valid range of the LTE postulate. It has been consistently concluded that the LTE postulate is valid far beyond its formally expected range of validity; see Hansen et al. (Reference Hansen, Dyre, Daivis, Todd and Bruus2015) and references therein for details.
Quantification of the non-equilibrium characteristics of dissipative granular flow and gas–solid flow is far less advanced. A study on shear granular flows has suggested that NS theory is not a good option for rapid granular flow because of its inherent lack of scale separation (Tan & Goldhirsch Reference Tan and Goldhirsch1998). Another study on thermally driven granular flow also indicated that higher-order effects might be important (Hrenya, Galvin & Wildman Reference Hrenya, Galvin and Wildman2008). In contrast, research on a highly simplified homogeneous cooling system indicated that NS theory has the ability to predict the critical length for the onset of vortex instabilities in granular systems (Mitrano et al.
Reference Mitrano, Dahl, Cromer, Pacella and Hrenya2011, Reference Mitrano, Garzó, Hilger, Ewasko and Hrenya2012). Other work (Mitrano et al.
Reference Mitrano, Zenk, Sofiane, Galvin, Dahl and Hrenya2014) suggested that the NS theory may still be valid when
 $Kn$
is not small, meaning that the theory is valid outside its expected range of validity. Recently,
 $Kn$
-based criteria have been used to quantify the non-equilibrium features of gas–solid two-phase flow (Chen & Wang Reference Chen and Wang2017; Fullmer et al.
Reference Fullmer, Liu, Yin and Hrenya2017; Chen & Wang Reference Chen and Wang2018). It has also been concluded that NS theory is valid beyond its normal validity range (small
 $Kn$
) in gas–solid flows (Fullmer et al.
Reference Fullmer, Liu, Yin and Hrenya2017). Theoretical analysis using kinetic theory (Zhao, Wang & Wang Reference Zhao, Wang and Wang2017) has also been conducted to develop an entropy-based criterion (
 $I_{s}$
) for the validity of NS theory. The non-equilibrium effects of the gradient of granular temperature, gradient of particle velocity, and dissipative particle–particle collisions have been unified into
 $I_{s}$
. However, a systematic analysis of these criteria in gas–solid flow has not yet been reported.
In this study, a CFD-DEM method is used to systematically analyse the distance that a system is from the LTE state by quantifying
 $I_{s}$
and
 $Kn$
-based criteria with different definitions of the macroscopic characteristic length scale. The authors believe that this study will shed light on the non-equilibrium nature of gas–solid flows and aid the selection of proper CFD methods to model heterogeneous gas–solid flows.
2 CFD-DEM method
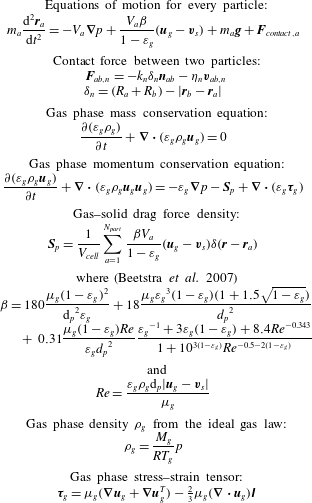
Pseudo three-dimensional (two-dimensional (2-D) for gas phase and 3-D for particles) CFD-DEM simulations or the discrete particle model (DPM) were used to investigate the non-equilibrium characteristics of gas–solid flow in fluidized beds. DEM is similar to molecular dynamics simulation and the work done here resembles that using molecular dynamics simulations to check the validity of the NS equation in single-phase flow. However, because the motion of individual particles is tracked in DEM simulations, the computational cost is quite high. Pseudo 3-D CFD-DEM simulation is a widely used strategy to lower computational cost but still capture the main physics of gas–solid fluidization (Müller et al. Reference Müller, Holland, Sederman, Scott, Dennis and Gladden2008; Feng & Yu Reference Feng and Yu2010). Two-dimensional simulation of the gas phase means that there was only one cell in the depth of the simulation domain. A soft sphere CFD-DEM method (Tsuji, Kawaguchi & Tanaka Reference Tsuji, Kawaguchi and Tanaka1993) was used here. A summary of the main equations is provided in table 1. The contact force resulting from particle–particle and particle–wall interactions was calculated using the linear spring and dashpot model proposed by Cundall & Strack (Reference Cundall and Strack1979), and the interphase drag force correlation proposed by Beetstra, van der Hoef & Kuipers (Reference Beetstra, van der Hoef and Kuipers2007) was used.
Governing equations of CFD-DEM method.

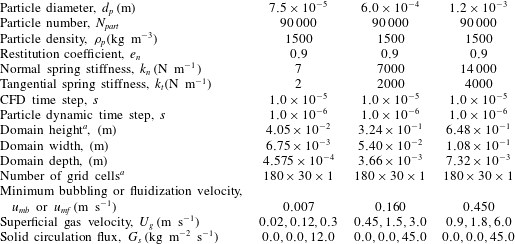
Summary of the parameters used in CFD-DEM simulations.

a
Values of the domain height and the number of grid cells in the
 $z$
direction were doubled, in the case of high superficial gas velocities.
We studied bubbling, turbulent and fast fluidization of Geldart A particles (particle diameter
 $d_{p}=75~\unicode[STIX]{x03BC}\text{m}$
, particle density
 $\unicode[STIX]{x1D70C}_{p}=1500~\text{kg}~\text{m}^{-3}$
), Geldart B particles (
 $d_{p}=600~\unicode[STIX]{x03BC}\text{m},\unicode[STIX]{x1D70C}_{p}=1500~\text{kg}~\text{m}^{-3}$
) and Geldart D particles (
 $d_{p}=1.2~\text{mm},\unicode[STIX]{x1D70C}_{p}=1500~\text{kg}~\text{m}^{-3}$
) that were fluidized by air
 $(T_{g}=293~\text{K},R=8.314~\text{J}~(\text{mol}~\text{K})^{-1},M_{g}=28.8\times 10^{-3}~\text{kg}~\text{mol}^{-1},\unicode[STIX]{x1D707}_{g}=1.8\times 10^{-5}~\text{Pa}~\text{s})$
. Turbulent fluidization is a term used to describe the fluidization regime where both particle clusters and gas bubbles can be found simultaneously in a fluidized bed. Turbulent fluidization has no relation with the turbulence of the gas phase; actually, the gas phase was laminar in this study. The spring stiffness constant and other parameters used in the CFD-DEM simulations are summarized in table 2.
In CFD-DEM simulations, boundary and initial conditions should be specified. At the bottom inlet, a uniform gas velocity
 $(U_{g})$
was imposed, whereas atmospheric pressure (
 $101\,325$
Pa) was assumed at the top outlet. No-slip conditions were applied to the walls for the gas phase. Because the gas phase was solved in two dimensions, only the left and right walls were no slip; there were no front and back walls for gas flow. The front and back walls for the solid phase were set as periodic boundary conditions with which the strong effects of front and back walls could be removed. However, a previous study has shown that the depth of the bed cannot be too small (such as one particle diameter); otherwise, some important physics will be lost (Feng & Yu Reference Feng and Yu2010). The depth of the simulation domain in the present study was selected as
 $6.1d_{p}$
following previous reports (Müller et al.
Reference Müller, Holland, Sederman, Scott, Dennis and Gladden2008; Feng & Yu Reference Feng and Yu2010; Wang, Van der Hoef & Kuipers Reference Wang, Van der Hoef and Kuipers2010). Of course, the physics of a pseudo 3-D bed will not be completely consistent with those of a fully 3-D bed; however pseudo 3-D CFD-DEM simulations are still useful. For example, Feng & Yu (Reference Feng and Yu2010) showed that pseudo 3-D CFD-DEM simulations with a bed thickness of
 $4.05d_{p}$
can achieve quantitative agreement with experimental results. Müller et al. (Reference Müller, Holland, Sederman, Scott, Dennis and Gladden2008) also used similar settings to compare with experimental measurements and the simulation results were in good agreement with experimental data. The particles were initially packed at the bottom of the bed with zero mean velocity, attached with random fluctuating velocity in the cases of bubbling and turbulent fluidization. Particles were continuously inserted from the bottom of the bed with a given inlet velocity that was determined by the given solid circulation flux
 $G_{s}$
in the case of fast fluidization. The top was not periodic; particles that went outside the top were deleted from the systems. In view of the fact that
 $I_{s}$
is only for smooth and inelastic particles (Zhao et al.
Reference Zhao, Wang and Wang2017), we assumed that particles in the CFD-DEM simulations were smooth and inelastic by setting the friction coefficient
 $\unicode[STIX]{x1D707}_{f}=0$
and tangential restitution coefficient
 $e_{t}=1.0$
(Pöschel & Schwager Reference Pöschel and Schwager2005). Furthermore, the parameters for particle–wall interaction were equal to those for particle–particle interactions. The grid size used to solve the fluid solver was
 $3d_{p}$
, which is necessary to correctly capture the hydrodynamics of gas–solid flow in fluidized beds (Wang, Van der Hoef & Kuipers Reference Wang, Van der Hoef and Kuipers2009; Wang et al.
Reference Wang, Van der Hoef and Kuipers2010; Radl & Sundaresan Reference Radl and Sundaresan2014).
The 3-D DPM code developed by Professor J.A.M. Kuipers’ group was used to carry out all simulations. More details of the code can be found elsewhere (Hoef et al. Reference Hoef, Ye, Annaland, Andrews, Sundaresan and Kuipers2006). Both the CFD-DEM method and code used in the present study have been extensively proved to be very useful to explore the physics of gas–solid flow, therefore, validation of the model and verification of the code were not performed here.
3 Overview of criteria
3.1 Entropy-based criterion
Studies of the microscopic foundation of non-equilibrium thermodynamics using kinetic theory of dilute gases have shown that the entropy density of a non-equilibrium system
 $s$
can be defined as (De Groot & Mazur Reference De Groot and Mazur1984)
 $$\begin{eqnarray}\unicode[STIX]{x1D700}_{s}\unicode[STIX]{x1D70C}_{s}s=-k_{B}\int f\ln f\,\text{d}\boldsymbol{c}=-m\int f\ln f\,\text{d}\boldsymbol{c},\end{eqnarray}$$
where
 $\unicode[STIX]{x1D700}_{s}$
,
 $\unicode[STIX]{x1D70C}_{s}$
and
 $m$
are the solid concentration, solid density and mass of a single particle, respectively;
 $k_{B}$
is a Boltzmann-like constant, and
 $k_{B}=m$
is determined following the monograph of Chapman & Cowling (Reference Chapman and Cowling1970). According to the Chapman–Enskog method, the distribution function
 $f$
was expressed in the form of infinite series that were supposed to converge uniformly (Sela & Goldhirsch Reference Sela and Goldhirsch1998; Rao & Nott Reference Rao and Nott2008),
 $$\begin{eqnarray}f=f^{eq}[1+\unicode[STIX]{x1D719}^{(K)}+\unicode[STIX]{x1D719}^{(\unicode[STIX]{x1D716})}+\unicode[STIX]{x1D719}^{(K\unicode[STIX]{x1D716})}+\unicode[STIX]{x1D719}^{(K^{2})}+\unicode[STIX]{x1D719}^{(\unicode[STIX]{x1D716}^{2})}+\cdots \,],\end{eqnarray}$$
where
 $f^{eq}$
is the equilibrium distribution function (Maxwellian distribution) and
 $\unicode[STIX]{x1D719}^{(K)}$
,
 $\unicode[STIX]{x1D719}^{(\unicode[STIX]{x1D716})}$
,
 $\unicode[STIX]{x1D719}^{(K\unicode[STIX]{x1D716})}$
,
 $\unicode[STIX]{x1D719}^{(K^{2})}$
,
 $\unicode[STIX]{x1D719}^{(\unicode[STIX]{x1D716}^{2})}\cdots \,$
are expressed in terms of two small parameters: one is
 $K\equiv \unicode[STIX]{x03C0}\sqrt{2}Kn$
, the other is related to the inelasticity of particle–particle collisions,
 $\unicode[STIX]{x1D716}\equiv (1-e^{2})$
, where
 $e$
is the restitution coefficient. Substituting (3.2) into (3.1), we have the entropy density up to the second order (Zhao et al.
Reference Zhao, Wang and Wang2017),
 $$\begin{eqnarray}\unicode[STIX]{x1D700}_{s}\unicode[STIX]{x1D70C}_{s}s=\unicode[STIX]{x1D700}_{s}\unicode[STIX]{x1D70C}_{s}s^{eq}-\frac{1}{2}\int mf^{eq}[\unicode[STIX]{x1D719}^{(K)}+\unicode[STIX]{x1D719}^{(\unicode[STIX]{x1D716})}]^{2}\,\text{d}\boldsymbol{c},\end{eqnarray}$$
where the perturbation functions
 $\unicode[STIX]{x1D719}^{(K)}$
and
 $\unicode[STIX]{x1D719}^{(\unicode[STIX]{x1D716})}$
are measures of the deviation of the actual distribution function
 $f$
from the local equilibrium distribution function
 $f^{eq}$
. From (3.3), it is clear that the first term on the right-hand side is the entropy density at the equilibrium state, and the second term is the entropy density related to the second-order correction, which is the first nonlinear term. Because the analysis of the entropy density used the Chapman–Enskog method with the assumption of small Knudsen number and small inelasticity, higher-order corrections were assumed to be negligible compared to this term; therefore, it represents the effect of nonlinearity. The entropy-based criterion
 $I_{s}$
is defined as (Zhao et al.
Reference Zhao, Wang and Wang2017):
 $$\begin{eqnarray}\displaystyle I_{s} & = & \displaystyle \frac{\displaystyle -\frac{1}{2}\int mf^{eq}[\unicode[STIX]{x1D719}^{(K)}+\unicode[STIX]{x1D719}^{(\unicode[STIX]{x1D716})}]^{2}\,\text{d}\boldsymbol{c}}{\unicode[STIX]{x1D700}_{s}\unicode[STIX]{x1D70C}_{s}s^{eq}}\nonumber\\ \displaystyle & = & \displaystyle \frac{\displaystyle \left(\frac{5d_{p}}{64\unicode[STIX]{x1D700}_{s}g_{0}}\right)^{2}\left(\frac{\unicode[STIX]{x03C0}}{\unicode[STIX]{x1D703}}\right)\left\{\left(1+\frac{12}{5}\unicode[STIX]{x1D700}_{s}g_{0}\right)^{2}\left[\frac{5\unicode[STIX]{x1D703}}{2}(\unicode[STIX]{x1D735}\ln \unicode[STIX]{x1D703})^{2}\right]+\frac{4}{9}\left(1+\frac{8}{5}\unicode[STIX]{x1D700}_{s}g_{0}\right)^{2}\left(\frac{4}{3}W_{1}+W_{2}\right)\right\}+1.45(1-e_{p}^{2})^{2}}{\displaystyle \left[2\ln \frac{n}{(2\unicode[STIX]{x03C0}\unicode[STIX]{x1D703})^{3/2}}-3\right]},\nonumber\\ \displaystyle & & \displaystyle\end{eqnarray}$$
where
 $$\begin{eqnarray}\left.\begin{array}{@{}c@{}}\displaystyle W_{1}=\frac{1}{2}\left[\left(\frac{\unicode[STIX]{x2202}u_{sx}}{\unicode[STIX]{x2202}x}-\frac{\unicode[STIX]{x2202}u_{sy}}{\unicode[STIX]{x2202}y}\right)^{2}+\left(\frac{\unicode[STIX]{x2202}u_{sx}}{\unicode[STIX]{x2202}x}-\frac{\unicode[STIX]{x2202}u_{sz}}{\unicode[STIX]{x2202}z}\right)^{2}+\left(\frac{\unicode[STIX]{x2202}u_{sy}}{\unicode[STIX]{x2202}y}-\frac{\unicode[STIX]{x2202}u_{sz}}{\unicode[STIX]{x2202}z}\right)^{2}\right],\\ \displaystyle W_{2}=\left(\frac{\unicode[STIX]{x2202}u_{sx}}{\unicode[STIX]{x2202}y}+\frac{\unicode[STIX]{x2202}u_{sy}}{\unicode[STIX]{x2202}x}\right)^{2}+\left(\frac{\unicode[STIX]{x2202}u_{sx}}{\unicode[STIX]{x2202}z}+\frac{\unicode[STIX]{x2202}u_{sz}}{\unicode[STIX]{x2202}x}\right)^{2}+\left(\frac{\unicode[STIX]{x2202}u_{sy}}{\unicode[STIX]{x2202}z}+\frac{\unicode[STIX]{x2202}u_{sz}}{\unicode[STIX]{x2202}y}\right)^{2}.\end{array}\right\}\end{eqnarray}$$
 $I_{s}$
is an indicator of the relative importance of higher (second) order correction or nonlinear effects, where the deviation from the local equilibrium state is measured via the terms related to the gradient of granular temperature, gradient of particle velocity and inelasticity of particle–particle collisions. Equation (3.4) is the entropy-based criterion for the validity of NS theory obtained from kinetic theory analysis;
 $I_{s}$
should be small to ensure that the LTE postulate is valid; i.e.
 $I_{s}\ll 1$
.
3.2 Knudsen number
Previous studies on gas–solid flow (Chen & Wang Reference Chen and Wang2017; Fullmer et al.
Reference Fullmer, Liu, Yin and Hrenya2017; Chen & Wang Reference Chen and Wang2018) have used the Knudsen number to quantify the degree of non-equilibrium. In Knudsen-number-based criteria, the parameter characterizing the inelasticity of particle–particle collisions (
 $e$
) is not explicitly included, although the particle restitution coefficient
 $e$
is the only parameter used to characterize the nature of particle–particle collisions. The Knudsen number is defined as
 $$\begin{eqnarray}Kn=\frac{d_{p}}{6\sqrt{2}g_{0}\unicode[STIX]{x1D700}_{s}L},\end{eqnarray}$$
where
 $d_{p}$
is the particle diameter,
 $L$
is the macroscopic characteristic length scale and the radial distribution function at contact
 $g_{0}$
is (Gidaspow Reference Gidaspow1994)
 $$\begin{eqnarray}g_{0}=\left[1.0-\left(\frac{\unicode[STIX]{x1D700}_{s}}{\unicode[STIX]{x1D700}_{s,max}}\right)^{1/3}\right]^{-1},\end{eqnarray}$$
where
 $\unicode[STIX]{x1D700}_{s,max}=0.63$
is the solid concentration at the maximum packing state. However,
 $L$
is often selected based on entirely different macroscopic length scales. Some studies have selected the width of the simulation channel as the characteristic macroscopic length scale (Chen & Wang Reference Chen and Wang2017, Reference Chen and Wang2018); this choice has the advantage that
 $L$
is known before carrying out simulations. However, we are interested in
 $L$
defined according to the gradient length scale of differently macroscopic fields, because this is consistent with KTGF. The disadvantage of choosing the gradient length scale of different macroscopic fields as
 $L$
is that Knudsen numbers cannot be obtained unless one performs simulations. In this study, we test three Knudsen numbers by choosing
 $L$
of
 $L=\unicode[STIX]{x1D716}_{s}/|\unicode[STIX]{x1D735}\unicode[STIX]{x1D716}_{s}|$
,
 $L=\unicode[STIX]{x1D703}_{s}/|\unicode[STIX]{x1D735}\unicode[STIX]{x1D703}_{s}|$
and
 $L=|\boldsymbol{u}_{s}|/|\unicode[STIX]{x1D735}\boldsymbol{u}_{s}|$
, which respectively give (Chen & Wang Reference Chen and Wang2017; Fullmer et al.
Reference Fullmer, Liu, Yin and Hrenya2017; Chen & Wang Reference Chen and Wang2018):
 $$\begin{eqnarray}\displaystyle & \displaystyle Kn_{frac}=\frac{d_{p}|\unicode[STIX]{x1D735}\unicode[STIX]{x1D700}_{s}|}{6\sqrt{2}g_{0}{\unicode[STIX]{x1D700}_{s}}^{2}}, & \displaystyle\end{eqnarray}$$
 $$\begin{eqnarray}\displaystyle & \displaystyle Kn_{gran}=\frac{d_{p}|\unicode[STIX]{x1D735}\unicode[STIX]{x1D703}|}{6\sqrt{2}g_{0}\unicode[STIX]{x1D700}_{s}\unicode[STIX]{x1D703}}, & \displaystyle\end{eqnarray}$$
 $$\begin{eqnarray}\displaystyle & \displaystyle Kn_{vel}=\frac{d_{p}|\unicode[STIX]{x1D735}\boldsymbol{u}_{s}|}{6\sqrt{2}g_{0}\unicode[STIX]{x1D700}_{s}|\boldsymbol{u}_{s}|}. & \displaystyle\end{eqnarray}$$
The granular temperature
 $\unicode[STIX]{x1D703}$
is defined as
 $\unicode[STIX]{x1D703}=(\unicode[STIX]{x1D703}_{x}+\unicode[STIX]{x1D703}_{y}+\unicode[STIX]{x1D703}_{z})/3$
, and
 $\unicode[STIX]{x1D703}_{k}$
(
 $k=x,y,z$
) is defined as
 $\unicode[STIX]{x1D703}_{k}=(\sum _{i=1}^{N_{part}}(\boldsymbol{v}_{k,i}-\boldsymbol{u}_{s,k})^{2})/N_{part}$
with
 $\boldsymbol{u}_{s,k}=(\sum _{i=1}^{N_{part}}\boldsymbol{v}_{k,i})/N_{part}$
, where
 $N_{part}$
is the number of particles in the computational cell under consideration. After mapping the Lagrangian data of particles into the Eulerian data of computational cells, the gradients of hydrodynamic variables can then be extracted.
Studies of single-phase flow have indicated that the flow can be divided into different regimes: the regime where
 $Kn<0.001$
is defined as continuous, which can be described by NS theory with no-slip wall boundary conditions. The NS theory with proper slip-wall boundary conditions has been applied to the region of
 $0.001\leqslant Kn\leqslant 0.1$
. When
 $Kn>0.1$
, NS theory fails (note that a higher-order continuum theory such as Burnett-order continuum theory may still be valid) and a more fundamental description such as kinetic theory should be used. Because the use of a (partial) slip-wall boundary condition (Johnson & Jackson Reference Johnson and Jackson1987) is widely accepted in NS theory for gas–solid flow, we used a value of 0.1 as the threshold. That is,
 $I_{s}\leqslant 0.1$
or
 $Kn\leqslant 0.1$
should be satisfied to ensure that NS theory is valid.
4 Simulation results
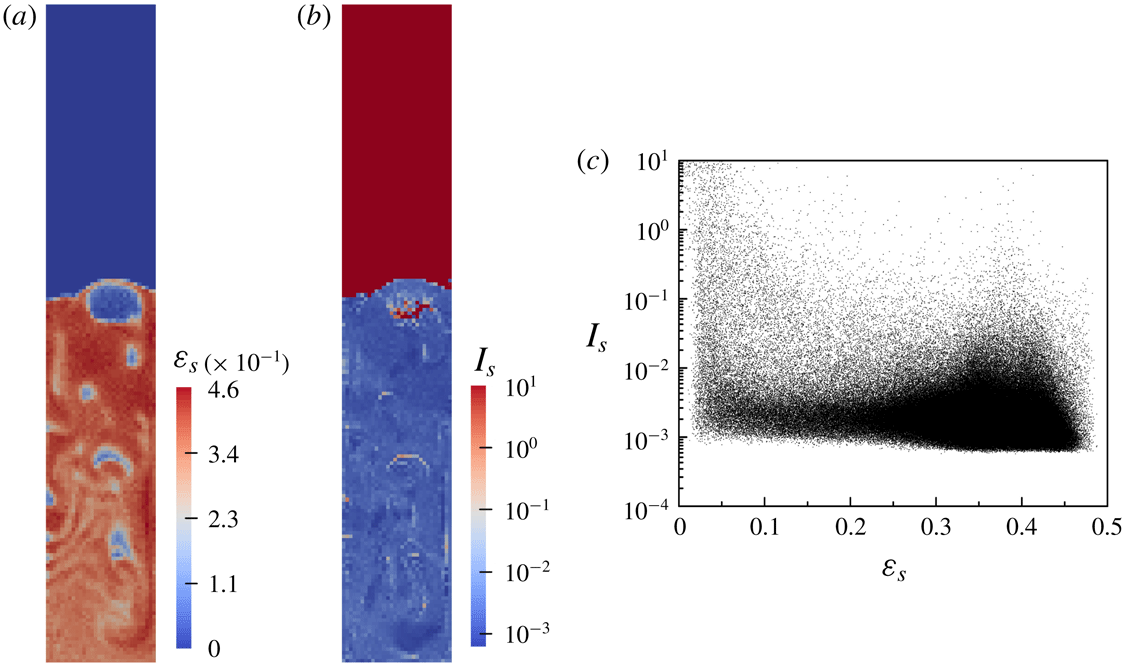
Figure 1(a) shows a representative snapshot of the solid concentration distribution obtained from bubbling fluidization of Geldart A particles. Bubbling structures formed in the beds and the solid concentration distribution are highly heterogeneous. Figure 1(b) shows a snapshot of the corresponding distribution of
 $I_{s}$
. It can be seen that even at the boundaries of the bubble and emulsion phases, the values of
 $I_{s}$
are still quite small. This means that, from a thermodynamic viewpoint, the driving forces are small even at the boundaries of bubbles. The values of
 $I_{s}$
are large only at the centre of bubbles where the solid concentration is quite low; here, NS theory fails. These observations suggest that local solid concentration may be used as the criterion of the failure of NS theory. However, detailed analysis indicated that solid concentration alone is not a proper criterion to measure the validity of NS theory, as illustrated in figure 1(c), which shows that the values of
 $I_{s}$
can vary by three to four orders of magnitude even at the same solid concentration.
The value of
 $I_{s}$
contains three different mechanisms that contribute to the non-equilibrium effects, which are related to the gradient of granular temperature, gradient of particle velocity and dissipation caused by inelastic particle–particle collisions. Therefore, we studied the relative importance of these three contributions:
 $$\begin{eqnarray}\displaystyle & \displaystyle I_{s}^{T}=\frac{\displaystyle \left(\frac{5d_{p}}{64\unicode[STIX]{x1D700}_{s}g_{0}}\right)^{2}\left(\frac{\unicode[STIX]{x03C0}}{\unicode[STIX]{x1D703}}\right)\left(1+\frac{12}{5}\unicode[STIX]{x1D700}_{s}g_{0}\right)^{2}\left[\frac{5\unicode[STIX]{x1D703}}{2}(\unicode[STIX]{x1D735}\ln \unicode[STIX]{x1D703})^{2}\right]}{\displaystyle \left[2\ln \frac{n}{(2\unicode[STIX]{x03C0}\unicode[STIX]{x1D703})^{3/2}}-3\right]}, & \displaystyle\end{eqnarray}$$
 $$\begin{eqnarray}\displaystyle & \displaystyle I_{s}^{vel}=\frac{4}{9}\frac{\displaystyle \left(\frac{5d_{p}}{64\unicode[STIX]{x1D700}_{s}g_{0}}\right)^{2}\left(\frac{\unicode[STIX]{x03C0}}{\unicode[STIX]{x1D703}}\right)\left(1+\frac{8}{5}\unicode[STIX]{x1D700}_{s}g_{0}\right)^{2}\left(\frac{4}{3}W_{1}+W_{2}\right)}{\displaystyle \left[2\ln \frac{n}{(2\unicode[STIX]{x03C0}\unicode[STIX]{x1D703})^{3/2}}-3\right]}, & \displaystyle\end{eqnarray}$$
 $$\begin{eqnarray}\displaystyle & \displaystyle I_{s}^{e}=\frac{1.45(1-e^{2})^{2}}{\displaystyle \left[2\ln \frac{n}{(2\unicode[STIX]{x03C0}\unicode[STIX]{x1D703})^{3/2}}-3\right]}. & \displaystyle\end{eqnarray}$$
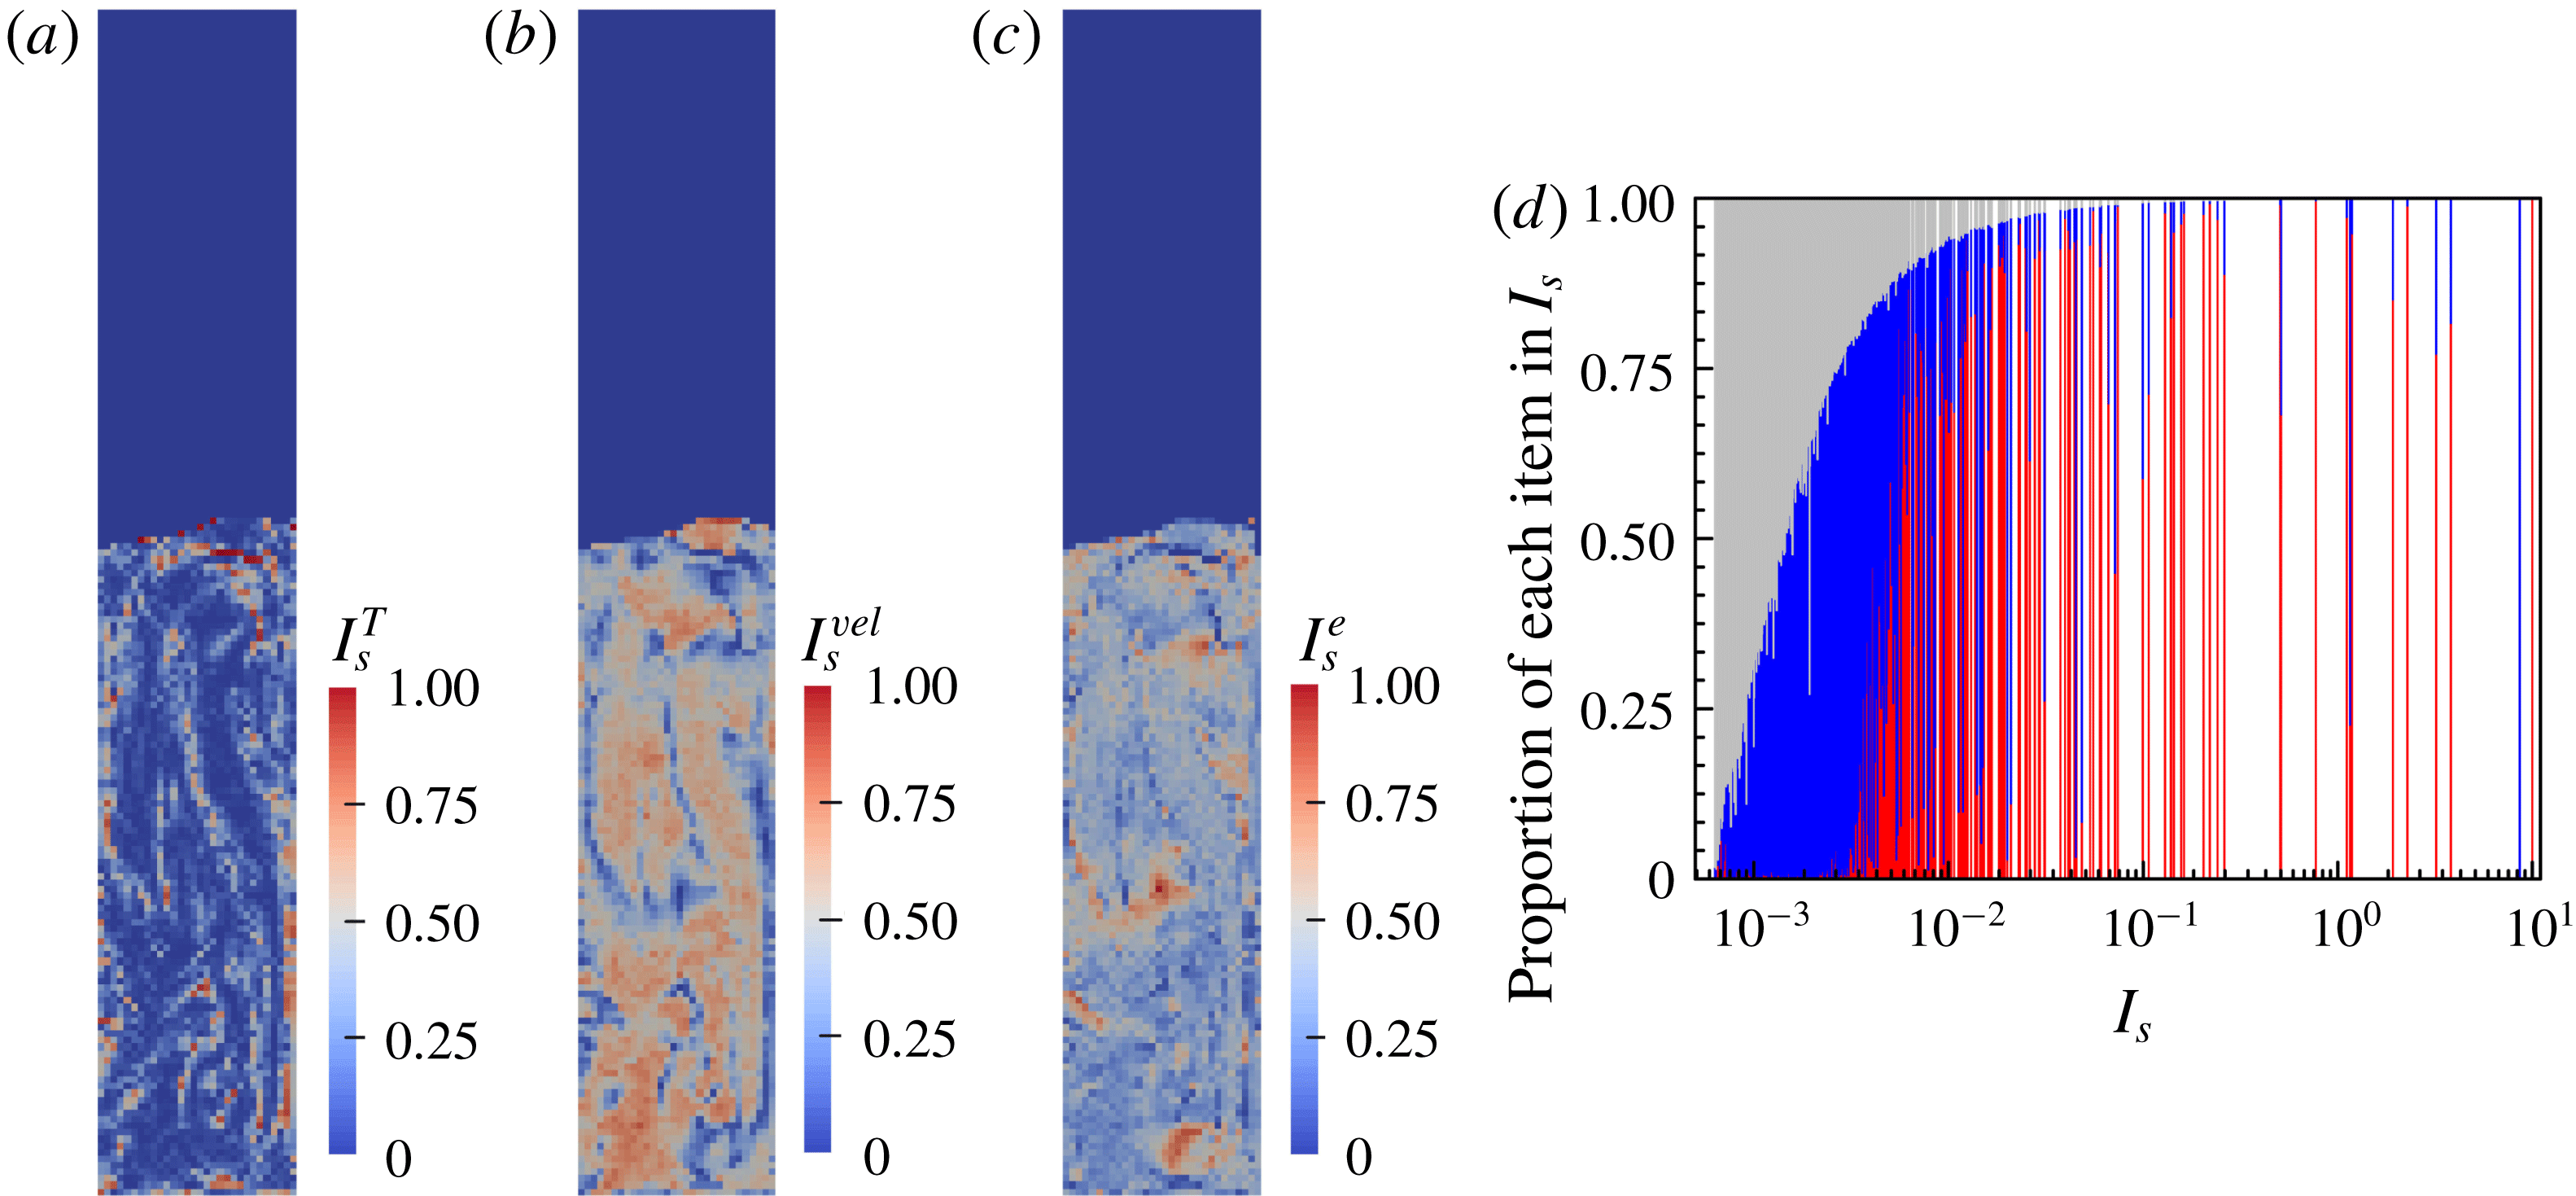
Figure 2(a–c) presents snapshots of the spatial distribution of the relative contribution of each mechanism. The relative importance of the three mechanisms varies spatio-temporally. It seems that all three mechanisms provide important contributions; there is no dominant one. When we examined all simulation results, even in the fast fluidization regime where the solid concentrations in computational cells are low, we found that
 $I_{s}^{e}$
still made an important contribution to the non-equilibrium characteristics of heterogeneous gas–solid flow. In general, the conclusions based on this kind of observation were similar; thus, other results have not been reported here. Figure 2(d) displays the proportion of the quantitative contribution of the three mechanisms to all computational cells at
 $t=10$
s as a function of
 $I_{s}$
. When
 $I_{s}$
is small,
 $I_{s}^{e}$
is the main contribution. With increasing
 $I_{s}$
,
 $I_{s}^{vel}$
and
 $I_{s}^{T}$
increased, and
 $I_{s}^{vel}$
became the main source of the non-equilibrium effect at moderate values of
 $I_{s}$
. At higher
 $I_{s}$
, in most of the computational cells,
 $I_{s}^{T}$
was the dominant contribution. Moreover, when
 $I_{s}\geqslant 0.1$
,
 $I_{s}^{T}$
was the dominant contribution; therefore,
 $I_{s}^{T}$
was the main source of the failure of NS theory.
Snapshots of (a) solid concentration distribution and (b) the corresponding distribution of
 $I_{s}$
. (c) Plot of
 $I_{s}$
against the solid concentration for data obtained from bubbling fluidization of Geldart A particles (
 $d_{p}=7.5\times 10^{-5}m$
and
 $u_{g}=0.02~\text{m}~\text{s}^{-1}$
).

Snapshots of the proportion of the three mechanisms contributing to
 $I_{s}$
obtained from bubbling fluidization of Geldart A particles: (a)
 $I_{s}^{T}$
, (b)
 $I_{s}^{vel}$
and (c)
 $I_{s}^{e}$
. (d) The proportion of quantitative contribution of the three mechanisms in all computational cells at
 $t=10$
s plotted as a function of
 $I_{s}$
. Each computational cell has a value of
 $I_{s}$
, which has values of its three contributions of
 $I_{s}^{T}$
(red),
 $I_{s}^{vel}$
(blue) and
 $I_{s}^{e}$
(grey). Therefore, if the region is mainly filled with a certain colour, the corresponding mechanism is the main contribution to
 $I_{s}$
.

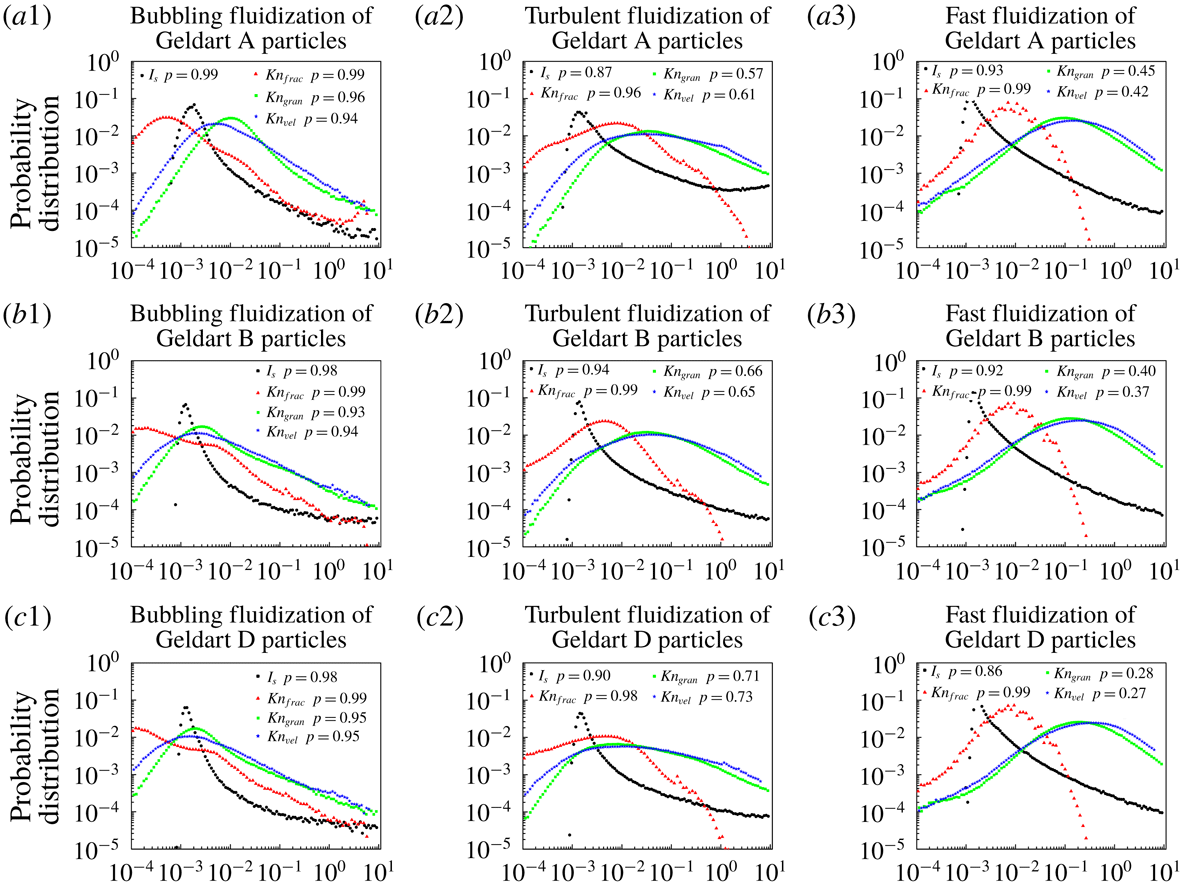
The probability distribution functions (PDFs) of
 $I_{s}$
,
 $Kn_{frac}$
,
 $Kn_{gran}$
and
 $Kn_{vel}$
are shown in figure 3. Data obtained from 100 different snapshots were used to construct the PDFs. In the cases of bubbling and turbulent fluidization, there were no particles at the tops of the fluidized beds (
 $\unicode[STIX]{x1D700}_{s}=0$
), which means that the values of
 $I_{s}$
and
 $Kn$
are infinitely large. To ensure that the PDFs had a good appearance, when
 $I_{s}>10$
or
 $Kn>10$
, we used
 $I_{s}=10$
or
 $Kn=10$
, respectively, in the analysis of the CFD-DEM results. Of course, it is also possible that for some computational cells
 $I_{s}>10$
or
 $Kn>10$
, but there are solid particles inside the cells. The value of
 $p$
is the ratio of the number of cells that have
 $I_{s}\leqslant 0.1$
or
 $Kn\leqslant 0.1$
to the total number of cells, not counting the cells without solid particles. For example, at each moment, data for 5400 computational cells were available in the case of bubbling fluidization of Geldart A particles. There were 3040 computational cells with
 $I_{s}\leqslant 0.1$
, 13 cells with
 $0.1<I_{s}<10.0$
, 37 cells containing solid particles with
 $I_{s}=10.0$
and 2310 cells without solid particles (
 $\unicode[STIX]{x1D700}_{s}=0.0$
); therefore,
 $p=3040/(3040+13+37)\approx 0.98$
.
For bubbling fluidization of Geldart A, B and D particles, regardless of the criterion selected,
 $p\geqslant 0.93$
even though there were extensive bubbling structures. This means that the LTE postulate is valid in most places of the bed with solid particles and the driving force cannot be regarded as large from a thermodynamic viewpoint. We were not able to prove rigorously that the remaining cells (
 ${\leqslant}7\,\%$
) with a value larger than 0.1 did not inhibit the success of NS theory. However, many studies (Wang et al.
Reference Wang, Van der Hoef and Kuipers2009, Reference Wang, Van der Hoef and Kuipers2010; Fullmer & Hrenya Reference Fullmer and Hrenya2016) have shown that the results of continuum modelling are in good agreement with those of CFD-DEM simulations. Therefore, we suppose that the failure of NS theory in a few computational cells will not prevent the success of NS theory as a whole. The PDFs reveal that the values of
 $Kn_{gran}$
and
 $Kn_{vel}$
are typically one order of magnitude larger than those of
 $I_{s}$
and
 $Kn_{frac}$
. These observations can explain why previous highly resolved simulations using NS theory can reasonably predict the hydrodynamics of gas–solid flow in bubbling fluidized beds (Wang et al.
Reference Wang, Van der Hoef and Kuipers2009), because the underlying assumption of NS theory is valid.
When the fluidization regime transitioned to turbulent and fast fluidization, the number of computational cells in which the value of
 $I_{s}$
,
 $Kn_{gran}$
,
 $Kn_{frac}$
or
 $Kn_{vel}$
was larger than 0.1 increased gradually. This indicates that NS theory broke down in more computational cells than was the case for bubbling fluidization. The value of
 $p$
strongly depended on the chosen criterion. If
 $Kn_{frac}$
was chosen,
 $p\geqslant 0.96$
irrespective of the fluidization regime and type of particle. When
 $I_{s}$
was selected as the criterion, the minimum value of
 $p$
in all cases was 0.86. Therefore, we may still conclude that NS theory is valid for all cases, although with less confidence, compared to the conclusions drawn from the criterion of
 $Kn_{frac}$
. However, when
 $Kn_{vel}$
or
 $Kn_{gran}$
was chosen, NS theory was clearly violated in the fast fluidization regime. The PDF peak of
 $I_{s}$
appeared at
 $O(10^{-3})$
irrespective of the fluidization regime and type of particle, but when other criteria were selected, the PDF peak varied considerably. Finally, we note that simulations using realistic particles resulted in similar conclusions, as presented in the Appendix.
Probability distributions of
 $I_{s}$
,
 $Kn_{frac}$
,
 $Kn_{gran}$
and
 $Kn_{vel}$
. Data were obtained from bubbling, turbulent and fast fluidization simulations of Geldart A, B and D particles.

5 Discussion
It has long been recognized that bubbling and/or clustering structures are important to the correct understanding of gas–solid hydrodynamics. State-of-the-art studies have demonstrated two different ways to model bubbling and/or clustering structures using NS theory: explicit resolution (Agrawal et al. Reference Agrawal, Loezos, Syamlal and Sundaresan2001; Wang et al. Reference Wang, Van der Hoef and Kuipers2009) and implicit modelling (Yang et al. Reference Yang, Wang, Ge and Li2003; Igci et al. Reference Igci, Andrews, Sundaresan, Pannala and O’Brien2008; Wang, Ge & Li Reference Wang, Ge and Li2008). If the size of computational cells is sufficiently small to explicitly resolve the dynamic evolution of bubbling and/or clustering structures, there is no complex structure inside computational cells, but the thermodynamic driving forces might be large. Large thermodynamic driving forces then result in the breakdown of the LTE postulate underpinning NS theory. If the size of the computational cells is larger than the typical length scale of bubbling and/or clustering structures, the bubbling and/or clustering structures inside computational cells are the reason for the violation of the LTE postulate (but the thermodynamic driving forces are possibly not large). The present study and those reviewed in § 1 have focused on the former situation. From the viewpoint of CFD simulations, the results presented and conclusions drawn here are only applicable to cases where the bubbling and/or clustering structures are explicitly resolved using highly resolved NS theory (Agrawal et al. Reference Agrawal, Loezos, Syamlal and Sundaresan2001; Wang Reference Wang2008; Wang et al. Reference Wang, Van der Hoef and Kuipers2009, Reference Wang, Van der Hoef and Kuipers2010; Fullmer & Hrenya Reference Fullmer and Hrenya2016; Fullmer et al. Reference Fullmer, Liu, Yin and Hrenya2017). The situation where the bubbling and/or clustering structures are implicitly modelled is beyond the scope of the present study.
It has been concluded that NS theory provides good predictions of the characteristics of rapid granular gases even far beyond its supposed validity limits (Mitrano et al.
Reference Mitrano, Dahl, Cromer, Pacella and Hrenya2011, Reference Mitrano, Garzó, Hilger, Ewasko and Hrenya2012, Reference Mitrano, Zenk, Sofiane, Galvin, Dahl and Hrenya2014). Because in these studies the maximal value of
 $Kn_{frac}$
,
 $Kn_{gran}$
or
 $Kn_{vel}$
was selected as the criterion, the value of
 $Kn$
was normally not small. But as has been discussed above,
 $I_{s}$
might be a better criterion than
 $Kn$
and
 $I_{s}$
is small even when there are bubbling/clustering structures. Therefore, it is not surprising that NS theory is valid, thus offering an explanation of the ‘unexpected’ successes reported in the literature. The conclusion that NS theory is valid for rapid granular gases also indicates that the intuition that large thermodynamic driving forces exist at the boundary of bubbling and/or clustering structures might be incorrect; the thermodynamic driving forces may actually be small.
With respect to the modelling of heterogeneous gas–solid flow, it is usually concluded that simulation results obtained from NS theory, CFD-DEM simulation and direct numerical simulation are in good agreement (Wang et al. Reference Wang, Van der Hoef and Kuipers2009; Fullmer & Hrenya Reference Fullmer and Hrenya2016; Fullmer et al. Reference Fullmer, Liu, Yin and Hrenya2017; Lu et al. Reference Lu, Liu, Li, Wang, Ge and Benyahia2017, Reference Lu, Liu, Li, Wang and Ge2018), thus validating NS theory. The reported failure of NS theory is based on comparison with experimental data. In simulations, the particles used are ideal (typically smooth, inelastic and monodisperse spheres), whereas actual particles are normally non-spherical, rough and polydisperse. Furthermore, it has long been recognized that the success or failure of NS theory heavily depends on the interphase drag force, particulate phase stress and boundary conditions for particle–wall interactions. The findings of the present study indicate that NS theory is a reasonable choice for discrete particles. Therefore, further studies should focus on the following issues: (i) if the interphase drag force correlation and boundary conditions for particle–wall interactions used are sufficient to capture the physical nature of gas–solid and particle–wall interactions, and/or (ii) when the numerical results are directly compared to experimental data, if the non-ideal particle properties (such as roughness, non-sphericity, polydispersity and cohesion) are considered properly, and if other aspects such as bed geometry and spatial dimensions (two vs three dimensions) are exactly the same in numerical simulations and experiments.
6 Conclusion
CFD-DEM simulations of bubbling, turbulent and fast fluidization of idealized Geldart A, B and D particles were carried out to systematically analyse the validity of NS theory by quantifying
 $I_{s}$
,
 $Kn_{frac}$
,
 $Kn_{gran}$
and
 $Kn_{vel}$
. It was shown that NS theory is valid for bubbling fluidization, but the validity or breakdown of NS theory for turbulent and fast fluidization depends on the choice of criterion. Because
 $I_{s}$
includes the non-equilibrium effects of both the gradient of the hydrodynamic field and dissipative particle–particle collisions, we concluded that NS theory for discrete particles is not the main source of the uncertainty. The benchmark data in this study were generated using a CFD-DEM method, which needs the interphase drag force as an input. Further study is needed to determine if the used interphase drag force correlation can reliably capture the physics of gas–solid interactions.
Acknowledgements
We thank Professor J. A. M. Kuipers, Eindhoven University of Technology, the Netherlands, for allowing the use of his 3-D DPM code. This study was financially supported by the National Natural Science Foundation of China (91834303), Key Research Program of Frontier Science, Chinese Academy of Sciences (QYZDJ-SSW-JSC029) and the ‘Transformational Technologies for Clean Energy and Demonstration’, the Strategic Priority Research Program of the Chinese Academy of Sciences (XDA21030700).
Appendix
We also carried out CFD-DEM simulations of bubbling fluidization of Geldart A and D particles with
 $e_{n}=e_{t}=0.9$
and
 $\unicode[STIX]{x1D707}_{f}=0.3$
, where
 $e_{n}$
,
 $e_{t}$
and
 $\unicode[STIX]{x1D707}_{f}$
are the normal restitution coefficient, tangential restitution coefficient and friction coefficient of the particles, respectively.
 $I_{s}$
and
 $Kn$
were also analysed, but it should be noted that the dissipations caused by the inelastic collisions in the tangential direction and particle–particle friction were not considered in the derivation of
 $I_{s}$
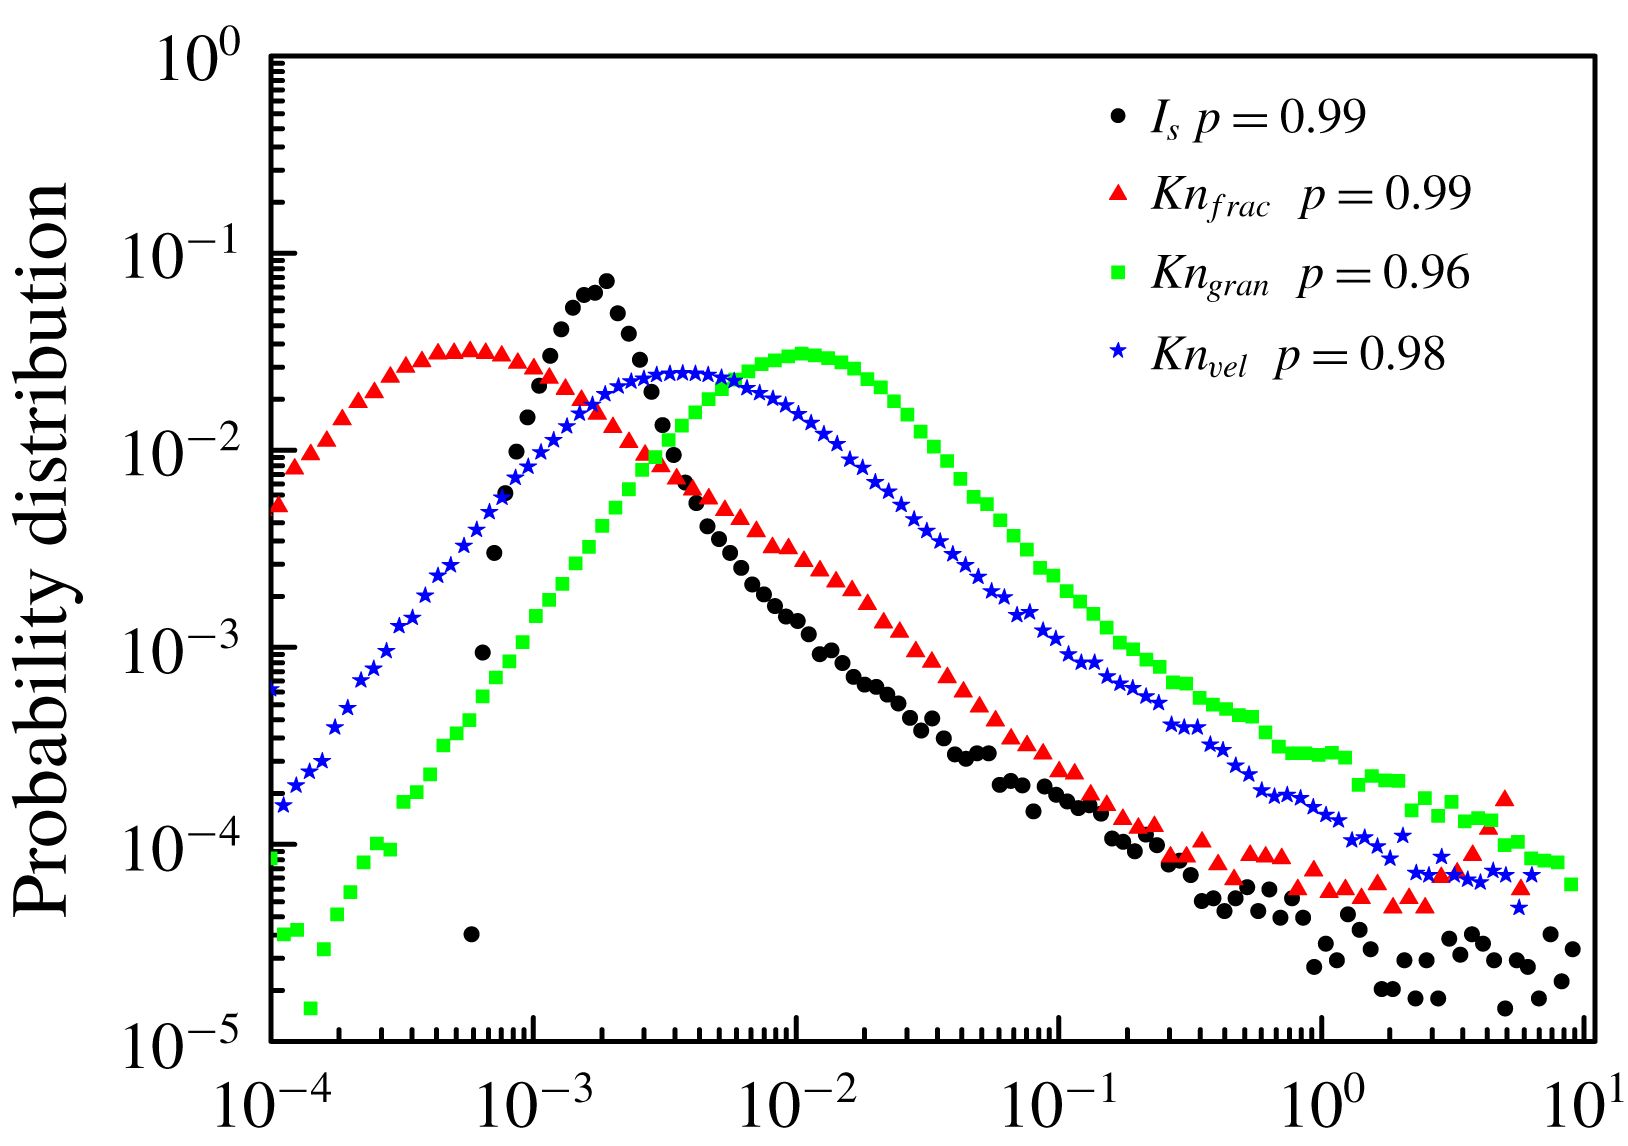
. The results for bubbling fluidization of Geldart A particles are presented in figure 4; the results for Geldart D particles were similar, and therefore are not reported. The inclusion of particle friction and inelastic tangential contact had a minor effect on the PDFs of
 $I_{s}$
and
 $Kn$
, but the overall conclusions drawn in the main text remained the same.
Probability distributions of
 $I_{s}$
,
 $Kn_{frac}$
,
 $Kn_{gran}$
and
 $Kn_{vel}$
at
 $t=7~\text{s}$
determined using realistic spheres (
 $e_{n}=e_{t}=0.9$
and
 $\unicode[STIX]{x1D707}_{f}=0.3$
) in bubbling fluidization of Geldart A particles.