1 Introduction
Understanding, modelling and controlling complex fluid flows is a central focus in many scientific, technological and industrial applications, including energy (e.g. wind, tidal and combustion), transportation (e.g. planes, trains, and automobiles), security (e.g. airborne contamination) and medicine (e.g. artificial hearts and artificial respiration). Improved models of engineering flows have the potential to dramatically improve performance in these systems through optimization and control, resulting in practical gains such as drag reduction, lift increase and mixing enhancement (Fabbiane et al. Reference Fabbiane, Semeraro, Bagheri and Henningson2014; Brunton & Noack Reference Brunton and Noack2015; Rowley & Dawson Reference Rowley and Dawson2017; Sipp & Schmid Reference Sipp and Schmid2016). Although the Navier–Stokes equations provide a detailed mathematical model, this representation may be difficult to use for engineering design, optimization and control. Instead, they are commonly discretized into a high-dimensional, nonlinear dynamical system with many degrees of freedom and multi-scale interactions. These equations are nonetheless expensive to simulate, making them unwieldy for iterative optimization or in-time control. They may also obscure the underlying physics, which often evolves on a low-dimensional attractor (Noack et al. Reference Noack, Afanasiev, Morzynski, Tadmor and Thiele2003; Holmes et al. Reference Holmes, Lumley, Berkooz and Rowley2012). The various fidelities of model description were described by Wiener (Reference Wiener1948): ‘white-box’ describes an accurate evolution equation based on first principles (e.g. Navier–Stokes discretization), ‘grey-box’ describes a low-dimensional model approximating the full state (e.g. proper orthogonal decomposition (POD)–Galerkin models) and ‘black-box’ describes input–output models that lack a connection to the full-state space (e.g. neural networks).
In the following, we outline related reduced-order models as our point of departure in § 1.1 and foreshadow proposed innovations of this study in § 1.2.
1.1 Related reduced-order models as point of departure
Reduced-order models provide low-dimensional descriptions of the underlying fluid behaviour in a compact and computationally efficient representation. There are many techniques for reduced-order modelling, ranging from physical reductions to purely data-driven methods, and nearly everything in between. Proper orthogonal decomposition (POD) (Sirovich Reference Sirovich1987; Berkooz, Holmes & Lumley Reference Berkooz, Holmes and Lumley1993; Holmes et al. Reference Holmes, Lumley, Berkooz and Rowley2012) provides a low-rank modal decomposition of fluid flow field data, extracting the most energetic modes. It is then possible to Galerkin project the Navier–Stokes equations onto these modes, resulting in an approximate, low-dimensional model in terms of mode coefficients (Noack, Morzynski & Tadmor Reference Noack, Morzynski and Tadmor2011; Carlberg, Tuminaro & Boggs Reference Carlberg, Tuminaro and Boggs2015). POD–Galerkin models are widely used, as they are interpretable, grey-box models, and it is straightforward to reconstruct the high-dimensional flow field from the low-dimensional model via POD modes. The first pioneering example of Aubry et al. (Reference Aubry, Holmes, Lumley and Stone1988) featured wall turbulence, almost three decades ago. Subsequent POD models have been developed for the transitional boundary layer (Rempfer & Fasel Reference Rempfer and Fasel1994), the mixing layer (Ukeiley et al. Reference Ukeiley, Cordier, Manceau, Delville, Bonnet and Glauser2001; Wei & Rowley Reference Wei and Rowley2009), the cylinder wake (Deane et al. Reference Deane, Kevrekidis, Karniadakis and Orszag1991; Galletti et al. Reference Galletti, Bruneau, Zannetti and Iollo2004) and the Ahmed body wake (Östh et al. Reference Östh, Krajnović, Noack, Barros and Borée2014), to name only a few.
POD–Galerkin modelling is challenging for changing domains (Bourguet, Braza & Dervieux Reference Bourguet, Braza and Dervieux2011), changing boundary conditions (Graham, Peraire & Tang Reference Graham, Peraire and Tang1999) and slow deformation of the modal basis (Babaee & Sapsis Reference Babaee and Sapsis2016). Standard Galerkin projection can also be expected to suffer from stability issues (Rempfer Reference Rempfer2000; Schlegel & Noack Reference Schlegel and Noack2015; Carlberg, Barone & Antil Reference Carlberg, Barone and Antil2017), although including energy-preserving constraints may improve the long-time stability and performance of nonlinear models (Balajewicz, Dowell & Noack Reference Balajewicz, Dowell and Noack2013; Cordier et al. Reference Cordier, Noack, Daviller, Delvile, Lehnasch, Tissot, Balajewicz and Niven2013). POD–Galerkin models tend to be valid for a narrow range of operating conditions, near those of the dataset used to generate the POD modes. Transients also pose a challenge to POD modelling. Noack et al. (Reference Noack, Afanasiev, Morzynski, Tadmor and Thiele2003) and Tadmor et al. (Reference Tadmor, Lehmann, Noack and Morzyński2010) demonstrate the ability of a low-dimensional model to reproduce nonlinear transients of the von Kàrmàn vortex shedding past a two-dimensional cylinder, provided the projection basis includes a shift mode quantifying the distortion between the linearly unstable base flow and marginally stable mean flow. These techniques have been extended to include the effect of wall actuation (Graham et al. Reference Graham, Peraire and Tang1999; Rediniotis, Ko & Kurdila Reference Rediniotis, Ko and Kurdila2002).
In addition to the physics-informed Galerkin projection, data-driven modelling approaches are prevalent in fluid dynamics (Brunton & Noack Reference Brunton and Noack2015; Rowley & Dawson Reference Rowley and Dawson2017). For example, dynamic mode decomposition (DMD) (Rowley et al. Reference Rowley, Mezić, Bagheri, Schlatter and Henningson2009; Schmid Reference Schmid2010; Kutz et al. Reference Kutz, Brunton, Brunton and Proctor2016), the eigensystem realization algorithm (ERA) (Juang & Pappa Reference Juang and Pappa1985), Koopman analysis (Mezić Reference Mezić2005, Reference Mezić2013; Tu et al. Reference Tu, Rowley, Luchtenburg, Brunton and Kutz2014; Williams, Kevrekidis & Rowley Reference Williams, Kevrekidis and Rowley2015), cluster-based reduced-order models (CROM) (Kaiser et al. Reference Kaiser, Noack, Cordier, Spohn, Segond, Abel, Daviller, Osth, Krajnovic and Niven2014), NARMAX models (Glaz, Liu & Friedmann Reference Glaz, Liu and Friedmann2010; Zhang et al. Reference Zhang, Wang, Ye and Quan2012; Billings Reference Billings2013; Semeraro et al. Reference Semeraro, Lusseyran, Pastur and Jordan2017) and network analysis (Nair & Taira Reference Nair and Taira2015) have all been used to identify dynamical systems models from fluids data, without relying on prior knowledge of the underlying Navier–Stokes equations. DMD models are readily obtained directly from data, and they provide interpretability in terms of flow structures, but the resulting models are linear, and the connection to nonlinear systems is tenuous unless DMD is enriched with nonlinear functions of the data (Williams et al. Reference Williams, Kevrekidis and Rowley2015; Kutz et al. Reference Kutz, Brunton, Brunton and Proctor2016). Neural networks have long been used for flow modelling and control (Lee et al. Reference Lee, Kim, Babcock and Goodman1997; Milano & Koumoutsakos Reference Milano and Koumoutsakos2002; Krizhevsky, Sutskever & Hinton Reference Krizhevsky, Sutskever, Hinton, Pereira, Burges, Bottou and Weinberger2012; Zhang & Duraisamy Reference Zhang and Duraisamy2015), and recently deep neural networks have been used for Reynolds averaged turbulence modelling (Ling, Kurzawski & Templeton Reference Ling, Kurzawski and Templeton2016; Kutz Reference Kutz2017). However, many machine learning methods may be prone to overfitting, have limited interpretability and make it difficult to incorporate known physical constraints. Parsimony has thus become an overarching goal when using machine learning to model nonlinear dynamics. In the seminal work of Bongard & Lipson (Reference Bongard and Lipson2007) and Schmidt & Lipson (Reference Schmidt and Lipson2009) governing dynamics and conservation laws are discovered using genetic programming along with a Pareto analysis to balance model accuracy and complexity, preventing overfitting.
Recently, Brunton, Proctor & Kutz (Reference Brunton, Proctor and Kutz2016b ) introduced the sparse identification of nonlinear dynamics (SINDy), which identifies parsimonious nonlinear models from data. SINDy follows the principle of Ockham’s razor, resting on the assumption that there are only a few important terms that govern the dynamics of a system, so that the equations are sparse in the space of possible functions. Sparse regression is then used to efficiently determine the fewest terms in the dynamics required to accurately represent the data, preventing overfitting. Because SINDy is based on linear algebra (i.e. the nonlinear dynamics is represented as a linear combination of candidate nonlinear functions), the method is readily extended to incorporate known physical constraints (Loiseau & Brunton Reference Loiseau and Brunton2018). In general, it is possible to obtain nonlinear models using genetic programming or SINDy on POD or DMD mode coefficients, which make these methods grey box, having a transformation from the model back to the high-dimensional, interpretable state space. However, models developed on POD/DMD mode coefficients may still suffer from fundamental challenges of traditional POD–Galerkin models, such as capturing changing boundary conditions, moving geometry and varying operating condition.
1.2 Contribution of this work
In this work, we introduce a new grey-box modelling procedure that yields interpretable nonlinear models from measurement data. The method is applied to the well-investigated two-dimensional transient flow past a circular cylinder with slow change of the base flow and varying coherent structures (Tadmor et al. Reference Tadmor, Lehmann, Noack, Cordier, Delville, Bonnet and Morzyński2011). In particular, we develop nonlinear models only from lift measurements that accurately capture steady-state and transient flow behaviour. First, a feature vector is constructed from the lift signal, including a time-delayed value. This lifting shall avoid false neighbours, i.e. neighbouring states with significantly different temporal evolution. Second, a sparse dynamical model is identified in this feature space. For the following steps, full-state measurement data are assumed to be available. Third, a local linear mapping from feature vector to velocity field is constructed using a K-nearest neighbours (KNN) approach. This mapping provides significantly more accurate flow reconstruction, as compared to a POD–Galerkin model of the same order. Technically, we mitigate the significant challenges of using an ‘elliptic’ Galerkin modelling approach with ‘hyperbolic’ dynamics: the global modes connect all locations in all directions instantaneously while coherent structures are convected with the flow (Noack Reference Noack2016).
Furthermore, it is also possible to construct a generalized set of modes that are most dynamically correlated with the given terms in the identified model. The resulting modal decomposition, relying on (quadratic) stochastic estimation (Adrian & Moin Reference Adrian and Moin1988; Bonnet et al. Reference Bonnet, Cole, Delville, Glauser and Ukeiley1994; Murray & Ukeiley Reference Murray and Ukeiley2007; Tu et al. Reference Tu, Griffin, Hart, Rowley, Cattafesta and Ukeiley2013), reveals coherent structures associated with given nonlinear interaction terms. With the associated full-state data and generalized modes, it is possible to reconstruct the full-state associated with a given low-dimensional prediction in the reduced-order grey-box model.
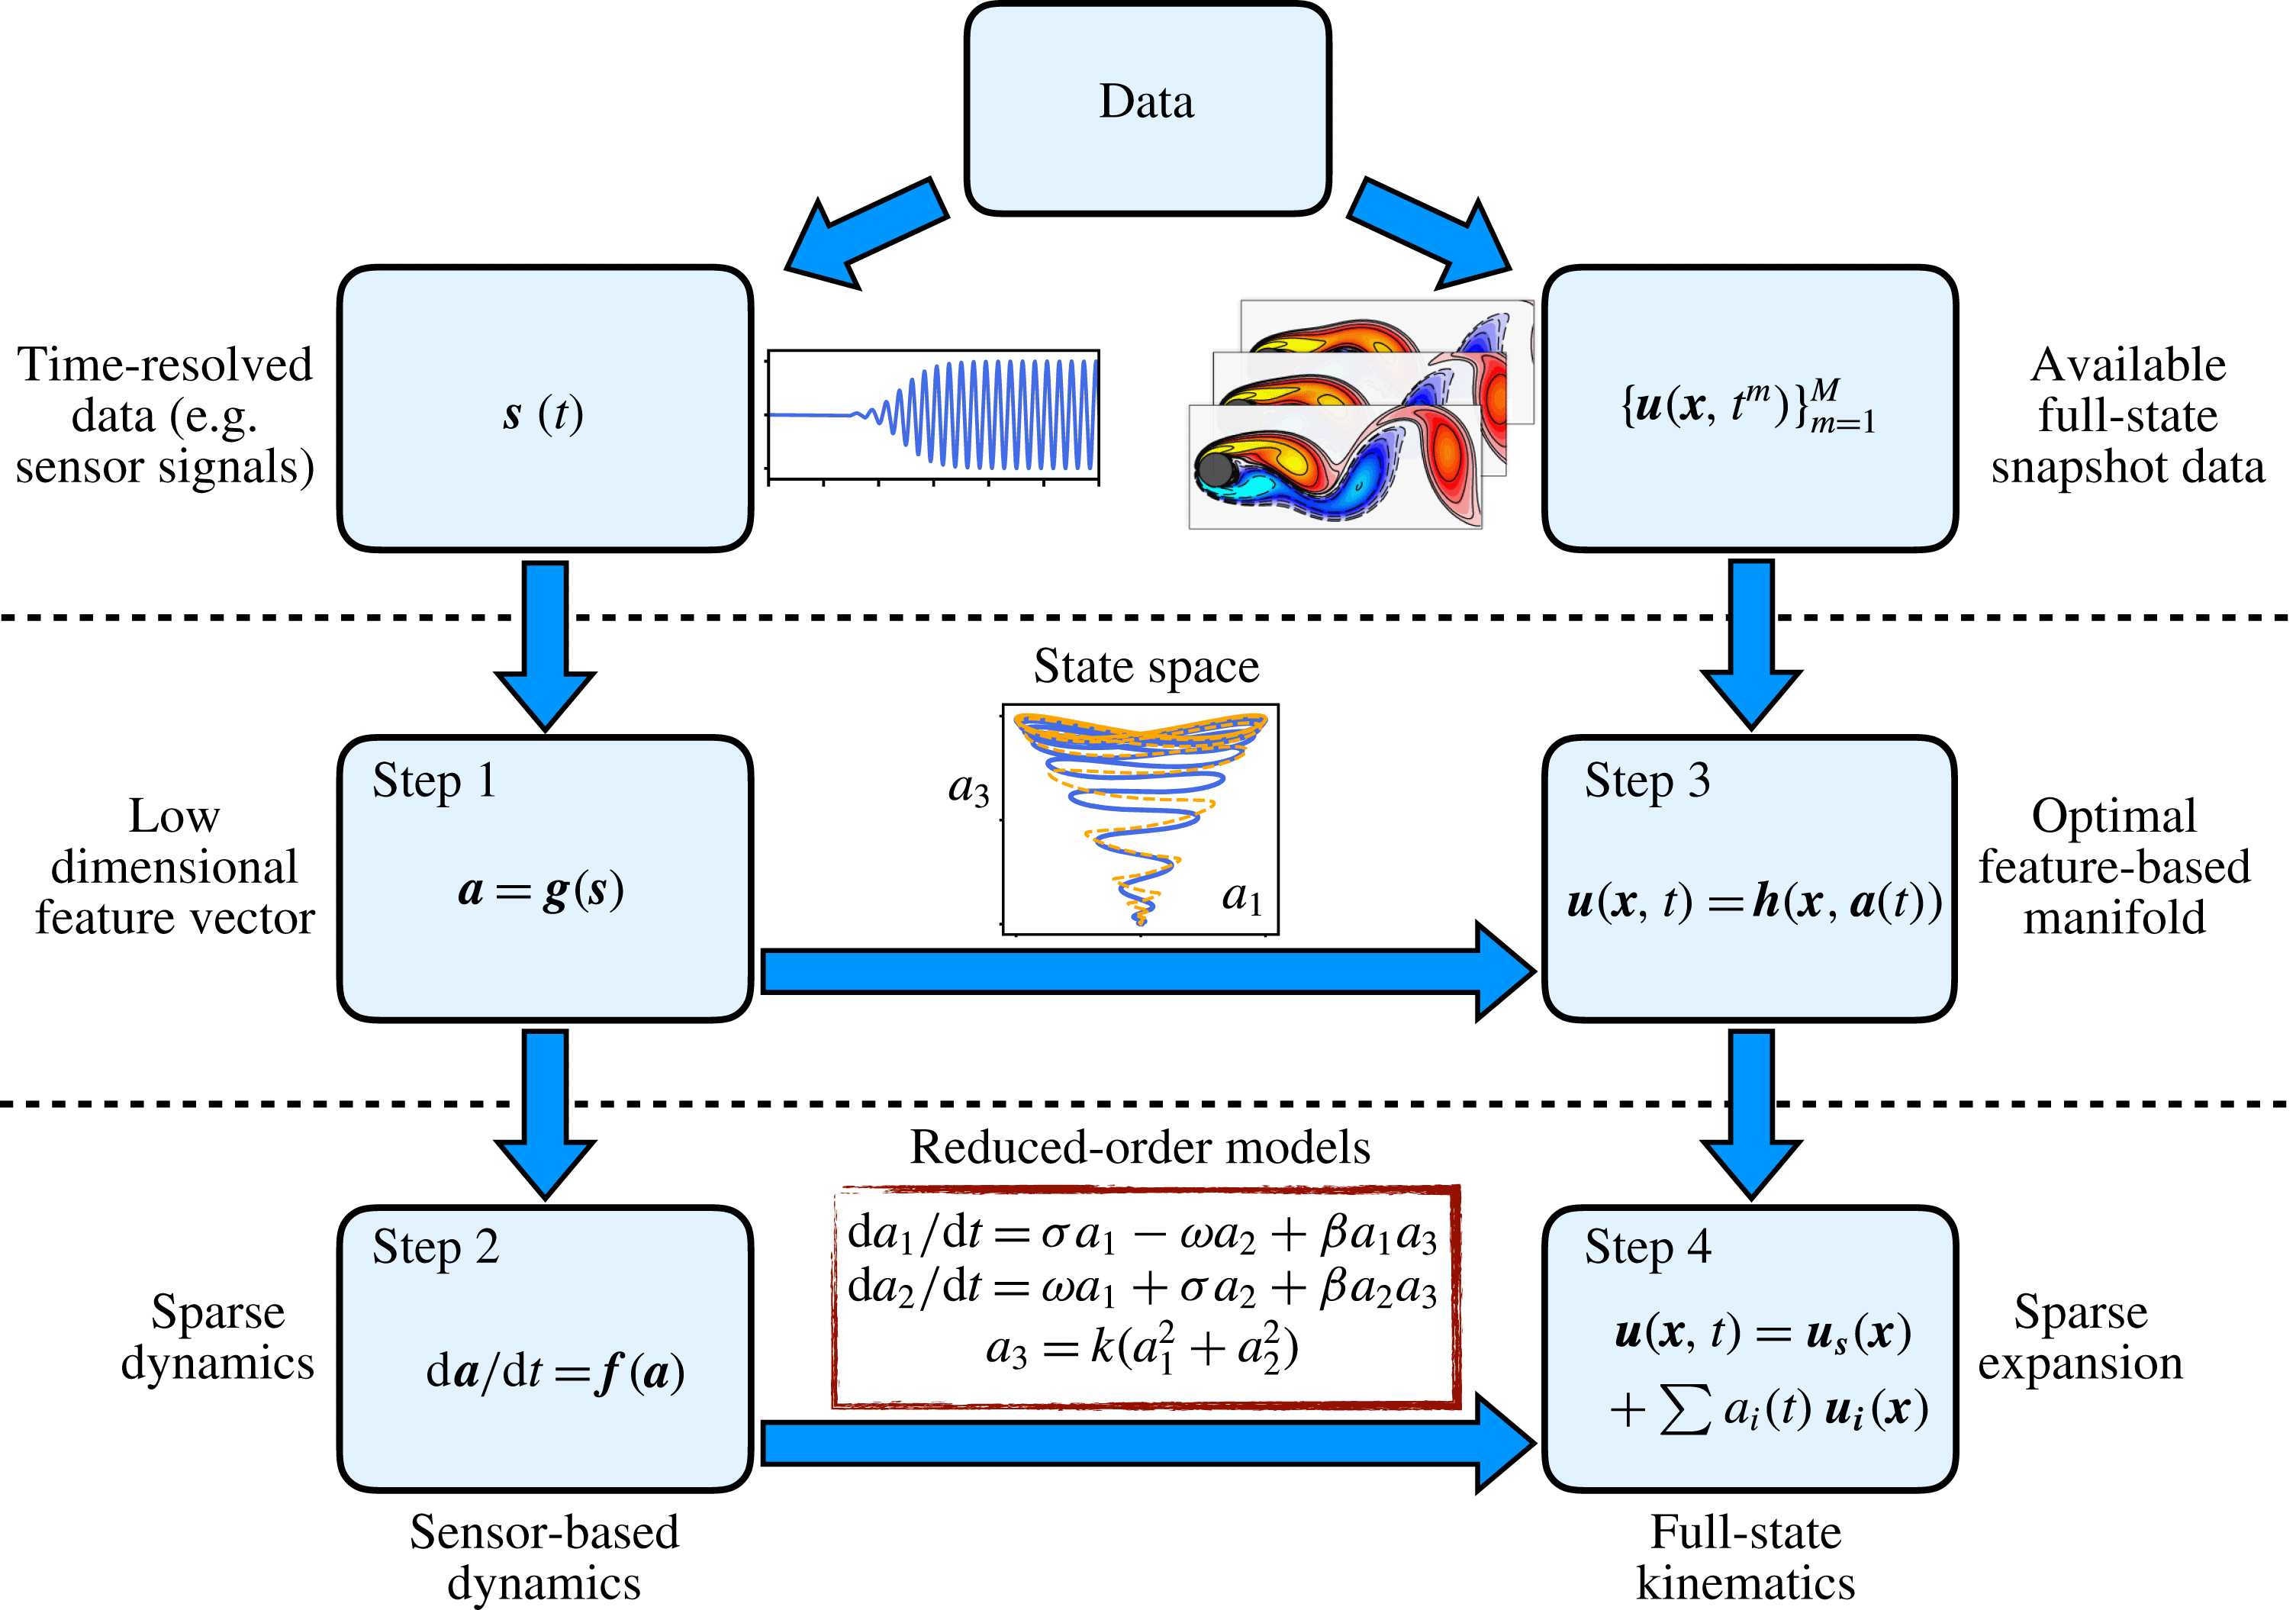
To summarize, the resulting grey-box modelling procedure has the following beneficial features: (i) it captures nonlinear physics, (ii) it is based on a simple, non-invasive computational algorithm, (iii) the resulting model is interpretable in terms of nonlinear interaction physics and generalized modes (optional with full-state data) and (iv) modelling feature vectors is more robust to mode deformation, moving geometry and varying operating condition. This procedure is shown schematically in figure 1.
Schematic overview of the proposed sparse modelling procedure. A sparse dynamical system (Brunton et al.
Reference Brunton, Proctor and Kutz2016b
) is identified based on features obtained from sensor signals
 $\boldsymbol{s}$
, and the full state
 $\boldsymbol{u}$
may also be estimated with the availability of particle image velocimetry snapshots (optional).

The manuscript is organized as follows: § 2 provides an overview of the flow configuration considered in this work, namely the incompressible, two-dimensional flow past a circular cylinder at
 $Re=100$
. Section 3 describes the proposed grey-box modelling procedure, including modelling in feature space and obtaining a generalized modal expansion if full-state data are available. In § 4, numerical results for the grey-box modelling procedure are presented and analysed for the cylinder flow. Section 5 provides some leads for application of the present approach to higher-dimensional systems. It also highlights some connections with previous works. Finally, § 6 summarizes our key findings and provides the reader with possible future directions to extend this work.
2 Flow configuration
The flow configuration considered in the present work is the two-dimensional incompressible viscous flow past a circular cylinder at
 $Re=100$
, based on the free-stream velocity
 $U_{\infty }$
, the cylinder diameter
 $D$
and the kinematic viscosity
 $\unicode[STIX]{x1D708}$
. This Reynolds number is well above the critical Reynolds number (
 $Re_{c}=48$
) for the onset of the two-dimensional vortex shedding (Zebib Reference Zebib1987; Schumm, Eberhard & Monkewitz Reference Schumm, Eberhard and Monkewitz1994) and below the critical Reynolds number (
 $Re_{c}=188$
) for the onset of three-dimensional instabilities (Zhang et al.
Reference Zhang, Fey, Noack, König and Eckelmann1995; Barkley & Henderson Reference Barkley and Henderson1996). In the fluid dynamics community, a large body of literature exists in which this particular set-up has been chosen to illustrate modal decomposition (Bagheri Reference Bagheri2013) and model identification techniques (Noack et al.
Reference Noack, Afanasiev, Morzynski, Tadmor and Thiele2003; Sengupta et al.
Reference Sengupta, Haider, Parvathi and Pallavi2015; Brunton et al.
Reference Brunton, Proctor and Kutz2016b
; Rowley & Dawson Reference Rowley and Dawson2017). This set-up is thus a particularly compelling test case to illustrate our model identification strategy, as well as to draw connections and quantify its performance against other well-established techniques.
The dynamics of the flow is governed by the incompressible Navier–Stokes equations
 $$\begin{eqnarray}\left.\begin{array}{@{}c@{}}{\displaystyle \frac{\unicode[STIX]{x2202}\boldsymbol{u}}{\unicode[STIX]{x2202}t}}+(\boldsymbol{u}\boldsymbol{\cdot }\unicode[STIX]{x1D735})\boldsymbol{u}=-\unicode[STIX]{x1D735}p+{\displaystyle \frac{1}{Re}}\unicode[STIX]{x1D6FB}^{2}\boldsymbol{u}\\ \unicode[STIX]{x1D735}\boldsymbol{\cdot }\boldsymbol{u}=0,\end{array}\right\}\end{eqnarray}$$
where
 $\boldsymbol{u}=(u,v)^{\text{T}}$
and
 $p$
are the velocity and pressure fields, respectively. The centre of the cylinder has been chosen as the origin of the reference frame
 $\boldsymbol{x}=(x,y)$
, where
 $x$
denotes the streamwise coordinate and
 $y$
denotes the spanwise coordinate. This study considers the same computational domain as in Noack et al. (Reference Noack, Afanasiev, Morzynski, Tadmor and Thiele2003), extending from
 $x=-5$
to
 $x=15$
in the streamwise direction, and from
 $y=-5$
to
 $y=5$
in the spanwise direction. A uniform velocity profile is prescribed at the inflow, a classical stress-free boundary condition is used at the outflow and free-slip boundary conditions are used on the lateral boundaries of the computational domain. Based on the spectral element solver Nek 5000 (Fischer, Lottes & Kerkemeir Reference Fischer, Lottes and Kerkemeir2008), the domain is discretized by 1832 seventh-order spectral elements. Finally, the time integration of the diffusive terms relies on a backward differentiation of order 3 (BDF3), while the convective terms are advanced in time based on a third-order accurate extrapolation.
Two out of the three direct numerical simulations used in this work have been initialized with the following initial condition
 $$\begin{eqnarray}\boldsymbol{u}(\boldsymbol{x},0)=\boldsymbol{u}_{s}(\boldsymbol{x})+0.001\unicode[STIX]{x1D750}(\boldsymbol{x}),\end{eqnarray}$$
where
 $\boldsymbol{u}_{s}(\boldsymbol{x})$
is the linearly unstable steady solution of the Navier–Stokes equations and
 $\unicode[STIX]{x1D750}(\boldsymbol{x})$
is a zero-mean and unit-variance random white-noise velocity field. Each simulation is run for 150 convective time units, providing
 $M=1200$
equidistantly sampled velocity snapshots
 $\boldsymbol{u}^{(m)}(\boldsymbol{x})=\boldsymbol{u}(\boldsymbol{x},t_{m})$
,
 $m=1,\ldots ,M$
, and synchronous measurements of the lift and drag coefficients,
 $C_{L}(t_{m})$
and
 $C_{D}(t_{m})$
. This timespan covers the entire unforced transient phase, from the steady solution to the fully developed von Kármán vortex street. Note that only one of these two simulations is used to identify the low-order model in § 4.1, while the second one serves only cross-validation purposes.
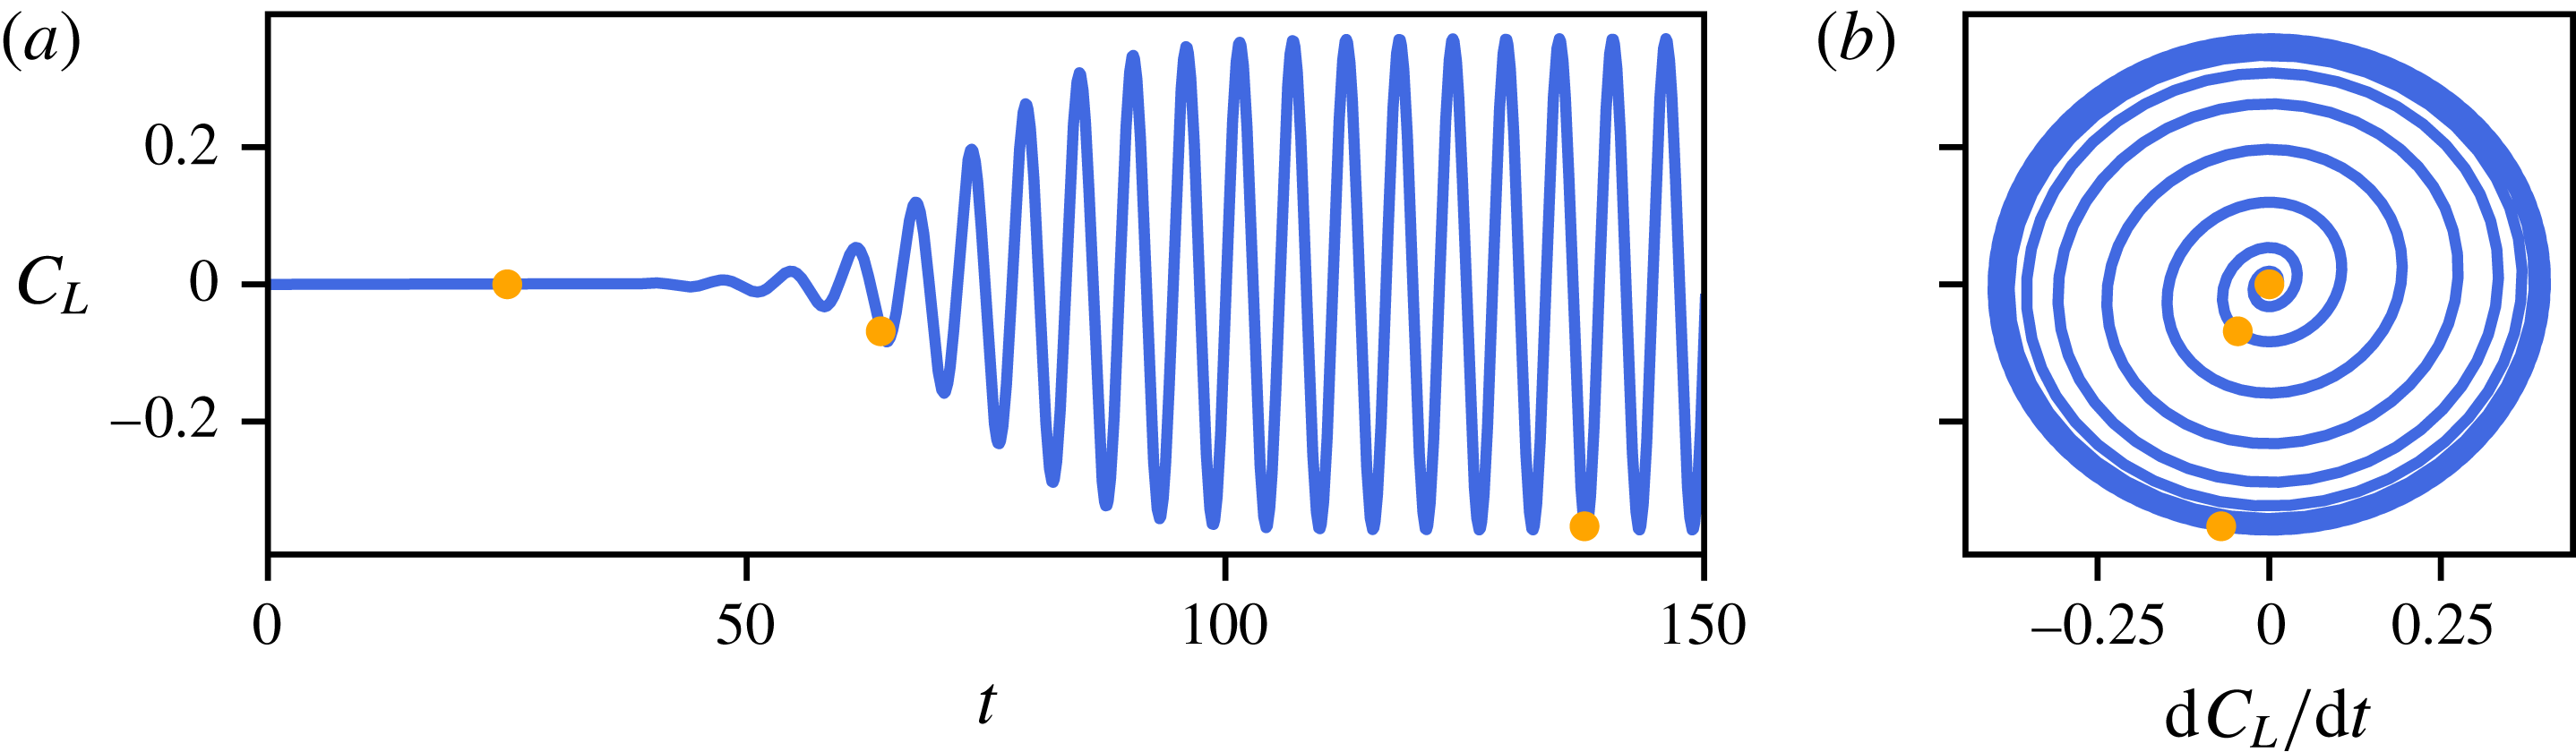
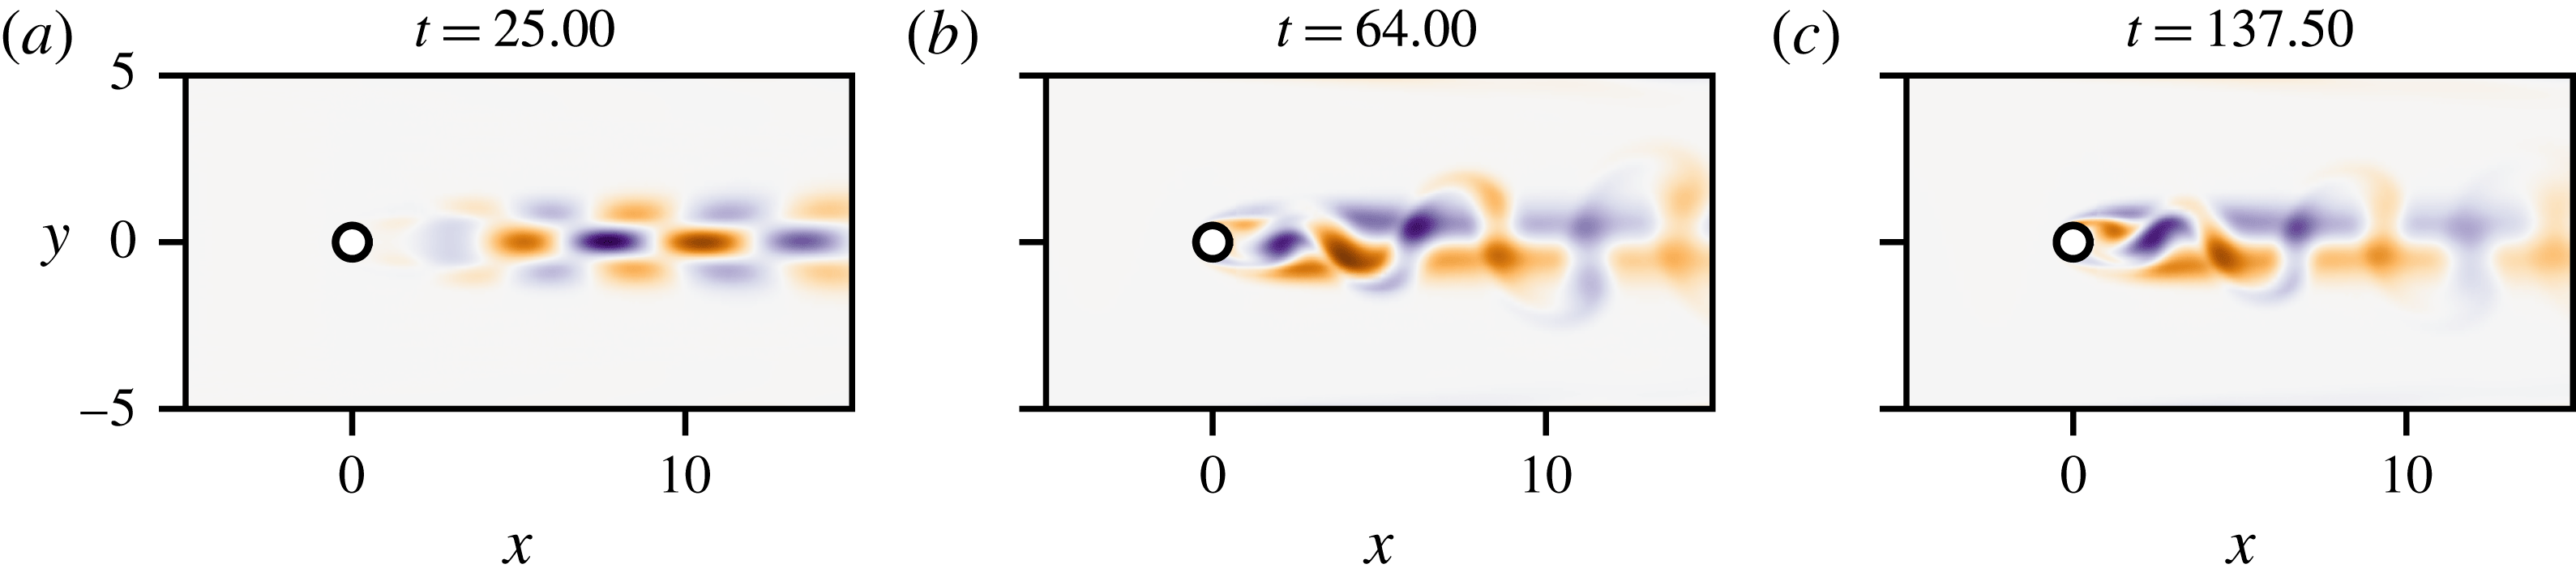
Figure 2 depicts a typical evolution of the lift coefficient
 $C_{L}$
, while figure 3 shows snapshots of the vorticity field at different instants of time. For
 $t\leqslant 50$
, the flow is governed by linear dynamics. Consequently, the vorticity field of the perturbation
 $\boldsymbol{v}(\boldsymbol{x},t)=\boldsymbol{u}(\boldsymbol{x},t)-\boldsymbol{u}_{s}(\boldsymbol{x})$
, shown in figure 3(a), can be well approximated by the leading instability mode. For
 $50\leqslant t\leqslant 80$
, the perturbation grows to an extent that nonlinear effects cause the perturbation to distort. Eventually, for
 $t\geqslant 80$
, the flow settles onto a periodic limit cycle corresponding to the classical von Kàrmàn vortex street. Given the evolution of the lift coefficient depicted in figure 2 and the associated snapshots shown in figure 3, the aim of the present work is to propose a new reduced-order modelling strategy able to accurately reproduce such dynamics and flow structures. Note that this set-up mimics an experiment in Hosseini, Noack & Martinuzzi (Reference Hosseini, Noack and Martinuzzi2016) where the pressure difference between the top and bottom side of a cylinder is a surrogate quantity for the lift. This difference had been recorded in a time-resolved manner while non-time-resolved particle image velocimetry (PIV) flow snapshots were taken.
(a) Evolution of the lift coefficient
 $C_{L}$
as a function of time for the two-dimensional cylinder flow at
 $Re=100$
. (b) Trajectory of the system in the phase plane (
 $C_{L}$
,
 $\text{d}C_{L}/\text{d}t$
). In both panels, the orange dots indicate the instants of time for which the corresponding vorticity field is shown in figure 3.

Snapshots of the vorticity field at the different time instants highlighted in figure 2. Note that the vorticity field of the linearly unstable base flow,
 $\boldsymbol{u}_{s}(\boldsymbol{x})$
, has been subtracted in order to highlight the vorticity induced by the perturbation.

3 Sparse sensor-based modelling
Here, we discuss the core mathematical and algorithmic framework used to identify nonlinear reduced-order models and build a full-state estimator from data. The identification procedure relies on the sparse identification of nonlinear dynamics (SINDy) method (Brunton et al. Reference Brunton, Proctor and Kutz2016b ) briefly summarized in § 3.2. As a second step, we introduce the reader to two different full-state estimators in § 3.3 based on stochastic estimation and nearest neighbours algorithms.
3.1 From sensor signals to feature space
Performing direct numerical simulations allows one to gather space–time-resolved data at every single point within the computational domain considered. In contrast, experimentalists typically have access only to a limited number of time-resolved sensor measurements
 $\boldsymbol{s}$
. The aim of the present work is thus to illustrate how one can leverage recent advances in system identification and machine learning to construct reduced-order models directly from these limited sensor measurements. For that purpose, experimental conditions are mimicked with direct numerical simulations and we consider a single sensor measurement given by
 $$\begin{eqnarray}s(t):=C_{L}(t),\end{eqnarray}$$
where
 $C_{L}$
is the lift coefficient. Note that in general
 $\boldsymbol{s}$
may be a vector of measurements, including for instance the lift and drag coefficients, pressure measurements on an immersed body or point velocity field measurements at selected locations. However, in the present study, the lift coefficient is sufficient to characterize the flow. Given the sensor measurements
 $\boldsymbol{s}$
, our aim is to identify a low-order model that allows us to predict the evolution of our system. Raw signals may unfortunately be ill behaved for system identification purposes and may need to be augmented, or lifted, to include functions of the sensor measurements. We consider the augmented state
 $\boldsymbol{a}$
to be a feature vector given by
 $$\begin{eqnarray}\boldsymbol{a}=\boldsymbol{g}(\boldsymbol{s}).\end{eqnarray}$$
There are many choices for the mapping
 $\boldsymbol{g}$
to enrich the sensor measurements and improve models. If the sensors are sufficient to define the state of the system, then
 $\boldsymbol{g}$
may be the identity map. If the sensors consist of high-dimensional snapshots, then
 $\boldsymbol{g}$
may extract POD mode coefficients. It may also be possible to augment the measurements with delay embedding (Takens Reference Takens1981; Juang & Pappa Reference Juang and Pappa1985; Brunton et al.
Reference Brunton, Brunton, Proctor, Kaiser and Kutz2017) in order to obtain a sufficiently high-dimensional feature vector
 $\boldsymbol{a}$
as to fully characterize the dynamics of the system. More generally, choosing a good transformation
 $\boldsymbol{g}$
is an important open problem, with connections to representation theory and the Koopman operator perspective on dynamical systems (Mezić Reference Mezić2005, Reference Mezić2013; Williams et al.
Reference Williams, Kevrekidis and Rowley2015; Arbabi & Mezić Reference Arbabi and Mezić2016; Brunton et al.
Reference Brunton, Brunton, Proctor and Kutz2016a
, Reference Brunton, Brunton, Proctor, Kaiser and Kutz2017). In the present study, we choose
 $\boldsymbol{g}$
to augment the sensor measurement of the lift coefficient with its time derivative, along with a proper scaling:
 $$\begin{eqnarray}\left.\begin{array}{@{}c@{}}a_{1}(t):=s(t),\\ a_{2}(t):=\displaystyle {\displaystyle \frac{1}{\unicode[STIX]{x1D714}_{\infty }}}\frac{\text{d}s}{\text{d}t}(t),\end{array}\right\}\end{eqnarray}$$
where
 $\unicode[STIX]{x1D714}_{\infty }$
is the post-transient angular shedding frequency estimated from the power spectral density of the lift signal depicted in figure 2. This choice has been guided by physical considerations: the lift can be measured and allows for the characterization of the state of the flow. It is also well known that the flow around a two-dimensional cylinder at
 $Re=100$
only necessitates three degrees of freedom (Noack et al.
Reference Noack, Afanasiev, Morzynski, Tadmor and Thiele2003), or features, to be approximately described: the shedding amplitude, shedding phase and the degree of base flow deformation. In this work, we will show that the degree of base flow deformation can be described by the drag coefficient, which is then modelled as an algebraic equation of the feature vector
 $\boldsymbol{a}$
. In comparison, in Hosseini et al. (Reference Hosseini, Noack and Martinuzzi2016), the analogues of
 $a_{1}$
and
 $a_{2}$
were defined as the cosine and sine Morlet transforms of the pressure difference history. Please refer to § 5.1 for a discussion on appropriate sensor selection and for the definition of the mapping function
 $\boldsymbol{g}$
in flows where the number of degrees of freedom required to model the dynamics of the system may not be known a priori.
3.2 Sparse identification of nonlinear dynamics (SINDy)
Identifying reduced-order models from data is a central challenge in mathematical physics, with a rich history of developments in fluid dynamics. The form of the dynamics is typically either constrained via prior knowledge, as in the Galerkin projection, or a particular model structure is chosen heuristically, and parameters are optimized to match the data. Simultaneous identification of the model structure and parameters from data is considerably more challenging, as there are combinatorially many possible model structures. The sparse identification of nonlinear dynamics (SINDy) architecture (Brunton et al.
Reference Brunton, Proctor and Kutz2016b
) bypasses the intractable combinatorial search through all possible model structures, leveraging the fact that many systems may be modelled by dynamics
 $\boldsymbol{f}$
that is sparse in the space of possible right-hand side functions:
 $$\begin{eqnarray}\displaystyle \frac{\text{d}\boldsymbol{a}}{\text{d}t}=\boldsymbol{f}(\boldsymbol{a}),\end{eqnarray}$$
where
 $\boldsymbol{a}$
is the same state vector as in § 3.1. It is then possible to solve for the relevant terms that are active in the dynamics using either a convex
 $\ell _{1}$
-regularized regression (Tibshirani Reference Tibshirani1996) or a sequentially thresholded least-squares method (Brunton et al.
Reference Brunton, Proctor and Kutz2016b
). Both algorithms penalize the number of terms in the dynamics and scale favourably to large problems.
First, time series data are collected and formed into a data matrix:
 $$\begin{eqnarray}\unicode[STIX]{x1D63C}=\left[\begin{array}{@{}cc@{}}\boldsymbol{a}(t_{1}) & \boldsymbol{a}(t_{2})\cdots \boldsymbol{a}(t_{M})\end{array}\right]^{\text{T}}\end{eqnarray}$$
where ‘T’ denotes the matrix transpose. A similar matrix of derivatives is formed:
 $$\begin{eqnarray}\dot{\unicode[STIX]{x1D63C}}=\left[\begin{array}{@{}cccc@{}}\displaystyle \frac{\text{d}\boldsymbol{a}}{\text{d}t}(t_{1}) & \displaystyle \frac{\text{d}\boldsymbol{a}}{\text{d}t}(t_{2}) & \cdots \, & \displaystyle \frac{\text{d}\boldsymbol{a}}{\text{d}t}(t_{M})\end{array}\right]^{\text{T}}.\end{eqnarray}$$
In practice, this may be computed directly from the data in
 $\unicode[STIX]{x1D63C}$
. However, for noisy data, the total-variation regularized derivative (Chartrand Reference Chartrand2011) tends to provide numerically robust derivatives. Based on the data in
 $\unicode[STIX]{x1D63C}$
, a library of candidate nonlinear functions
 $\unicode[STIX]{x1D723}(\unicode[STIX]{x1D63C})$
is constructed:
 $$\begin{eqnarray}\displaystyle \unicode[STIX]{x1D723}(\unicode[STIX]{x1D63C})=\left[\begin{array}{@{}cccccccc@{}}\mathbf{1} & \unicode[STIX]{x1D63C} & P_{2}(\unicode[STIX]{x1D63C}) & \cdots \, & P_{d}(\unicode[STIX]{x1D63C}) & \cdots \, & \sin (\unicode[STIX]{x1D63C}) & \cdots \end{array}\right]. & & \displaystyle\end{eqnarray}$$
Here,
 $P_{d}(\unicode[STIX]{x1D63C})$
denotes a matrix with column vectors given by all possible time series of
 $d$
th degree polynomials in the state
 $\boldsymbol{a}$
. Any basis functions may be used to generate the library
 $\unicode[STIX]{x1D723}$
, although polynomials work well for fluids. The dynamical system in equation (3.4) may now be represented in terms of the data matrices in equations (3.6) and (3.7) as
 $$\begin{eqnarray}\displaystyle \dot{\unicode[STIX]{x1D63C}}=\unicode[STIX]{x1D723}(\unicode[STIX]{x1D63C})\unicode[STIX]{x1D729}. & & \displaystyle\end{eqnarray}$$
Each column
 $\unicode[STIX]{x1D729}_{k}$
in
 $\unicode[STIX]{x1D729}$
is a vector of coefficients determining the active terms in the
 $k$
th row equation in equation (3.4). A parsimonious model will provide an accurate model fit in equation (3.8) with as few terms as possible in
 $\unicode[STIX]{x1D729}$
. Such a model may be identified using a convex
 $\ell _{1}$
-regularized sparse regression:
 $$\begin{eqnarray}\displaystyle \unicode[STIX]{x1D729}_{k}=\text{argmin}_{\unicode[STIX]{x1D729}_{k}^{\prime }}\Vert \dot{\unicode[STIX]{x1D63C}}_{k}-\unicode[STIX]{x1D723}(\unicode[STIX]{x1D63C})\unicode[STIX]{x1D729}_{k}^{\prime }\Vert _{2}+\unicode[STIX]{x1D706}\Vert \unicode[STIX]{x1D729}_{k}^{\prime }\Vert _{1}. & & \displaystyle\end{eqnarray}$$
Here,
 $\dot{\unicode[STIX]{x1D63C}}_{k}$
is the
 $k$
th column of
 $\dot{\unicode[STIX]{x1D63C}}$
. Sparse regression, such as the LASSO (Tibshirani Reference Tibshirani1996) or the sequential thresholded least-squares algorithm used in SINDy, improves the numerical robustness of this identification for noisy overdetermined problems, in contrast to earlier methods (Wang et al.
Reference Wang, Yang, Lai, Kovanis and Grebogi2011) that used compressed sensing (Candès Reference Candès2006; Donoho Reference Donoho2006). Once identified, the sparse vectors
 $\unicode[STIX]{x1D729}_{k}$
may be synthesized into a nonlinear dynamical system model:
 $$\begin{eqnarray}\displaystyle \frac{\text{d}a_{k}}{\text{d}t}=\unicode[STIX]{x1D723}(\boldsymbol{a})\unicode[STIX]{x1D729}_{k}, & & \displaystyle\end{eqnarray}$$
where
 $a_{k}$
is the
 $k$
th element of
 $\boldsymbol{a}$
and
 $\unicode[STIX]{x1D723}(\boldsymbol{a})$
is a row vector of symbolic functions of
 $\boldsymbol{a}$
, as opposed to the data matrix
 $\unicode[STIX]{x1D723}(\unicode[STIX]{x1D63C})$
. Identifying the most parsimonious nonlinear model by applying sparse regression in the library
 $\unicode[STIX]{x1D723}$
is a convex procedure. The alternative approach, which involves regression onto every possible sparse nonlinear structure, constitutes an intractable brute-force procedure. SINDy thus bypasses this combinatorial search with modern convex optimization and machine learning. The SINDy algorithm is closely related to NARMAX models (Billings Reference Billings2013) and fast function extraction (FFX) (McConaghy Reference McConaghy2011).
A major benefit of the SINDy architecture is its ability to identify parsimonious models that contain only the required nonlinear terms, resulting in interpretable models that avoid overfitting. In the optimization above, the sparsifying parameter
 $\unicode[STIX]{x1D706}$
may be varied from
 $\unicode[STIX]{x1D706}=0$
(i.e. least squares) to
 $\unicode[STIX]{x1D706}\rightarrow \infty$
(i.e. trivial dynamics
 $\text{d}\boldsymbol{a}/\text{d}t=\mathbf{0}$
), sweeping out a Pareto front. To identify the most parsimonious model that best balances model complexity with accuracy, Mangan et al. (Reference Mangan, Kutz, Brunton and Proctor2017) proposed an efficient methodology to rank candidate models on the Pareto front using the Akaike information criterion (AIC) (Akaike Reference Akaike1974) or the Bayes information criterion (BIC) (Schwarz et al.
Reference Schwarz1978).
The embedding of nonlinear dynamics in terms of a linear regression problem in (3.9) makes the SINDy method highly extensible. Recent extensions to SINDy enable the identification of nonlinear differential equations with rational function nonlinearities by reformulating the problem as an implicit differential equation and solving for the active terms by finding the sparsest vector in the null space of an augmented library containing functions of the state and derivative terms (Mangan et al. Reference Mangan, Brunton, Proctor and Kutz2016). SINDy has also been generalized to identify partial differential equations from data (Rudy et al. Reference Rudy, Brunton, Proctor and Kutz2017; Schaeffer Reference Schaeffer2017), to include integral terms (Schaeffer & McCalla Reference Schaeffer and McCalla2017), and it has been extended to include inputs and control (Brunton, Proctor & Kutz Reference Brunton, Proctor and Kutz2016c ; Kaiser, Kutz & Brunton Reference Kaiser, Kutz and Brunton2017).
3.3 Full-state estimation
The proposed methodology enables the identification of a low-order model that reproduces the system dynamics recorded by a few sensors. Although it may provide useful insights into the physics, it does not allow for a straightforward full-state estimation of the system considered. To accommodate this estimation, one needs to define a function
 $$\begin{eqnarray}\boldsymbol{h}(\boldsymbol{x},\boldsymbol{a}(t))\approx \boldsymbol{u}(\boldsymbol{x},t)\end{eqnarray}$$
mapping the state of the system from the low-dimensional feature space to the high-dimensional physical space. In the most general case,
 $\boldsymbol{h}$
is a nonlinear mapping function. Note, however, that
 $\boldsymbol{h}(\boldsymbol{x},\mathbf{0})$
physically corresponds to the reference state
 $\boldsymbol{u}_{s}(\boldsymbol{x})$
at
 $\boldsymbol{a}=0$
. While this reference state is classically chosen as the mean flow, in the present work, it is chosen as the linearly unstable steady solution
 $\boldsymbol{u}_{s}(\boldsymbol{x})$
of the Navier–Stokes equations. In the following, two different strategies to approximate
 $\boldsymbol{h}(\boldsymbol{x},\boldsymbol{a})$
from data will be presented.
3.3.1 Local linear mapping
Let us consider, for the sake of simplicity and without loss of generality, the feature vector
 $\boldsymbol{a}=\left[\begin{array}{@{}cc@{}}a_{1} & a_{2}\end{array}\right]^{\text{T}}$
. Given different transient evolutions of
 $\boldsymbol{a}(t)$
, and having stored the associated velocity field snapshots, the nonlinear mapping
 $\boldsymbol{h}(\boldsymbol{x},\boldsymbol{a}(t))\approx \boldsymbol{u}(\boldsymbol{x},t)$
can be approximated by a local linear mapping. If non-time-resolved snapshots are available, then only the corresponding synchronous instances of
 $\boldsymbol{a}$
are considered. In the rest of this work,
 $\boldsymbol{a}^{\bullet }(t)$
will denote time evolution of the feature vector obtained from a direct numerical simulation, while
 $\boldsymbol{a}^{\circ }(t)$
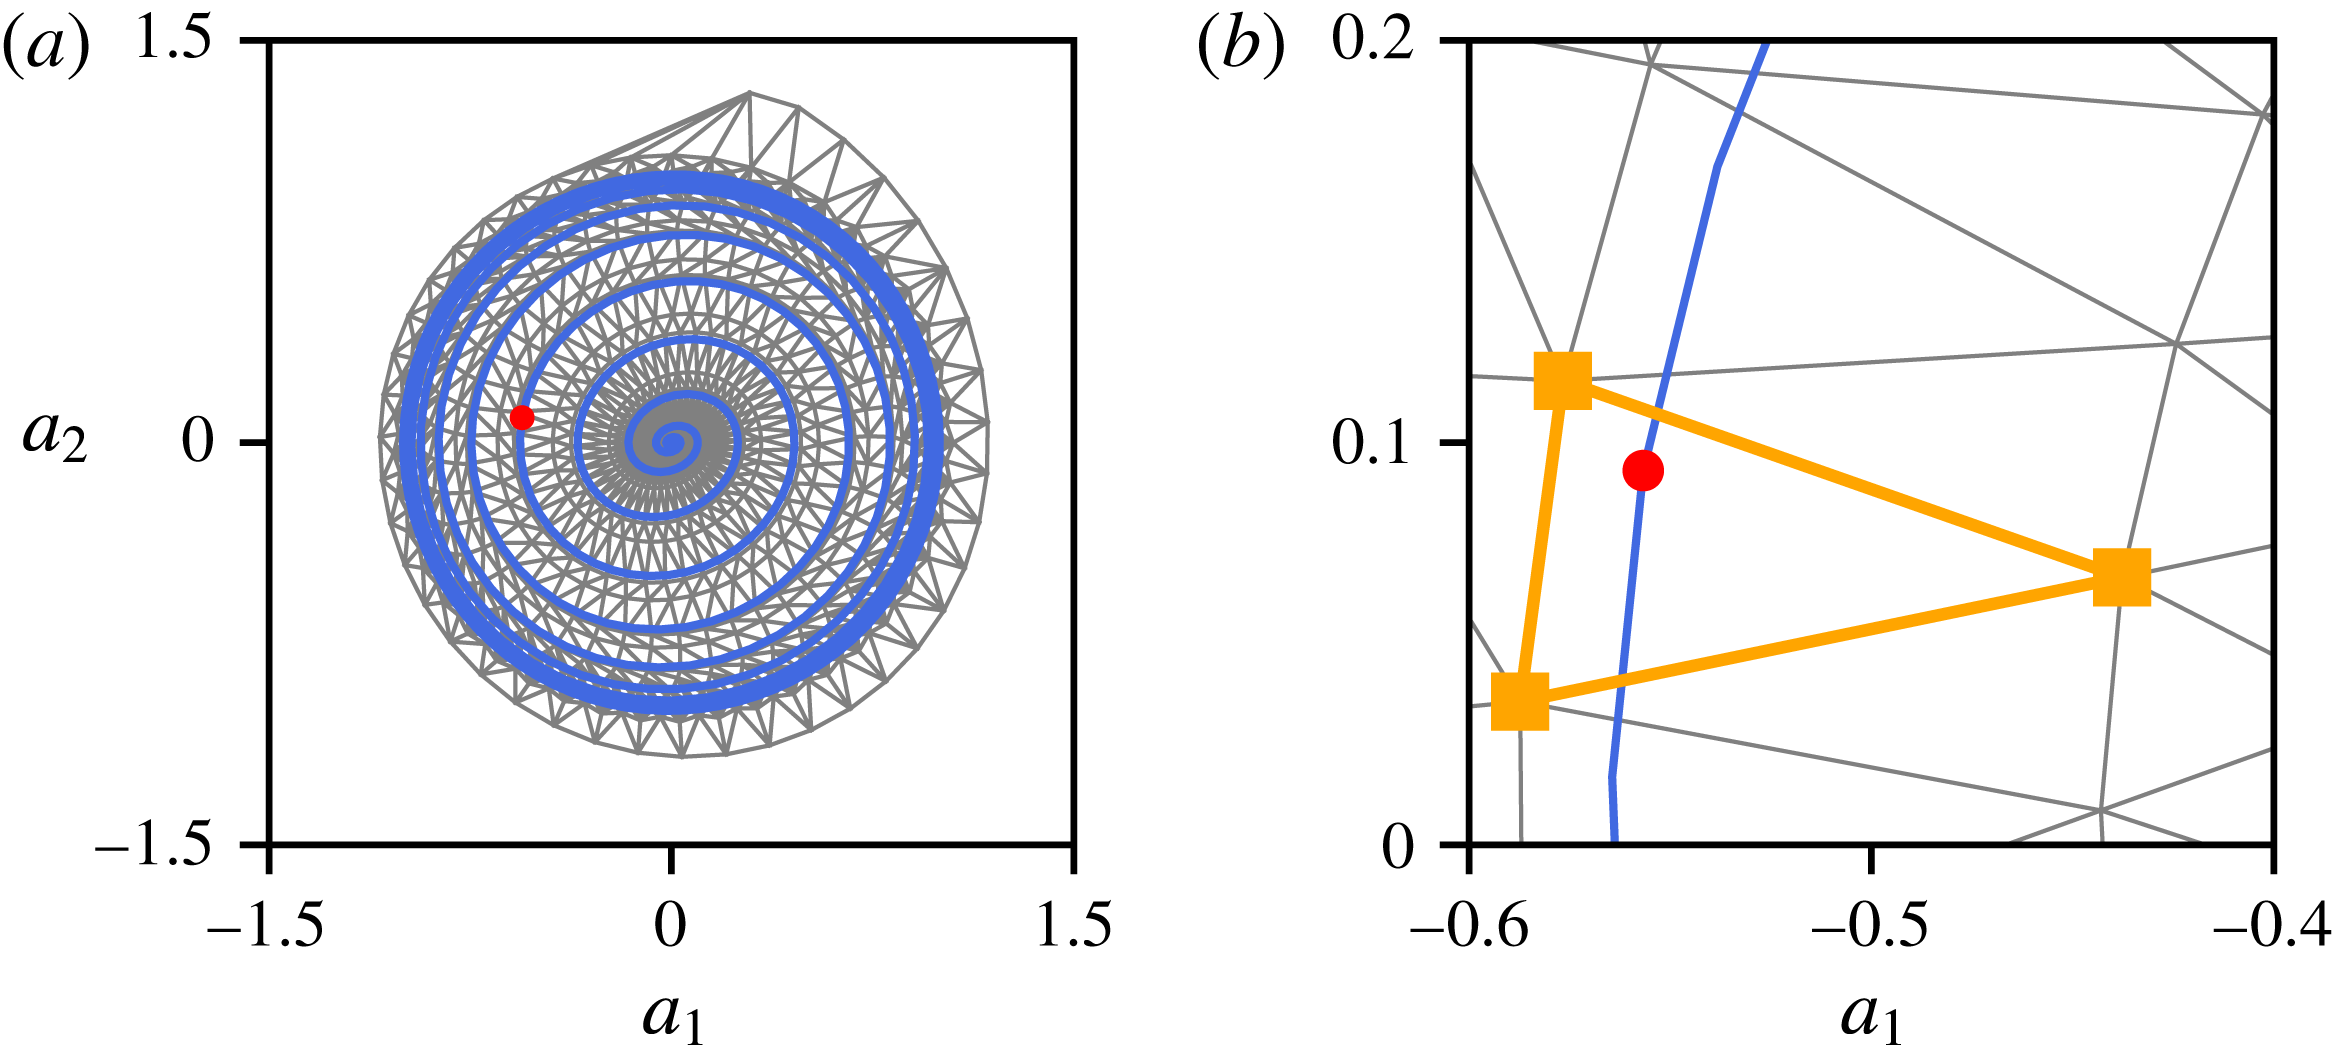
will denote the evolution predicted by the low-dimensional models identified using the SINDy architecture outlined in § 3.2. A Delaunay triangulation of the phase plane of the low-dimensional system can then be obtained from the transient evolutions of
 $a_{1}^{\bullet }(t)$
and
 $a_{2}^{\bullet }(t)$
in the training dataset. An example triangulation is illustrated in figure 4(a). Estimating the flow field associated with a point
 $\left[\begin{array}{@{}cc@{}}a_{1}^{\circ } & a_{2}^{\circ }\end{array}\right]$
then amounts to a two-step procedure:
(i) Given the Delaunay triangulation of the phase plane, identify in which triangle the point
 $\left[\begin{array}{@{}cc@{}}a_{1}^{\circ } & a_{2}^{\circ }\end{array}\right]^{\text{T}}$
is contained. See figure 4 for an illustration.
(ii) Based on the vertices of this triangle, the flow field associated with
$\left[\begin{array}{@{}cc@{}}a_{1}^{\circ } & a_{2}^{\circ }\end{array}\right]^{\text{T}}$
can then be estimated as a weighted average of the flow fields associated with each vertex. In the present work, these weights are chosen such that the query point
$\left[\begin{array}{@{}cc@{}}a_{1}^{\circ } & a_{2}^{\circ }\end{array}\right]^{\text{T}}$
is the barycentre of the corresponding triangle.


Although it may be memory intensive, since numerous snapshots need to be stored, it will be shown in § 4.2 that this local linear mapping procedure allows for an unprecedented accuracy when reconstructing the flow field. Further, it is possible to reduce the memory by compressing the snapshots. In such a case, the output of this local linear mapping are the coefficients of the POD modes needed to reconstruct the high-dimensional flow field.
In both panels, the blue line depicts the trajectory of the testing dataset for which we reconstruct the flow field. (a) Delaunay triangulation of the state plane. In addition to the two transient trajectories started from the fixed point, a third trajectory with an initial condition above the limit cycle has been used to obtain this triangulation. (b) Close-up view in the vicinity of the query point (
 $\bullet$
). The corresponding flow field can then be estimated as a weighted average of the flow fields associated with each vertex of the triangle highlighted in orange.

3.3.2 Feature-based modal expansion
If full-state snapshots of the flow field are available, then it is possible to construct a set of generalized feature-based modes that make the sparse models physically interpretable, providing spatial structures associated with feature variables or specific interaction terms identified in the dynamics. These modes are defined as the spatial structures most correlated with either the feature vector
 $\boldsymbol{a}$
or with specific nonlinear terms in the sparse model (3.4). They are obtained by stochastic estimation, a means of approximating a conditional average using a knowledge of unconditional statistics. As shown in Adrian & Moin (Reference Adrian and Moin1988), a stochastic estimate of the conditional average can be obtained by means of a Taylor series expansion
 $$\begin{eqnarray}\displaystyle \hat{\boldsymbol{u}}(\boldsymbol{x},t) & = & \displaystyle \langle \boldsymbol{u}(\boldsymbol{x},t)|\boldsymbol{a}(t)\rangle \nonumber\\ \displaystyle & \simeq & \displaystyle a_{i}(t)\boldsymbol{u}_{i}(\boldsymbol{x})+a_{i}(t)a_{j}(t)\boldsymbol{u}_{ij}(\boldsymbol{x})+\cdots\end{eqnarray}$$
where
 $a_{i}(t)$
is the
 $i$
th entry of the feature vector
 $\boldsymbol{a}(t)$
,
 $\langle \cdot \rangle$
is the expected value, and
 $\hat{\boldsymbol{u}}(\boldsymbol{x},t)$
is the estimate of the conditional average, in the present case the estimated velocity field. The first and second-order feature-based modes
 $\boldsymbol{u}_{i}(\boldsymbol{x})$
and
 $\boldsymbol{u}_{ij}(\boldsymbol{x})$
, respectively, are determined by minimizing the mean square error of the estimate
 $\langle (\hat{\boldsymbol{u}}(\boldsymbol{x},t)-\boldsymbol{u}(\boldsymbol{x},t)^{2})\rangle$
.
In practice, these feature-based modes are obtained by solving a least mean square problem. Consider a sequence of base flow subtracted full-state snapshots
 $$\begin{eqnarray}\displaystyle \unicode[STIX]{x1D64C}(\boldsymbol{x})=\left[\begin{array}{@{}ccc@{}}\boldsymbol{u}^{(k_{1})}(\boldsymbol{x}) & \boldsymbol{u}^{(k_{2})}(\boldsymbol{x}) & \boldsymbol{u}^{(k_{p})}(\boldsymbol{x})\end{array}\right]. & & \displaystyle\end{eqnarray}$$
(Note that the columns of the matrix
 $\unicode[STIX]{x1D64C}$
correspond to a time sequence of full-state snapshots, which is the mathematical convention in snapshot proper orthogonal decomposition and dynamic mode decomposition (Kutz et al.
Reference Kutz, Brunton, Brunton and Proctor2016). However, the matrix
 $\unicode[STIX]{x1D63C}$
uses transposed notation to be consistent with the original SINDy paper (Brunton et al.
Reference Brunton, Proctor and Kutz2016b
), with rows corresponding to a time-sequence of transposed feature vectors
 $\boldsymbol{a}^{T}$
. Thus, the columns of
 $\unicode[STIX]{x1D63C}^{T}$
are a time-sequence of the features
 $\boldsymbol{a}$
, similar to
 $\unicode[STIX]{x1D64C}$
.) These snapshots do not need to be collected at the same sampling period as the measurements
 $\boldsymbol{s}$
but only at a multiple of this sampling period. As such, they are collected at times
 $t_{k_{1}},\ldots ,t_{k_{p}}$
that correspond to a subset of the resolved measurement times with which
 $\boldsymbol{s}$
and
 $\boldsymbol{a}$
are collected. Recall that the columns of
 $\unicode[STIX]{x1D63C}^{T}$
are a time-resolved sequence of feature vectors
 $\boldsymbol{a}(t_{m})$
, with
 $m=1,\ldots ,M$
. The columns of
 $\unicode[STIX]{x1D63C}^{T}$
associated with the non-time-resolved snapshots in
 $\unicode[STIX]{x1D64C}$
are given by
 $$\begin{eqnarray}\displaystyle \unicode[STIX]{x1D63C}_{\unicode[STIX]{x1D64C}}^{T}=\left[\begin{array}{@{}cccc@{}}\boldsymbol{a}(t_{k_{1}}) & \boldsymbol{a}(t_{k_{2}}) & \cdots \, & \boldsymbol{a}(t_{k_{p}})\end{array}\right]. & & \displaystyle\end{eqnarray}$$
Considering only the first-order Taylor expansion of the conditional average, the snapshots sequence may thus be approximated by
 $$\begin{eqnarray}\displaystyle \unicode[STIX]{x1D64C}=\boldsymbol{U}(\boldsymbol{x})\unicode[STIX]{x1D63C}_{\unicode[STIX]{x1D64C}}^{T}(t)+\unicode[STIX]{x1D64D}(\boldsymbol{x},t), & & \displaystyle\end{eqnarray}$$
where
 $\unicode[STIX]{x1D64D}$
is the truncation residual (i.e. the higher-order terms in the Taylor series expansion of the conditional average). The columns of
 $\boldsymbol{U}(\boldsymbol{x})$
are the first-order feature-based modes that are most correlated with the terms in the feature vector
 $\boldsymbol{a}(t)$
. These modes are found via least-squares regression:
 $$\begin{eqnarray}\boldsymbol{U}=\unicode[STIX]{x1D64C}\left(\unicode[STIX]{x1D63C}_{\unicode[STIX]{x1D64C}}^{T}\right)^{\dagger },\end{eqnarray}$$
where
 $(\unicode[STIX]{x1D63C}_{\unicode[STIX]{x1D64C}}^{T})^{\dagger }$
is the Moore–Penrose pseudo-inverse of
 $\unicode[STIX]{x1D63C}_{\unicode[STIX]{x1D64C}}^{T}$
. More generally, it is possible to compute modes that are most correlated with the dynamic interaction terms in the sparse model (3.8). Let
 $\unicode[STIX]{x1D6FE}_{1},\ldots ,\unicode[STIX]{x1D6FE}_{q}$
denote the indices of the rows in
 $\unicode[STIX]{x1D729}$
with non-zero entries, i.e. corresponding to active terms in the sparse dynamics. The corresponding terms in the dynamics may be extracted via:
 $$\begin{eqnarray}\displaystyle \unicode[STIX]{x1D736}=\left(\unicode[STIX]{x1D723}(\boldsymbol{a})\left[\begin{array}{@{}cccc@{}}\boldsymbol{e}_{\unicode[STIX]{x1D6FE}_{1}} & \boldsymbol{e}_{\unicode[STIX]{x1D6FE}_{2}} & \cdots \, & \boldsymbol{e}_{\unicode[STIX]{x1D6FE}_{q}}\end{array}\right]\right)^{\text{T}}, & & \displaystyle\end{eqnarray}$$
where
 $\boldsymbol{e}_{\unicode[STIX]{x1D6FE}_{j}}$
is a column vector consisting entirely of zeros, except for a one in the
 $\unicode[STIX]{x1D6FE}_{j}$
th row; i.e.
 $\boldsymbol{e}_{\unicode[STIX]{x1D6FE}_{j}}$
is the
 $\unicode[STIX]{x1D6FE}_{j}$
th column of the identity matrix. For example, we consider in § 4.2 a vector of nonlinear terms
 $\unicode[STIX]{x1D736}$
given by
 $\unicode[STIX]{x1D736}=\left[\begin{array}{@{}ccccc@{}}a_{1} & a_{2} & a_{1}^{2}+a_{2}^{2} & 2a_{1}a_{2} & a_{1}^{2}-a_{2}^{2}\end{array}\right]^{\text{T}}$
. This choice corresponds to the different terms active in the dynamics of the low-order model identified in § 4.2. The five components comprise the first and second harmonics as well as the base flow drift. It is now possible to obtain generalized modes:
 $$\begin{eqnarray}\boldsymbol{U}=\unicode[STIX]{x1D64C}\left(\left[\begin{array}{@{}cccc@{}}\unicode[STIX]{x1D736}(t_{k_{1}}) & \unicode[STIX]{x1D736}(t_{k_{2}}) & \cdots \, & \unicode[STIX]{x1D736}(t_{k_{p}})\end{array}\right]\right).\end{eqnarray}$$
Thus, each mode
 $\boldsymbol{u}_{i}(\boldsymbol{x})$
is a spatial field corresponding to a specific interaction term in the dynamical system, given by a component of
 $\unicode[STIX]{x1D736}$
.
Compared to the local linear mapping presented in § 3.3.1, such a feature-based expansion has a low memory footprint, although it will typically be less accurate. However, even if the feature-based modes are not used for full-state reconstruction, they imbue the sparse model with physical interpretability. The modal representation above may be thought of as closely related to the proper orthogonal decomposition or dynamic mode decomposition, except generalized to identify modes that are most correlated with the features in
 $\boldsymbol{a}$
or the dynamic interaction terms in
 $\unicode[STIX]{x1D736}$
.
4 Results
A detailed description of the application of the present methodology to the two-dimensional cylinder flow at
 $Re=100$
is given in this section. As a starting point, our attention is focused in § 4.1 on the identification of a low-dimensional descriptor system describing the dynamics of the flow solely based on the instantaneous lift and drag coefficients. As a second step, the performances of different estimators to reconstruct the full state of the system are discussed in § 4.2.
4.1 Sensor-based dynamics
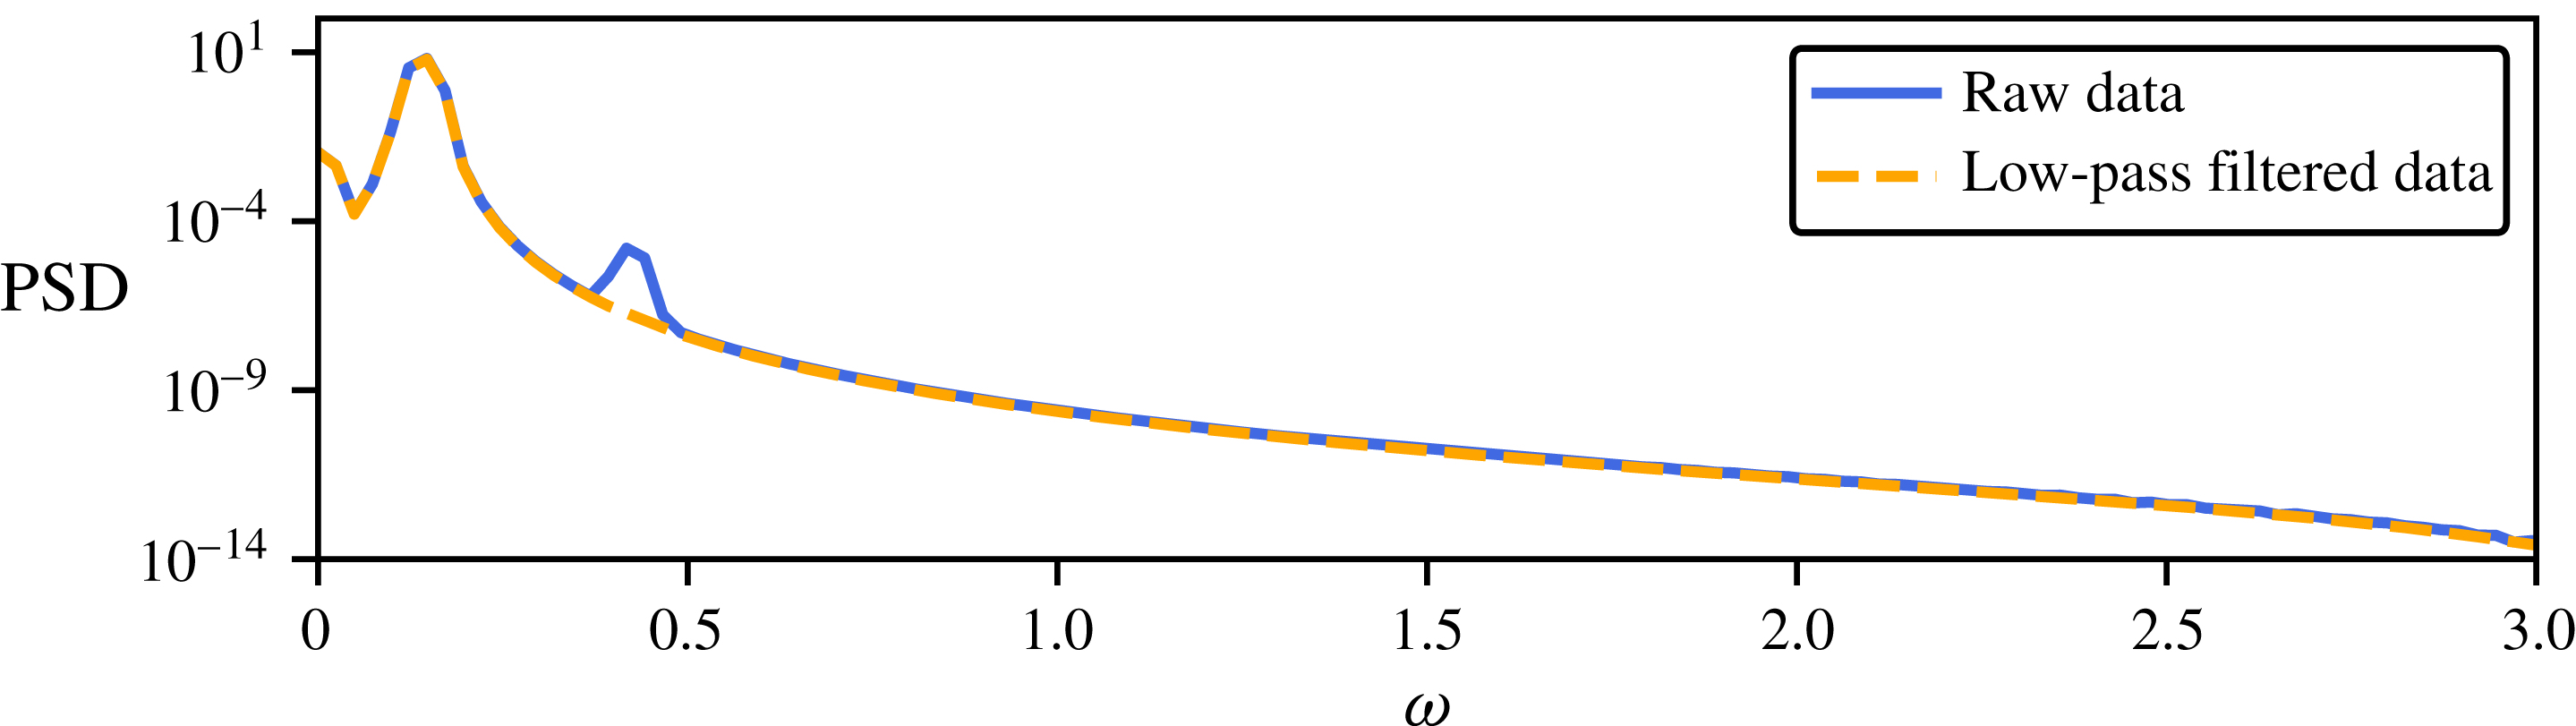
Comparison of the power spectral density (PSD) of the original lift signal (see figure 2) and its low-pass filtered counterpart used for identification purposes.

In this section, a low-dimensional model of the transient and post-transient laminar cylinder wake is presented. First, a dynamical model capturing the dynamics of the lift coefficient is identified. Then, this low-order model is supplemented with a nonlinear algebraic measurement equation in order to infer the evolution of the drag coefficient. Note that prior to system identification, the lift signal is low-pass filtered as to simplify the identification process. Figure 5 depicts the power spectral density of the raw signal and its low-pass filtered counterpart. As can be seen, the low-pass filter suppresses the second low-amplitude harmonic. Nonetheless, plotting both signals in the time domain shows no discernible differences (not shown). In practice, such a procedure is similar to the Krylov–Bogulobiov assumption used by Tadmor et al. (Reference Tadmor, Lehmann, Noack and Morzyński2010) to simplify the low-order model derived from a Galerkin projection of the Navier–Stokes equations onto the span of the leading POD modes. The influence of this low-amplitude harmonic on the identified model is discussed in appendix A.
It is well known that the two-dimensional cylinder flow behaves as a self-excited, self-limiting and nearly harmonic nonlinear oscillator. This behaviour is clearly visible in the time evolution of the instantaneous lift coefficient depicted in figure 2. As such, the dynamics can be described by a nonlinear second-order ordinary differential equation (ODE), or by a set of two coupled first-order ODEs. The feature vector
 $\boldsymbol{a}(t)$
characterizing the state of the system in the feature space is defined as
 $$\begin{eqnarray}\boldsymbol{a}=\left[\begin{array}{@{}cc@{}}\hat{a}_{1} & \hat{a}_{2}\end{array}\right]^{\text{T}},\end{eqnarray}$$
with
 $\hat{a}=a/a_{max}$
,
 $a_{max}$
being the maximum absolute value of
 $a$
once the system evolves onto the periodic limit cycle. Such normalization ensures that
 $$\begin{eqnarray}-1\leqslant a_{1,2}\leqslant 1,\end{eqnarray}$$
a condition which greatly simplifies the sparse optimization problem involved in the identification procedure. Although this mapping function has been defined analytically in the present work, similar features could be identified using delay coordinates, as in the singular spectrum analysis (SSA) in meteorology and ecology (Colebrook Reference Colebrook1978; Barnett & Hasselmann Reference Barnett and Hasselmann1979; Weare & Nasstrom Reference Weare and Nasstrom1982; Ghil et al.
Reference Ghil, Allen, Dettinger, Ide, Kondrashov, Mann, Robertson, Saunders, Tian, Varadi and Yiou2002) or the eigensystem realization algorithm (ERA) from system identification and control theory (Juang & Pappa Reference Juang and Pappa1985). These delay coordinates have recently been shown to provide an embedding of nonlinear dynamics into a new coordinate system where the dynamics is approximately linear, establishing a connection to Koopman operator theory (Arbabi & Mezić Reference Arbabi and Mezić2016; Brunton et al.
Reference Brunton, Brunton, Proctor, Kaiser and Kutz2017). Alternatively, the Hilbert transform can also be used to embed the dynamics. In addition, a number of techniques in nonlinear time series analysis have been developed to determine the dimension of the feature vector
 $\boldsymbol{a}$
needed to correctly reproduce the dynamics, e.g. the false nearest neighbours algorithm proposed by Kantz & Schreiber (Reference Kantz and Schreiber2004).
4.1.1 Determining the structure of the model
As a starting point, let us first determine the optimal structure of the low-order model. Based on the transient evolution of the lift coefficient
 $\boldsymbol{s}^{\bullet }(t)$
depicted in figure 2, the corresponding time series of the feature vector
 $\boldsymbol{a}^{\bullet }(t)$
has been computed. The sparse identification of nonlinear dynamics algorithm is used to identify the equations governing the dynamics of
 $\boldsymbol{a}$
. Four libraries of polynomial functions are considered, with the maximum polynomial degree ranging from
 $d=1$
(i.e. linear) up to
 $d=7$
(i.e. septic). For
 $d=3$
(i.e. cubic), this pool of functions reads
 $$\begin{eqnarray}\unicode[STIX]{x1D723}(a_{1},a_{2})=\left[\begin{array}{@{}cccccccccc@{}}1 & a_{1} & a_{2} & a_{1}^{2} & a_{1}a_{2} & a_{2}^{2} & a_{1}^{3} & a_{1}^{2}a_{2} & a_{1}a_{2}^{2} & a_{2}^{3}\end{array}\right].\end{eqnarray}$$
Such a pool of functions, which can easily be enriched if needed, is a natural choice for the identification of nonlinear oscillators.
Given our different polynomial libraries
 $\unicode[STIX]{x1D723}(a_{1},a_{2})$
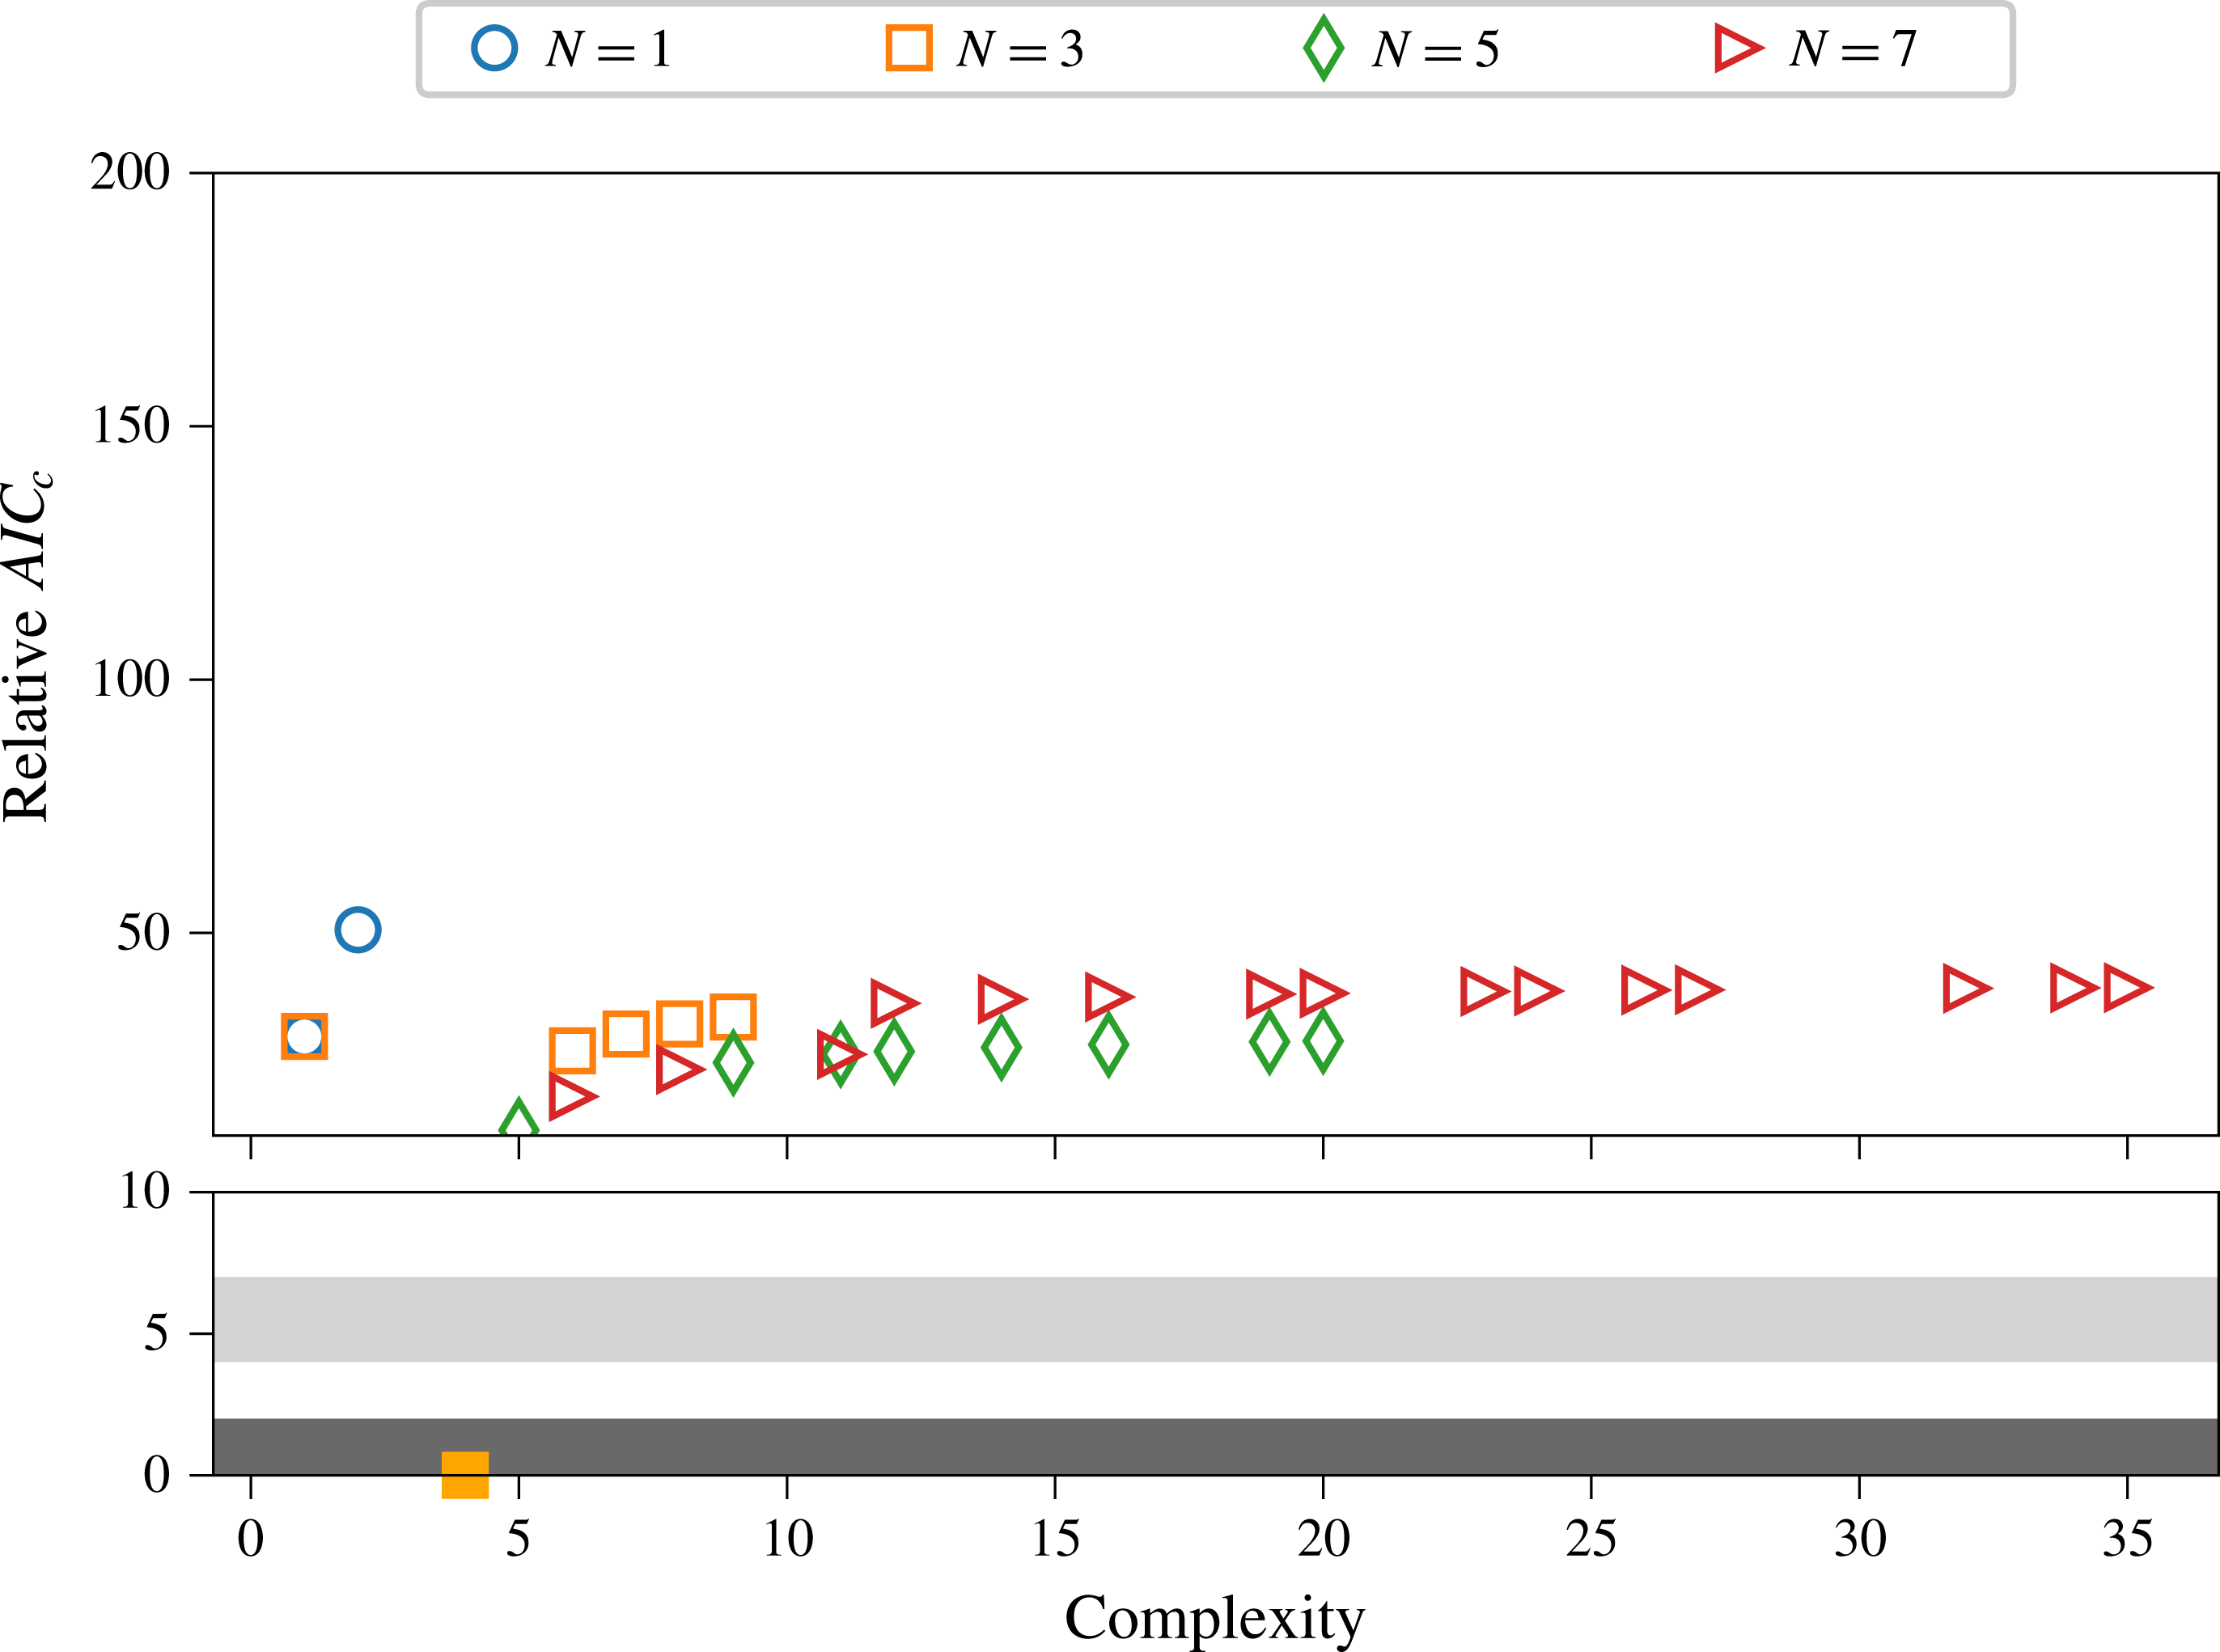
, the procedure proposed by Mangan et al. (Reference Mangan, Kutz, Brunton and Proctor2017) based on the Akaike information criterion (AIC) is used to select the model structure that best balances the trade-off between accuracy and model complexity. Models with lower scores are more parsimonious, as in Mangan et al. (Reference Mangan, Kutz, Brunton and Proctor2017).
Figure 6 depicts the distribution of the different models identified in the complexity versus AIC plane. Note that the relative
 $AIC_{c}$
score depicted is given by
 $AIC_{c}=AIC-AIC_{min}$
. It should be emphasized that the model characterized by
 $AIC_{c}=0$
is not necessarily the best model possible, but only the best one among the different models tested. In the present case, the model that best balances accuracy and complexity is given by a cubic polynomial:
 $$\begin{eqnarray}\displaystyle \left.\begin{array}{@{}c@{}}\displaystyle \frac{\text{d}a_{1}}{\text{d}t}=1.12a_{2}\\ \displaystyle \frac{\text{d}a_{2}}{\text{d}t}=-1.12a_{1}+0.2(1-a_{1}^{2}-a_{2}^{2})a_{2}.\end{array}\right\} & & \displaystyle\end{eqnarray}$$
Surprisingly, the last three terms involved in the equations governing the dynamics of
 $a_{2}$
are identical. Moreover, the first coefficient identified corresponds to the circular frequency of the natural vortex shedding.
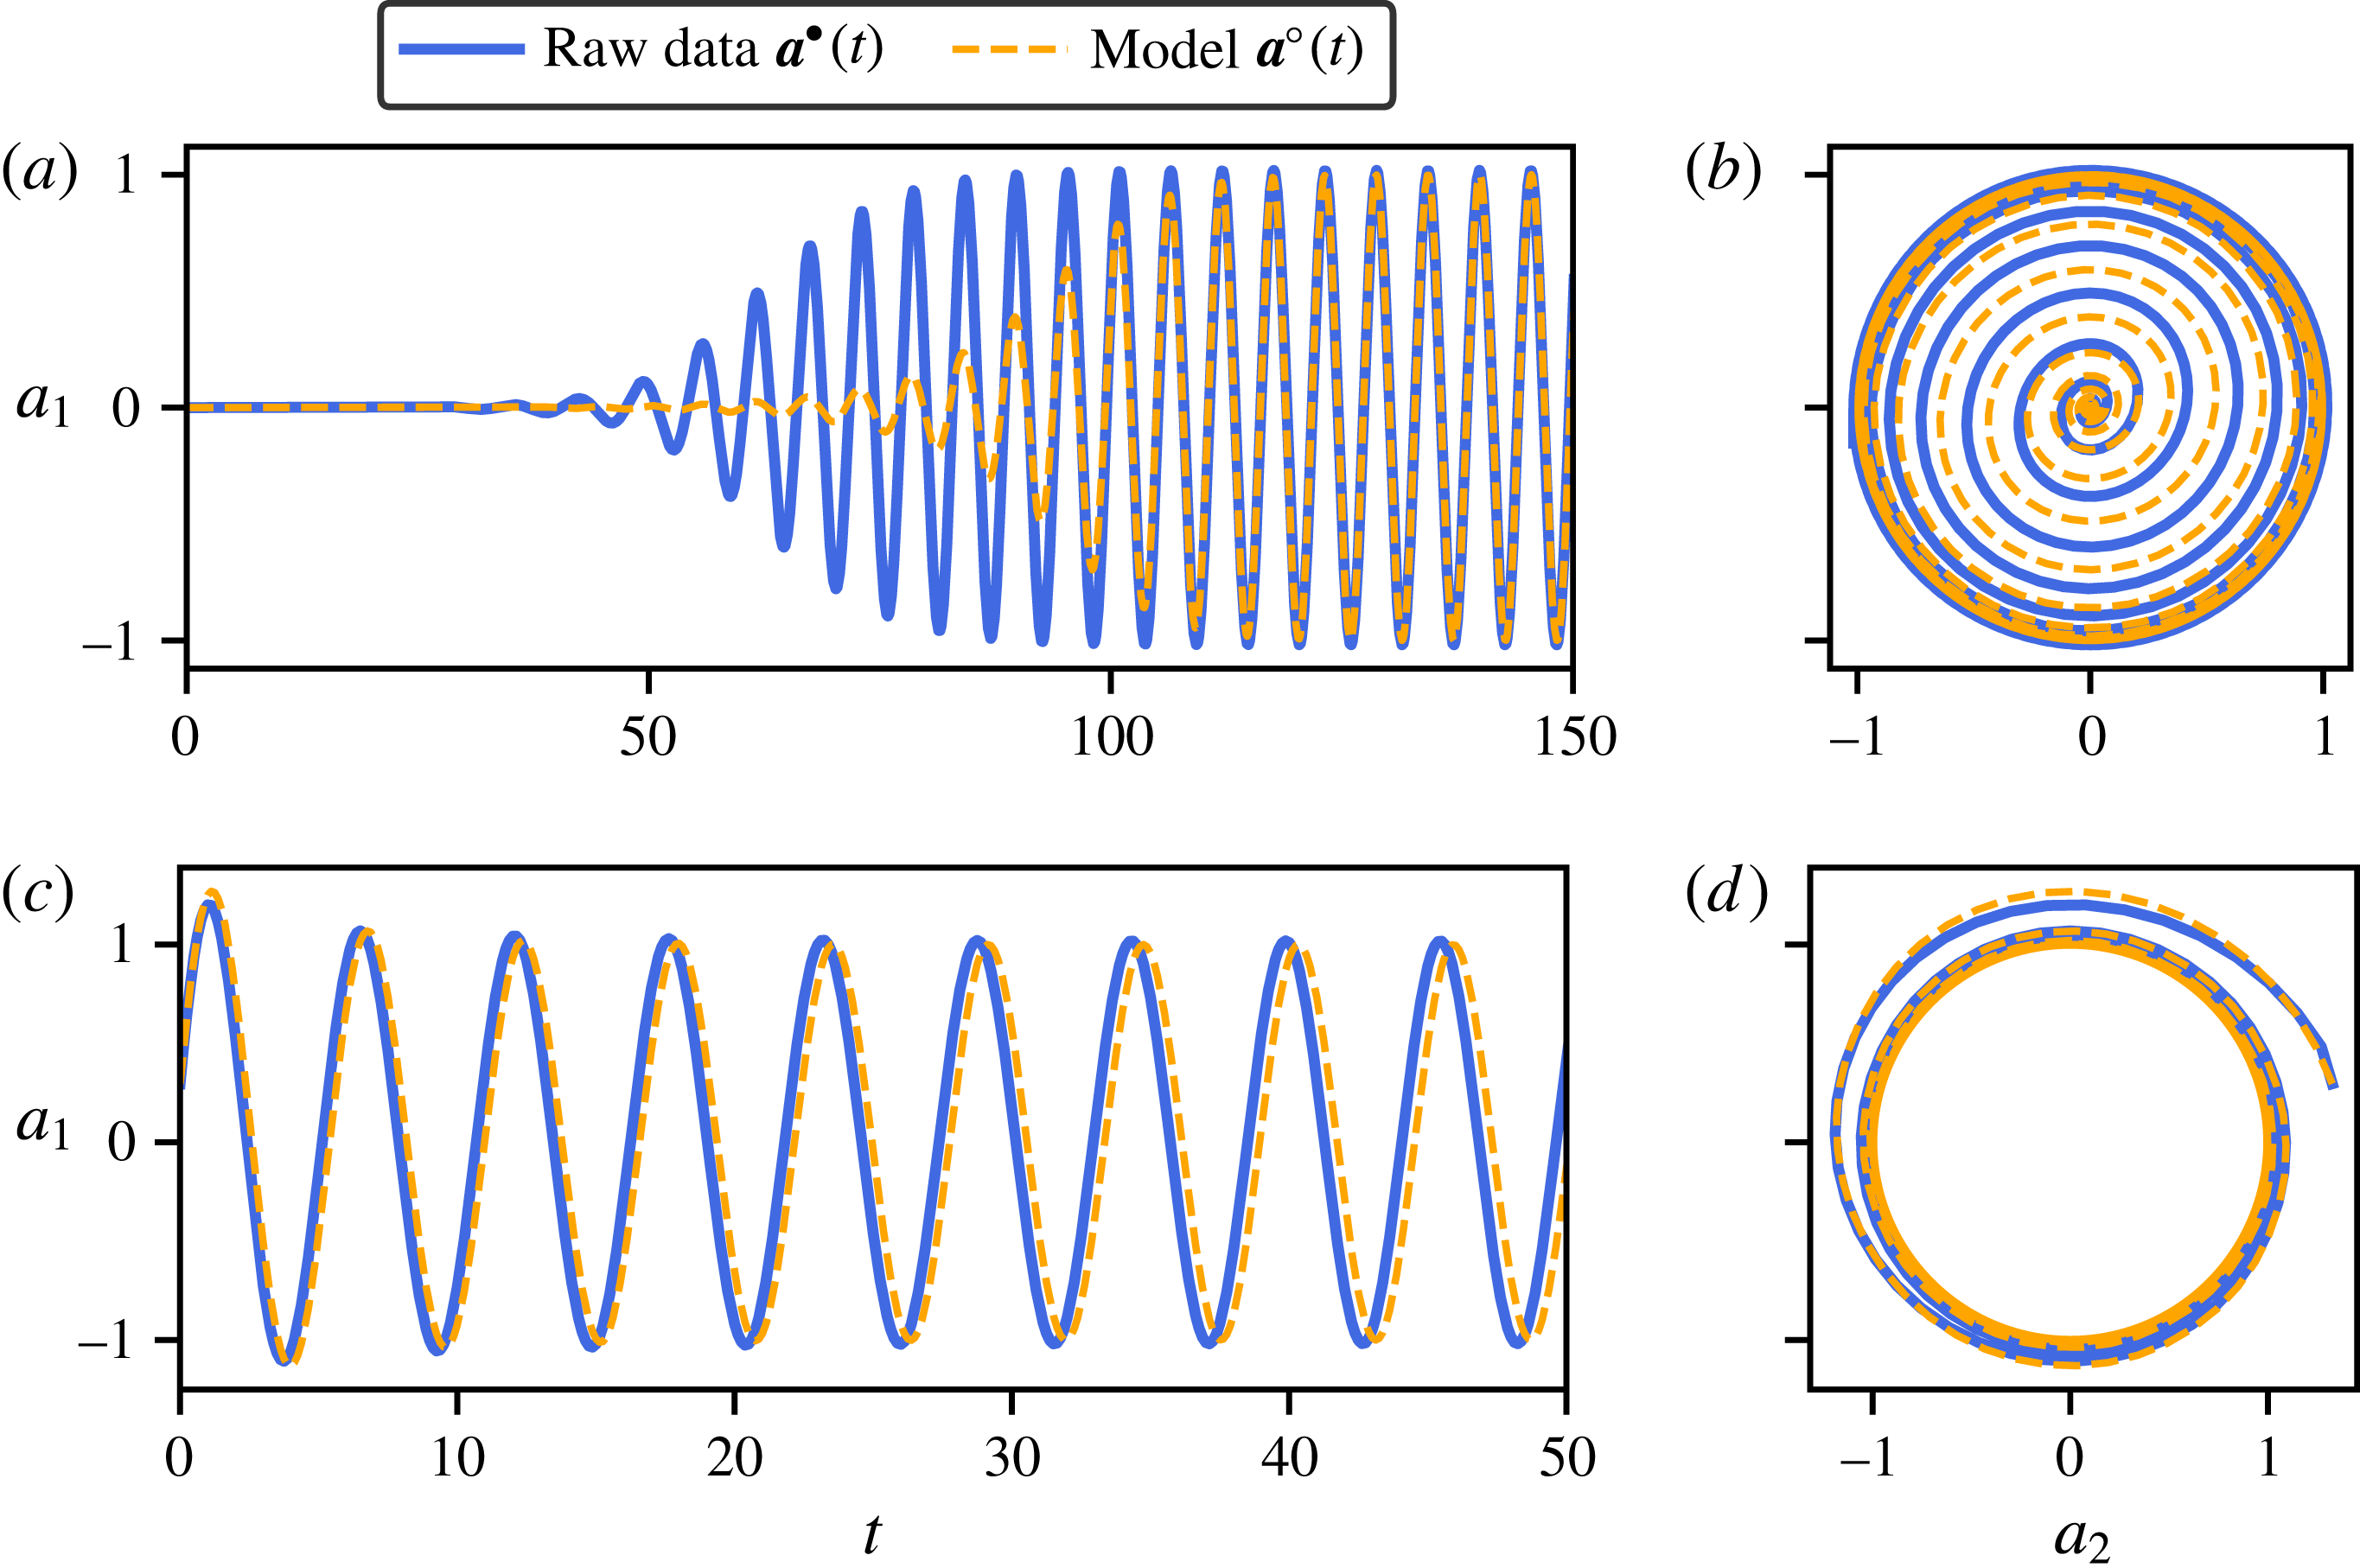
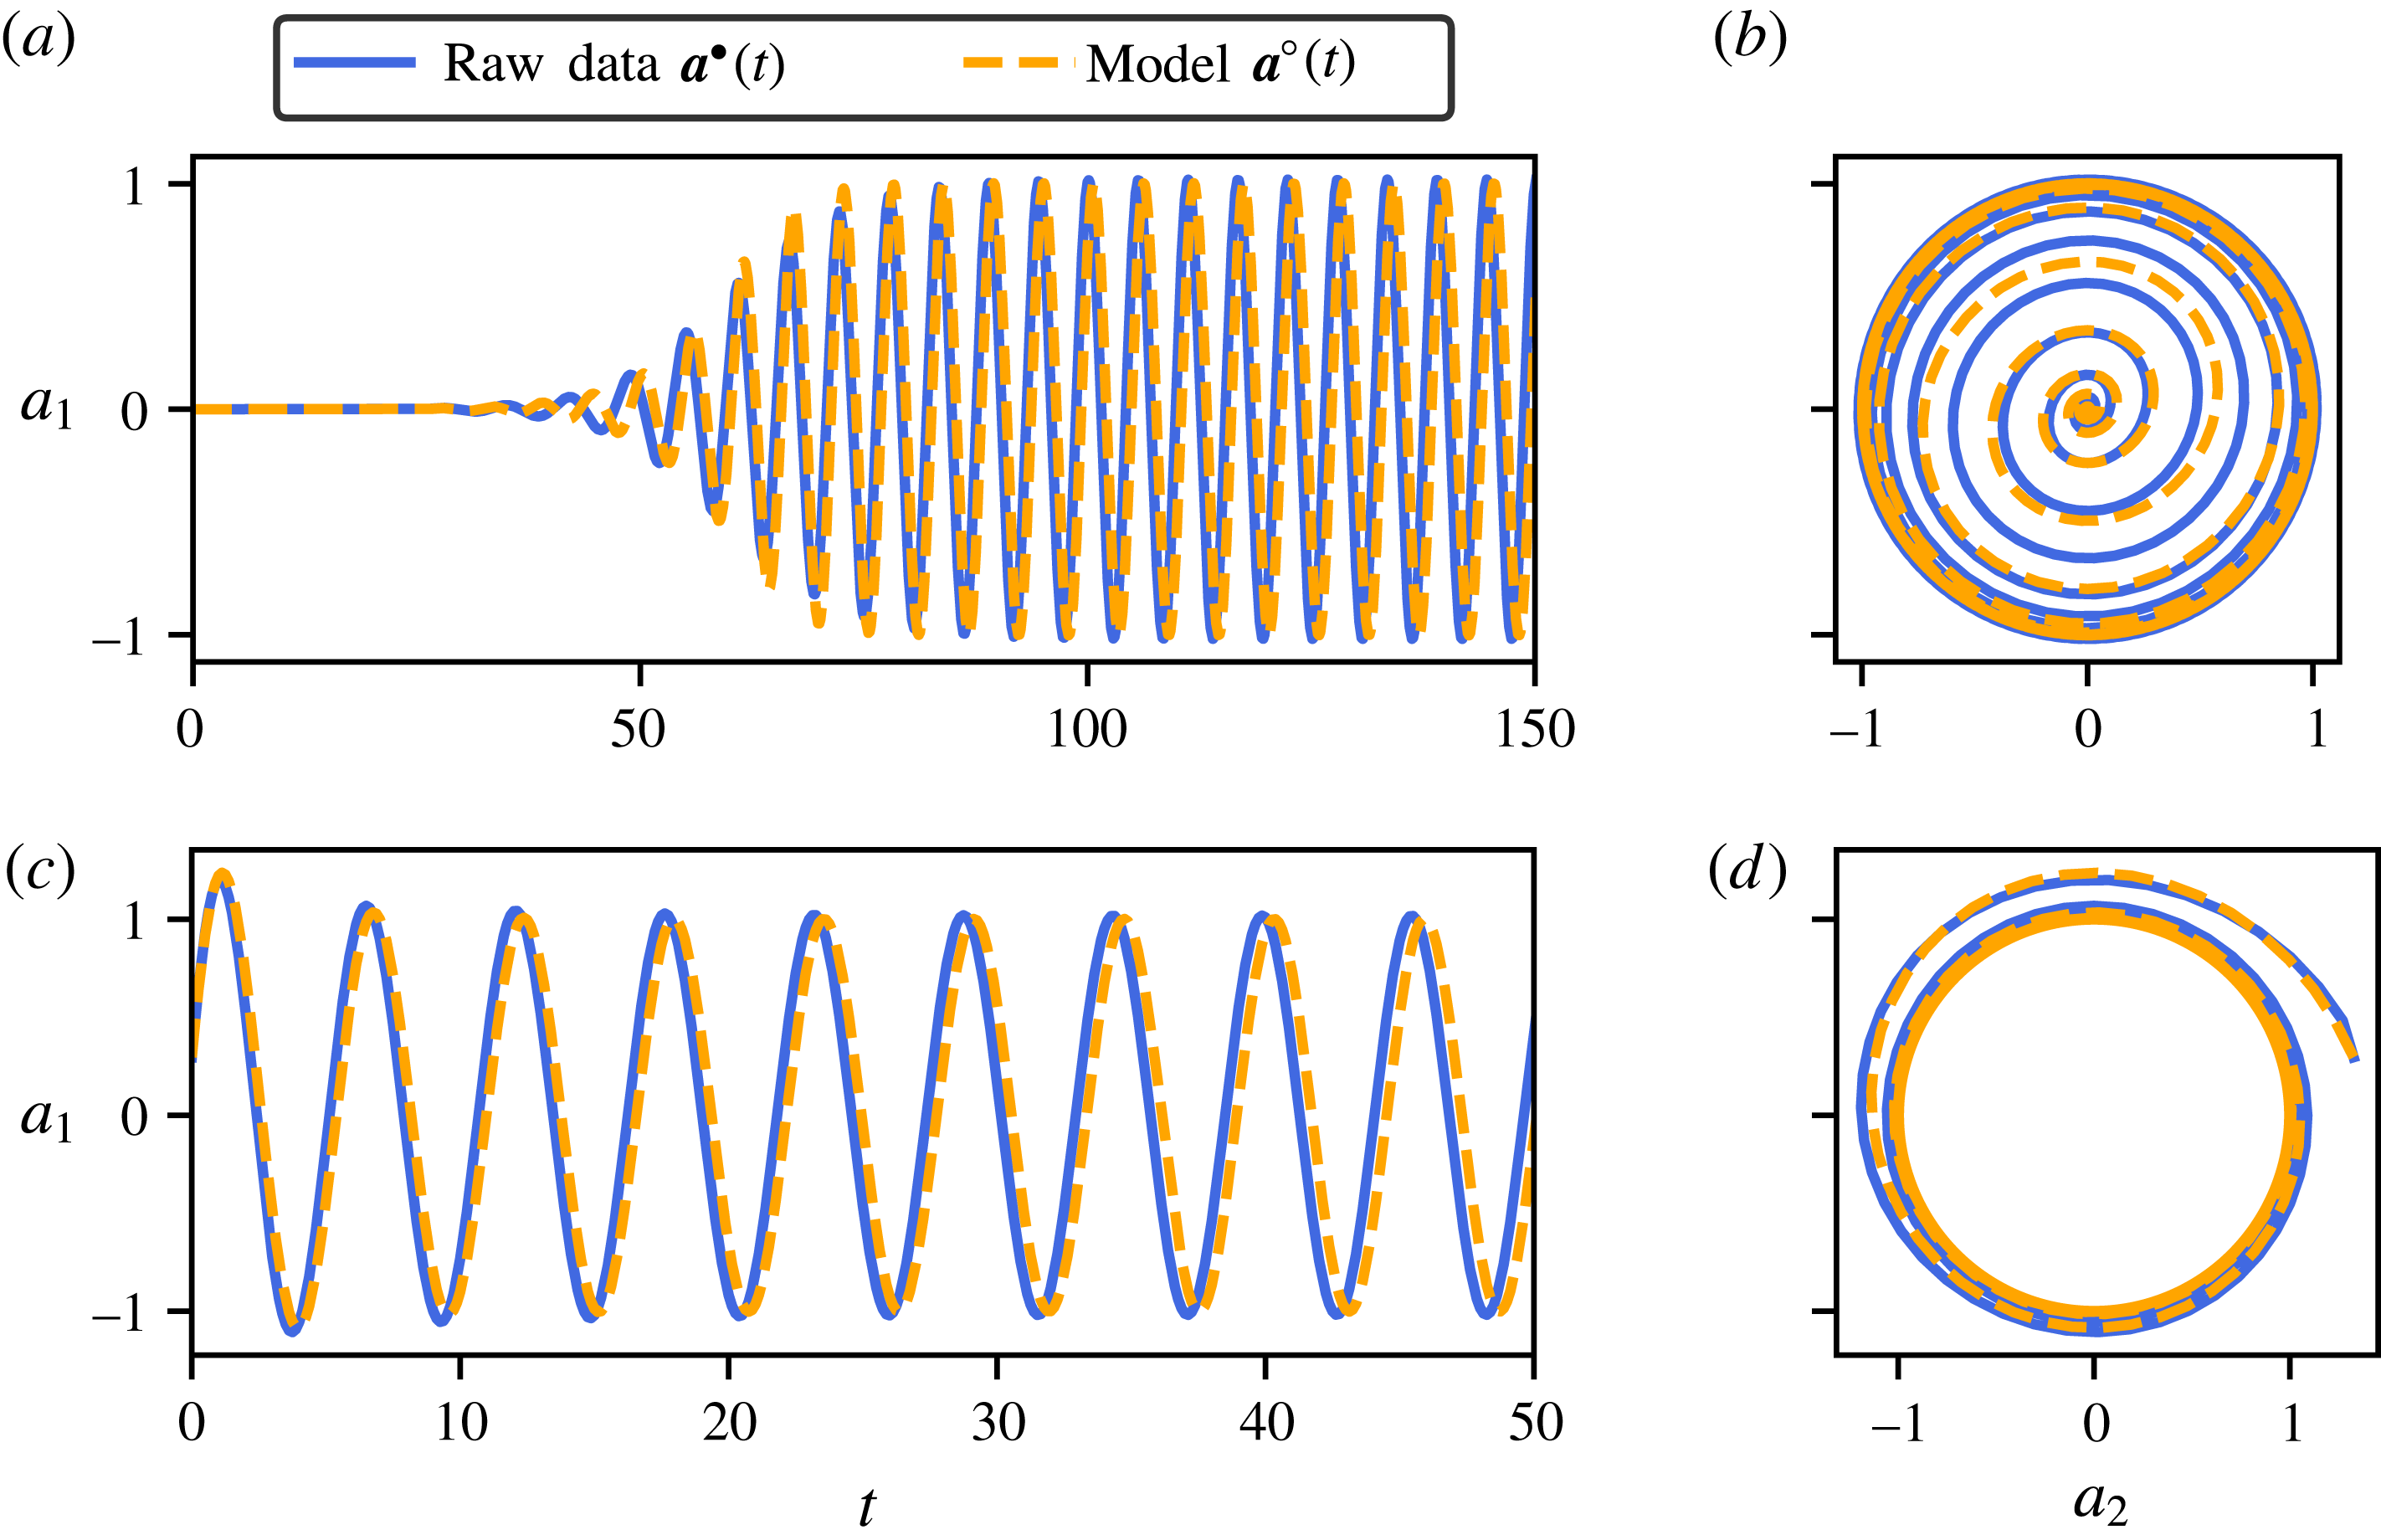
Figure 7 depicts a comparison of the time trace of
 $a_{1}$
obtained from direct numerical simulation (DNS) and predicted by the low-order model identified for the training dataset (figure 7
a,b) and the cross-validation dataset (figure 7
c,d). Note that the latter has not been used in the identification process. Although it accurately captures the dynamics of the system close to the periodic orbit, the identified low-order model underestimates the growth rate of the fixed point’s linear instability. This underestimation leads to a delayed nonlinear saturation of the oscillation amplitude. This point will be investigated in the next section. Finally, note that models including nonlinearities up to the seventh order reproduce very accurately the testing and cross-validation time traces. These models may, however, be prone to overfitting, as highlighted by the AIC score.
Relative
 $AIC_{c}$
criteria for models identified by SINDy. The library of polynomial functions used for the identification includes up to seventh degree polynomials. Magnification in lower panel shows the strongly (dark grey) and weakly (light grey) supported AIC range. The filled-in orange square corresponds to the optimal model, here with cubic nonlinearities.

(a,c) Comparison of the time evolution of the
 $a_{1}$
obtained from direct numerical simulation and predicted by the identified low-dimensional dynamical system with cubic nonlinearity. (b,d) Trajectory of the true system and the identified one on the phase plane
 $(a_{1},a_{2})$
. For (a,b) the initial condition is close to the linearly unstable fixed point
 $\boldsymbol{u}_{b}$
, given by
 $\boldsymbol{a}=\mathbf{0}$
. Panels (c,d) use the cross-validation dataset for which the initial condition used in the direct numerical simulation has been chosen to lie outside of the limit cycle and, for physical reasons, also constrained to start close to the paraboloid manifold structuring the phase space of the system.

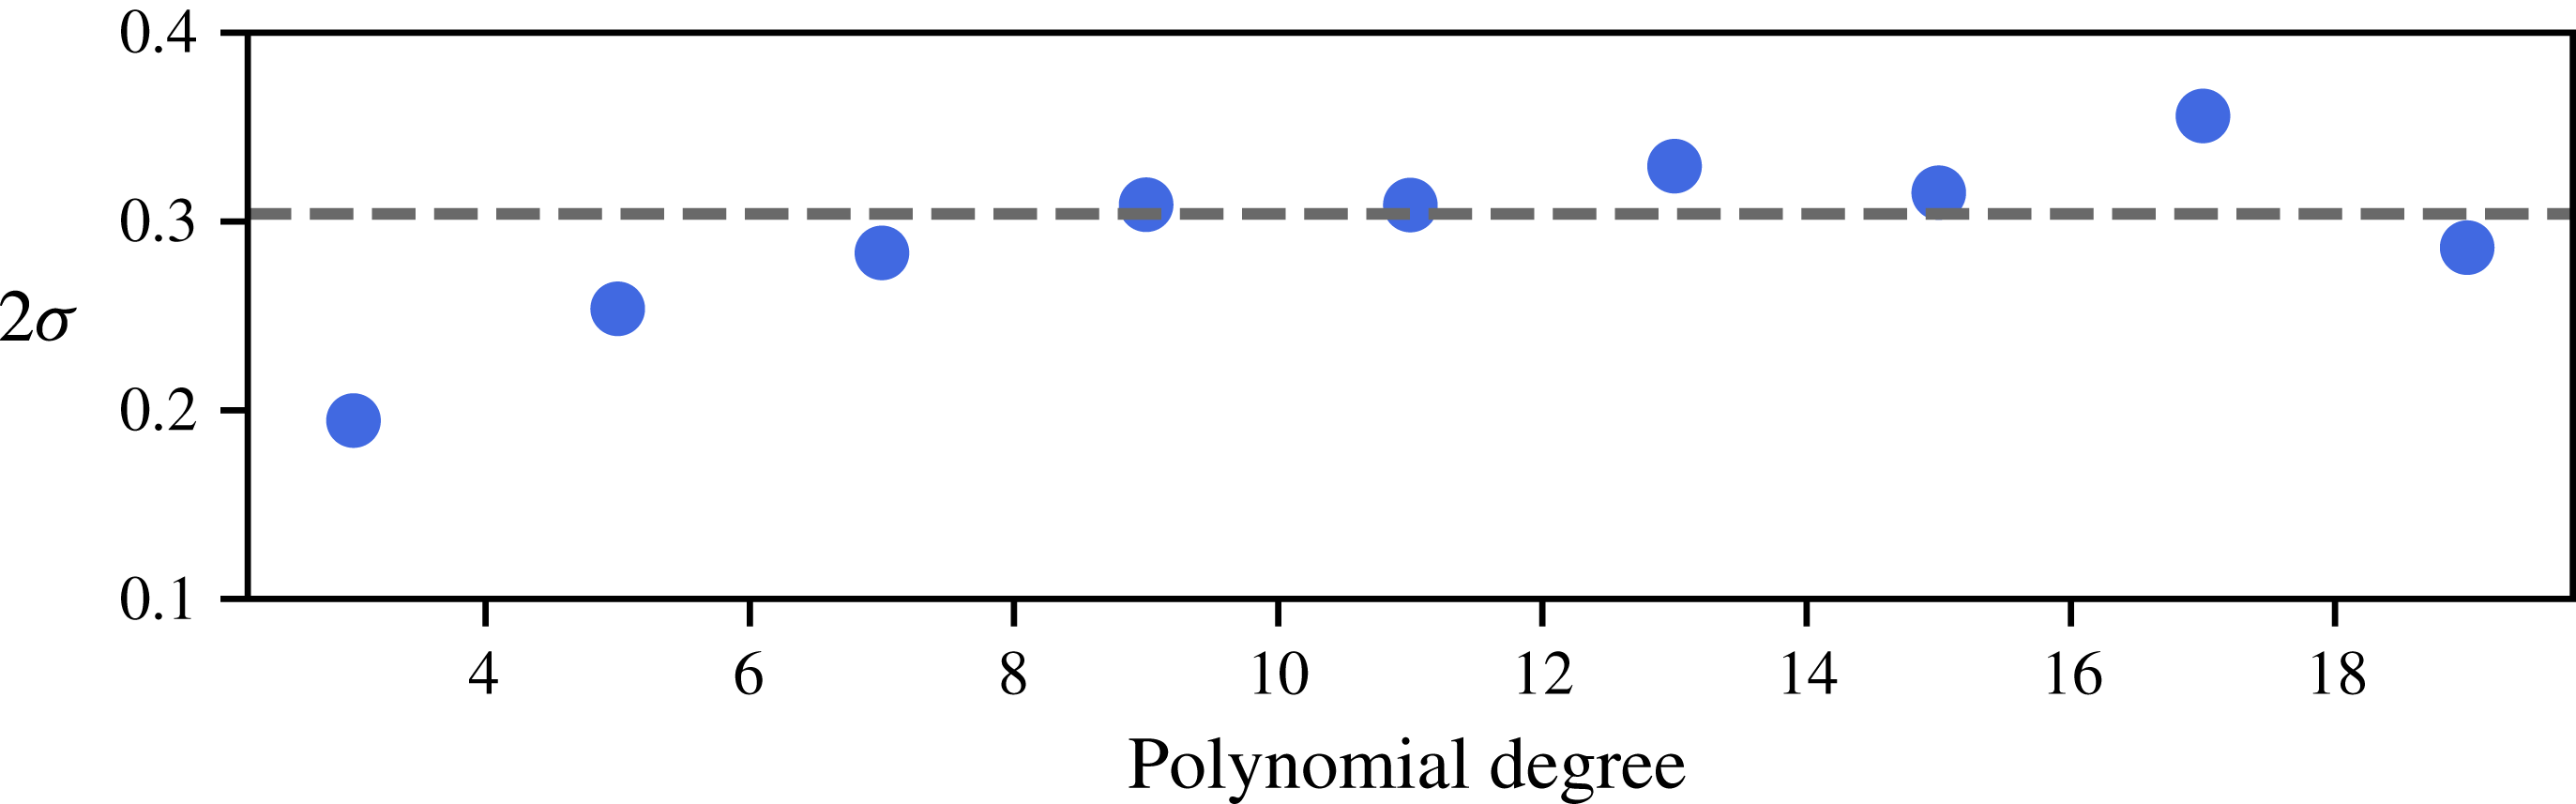
Evolution of the identified instability growth rate as a function of the maximum polynomial order of the model. The dashed line depicts the growth rate obtained from the eigenvalue analysis of the linearized Navier–Stokes operator. The jittering observed for high-order polynomials (i.e.
 $N\geqslant 12$
) is related to the ill conditioning of the least squares used in SINDy, and it can be attenuated by regularizing the partial regression problem.

4.1.2 Correcting the growth rate
As shown in the previous section, the cubic model identified underestimates the growth rate of the fixed point’s linear instability, despite having the lowest AIC score, balancing accuracy and complexity. Figure 8 depicts the evolution of the identified growth rate as a function of the maximum polynomial degree of the model (blue dots) and compares it to the one obtained from a linear stability analysis of the corresponding high-dimensional linearized Navier–Stokes operator (dashed line). It appears that SINDy identifies the correct growth rate for libraries of polynomial functions with order
 $N\geqslant 7$
. Despite the good agreement between the phase plane trajectories predicted by the cubic model and the DNS observations (see figure 7
b,d), it appears that higher-order terms are necessary to accurately identify the instability growth rate, even though it may increase the risk of overfitting.
Although the need for high-order terms may appear counter-intuitive, this is relatively common in regression analysis with classical polynomials. To understand this, let us rewrite our regression model for
 $a_{2}$
as
 $$\begin{eqnarray}\displaystyle \frac{\text{d}a_{2}}{\text{d}t}=\unicode[STIX]{x1D723}_{1}\unicode[STIX]{x1D709}_{1}+\unicode[STIX]{x1D723}_{2}\unicode[STIX]{x1D709}_{2},\end{eqnarray}$$
where
 $\unicode[STIX]{x1D723}_{1}$
contains the linear terms (i.e.
 $\unicode[STIX]{x1D723}_{1}(a_{1},a_{2})=\left[\begin{array}{@{}cc@{}}a_{1} & a_{2}\end{array}\right]$
),
 $\unicode[STIX]{x1D723}_{2}(a_{1},a_{2})$
the higher-order terms, while
 $\unicode[STIX]{x1D709}_{1}$
and
 $\unicode[STIX]{x1D709}_{2}$
are the corresponding vectors of coefficients.Neglecting the sparsity constraint for the sake of simplicity, the least-squares problem becomes
 $$\begin{eqnarray}\left[\begin{array}{@{}cc@{}}\unicode[STIX]{x1D723}_{1}^{T}\unicode[STIX]{x1D723}_{1} & \unicode[STIX]{x1D723}_{1}^{T}\unicode[STIX]{x1D723}_{2}\\ \unicode[STIX]{x1D723}_{2}^{T}\unicode[STIX]{x1D723}_{1} & \unicode[STIX]{x1D723}_{2}^{T}\unicode[STIX]{x1D723}_{2}\end{array}\right]\left[\begin{array}{@{}c@{}}\unicode[STIX]{x1D709}_{1}\\ \unicode[STIX]{x1D709}_{2}\end{array}\right]=\left[\begin{array}{@{}c@{}}\unicode[STIX]{x1D723}_{1}^{T}{\dot{a}}_{2}\\ \unicode[STIX]{x1D723}_{2}^{T}{\dot{a}}_{2}\end{array}\right].\end{eqnarray}$$
Thus, the coefficients
 $\unicode[STIX]{x1D709}_{1}$
of the linear terms are given by
 $$\begin{eqnarray}\unicode[STIX]{x1D709}_{1}=(\unicode[STIX]{x1D723}_{1}^{T}\unicode[STIX]{x1D723}_{1})^{-1}\unicode[STIX]{x1D723}_{1}^{T}({\dot{a}}_{2}-\unicode[STIX]{x1D723}_{2}\unicode[STIX]{x1D709}_{2}).\end{eqnarray}$$
Note that here
 ${\dot{a}}_{2}$
is used to denote the time derivative of
 $a_{2}$
for the sake of clarity. The term
 $(\unicode[STIX]{x1D723}_{1}^{T}\unicode[STIX]{x1D723}_{1})^{-1}\unicode[STIX]{x1D723}_{1}^{T}{\dot{a}}_{2}$
is the least-squares solution when our pool of admissible functions is limited to
 $\unicode[STIX]{x1D723}_{1}(a_{1},a_{2})$
. The second term,
 $-(\unicode[STIX]{x1D723}_{1}^{T}\unicode[STIX]{x1D723}_{1})^{-1}\unicode[STIX]{x1D723}_{1}^{T}\unicode[STIX]{x1D723}_{2}\unicode[STIX]{x1D709}_{2}$
, is the correction of
 $\unicode[STIX]{x1D709}_{1}$
due to the inclusion of higher-order polynomials in the regression problem. This correction is proportional to the cross-correlation matrix
 $\unicode[STIX]{x1D723}_{1}^{T}\unicode[STIX]{x1D723}_{2}$
and is related to the non-orthogonality properties of the set of functions forming our total library
 $\unicode[STIX]{x1D723}(a_{1},a_{2})$
.
Note that that one needs not identify the complete high-order model in order to estimate the correct growth rate of the instability. Given the Frisch–Waugh–Lovell theorem, one needs only solve a partial regression problem for that purpose. Having estimated the rate of the instability, one can then enforce this particular value directly during the identification of the cubic model, as in Loiseau & Brunton (Reference Loiseau and Brunton2018). The resulting optimization problem then reads
 $$\begin{eqnarray}\left.\begin{array}{@{}c@{}}\text{minimize}_{\unicode[STIX]{x1D709}}\Vert \unicode[STIX]{x1D723}(a_{1},a_{2})\unicode[STIX]{x1D709}-{\dot{a}}_{2}\Vert _{2}^{2}+\unicode[STIX]{x1D706}\Vert \unicode[STIX]{x1D709}\Vert _{1}\\ \text{subject to}\;\boldsymbol{C}\unicode[STIX]{x1D709}=\boldsymbol{d}\end{array}\right\}\end{eqnarray}$$
where
 $\boldsymbol{C}$
and
 $\boldsymbol{d}$
are the linear constraints enforcing the estimated growth rate of the instability. We then follow the same procedure as in the previous section to identify the optimal constrained cubic model. The resulting model reads
 $$\begin{eqnarray}\displaystyle \frac{\text{d}}{\text{d}t}\left[\begin{array}{@{}c@{}}a_{1}\\ a_{2}\end{array}\right]=\left[\begin{array}{@{}cc@{}}0 & 1.12\\ -1.12 & 0.3(1-a_{1}^{2}-a_{2}^{2})\end{array}\right]\left[\begin{array}{@{}c@{}}a_{1}\\ a_{2}\end{array}\right].\end{eqnarray}$$
As shown in figure 9, the time evolution of
 $a_{1}^{\circ }(t)$
predicted by this low-dimensional model is in excellent agreement with DNS (
 $a_{1}^{\bullet }(t)$
) on both the training and testing datasets. It is remarkable that, despite its apparent simplicity, this two-degrees-of-freedom model captures all of the key features of the cylinder flow, namely:
(i) It admits only one linearly unstable fixed point given by
$\boldsymbol{a}=\mathbf{0}$
and one attracting limit cycle characterized by
$\Vert \boldsymbol{a}\Vert =1$
. The corresponding circular frequency
$\unicode[STIX]{x1D714}^{\circ }=1.12$
in the nonlinearly saturated state is identical to the frequency observed in DNS (
$\unicode[STIX]{x1D714}^{\bullet }=1.12$
).(ii) It explicitly highlights the quadratic dependency of the instantaneous growth rate
$2\unicode[STIX]{x1D70E}(\boldsymbol{a})=0.3(1-a_{1}^{2}-a_{2}^{2})$
. Such quadratic dependencies are consistent with our current understanding of the nonlinear saturation process of globally unstable flows; see Mantič-Lugo, Arratia & Gallaire (Reference Mantič-Lugo, Arratia and Gallaire2014) for more details.(iii) Once the amplitude of the oscillation has saturated to
$\Vert \boldsymbol{a}\Vert =1$
, the system reduces to a simple harmonic oscillator. A similar structure could be derived based on a Galerkin projection of the Navier–Stokes equations onto the span of the first two POD modes and using the marginally stable mean flow as the reference state.




From a physical point of view, this low-order system describes the dynamics of the original high-dimensional system when constrained to the low-dimensional manifold structuring its phase (Noack et al. Reference Noack, Afanasiev, Morzynski, Tadmor and Thiele2003).
(a,c) Comparison of the time evolution of
 $a_{1}$
obtained from direct numerical simulation and predicted by the identified low-dimensional dynamical system. (b,d) Trajectories of the true system and the model on the phase plane
 $(a_{1},a_{2})$
. For (a,b) the initial condition is close to the linearly unstable fixed point
 $\boldsymbol{u}_{b}$
, given by
 $\boldsymbol{a}=\mathbf{0}$
. Panels (c,d) use the cross-validation dataset for which the initial condition used in the direct numerical simulation has been chosen to lie outside of the limit cycle and, for physical reasons, was also constrained to start close to the parabolic manifold structuring the phase space of the system.

4.1.3 Predicting the drag evolution
The dynamical system identified in the previous section provides valuable information and accurately predicts the dynamics of its high-dimensional counterpart. Being based solely on quantities derived from the instantaneous lift coefficient, the model does not enable direct estimation of the corresponding drag force. However, estimating the instantaneous drag force might be of critical importance in aerodynamic applications. Defining the drag coefficient as an additional degree of freedom of our system, two different possibilities arise:
(i) extend the identified system with a (nonlinear) algebraic measurement equation, also identified using sparse regression; or,
(ii) identify a new dynamical system comprised of three coupled ODEs.
We have investigated both of these options. Given the simplicity and accuracy of the dynamical system introduced previously, the former approach is preferred over the latter. Using the drag coefficient of the base flow subtracted velocity field as our additional degree of freedom
 $a_{3}$
, and normalizing it such that its mean value is
 $\bar{a}_{3}=1$
on the limit cycle, the identified measurement equation reads
 $$\begin{eqnarray}a_{3}^{2}=1.08a_{1}^{2}+0.92a_{2}^{2}-0.18a_{1}a_{2}.\end{eqnarray}$$
Note that it can be re-written as
 $$\begin{eqnarray}a_{3}^{2}=(a_{1}^{2}+a_{2}^{2})+0.8(a_{1}^{2}-a_{2}^{2})-0.18a_{1}a_{2}.\end{eqnarray}$$
The first term highlights that the amplitude of the drag force is directly proportional to the amplitude of the lift oscillation. The second and third terms then describe the contribution of the second harmonic of the lift on the drag, hence characterizing the instantaneous oscillation of the drag force around its mean value. Combining this measurement equation with the dynamical system (4.9) identified in § 4.1.2 results in a low-dimensional descriptor system governing the evolution of both the instantaneous lift and drag coefficients.
Equation (4.11) describes a distorted cone and is notably different from the mean-field paraboloid of the three-dimensional POD–Galerkin model by Noack et al. (Reference Noack, Afanasiev, Morzynski, Tadmor and Thiele2003). This difference can be explained by the choice of the state space
 $\boldsymbol{a}$
. The oscillation of von Kármán vortex shedding is characterized by
 $a_{1}$
and
 $a_{2}$
– albeit from different physical mechanisms. During the transient, the vortex shedding moves upstream from the stagnation point of the unstable steady solution to the immediate vicinity of the cylinder. The global POD mode amplitudes
 $a_{1}$
,
 $a_{2}$
resolve the vortex shedding even when it is far downstream. However, the lift-based feature coordinates only respond to the vortex shedding in the final stage when the vortices are close to the cylinder. In contrast, the drag variation and the shift-mode amplitude of the three-dimensional POD–Galerkin model are linearly related. Thus,
 $a_{3}$
of the Galerkin expansion and of the force-related reduced-order model resolve the same physics. Hence, the fluctuation amplitude
 $\sqrt{a_{1}^{2}+a_{2}^{2}}$
increases much faster with
 $a_{3}$
for the POD-based model than for the force-based system.
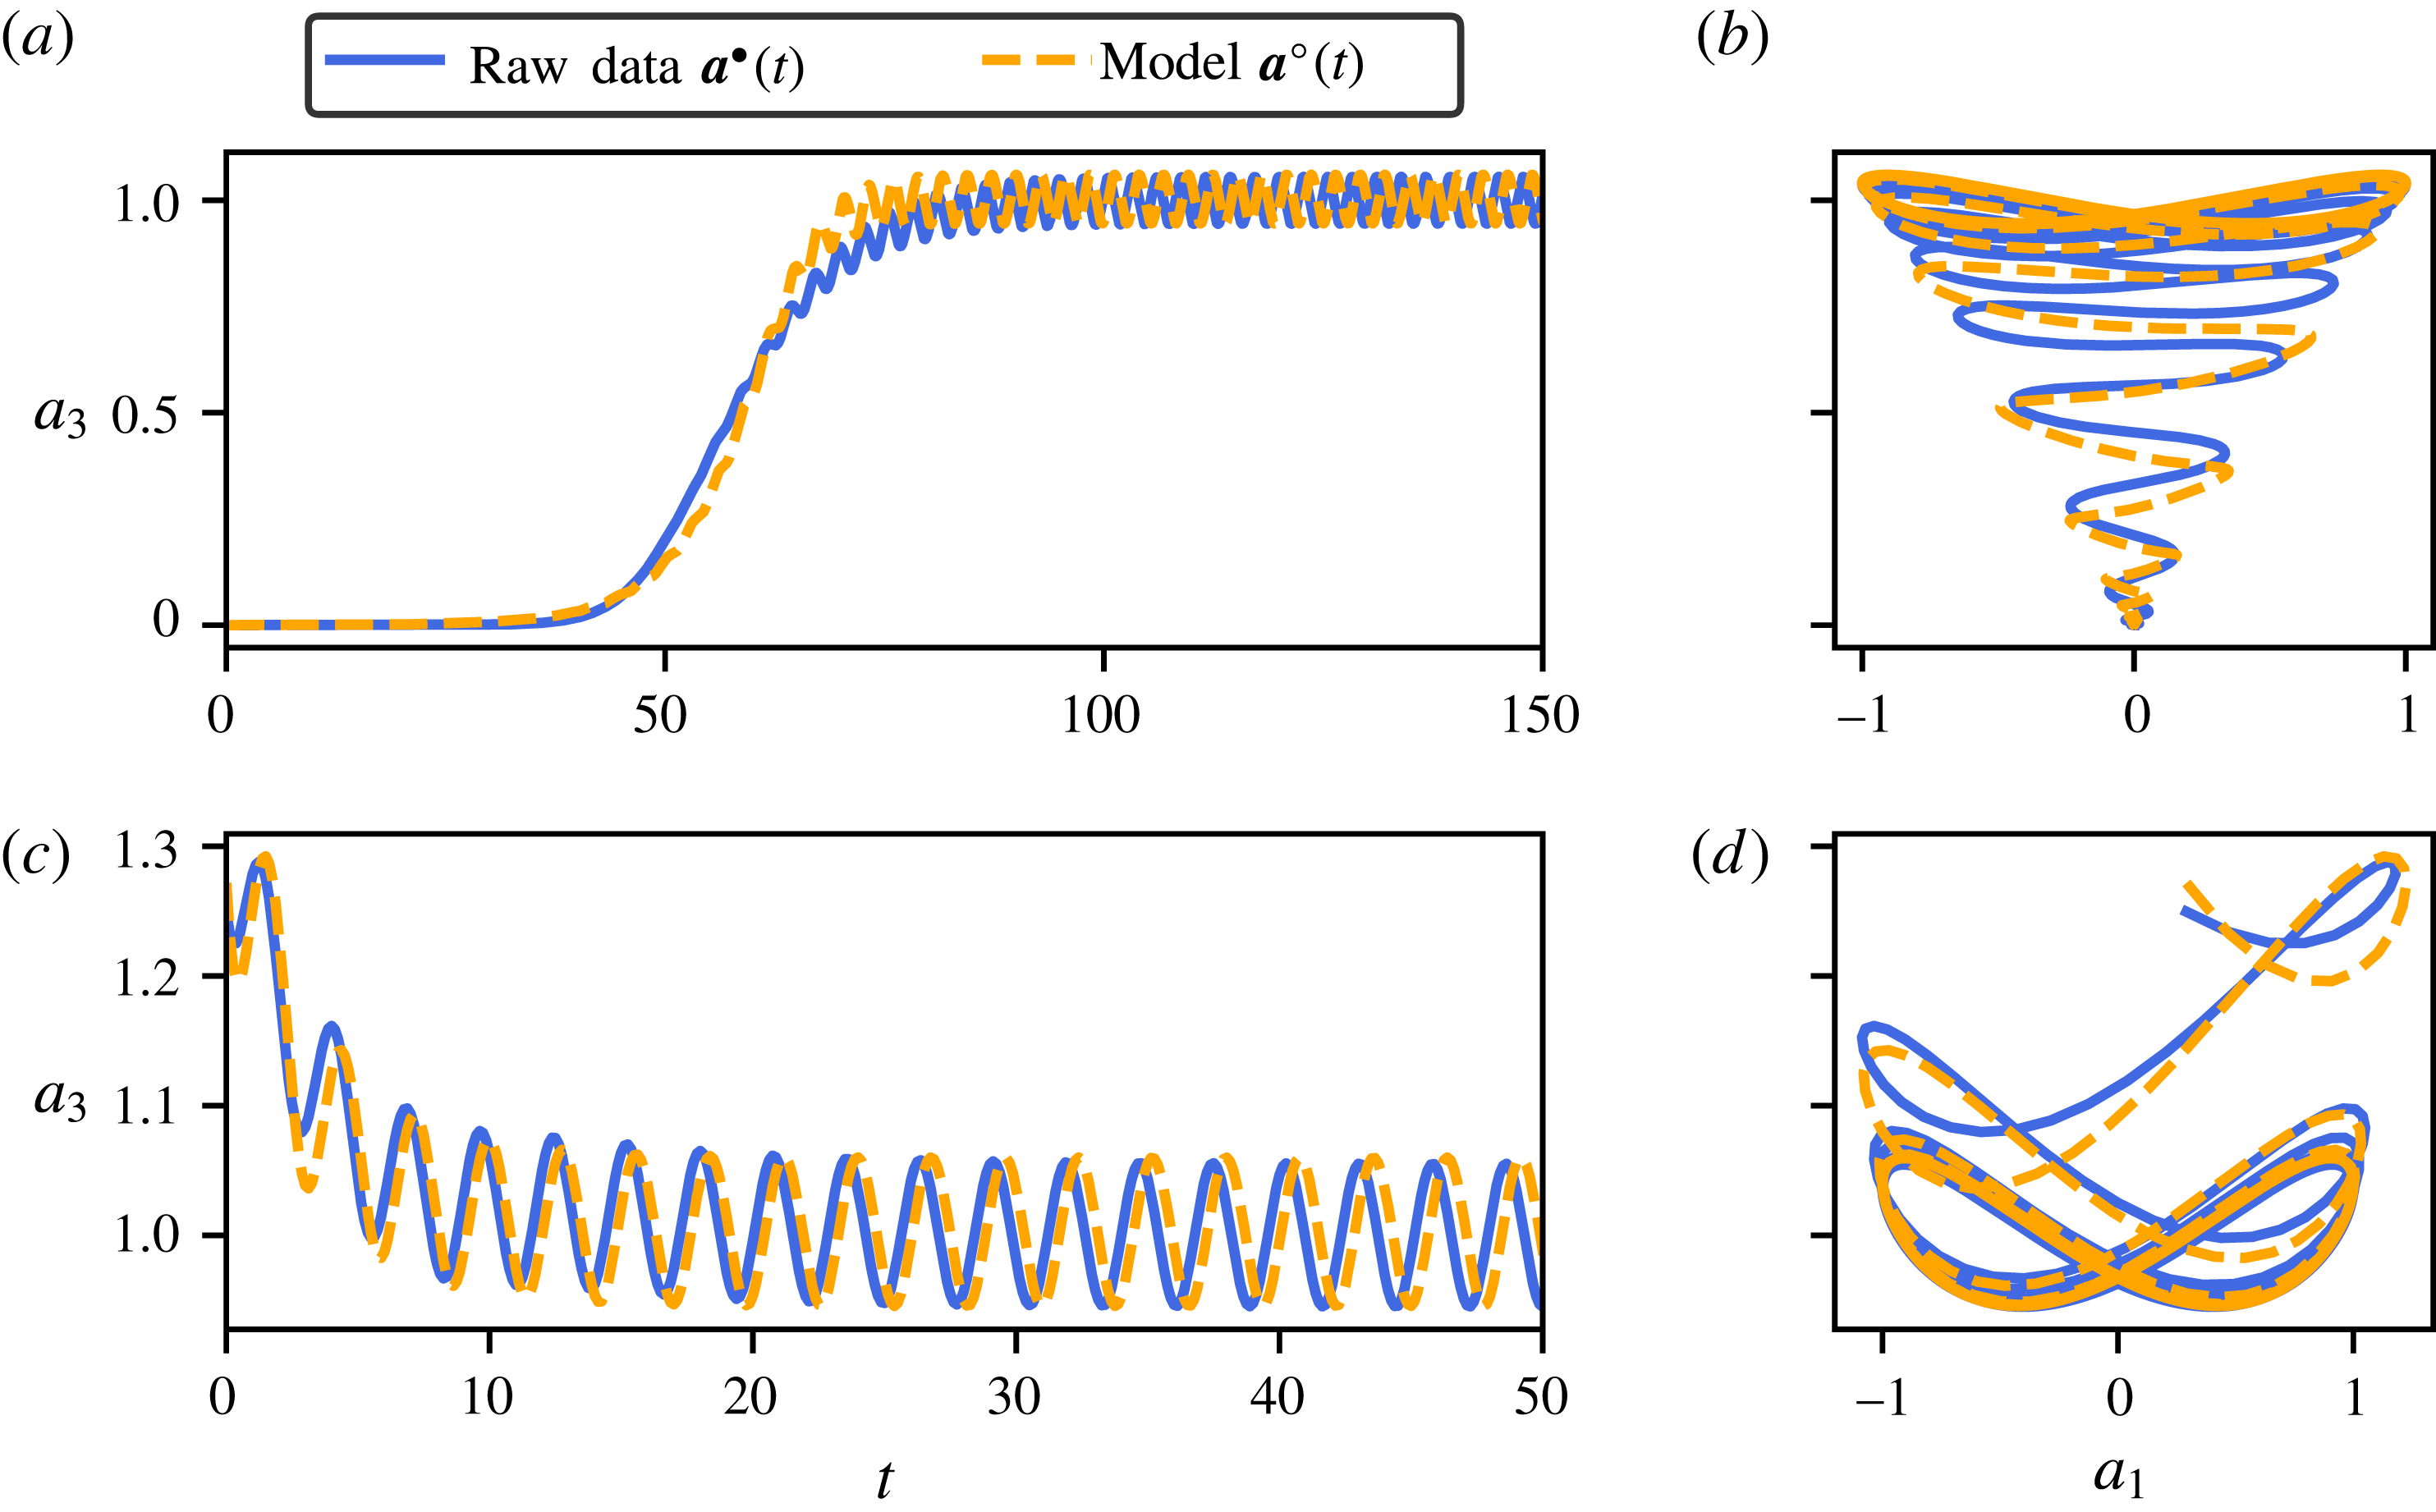
Figure 10(a,c) compares the predicted time evolution of
 $a_{3}^{\circ }(t)$
against the evolution of
 $a_{3}^{\bullet }(t)$
obtained from direct numerical simulation, whereas figure 10(b,d) depicts the associated trajectories projected onto the (
 $a_{1}$
,
 $a_{3}$
) phase plane. Along with the dynamics of
 $a_{1}$
and
 $a_{2}$
being correctly captured by the dynamical system (4.9), the nonlinear algebraic measurement equation (4.11) correctly infers the evolution of
 $a_{3}$
. It is clear from these results that the low-dimensional descriptor system identified in the present work is one of the simplest and yet most accurate and physically interpretable low-order models available in the literature to reproduce the dynamics of the cylinder flow at
 $Re=100$
.
(a,c) Comparison of the time evolution of
 $a_{3}$
(i.e. the drag coefficient) obtained from direct numerical simulation and predicted by the identified low-dimensional dynamical system. (b,d) Trajectories of the true system and the model on the phase plane
 $(a_{1},a_{3})$
. For (a,b) the initial condition is close to the linearly unstable fixed point
 $\boldsymbol{u}_{b}$
, given by
 $\boldsymbol{a}=\mathbf{0}$
. Panels (c,d) use the cross-validation dataset for which the initial condition used in the direct numerical simulation is the same as described in figure 9.

4.2 Full-state estimation
The descriptor system identified in the previous section provides valuable information and accurately predicts the dynamics of our sensor. However, it does not allow us to directly infer the corresponding flow field. In order to reconstruct the flow field, we must supplement our low-dimensional model with a full-state estimator
 $$\begin{eqnarray}\boldsymbol{u}(\boldsymbol{x},t)=\boldsymbol{h}(\boldsymbol{a}).\end{eqnarray}$$
Formally, this full-state estimator
 $\boldsymbol{h}$
is a nonlinear mapping from the low-dimensional feature space to the high-dimensional physical space. In the rest of this section, four different estimators will be employed:
(i) a first estimator based on locally linear mapping (LLM) using the full-state snapshots from the training dataset to reconstruct those of the testing dataset,
(ii) a second estimator based on LLM outputting the estimated amplitudes of the first five POD modes,
(iii) a third estimator based on LLM outputting the estimated amplitudes of the first twenty-five POD modes,
(iv) a fourth estimator using the feature-based modal expansion described in § 3.3.2.
Note that for the fourth estimator, we employ generalized feature modes. Given a sparse nonlinear model, this generalized feature-based modal decomposition is based on modal structures that are most correlated with specific terms in the dynamics. We define a new feature vector
 $\unicode[STIX]{x1D736}$
containing all of the non-zero terms identified on the right-hand side of the sparse model:
 $$\begin{eqnarray}\unicode[STIX]{x1D736}\triangleq \left[\begin{array}{@{}c@{}}a_{1}\\ a_{2}\\ a_{1}^{2}+a_{2}^{2}\\ 2a_{1}a_{2}\\ a_{1}^{2}-a_{2}^{2}\end{array}\right]=\left[\begin{array}{@{}c@{}}\unicode[STIX]{x1D6FC}_{1}\\ \unicode[STIX]{x1D6FC}_{2}\\ \unicode[STIX]{x1D6FC}_{3}\\ \unicode[STIX]{x1D6FC}_{4}\\ \unicode[STIX]{x1D6FC}_{5}\end{array}\right].\end{eqnarray}$$
The feature-based modal expansion considered hereafter then reads
 $$\begin{eqnarray}\boldsymbol{u}(\boldsymbol{x},t)=\boldsymbol{u}_{0}(\boldsymbol{x})+\mathop{\sum }_{i=1}^{5}\unicode[STIX]{x1D6FC}_{i}(t)\boldsymbol{u}_{i}(\boldsymbol{x})+\boldsymbol{r}(\boldsymbol{x},t),\end{eqnarray}$$
where
 $\boldsymbol{u}_{0}(\boldsymbol{x})$
is the linearly unstable steady solution to the Navier–Stokes equations and
 $\boldsymbol{r}(\boldsymbol{x},t)$
is the residual. The different feature modes
 $\boldsymbol{u}_{i}(\boldsymbol{x})$
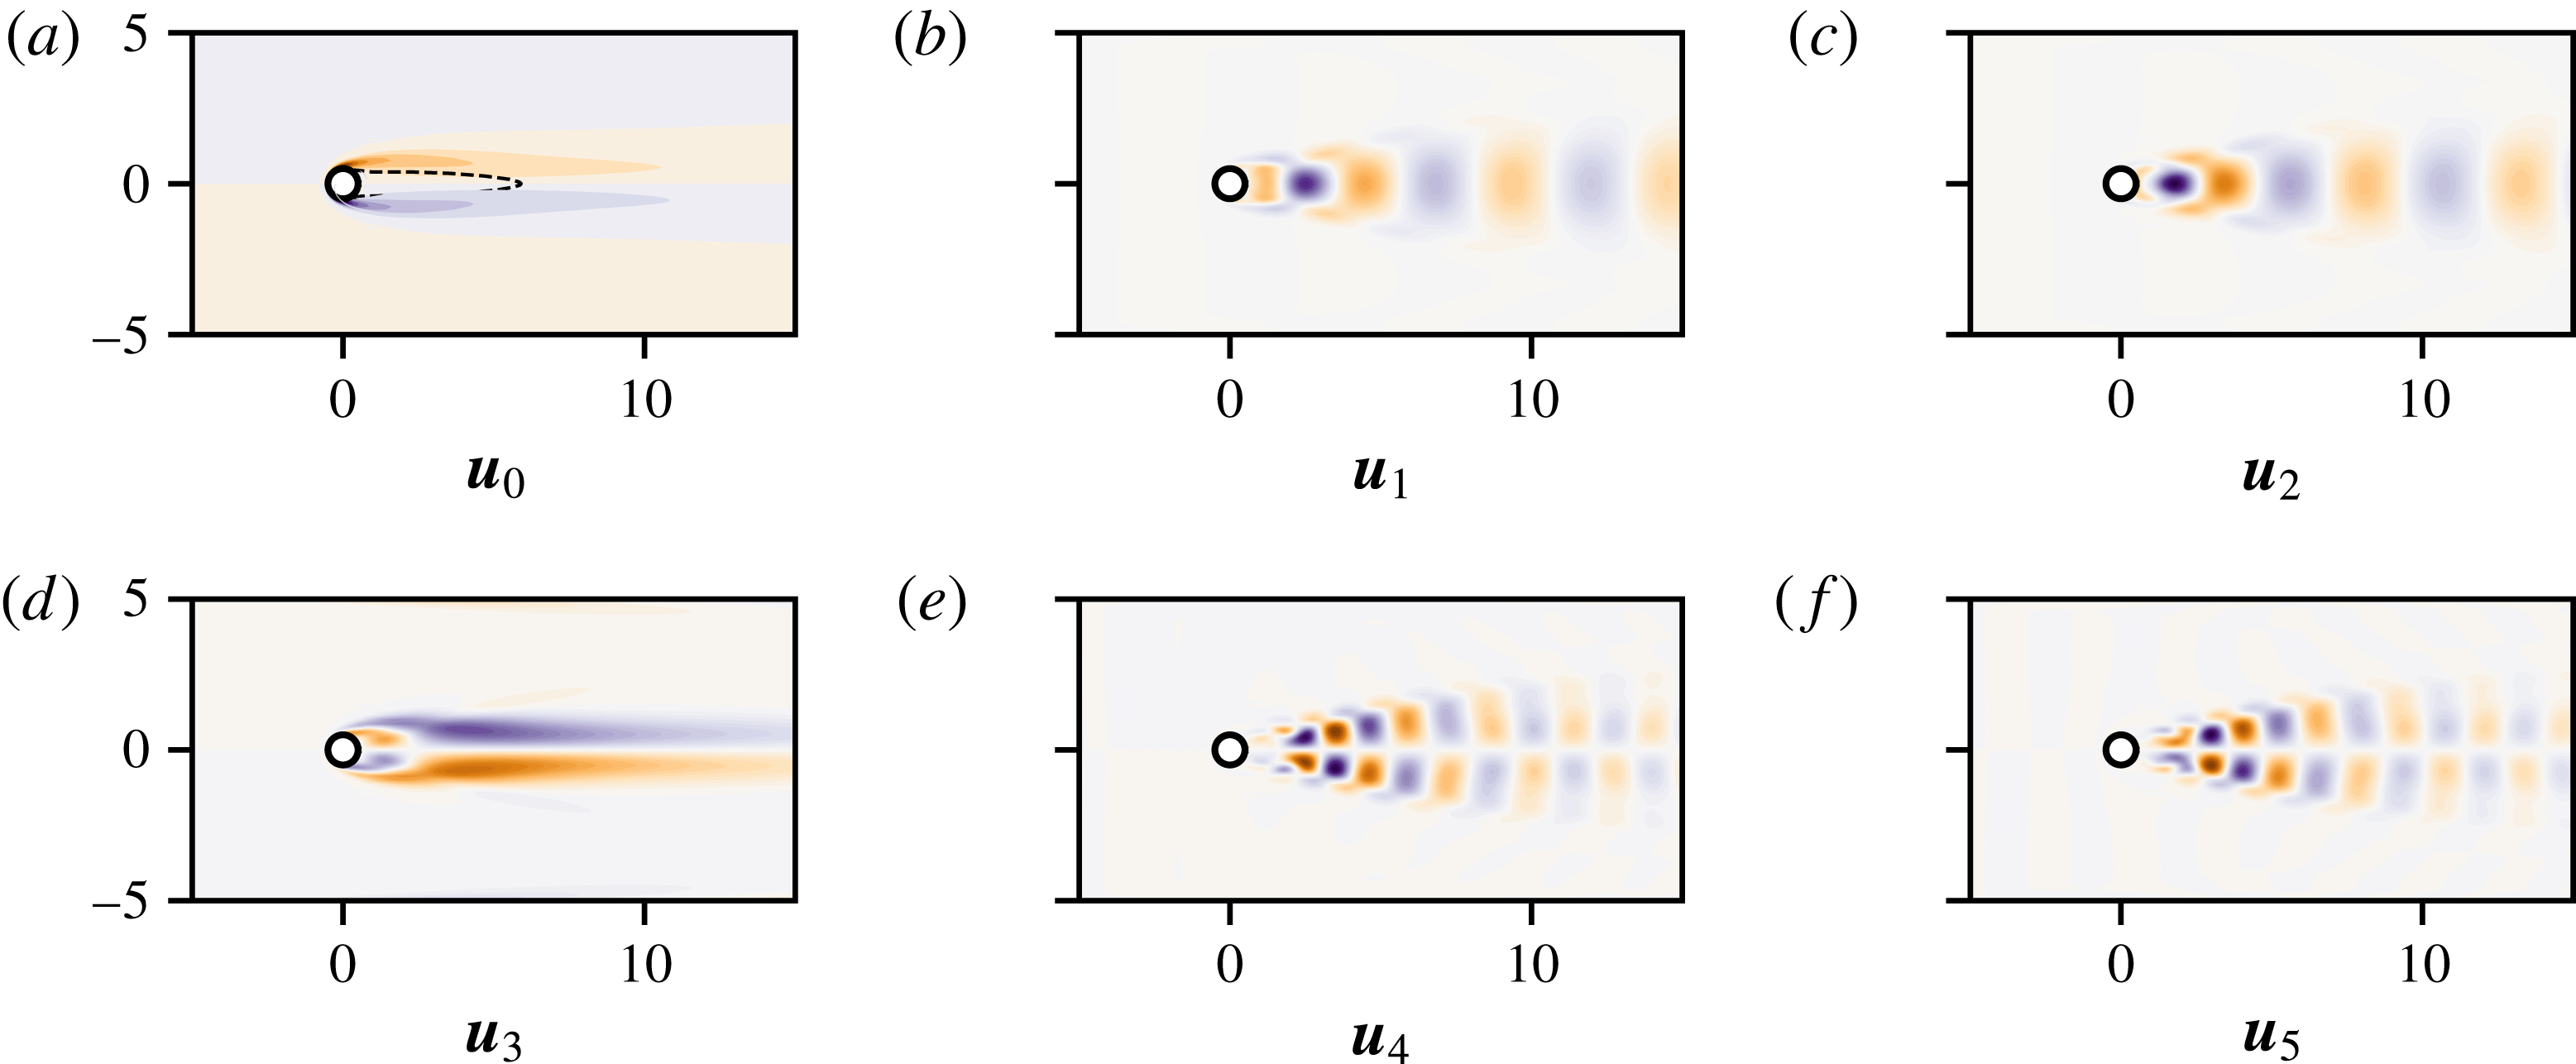
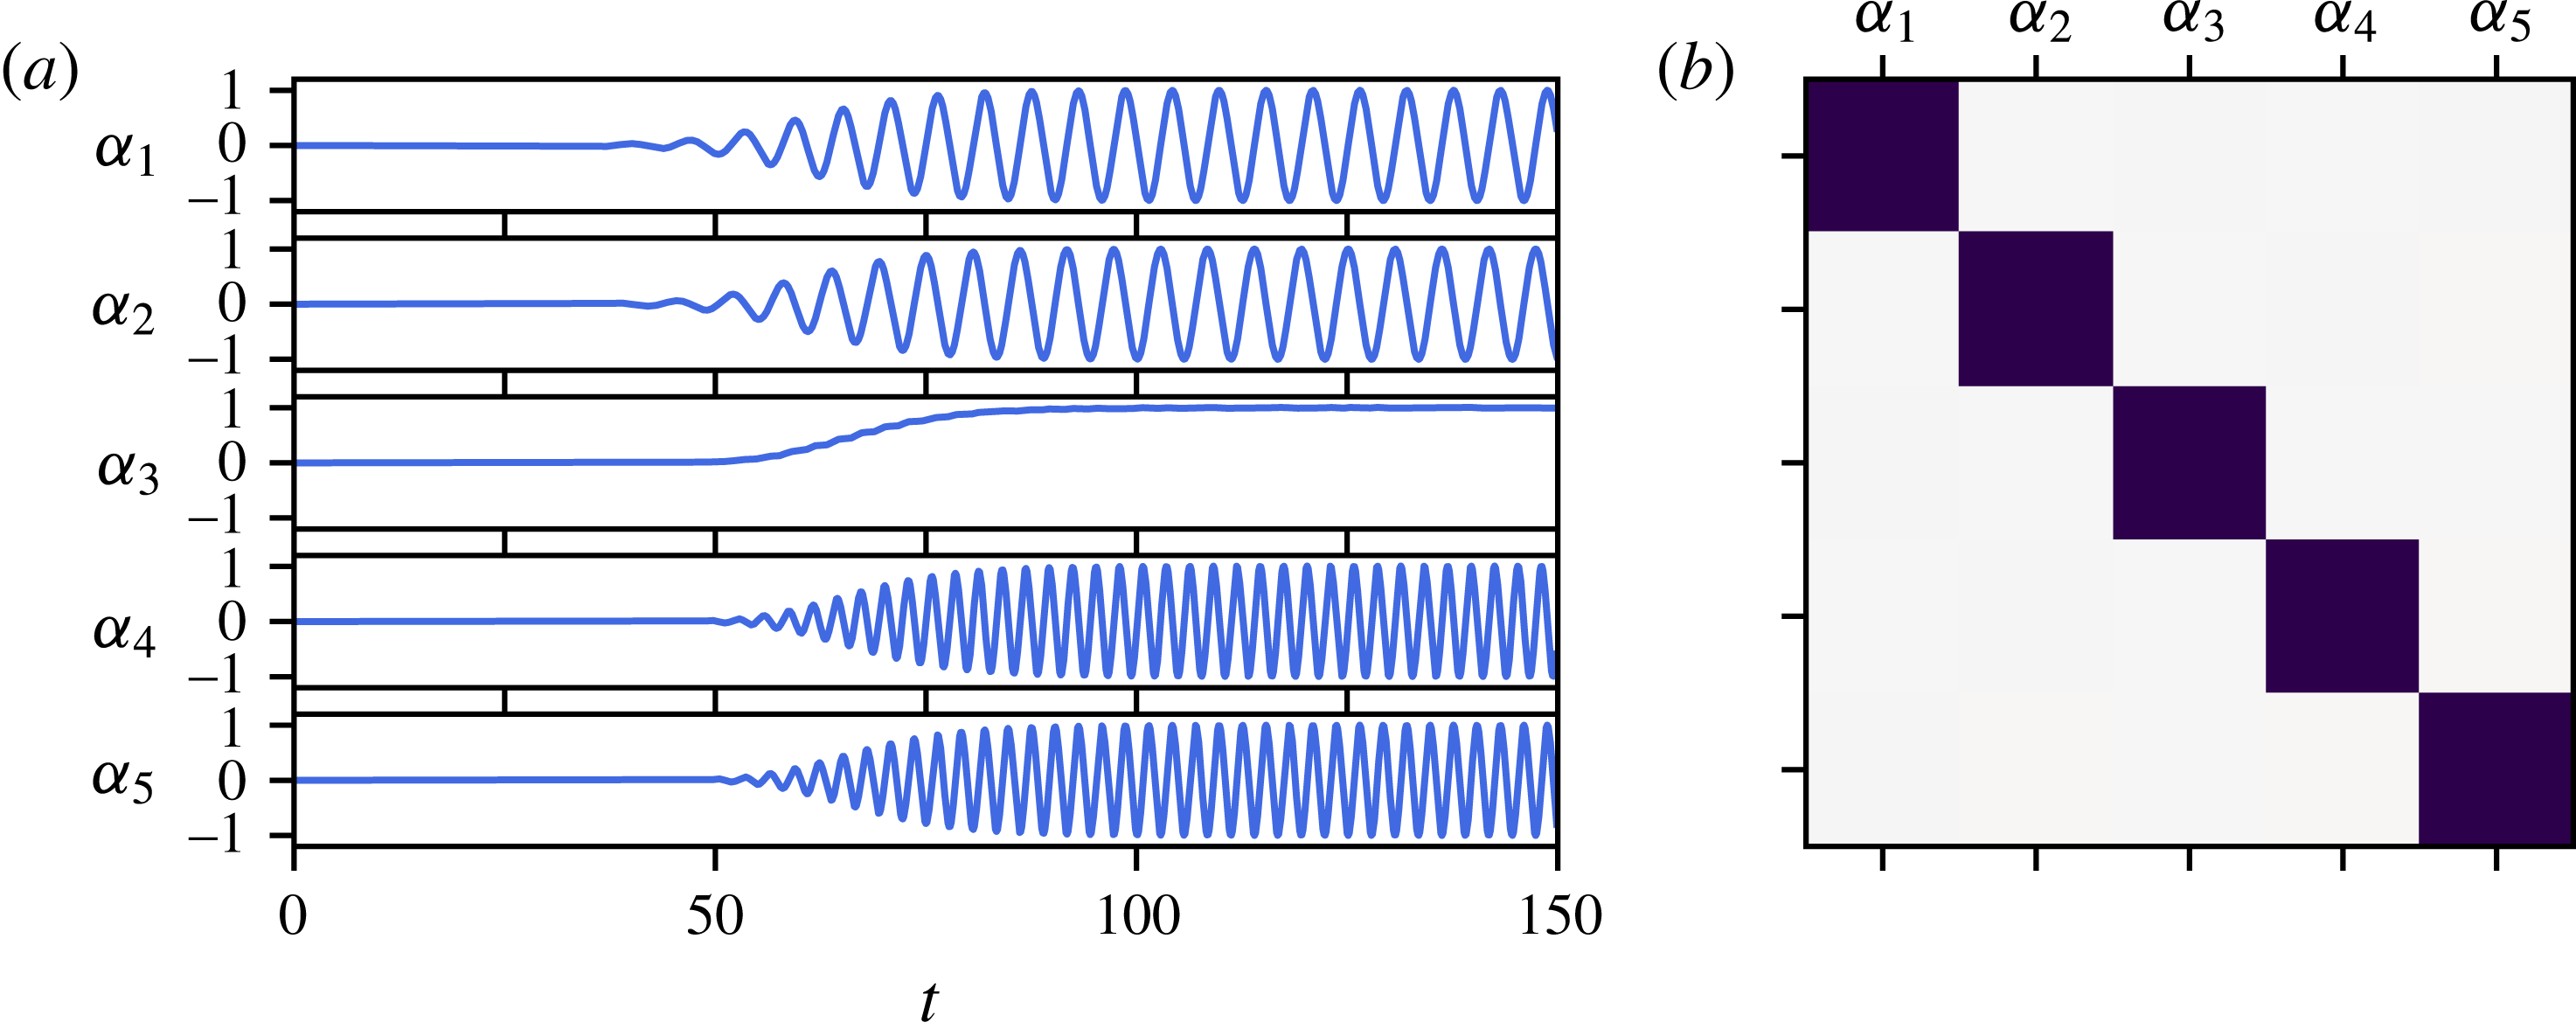
have been computed following the stochastic estimation procedure described in § 3.3. The associated vorticity fields are shown in figure 11, while the time evolution of the different basis coefficients
 $\unicode[STIX]{x1D6FC}_{i}(t)$
is depicted in figure 12(a). Figure 12(b) shows the cross-correlation matrix of these signals. Given its diagonal structure, it is clear that the different basis coefficients
 $\unicode[STIX]{x1D6FC}_{i}(t)$
are uncorrelated one to another. For the cylinder flow, these feature modes are very similar to the classical POD modes. A key advantage over POD modes is that the present modes are directly interpretable as being the coherent structures most correlated with our different measurements and the sparse nonlinear interaction terms in the model.
Panel (a) depicts the vorticity field of the linearly unstable base flow, while the dashed line highlights the spatial extent of the reversed flow region. Panels (b–e) show the vorticity field of the feature modes associated with the extended feature vector
 $\unicode[STIX]{x1D736}$
.

(a) Time evolution of the different basis coefficients used in the feature-based modal expansion (4.14). (b) Corresponding cross-correlation matrix computed using Pearson’s
 $\unicode[STIX]{x1D70C}$
linear correlation metric. Dark squares indicate that
 $\unicode[STIX]{x1D6FC}_{i}$
and
 $\unicode[STIX]{x1D6FC}_{j}$
are strongly correlated (
 $\unicode[STIX]{x1D70C}=1$
), while white squares indicate they are uncorrelated (
 $\unicode[STIX]{x1D70C}=0$
).

Time evolution of the relative estimation error for the different estimators considered. In (b,c),
 $T_{s}^{(PIV)}$
is the sampling period of the non-time-resolved PIV-like snapshots forming the training dataset while
 $T_{s}^{(Lift)}$
refers to the sampling period of the lift measurement.

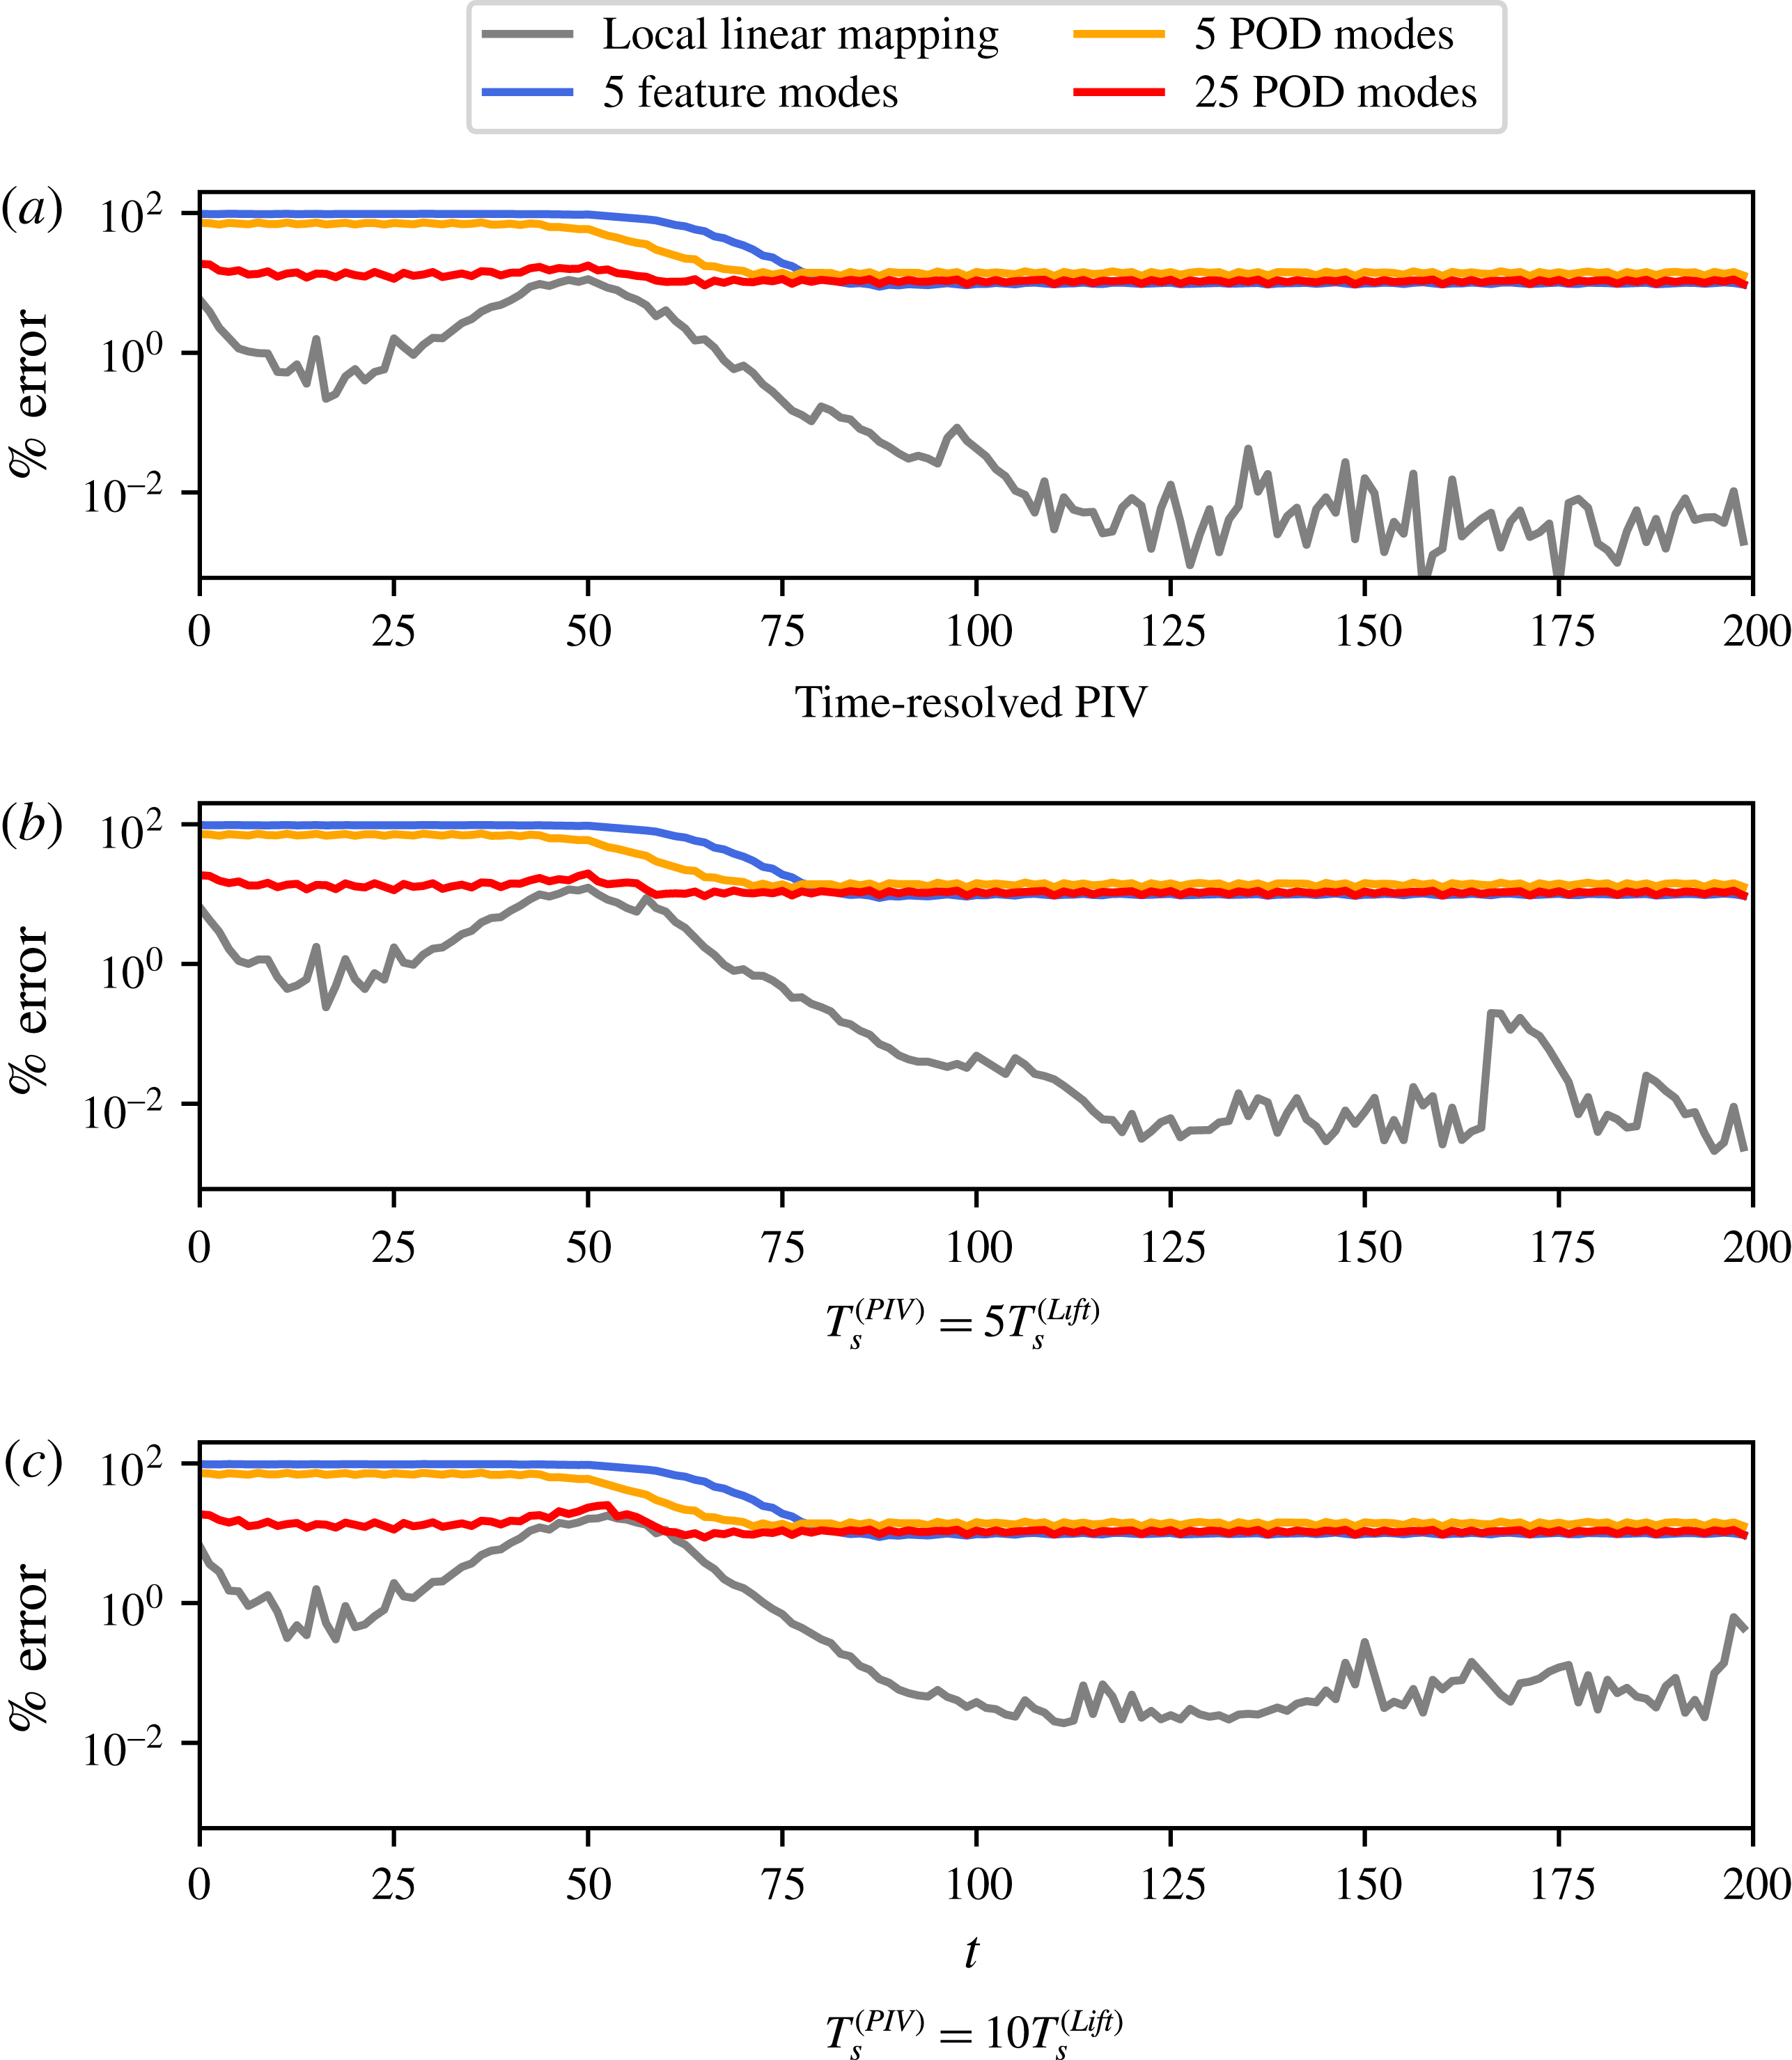
Figure 13 compares the evolution of the relative estimation error for the different estimators considered. Different sampling frequencies for the PIV-like snapshots forming the training dataset are used in figure 13(b,c). The flow estimator based on the local linear mapping (LLM) largely outperforms the other estimators. Its accurate performance, on average two to three orders of magnitude more accurate than the other estimators considered, results from the fact that LLM leverages all of the information contained in the different snapshots matrices used whereas the different modal expansions only provide low-rank approximations of these same matrices. In all cases, it has to be noted that increasing the sampling period
 $T_{s}^{(PIV)}$
between two consecutive PIV-like snapshots when creating the training dataset hardly influences the performance of the different estimators. Moreover, it can be observed that the performance of the feature-based modal expansion is on a par with the LLM procedure outputting the amplitudes of the first five POD modes. Finally, increasing the number of POD modes considered is only beneficial during the early stage of transition while leaving the accuracy of the POD-based estimator almost unchanged once the system has reached a statistically stationary state.
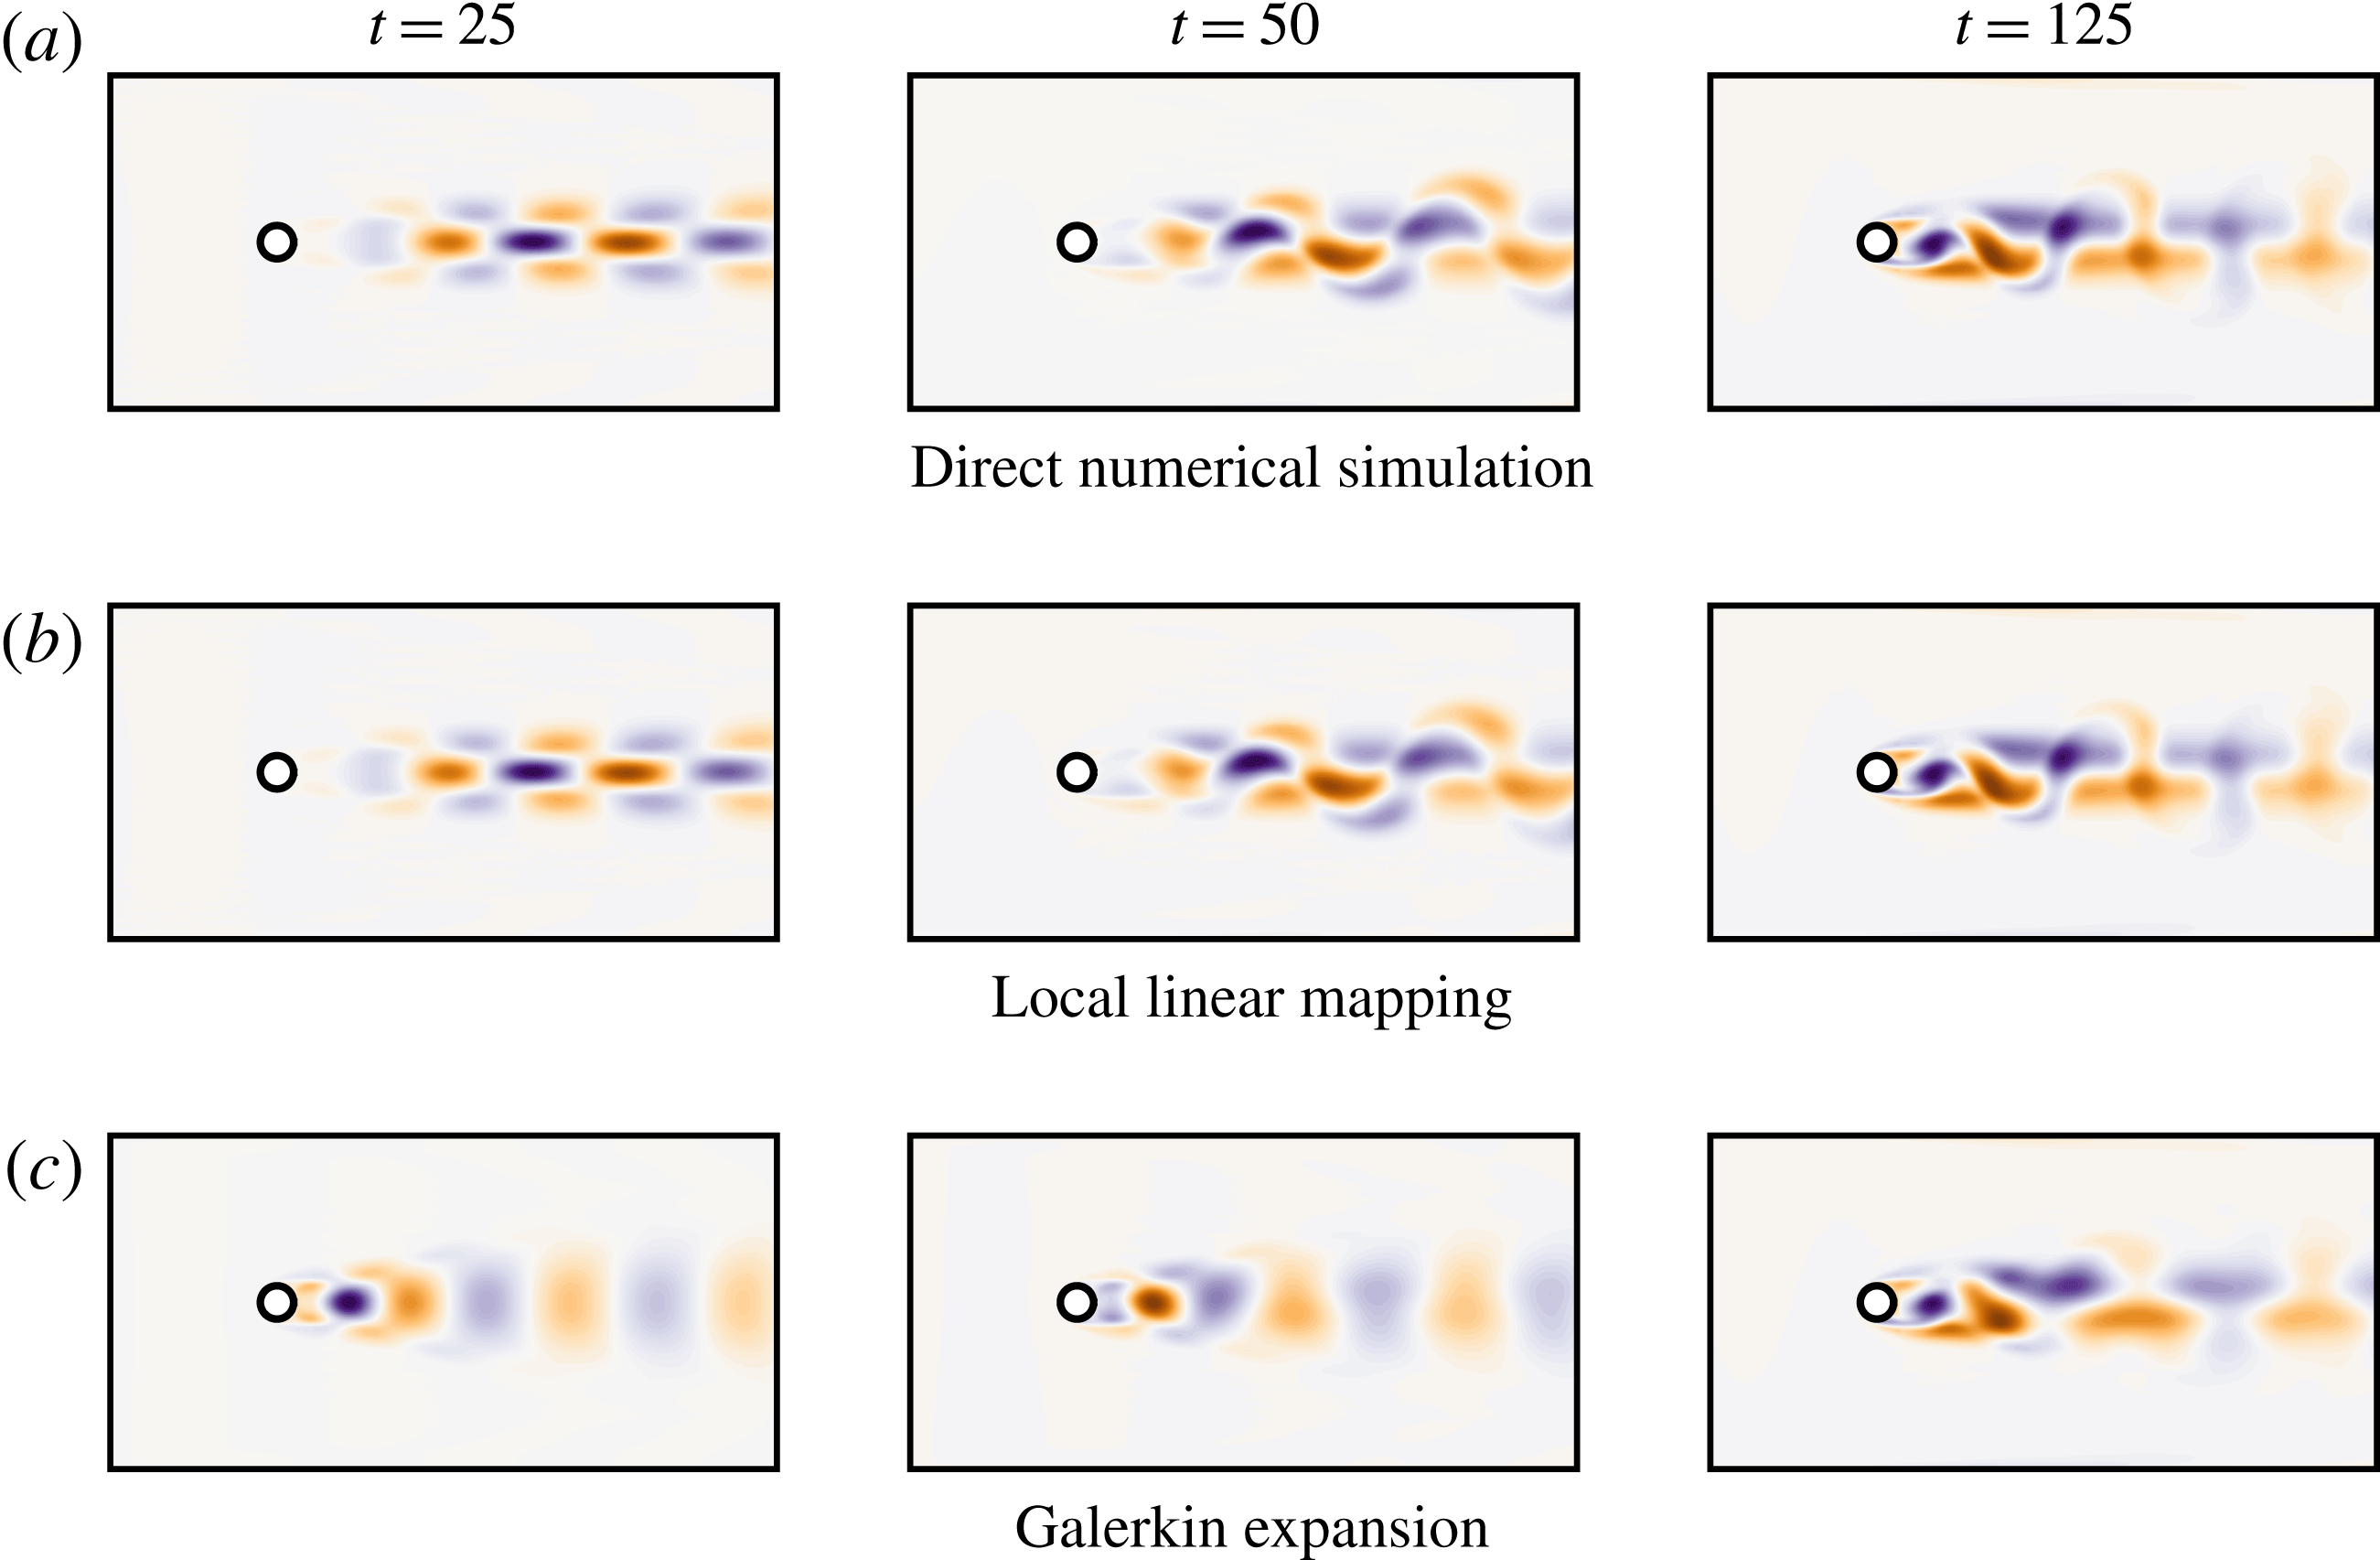
Figure 14(b,c) depicts the estimated vorticity field, with the base flow subtracted, at different instants in time and compare them with the true vorticity field obtained from direct numerical simulation in figure 14(a). As expected, the vorticity fields estimated by the local linear mapping (with full-state PIV-like snapshots) are in much better agreement, from a physical and kinematic point of view, than the ones obtained by the other low-dimensional estimators. This is especially pronounced during the period of exponential growth of the linear instability and at the onset of nonlinear saturation during which the local linear mapping correctly captures the deformation and distortion of the flow structure. In contrast, low-rank modal expansions are notorious for their inability to capture such mode deformation and/or changes in operating conditions. Given that the POD modes and generalized feature modes used in this work essentially approximate the flow structure once the system has reached the periodic limit cycle, it is thus expected that they provide only a very crude estimation of the flow structures when the system evolves in the vicinity of the linearly unstable base flow. This inability of a modal expansion to easily address mode deformation is one of its key limitations and is the principal reason why the local linear mapping strategy using full-state PIV-like snapshots should be preferred. Combining the descriptor system identified in § 4.1 with the local linear flow estimator finally allows us to construct a two-degrees-of-freedom reduced-order model of the cylinder flow, having an unprecedented accuracy.
Comparison of the vorticity fields at different instants of time obtained (a) from direct numerical simulation, (b) from the local linear mapping procedure and (c) from the feature-based modal expansion. Note that the vorticity field of the linearly unstable base flow has been subtracted in order to highlight the perturbative vorticity field.

5 Discussion
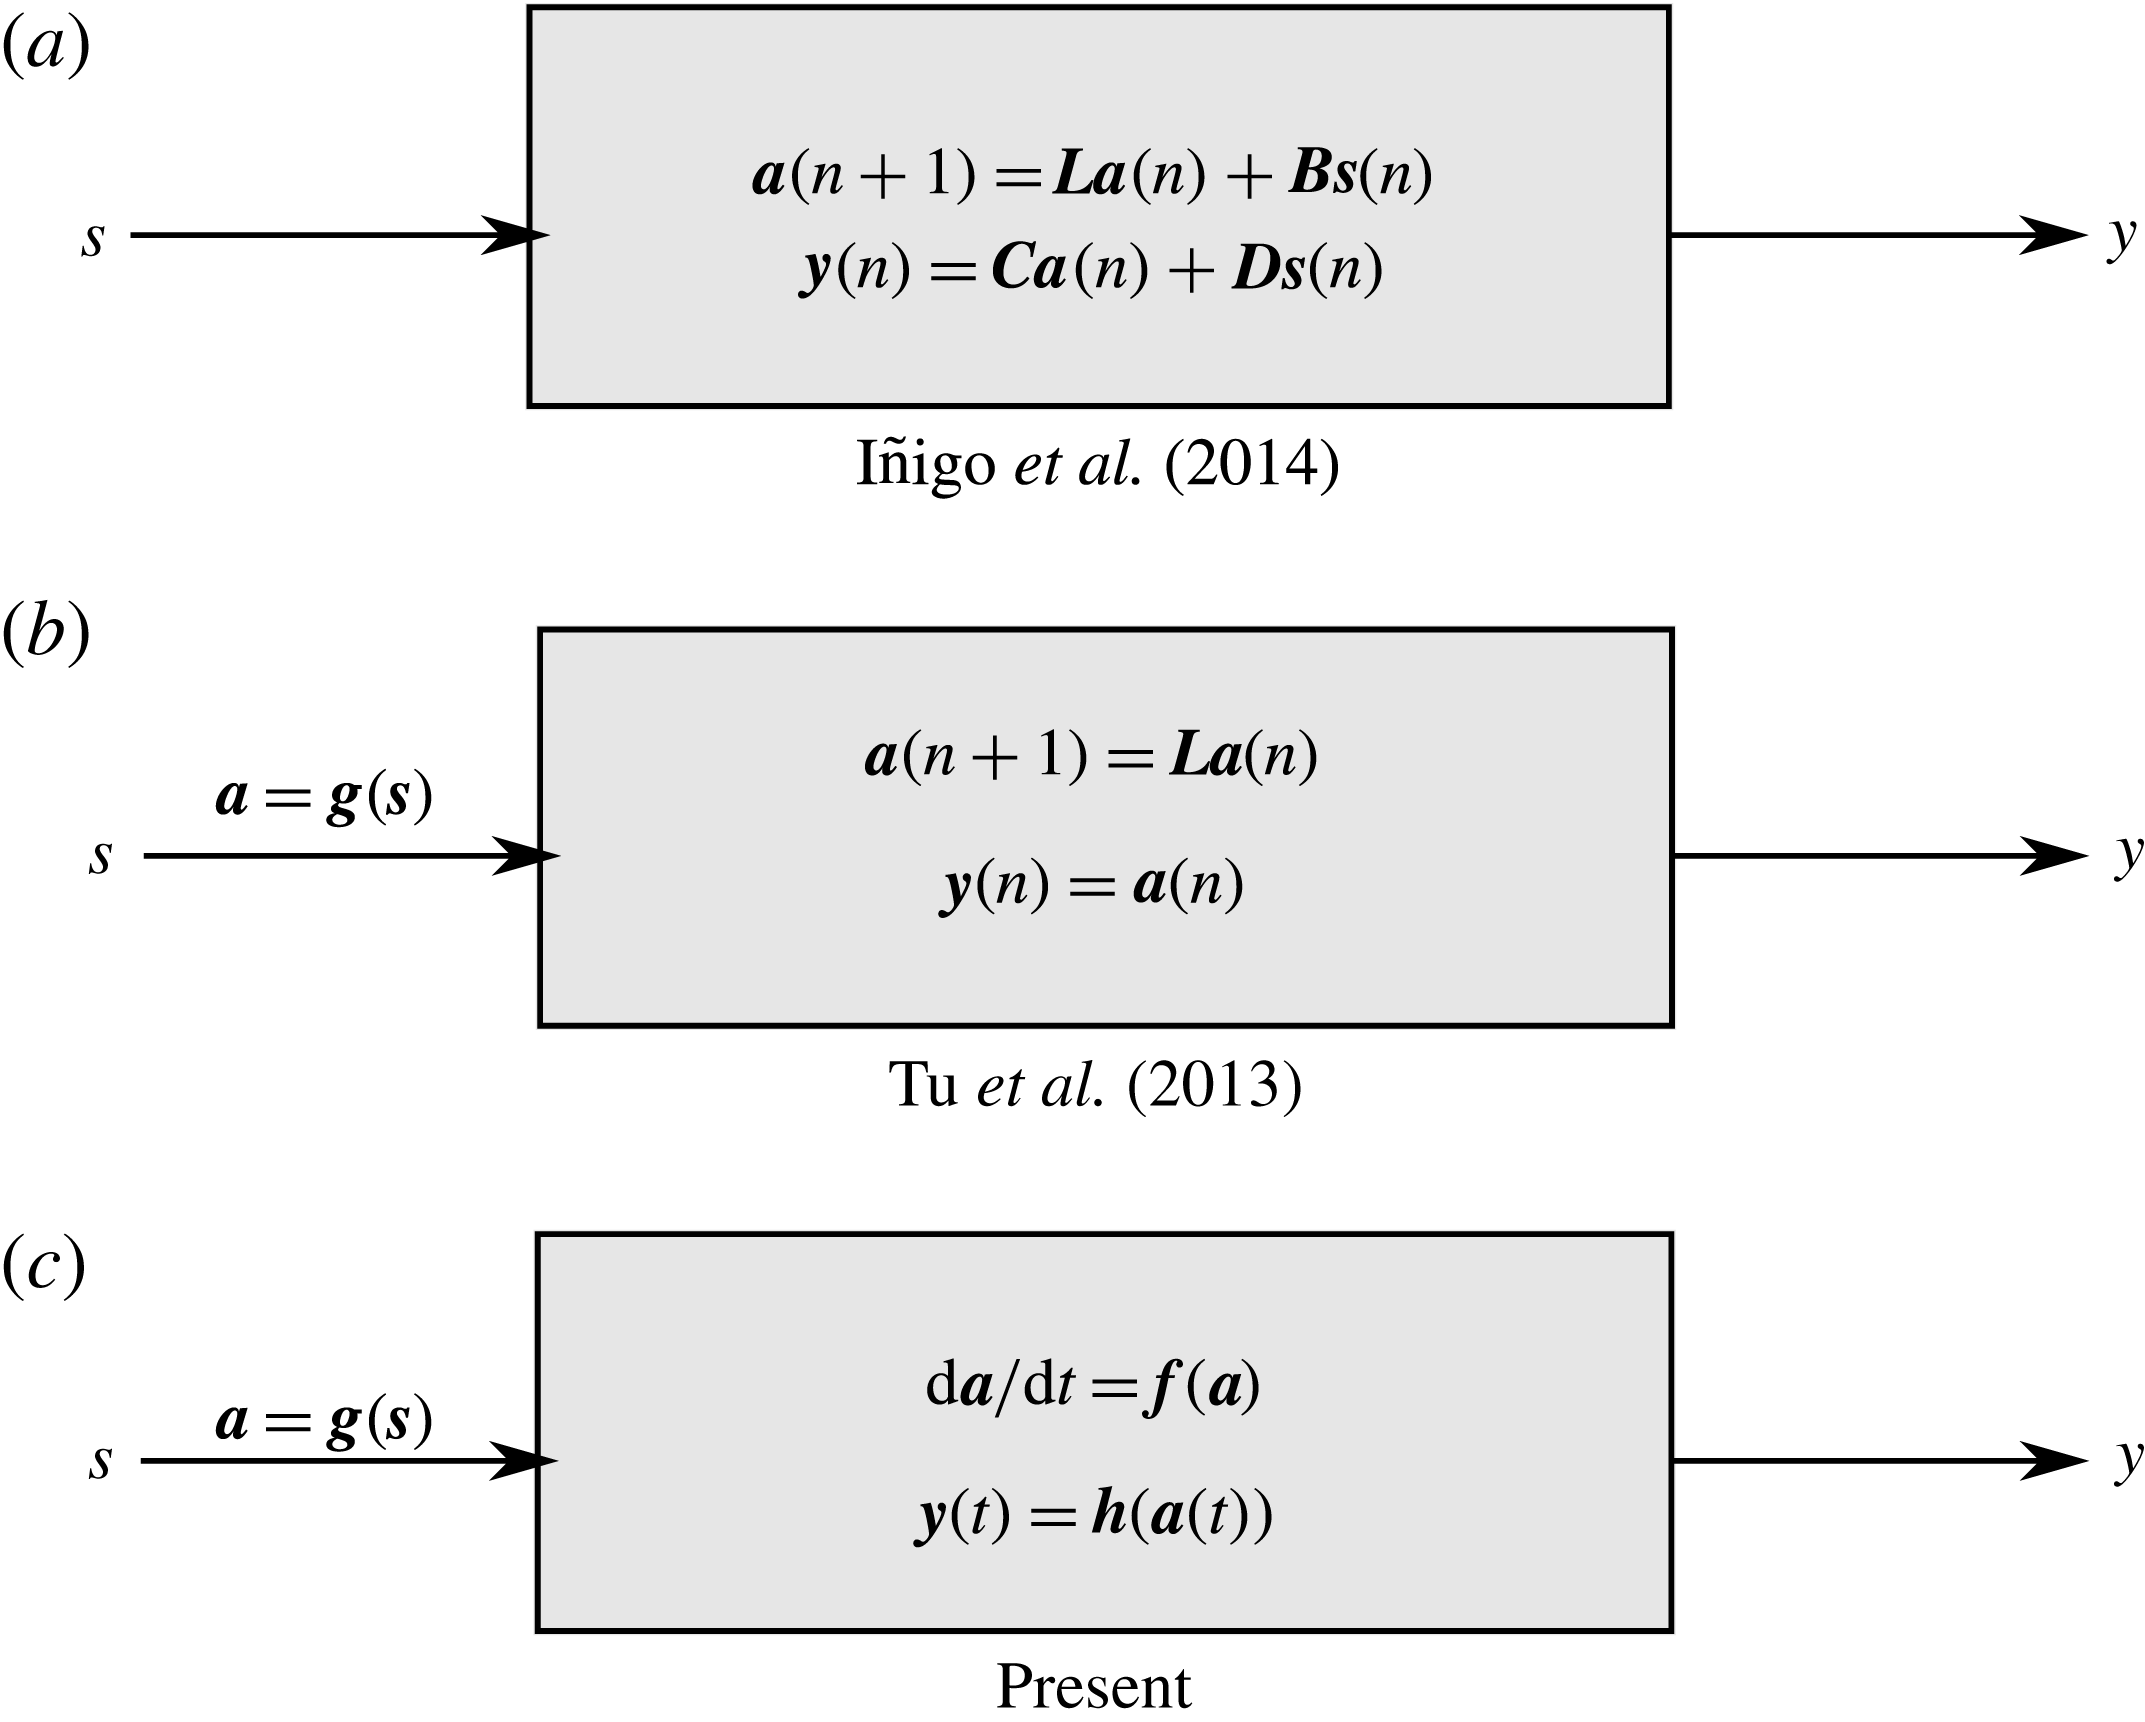
In this work, the instantaneous lift force measurement had been used as our single sensor. Here, the problem of sensor selection for more complex flow configurations is discussed in § 5.1. Moreover, possible connections with the works of Tu et al. (Reference Tu, Griffin, Hart, Rowley, Cattafesta and Ukeiley2013) and Iñigo, Sipp & Schmid (Reference Iñigo, Sipp and Schmid2014) are highlighted in § 5.2.
5.1 Optimal sensor selection
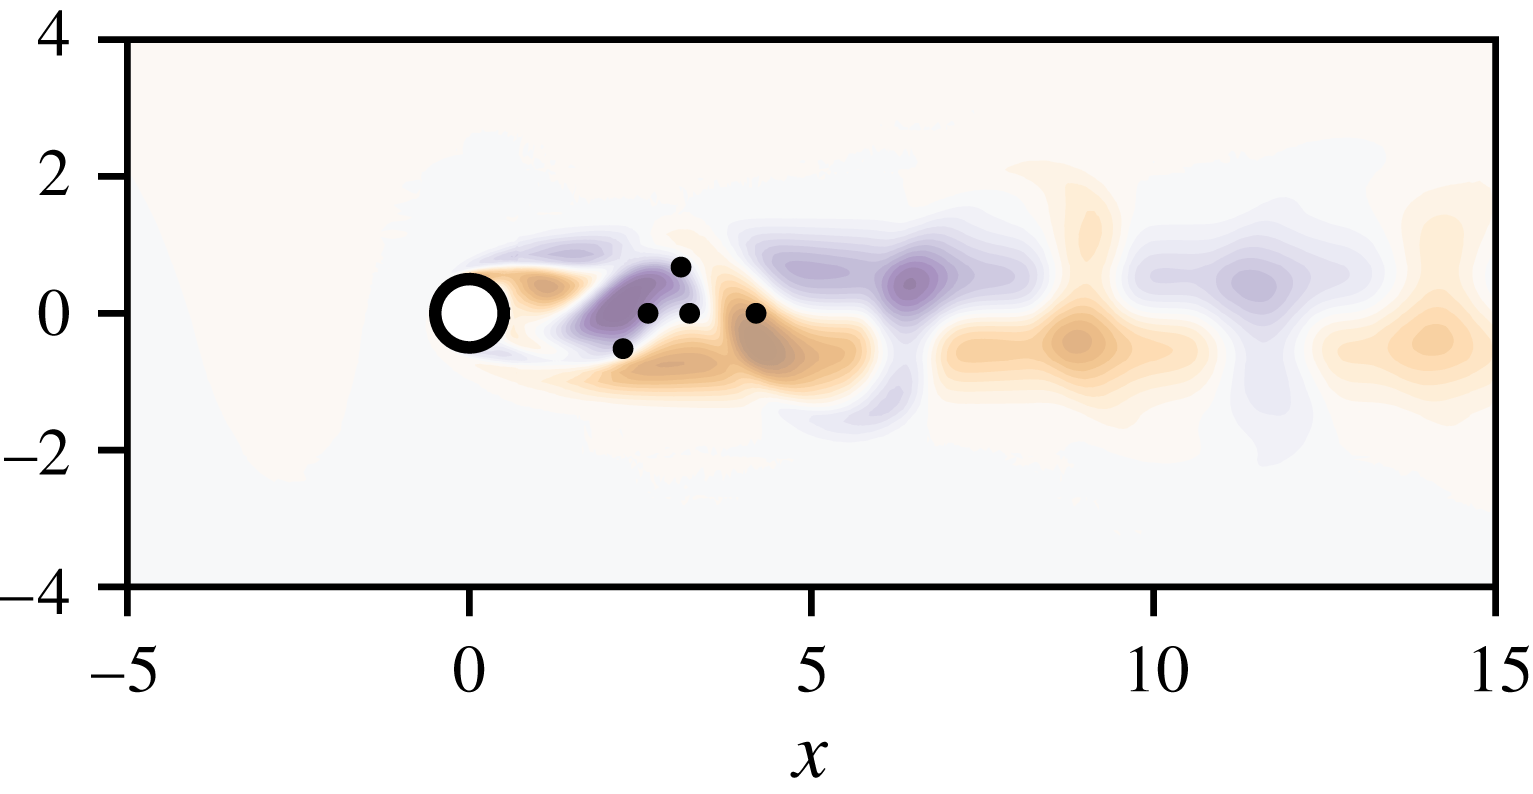
It has been implicitly assumed so far that it is possible to choose a single sensor measurement whose time series contains sufficient information to fully characterize the dynamics of the flow under consideration. While using the instantaneous lift coefficient is a natural choice for the two-dimensional cylinder flow, it may not be as straightforward for more complex flow configurations to determine which quantity to monitor, nor where to place the required sensors as to obtain the most informative measurements. With the recent advances in machine learning and sparse sensing, a considerable body of work has emerged in the literature about near-optimal sensor placement for estimation or reconstruction tasks of high-dimensional systems. One can cite for instance the recent work of Manohar et al. (Reference Manohar, Brunton, Kutz and Brunton2017) on data-driven sparse sensor placement. Given prior velocity field snapshots, it is possible to use a combination of POD/SVD and QR factorization with pivots of the collected snapshots matrix. The POD analysis allows the user to determine the rank of the snapshot matrix (i.e. the dimension of the low-dimensional model to be considered), while the pivots of the QR factorization then provide the spatial location of the most informative sensors with which to optimally reconstruct the high-dimensional state of the system (Drmac & Gugercin Reference Drmac and Gugercin2016; Manohar et al.
Reference Manohar, Brunton, Kutz and Brunton2017). Figure 15 depicts the locations of the first five near-optimal streamwise velocity sensors identified by this approach for the present flow configuration. Three of these sensors are located along the
 $y=0$
line, monitoring the mean flow distortion. The remaining two sensors are located approximately at
 $y\simeq \pm 0.5$
along a diagonal, capturing the amplitude and phase of the vortex shedding. These velocity measurements may then form the initial measurement vector
 $\boldsymbol{s}$
required for the low-dimensional modelling methodology proposed herein. For more details about data-driven sensor placement, interested readers are referred to Manohar et al. (Reference Manohar, Brunton, Kutz and Brunton2017) and numerous references therein.
Location of the first five near-optimal streamwise velocity sensors identified by the algorithm proposed in Manohar et al. (Reference Manohar, Brunton, Kutz and Brunton2017). As before, the shaded contours depict the base flow subtracted vorticity field.

Block representations of the full-state reconstruction function described in (a) Iñigo et al. (Reference Iñigo, Sipp and Schmid2014), (b) Tu et al. (Reference Tu, Griffin, Hart, Rowley, Cattafesta and Ukeiley2013) and (c) presented herein.

5.2 Comparisons with previous works
The low-dimensional modelling strategy proposed herein shares some connections with the recent works of Tu et al. (Reference Tu, Griffin, Hart, Rowley, Cattafesta and Ukeiley2013) and Iñigo et al. (Reference Iñigo, Sipp and Schmid2014). All three approaches are summarized as block diagrams in figure 16. For the sake of simplicity, the block diagrams depicted in figure 16 all use the present notation where:
(1)
$\boldsymbol{s}$
denotes the input sensor measurements vector,(2)
$\boldsymbol{a}$
denotes the state vector of the low-dimensional model,(3)
$\boldsymbol{y}$
denotes the output vector.


In Tu et al. (Reference Tu, Griffin, Hart, Rowley, Cattafesta and Ukeiley2013) and Iñigo et al. (Reference Iñigo, Sipp and Schmid2014), this output
 $\boldsymbol{y}$
corresponds to the coefficients of POD modes used to reconstruct the velocity snapshots. In the present case,
 $\boldsymbol{y}$
can denote the coefficients of the POD modes, those of the feature-based modes, or directly the reconstructed high-dimensional snapshot, depending on the particular choice made by the user. All three approaches thus have the same input and same output. They essentially differ on how one maps the input vector
 $\boldsymbol{s}$
to the output vector
 $\boldsymbol{y}$
. Iñigo et al. (Reference Iñigo, Sipp and Schmid2014) use the sensor measurement vector
 $\boldsymbol{s}$
as the input to a multiple-input-multiple-output (MIMO) linear time invariant (LTI) dynamical system obtained using linear subspace identification techniques. The vector
 $\boldsymbol{y}$
of POD coefficients used to reconstruct the high-dimensional velocity snapshot then comes as the output of this MIMO LTI system. Tu et al. (Reference Tu, Griffin, Hart, Rowley, Cattafesta and Ukeiley2013) first define a mapping
 $\boldsymbol{g}$
from the sensor measurement vector
 $\boldsymbol{s}$
to the state
 $\boldsymbol{a}$
of the low-dimensional system using a multiple-time-delay modified linear stochastic estimator (MTD-mLSE). Next, a discrete-time LTI system for
 $\boldsymbol{a}$
is identified using a combination of linear stochastic estimation and prior knowledge obtained from DMD analysis. The state vector
 $\boldsymbol{a}$
of this low-dimensional system is chosen as the amplitude of the leading POD modes, and the output vector
 $\boldsymbol{y}$
is simply
 $\boldsymbol{a}$
itself.
Similar to Tu et al. (Reference Tu, Griffin, Hart, Rowley, Cattafesta and Ukeiley2013), we first define a function
 $\boldsymbol{g}$
mapping the sensor measurement vector
 $\boldsymbol{s}$
to the state
 $\boldsymbol{a}$
of the low-dimensional model to be identified. In its present formulation, this mapping has been defined analytically, although one could have formally used the same technique as in Tu et al. (Reference Tu, Griffin, Hart, Rowley, Cattafesta and Ukeiley2013), i.e. defining a mapping from time-delayed lift measurements to the leading POD coefficients. As a second step, a (possibly) nonlinear continuous-time model governing the dynamics of the state
 $\boldsymbol{a}$
is identified using SINDy. Finally, the predicted state
 $\boldsymbol{a}$
is mapped to the output
 $\boldsymbol{y}$
. Depending on the choice of the user, this output
 $\boldsymbol{y}$
can denote the coefficients of a modal expansion of the velocity field (e.g. POD modes or feature-based modes) as in Tu et al. (Reference Tu, Griffin, Hart, Rowley, Cattafesta and Ukeiley2013) and Iñigo et al. (Reference Iñigo, Sipp and Schmid2014), or directly the reconstructed high-dimensional velocity snapshot obtained from the locally linear mapping procedure.
It is clear that the approach described herein and the one proposed by Tu et al. (Reference Tu, Griffin, Hart, Rowley, Cattafesta and Ukeiley2013) are closely related. The key difference is that Tu et al. (Reference Tu, Griffin, Hart, Rowley, Cattafesta and Ukeiley2013) obtain a low-dimensional model using linear stochastic estimation and prior knowledge from DMD analysis (thus assuming that the state
 $\boldsymbol{a}$
has linear dynamics), while our low-dimensional model has been obtained using sparse nonlinear system identification. In the limit of truly linear dynamics and for the same definition of the mapping
 $\boldsymbol{a}=\boldsymbol{g}(\boldsymbol{s})$
, these two approaches should thus simply be discrete-/continuous-time counterparts of each other. The same observation holds once the system reaches its limit cycle as the model identified in the present work reduces in this case to a simple harmonic oscillator. The connection with Iñigo et al. (Reference Iñigo, Sipp and Schmid2014) is not as straightforward, although the two approaches should yield similar results if the dynamics of the state
 $\boldsymbol{a}$
is indeed linear.
6 Conclusions
This work develops a new reduced-order modelling procedure for unsteady fluid flows that yields accurate nonlinear models and insight into relevant flow structures. This procedure identifies sparse nonlinear models, not on the full fluid state, but from time-resolved sensor measurements that may be realistically obtained in experiments. The sparsity of the model prevents overfitting and uncovers key nonlinear interaction terms. Although the models are data driven, they are interpretable, and it is also possible to incorporate partial prior knowledge of the physics or constraints to improve the models. If snapshots are also available, for example from non-time-resolved PIV, it is possible to estimate the full state from the sparse model using local linear mapping: the full state is interpolated between the most similar historical flow fields, based on the dynamics. It is also possible to construct a generalized modal decomposition that identifies coherent structures most correlated with each interaction term in the sparse nonlinear model.
This methodology is illustrated using the canonical two-dimensional cylinder flow at
 $Re=100$
. Despite its simplicity, this flow configuration is a prototypical example capturing the key physics of bluff body flows. Even though this study uses data from direct numerical simulations, the overall strategy is generally applicable to a real flow experiment with minor modifications. Despite their simplicity, the identified models do not suffer the same drawbacks as reduced-order models obtained from a Galerkin projection procedure, namely overestimation of the duration of transients and energy overshoots at the onset of nonlinear saturation. Instead, the identified sparse models provide simple explanations for the nonlinear saturation process of globally unstable flows. Moreover, the models are based on sensor measurements, which may include lift, drag or pressure measurements that are physically linked to the geometry. Working in these intrinsic coordinates has the potential to overcome many of the limitations of classical modal-based projection methods, including mode deformation due to moving geometry and varying parameters.
The effectiveness of the reduced-order models identified and the modularity of the methodology proposed in the present work suggest a number of exciting future directions. There is significant potential for these methods to be applied broadly to obtain interpretable reduced-order models for a range of flow configurations in simulations and experiments. For example, these sensor-based models may be applied to develop nonlinear unsteady aerodynamic models, generalizing previous linear and linear parameter varying models (Brunton, Rowley & Williams Reference Brunton, Rowley and Williams2013; Brunton, Dawson & Rowley Reference Brunton, Dawson and Rowley2014; Hemati, Dawson & Rowley Reference Hemati, Dawson and Rowley2016).
A key motivation in this work is its extension to flow control. Given a feature vector
 $\boldsymbol{a}$
and actuators characterized by a control law
 $\boldsymbol{b}(t)$
, one could use SINDy with control (SINDYc) (Brunton et al.
Reference Brunton, Proctor and Kutz2016c
; Kaiser et al.
Reference Kaiser, Kutz and Brunton2017) in order to identify low-order models
 $$\begin{eqnarray}\frac{\text{d}\boldsymbol{a}}{\text{d}t}=\boldsymbol{f}(\boldsymbol{a},\boldsymbol{b})\end{eqnarray}$$
that incorporate the influence of the actuation
 $\boldsymbol{b}$
on the dynamics of
 $\boldsymbol{a}$
. Combining such an approach with machine learning control (Duriez, Brunton & Noack Reference Duriez, Brunton and Noack2016) may result in interpretable models of entirely new flow behaviours and previously unobserved flow physics that are discovered in the controlled flow. The identified models can then serve as a low-dimensional representation of the actual system in order to facilitate the computation of nonlinear optimal feedback control laws. This is an area of active research by the authors. In the near future, the authors aim to apply the methodology introduced in the present work to the optimal control of experimental flows.
Finally, there are a number of methodological extensions that may improve the performance of this sparse modelling framework. First, it will be important to demonstrate that these methods scale favourably to systems with higher-dimensional attractors. Because the algorithms are based on simple regression and sparse optimization, they should remain computationally tractable. Next, it may be possible to reduce the memory requirements of the local linear mapping by building local modal libraries in different dynamic regimes (e.g. linear instability, saturated limit cycle, etc.). The storage requirements may further be reduced using compression techniques and sparse sampling. It may also be possible to incorporate the accuracy of the generalized modal decomposition reconstruction into the cost function in the SINDy regression, so that nonlinear features are selected based on their dynamic relevance and their ability to reconstruct the full state.
Acknowledgements
S.L.B. acknowledges generous funding support from the Defense Advanced Research Projects Agency (DARPA HR0011-16-C-0016) and from the Air Force Office of Scientific Research (AFOSR FA9550-18-1-0200). S.L.B. would like to thank N. Kutz, J. Proctor, E. Kaiser, N. Mangan and S. Rudy for discussions related to sparse model identification. S.L.B. would also like to thank S. Dawson for valuable discussions related to nonlinear modelling in terms of aerodynamic force coefficients. B.R.N. acknowledges funding from the German Science Foundation (DFG grant SE 2504/2-1). This work is also supported by internal funds of LIMSI-CNRS and a public grant overseen by the French National Research Agency (ANR) as part of the ‘Investissement d’Avenir’ program, through the ‘iCODE Institute project’ funded by the IDEX Paris-Saclay, ANR-11-IDEX-0003-02.
Appendix A. Influence of the low-amplitude harmonics
As explained in § 4.1, the lift signal recorded from DNS has been low-pass filtered prior to the identification of the low-dimensional model as to remove the low-amplitude second harmonics component of the signal. Although not mandatory, this preprocessing step enables the identification of a simpler model without altering its predictive and explanatory capabilities. In this appendix, the same procedure as described in § 4.1 is used directly on the raw unfiltered lift signal. Including the correction of the growth rate, the identified cubic model reads
 $$\begin{eqnarray}\left.\begin{array}{@{}c@{}}\displaystyle \frac{\text{d}a_{1}}{\text{d}t}=1.12a_{2}\\ {\displaystyle \frac{\text{d}a_{2}}{\text{d}t}}=-1.12a_{1}+0.3a_{2}-0.3a_{2}^{3}-0.34a_{1}^{2}a_{2}.\end{array}\right\}\end{eqnarray}$$
This model can be rewritten as
 $$\begin{eqnarray}\left.\begin{array}{@{}c@{}}{\displaystyle \frac{\text{d}a_{1}}{\text{d}t}}=1.12a_{2}\\ {\displaystyle \frac{\text{d}a_{2}}{\text{d}t}}=-1.12a_{1}+0.3(1-a_{1}^{2}-a_{2}^{2})a_{2}-0.04a_{1}^{2}a_{2}.\end{array}\right\}\end{eqnarray}$$
Comparing model (A 2) and its low-pass filtered counterpart (4.9) presented in § 4.1, it is clear that keeping the low-amplitude second harmonics in the signal used for the identification gives rise to a correction term which is an order of magnitude smaller than the other terms involved. Simulating both models gives almost identical results. Following Ockham’s razor, the model identified in § 4.1 is thus preferred over the one presented in this appendix due to its simpler formulation.