



%20--%3e%3c!DOCTYPE%20svg%20PUBLIC%20'-//W3C//DTD%20SVG%201.0//EN'%20'http://www.w3.org/TR/2001/REC-SVG-20010904/DTD/svg10.dtd'%3e%3csvg%20version='1.0'%20id='Layer_1'%20xmlns='http://www.w3.org/2000/svg'%20xmlns:xlink='http://www.w3.org/1999/xlink'%20x='0px'%20y='0px'%20width='64px'%20height='64px'%20viewBox='5.5%20-3.5%2064%2064'%20enable-background='new%205.5%20-3.5%2064%2064'%20xml:space='preserve'%3e%3cg%3e%3ccircle%20fill='%23FFFFFF'%20fill-opacity='0'%20cx='37.785'%20cy='28.501'%20r='28.836'/%3e%3cpath%20fill='%23595959'%20d='M37.441-3.5c8.951,0,16.572,3.125,22.857,9.372c3.008,3.009,5.295,6.448,6.857,10.314%20c1.561,3.867,2.344,7.971,2.344,12.314c0,4.381-0.773,8.486-2.314,12.313c-1.543,3.828-3.82,7.21-6.828,10.143%20c-3.123,3.085-6.666,5.448-10.629,7.086c-3.961,1.638-8.057,2.457-12.285,2.457s-8.276-0.808-12.143-2.429%20c-3.866-1.618-7.333-3.961-10.4-7.027c-3.067-3.066-5.4-6.524-7-10.372S5.5,32.767,5.5,28.5c0-4.229,0.809-8.295,2.428-12.2%20c1.619-3.905,3.972-7.4,7.057-10.486C21.08-0.394,28.565-3.5,37.441-3.5z%20M37.557,2.272c-7.314,0-13.467,2.553-18.458,7.657%20c-2.515,2.553-4.448,5.419-5.8,8.6c-1.354,3.181-2.029,6.505-2.029,9.972c0,3.429,0.675,6.734,2.029,9.913%20c1.353,3.183,3.285,6.021,5.8,8.516c2.514,2.496,5.351,4.399,8.515,5.715c3.161,1.314,6.476,1.971,9.943,1.971%20c3.428,0,6.75-0.665,9.973-1.999c3.219-1.335,6.121-3.257,8.713-5.771c4.99-4.876,7.484-10.99,7.484-18.344%20c0-3.543-0.648-6.895-1.943-10.057c-1.293-3.162-3.18-5.98-5.654-8.458C50.984,4.844,44.795,2.272,37.557,2.272z%20M37.156,23.187%20l-4.287,2.229c-0.458-0.951-1.019-1.619-1.685-2c-0.667-0.38-1.286-0.571-1.858-0.571c-2.856,0-4.286,1.885-4.286,5.657%20c0,1.714,0.362,3.084,1.085,4.113c0.724,1.029,1.791,1.544,3.201,1.544c1.867,0,3.181-0.915,3.944-2.743l3.942,2%20c-0.838,1.563-2,2.791-3.486,3.686c-1.484,0.896-3.123,1.343-4.914,1.343c-2.857,0-5.163-0.875-6.915-2.629%20c-1.752-1.752-2.628-4.19-2.628-7.313c0-3.048,0.886-5.466,2.657-7.257c1.771-1.79,4.009-2.686,6.715-2.686%20C32.604,18.558,35.441,20.101,37.156,23.187z%20M55.613,23.187l-4.229,2.229c-0.457-0.951-1.02-1.619-1.686-2%20c-0.668-0.38-1.307-0.571-1.914-0.571c-2.857,0-4.287,1.885-4.287,5.657c0,1.714,0.363,3.084,1.086,4.113%20c0.723,1.029,1.789,1.544,3.201,1.544c1.865,0,3.18-0.915,3.941-2.743l4,2c-0.875,1.563-2.057,2.791-3.541,3.686%20c-1.486,0.896-3.105,1.343-4.857,1.343c-2.896,0-5.209-0.875-6.941-2.629c-1.736-1.752-2.602-4.19-2.602-7.313%20c0-3.048,0.885-5.466,2.658-7.257c1.77-1.79,4.008-2.686,6.713-2.686C51.117,18.558,53.938,20.101,55.613,23.187z'/%3e%3c/g%3e%3c/svg%3e)
%20--%3e%3c!DOCTYPE%20svg%20PUBLIC%20'-//W3C//DTD%20SVG%201.0//EN'%20'http://www.w3.org/TR/2001/REC-SVG-20010904/DTD/svg10.dtd'%3e%3csvg%20version='1.0'%20id='Layer_1'%20xmlns='http://www.w3.org/2000/svg'%20xmlns:xlink='http://www.w3.org/1999/xlink'%20x='0px'%20y='0px'%20width='64px'%20height='64px'%20viewBox='5.5%20-3.5%2064%2064'%20enable-background='new%205.5%20-3.5%2064%2064'%20xml:space='preserve'%3e%3cg%3e%3ccircle%20fill='%23FFFFFF'%20fill-opacity='0'%20cx='37.637'%20cy='28.806'%20r='28.276'/%3e%3cg%3e%3cpath%20fill='%23595959'%20d='M37.443-3.5c8.988,0,16.57,3.085,22.742,9.257C66.393,11.967,69.5,19.548,69.5,28.5c0,8.991-3.049,16.476-9.145,22.456%20C53.879,57.319,46.242,60.5,37.443,60.5c-8.649,0-16.153-3.144-22.514-9.43C8.644,44.784,5.5,37.262,5.5,28.5%20c0-8.761,3.144-16.342,9.429-22.742C21.101-0.415,28.604-3.5,37.443-3.5z%20M37.557,2.272c-7.276,0-13.428,2.553-18.457,7.657%20c-5.22,5.334-7.829,11.525-7.829,18.572c0,7.086,2.59,13.22,7.77,18.398c5.181,5.182,11.352,7.771,18.514,7.771%20c7.123,0,13.334-2.607,18.629-7.828c5.029-4.838,7.543-10.952,7.543-18.343c0-7.276-2.553-13.465-7.656-18.571%20C50.967,4.824,44.795,2.272,37.557,2.272z%20M46.129,20.557v13.085h-3.656v15.542h-9.944V33.643h-3.656V20.557%20c0-0.572,0.2-1.057,0.599-1.457c0.401-0.399,0.887-0.6,1.457-0.6h13.144c0.533,0,1.01,0.2,1.428,0.6%20C45.918,19.5,46.129,19.986,46.129,20.557z%20M33.042,12.329c0-3.008,1.485-4.514,4.458-4.514s4.457,1.504,4.457,4.514%20c0,2.971-1.486,4.457-4.457,4.457S33.042,15.3,33.042,12.329z'/%3e%3c/g%3e%3c/g%3e%3c/svg%3e)
1. Introduction
Due to their high energy storage density, nearly constant melting temperature and zero-carbon emissions, solid–liquid phase change materials (PCMs) have increasingly been utilised across various domains, including cold chain logistics (Tong et al. Reference Tong, Nie, Li, Li, Zou, Jiang, Jin and Ding2021; Zhou, Xu & Huang Reference Zhou, Xu and Huang2023), thermal comfort in buildings (Kishore et al. Reference Kishore, Mahvi, Singh and Woods2023; Ragoowansi, Garimella & Goyal Reference Ragoowansi, Garimella and Goyal2023), thermal energy storage (Gerkman & Han Reference Gerkman and Han2020; Zhang et al. Reference Zhang, Tang, Chen, Zhang, Chen, Ding, Zhou, Xu, Liu and Xue2023) and electronic thermal management (Wang et al. Reference Wang, Peng, Peng and Zhang2022a ; Liu, Zheng & Li Reference Liu, Zheng and Li2022). The performance of a PCM system is primarily governed by its energy storage capacity and power density (Gur, Sawyer & Prasher Reference Gur, Sawyer and Prasher2012; Woods et al. Reference Woods, Mahvi, Goyal, Kozubal, Odukomaiya and Jackson2021; Yang, King & Miljkovic Reference Yang, King and Miljkovic2021; Chen et al. Reference Chen, Liu, Gao and Wang2022; Fu et al. Reference Fu, Yan, Gurumukhi, Garimella, King and Miljkovic2022), which are influenced by various design parameters embedded in material properties, system geometries and operational conditions (Woods et al. Reference Woods, Mahvi, Goyal, Kozubal, Odukomaiya and Jackson2021; Yang et al. Reference Yang, King and Miljkovic2021). Consequently, achieving the desired performance under specific conditions necessitates meticulous selection of storage materials and thoughtful design of system geometries. However, universal guidelines for this practice are not yet established (Gao & Lu Reference Gao and Lu2021; Yang et al. Reference Yang, King and Miljkovic2021; He, Guo & Zhang Reference He, Guo and Zhang2022; Wang et al. 2022b), calling for deeper insights into the physical principles governing how design parameters impact system performance.
The performance indicators – energy storage capacity and power density – are determined by the maximum melted amount and melting rate of PCMs, respectively. Thus, the performance can be exclusively represented by the temporal evolution of the PCM’s melted volume, which, in dimensionless form, is the evolution of liquid fraction (melting curve). Indicatively, the task of investigating the effects of design parameters on performance can be restated as identifying their impacts on the melting curve.
The melting curve has been typically recognised as a composite of two segments, corresponding to successive regimes undergone by the storage process: initially dominated by conduction and then by convection (Ho & Viskanta Reference Ho and Viskanta1984; Gau & Viskanta Reference Gau and Viskanta1986; Wang, Amiri & Vafai Reference Wang, Amiri and Vafai1999; Duan, Xiong & Yang Reference Duan, Xiong and Yang2019; Li, Jiao & Jia Reference Li, Jiao and Jia2022). Despite this understanding, a comprehensive model for the melting curve is lacking (Verma et al. Reference Verma2008; Dutil et al. Reference Dutil, Rousse, Salah, Lassue and Zalewski2011), as current knowledge of the transitional scenario remains scarce (Azad et al. Reference Azad, Groulx and Donaldson2021a ,Reference Azad, Groulx and Donaldson b , Reference Azad, Groulx and Donaldson2022), commonly limited to empirical fits from experimental or numerical data (Wang et al. Reference Wang, Amiri and Vafai1999; Vogel, Felbinger & Johnson Reference Vogel, Felbinger and Johnson2016; Duan et al. Reference Duan, Xiong and Yang2019; Li & Su Reference Li and Su2023).
In this work, we delineate the transitional scenario of melting PCM and subsequently develop a theoretical framework to model the melting curve. The resulting model encapsulates the essential physics of PCM melting, concomitantly agreeing well with experimental and numerical data. The associated theoretical formula quantifies the impacts of material properties, geometric features and operational conditions on system performance, providing convenient guiding principles for material selection and geometric design of PCM systems.
2. Storage performance of PCM system
2.1. Problem description
We illustrate the theoretical framework using a minimal yet representative enclosure of PCM (Dhaidan & Khodadadi Reference Dhaidan and Khodadadi2015) – a rectangular cavity of width
 $W$
and height
 $H$
(see figure 1
a). It is filled with solid PCM initialised at the ambient temperature
 $\tilde T=T_c$
, which is below the fusion (melting) temperature
 $T_f$
. Keeping its top and bottom walls insulated, the cavity’s left wall absorbs heat from a hot working device at temperature
 $\tilde T=T_h\gt T_f$
, with its right boundary subject to a cold ambient environment at
 $\tilde T=T_c\lt T_f$
. This configuration finds typical application in enhancing thermal comfort in buildings (Lachheb et al. Reference Lachheb, Younsi, Youssef and Bouadila2024), where PCM is encapsulated within bricks, with
 $T_f$
lying between the indoor (
 $T_c$
) and outdoor (
 $T_h$
) temperatures. The ideal configuration – where
 $T_f$
always equals
 $T_c$
, preventing any heat transfer in the solid phase – has been discussed in previous studies (Esfahani et al. Reference Esfahani, Hirata, Berti and Calzavarini2018; Favier, Purseed & Duchemin Reference Favier, Purseed and Duchemin2019; Li et al. Reference Li, Jiao and Jia2022; Yang et al. Reference Yang, Chong, Liu, Verzicco and Lohse2022).
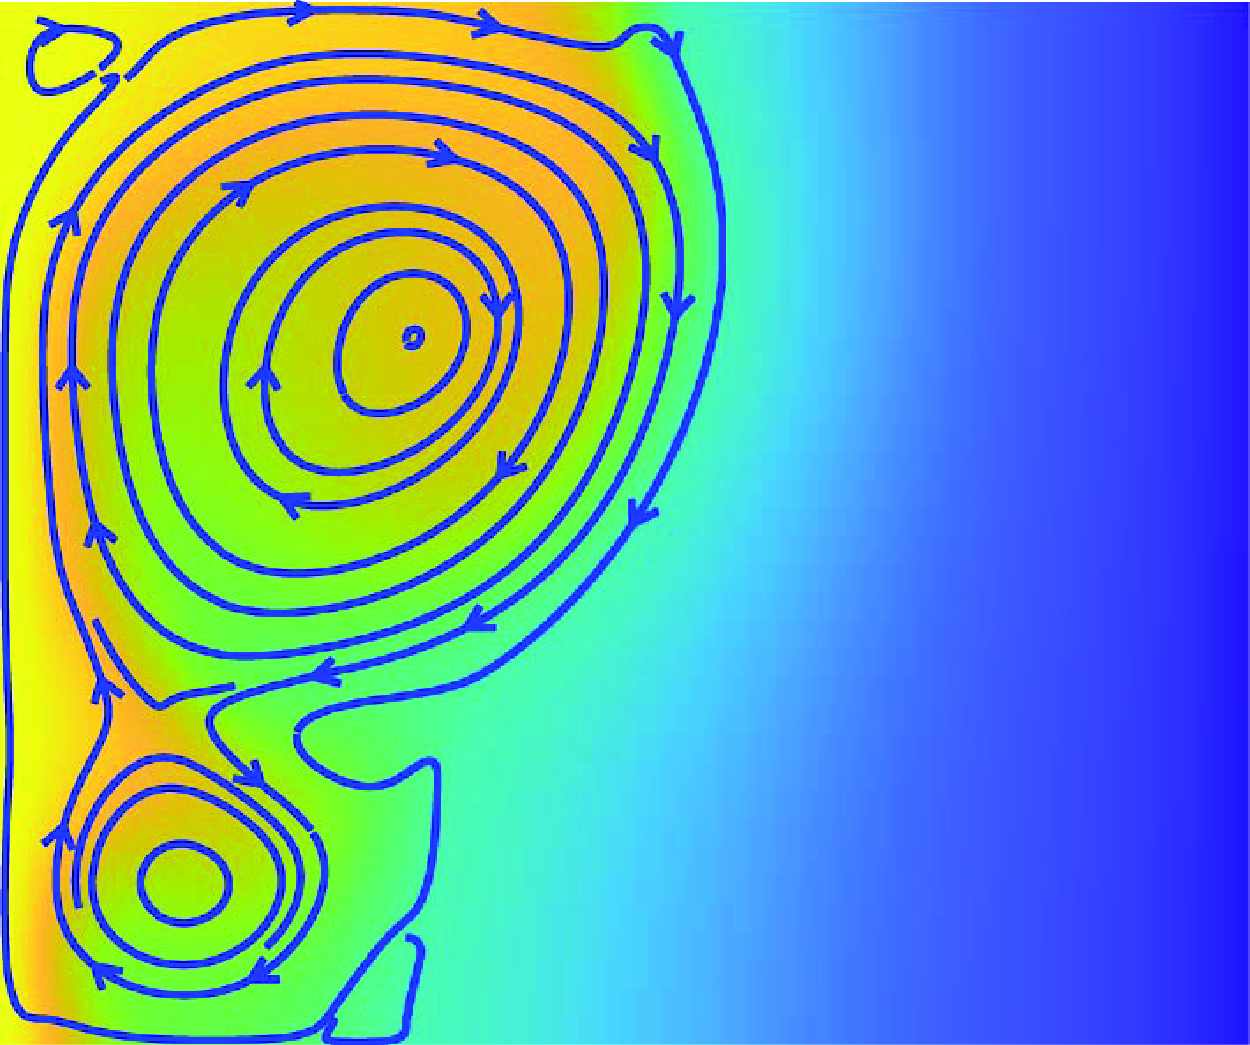
(a) A rectangular cavity filled with subcooled PCM, maintaining temperatures at
 $T_h$
(hot) and
 $T_c$
(cold) at the left and right boundaries, respectively. (b) Time evolution of the domain-averaged velocity
 $\langle |{\boldsymbol{ u}}| \rangle =(g\alpha \Delta T_l H)^{-1/2}\int |\boldsymbol{\tilde u}| \mathrm{d} {\mathcal{V} } /{\mathcal{V}}_0$
, where
 ${\mathcal{V}}_0=\textit{WH}$
. Here,
 ${{Ra}}=10^7$
,
 ${Pr}=0.1$
,
 ${{St}}=0.1$
,
 ${{S}}_T=1.0$
and
 $\gamma =1.0$
. The inset shows the instantaneous temperature field and streamlines at
 ${\textit {Fo}}{{St}}=0.0046$
.

Using tildes to indicate dimensional variables, the thermo-hydrodynamic equations for the liquid phase read
 \begin{align} \boldsymbol{\nabla } \boldsymbol{\cdot} \boldsymbol{\tilde u} & =0,\\[-12pt]\nonumber \end{align}
 \begin{align} \frac {\partial {\boldsymbol{ \tilde {u}} }}{\partial \tilde t}+\boldsymbol{{ \tilde {u}} }\boldsymbol{\cdot} \boldsymbol{\nabla }\boldsymbol{ \tilde {u}} & =\boldsymbol{g}\alpha ({ \tilde {T}} -T_0)+ {\nu \nabla ^2 \boldsymbol{{ \tilde {u}} }}-\frac {\boldsymbol{\nabla }{{ \tilde {p}} }}{\rho _0},\\[-12pt]\nonumber \end{align}
 \begin{align} \frac {\partial {\tilde T}}{\partial \tilde t}+\boldsymbol{\tilde u}\boldsymbol{\cdot} \boldsymbol{\nabla } \tilde {T} & = {\kappa \nabla ^2 \tilde {T}}, \end{align}
where
 $\boldsymbol{\tilde u}$
,
 $\tilde T$
and
 $\tilde p$
denote the velocity, temperature, and pressure of the liquid, respectively; its kinematic viscosity is
 $\nu$
, while the thermal expansion coefficient and diffusivity are
 $\alpha$
and
 $\kappa,$
respectively. Here,
 $\rho _0$
denotes the reference density measured at the reference temperature
 $T_0=(T_h+T_f)/2$
and
 $\boldsymbol{g}$
indicates the gravitational acceleration. At the melting interface between the solid (
 $s$
) and liquid (
 $l$
) phase, the Stefan condition
 $\mathcal{L} \boldsymbol{\tilde V} \boldsymbol{\cdot} \boldsymbol{n}/C_p=[(\kappa \boldsymbol{\nabla } \tilde T)_s-(\kappa \boldsymbol{\nabla } \tilde T)_l]\boldsymbol{\cdot} \boldsymbol{n}$
holds, where
 $\mathcal{L}$
and
 $C_p$
are the specific latent heat and specific heat, respectively;
 $\boldsymbol{\tilde V}$
represents the velocity of the interface, and
 $\boldsymbol{n}$
denotes its liquid-facing unit normal.
The above governing equations denote that the material properties affecting the system performance include
 $\alpha$
,
 $T_f$
,
 $\nu$
,
 $\kappa$
,
 $C_p$
and
 $\mathcal{L}$
. Their effects, along with those of the geometry (
 $W$
and
 $H$
), and the working conditions (
 $T_h$
and
 $T_c$
) are characterised by five dimensionless numbers: the Rayleigh number
 ${Ra}$
, Prandtl number
 $Pr$
, Stefan number
 ${St}$
, subcooling strength
 ${{S}}_T$
and the cavity’s aspect ratio
 $\gamma$
, defined as
 \begin{equation} {{Ra}}=\frac {g\alpha \Delta T_l H^3}{\nu \kappa },\ {Pr}=\frac {\nu }{\kappa },\ {St}=\frac { C_p \Delta T_l}{\mathcal{L}}, {{S}}_T=\frac {\Delta T_s}{\Delta T_l},\ \gamma =\frac {W}{H}. \end{equation}
Here,
 $\Delta T_s=T_f-T_c$
and
 $\Delta T_l=T_h-T_f$
are the temperature differences across the solid and liquid phases, respectively. Additionally, the melting behaviour of PCMs is characterised by the Nusselt number
 $\textit {Nu}$
, Fourier time
 $\textit {Fo}$
and liquid fraction
 $f$
 \begin{equation} {\textit {Nu}}=-\frac {H}{\Delta T_l} \left \langle \frac {\partial \tilde T}{\partial \tilde y} \right \rangle _{\tilde y=0},\ {\textit {Fo}}=\frac {\kappa \tilde t}{W^2},\ f=\frac {\tilde w}{W}, \end{equation}
where
 $\tilde w$
is the average thickness of the liquid layer (figure 1
a), and
 $\langle \ \rangle _{\tilde y=0}$
denotes spatial averaging along the hot wall at
 $\tilde y = 0$
.
2.2. Linear stability analysis
We obtain the transition criterion through linear stability analysis, choosing the endpoint of the conduction-dominated regime as the base state. Since the horizontal temperature gradient imposes a heterogeneous buoyancy on the fluid (figure 1
a), the corresponding base flow
 $\boldsymbol{\tilde {u}}_b$
is not stationary, as evidenced by the temporal evolution of the domain-averaged velocity
 $\langle |\boldsymbol{u}| \rangle$
in figure 1(b). This non-stationary base flow
 $\boldsymbol{\tilde {u}}_b$
differs from the quiescent counterpart of the canonical Rayleigh–Bénard convection, and cannot be derived analytically. However, the base liquid temperature
 $\tilde {T}_b$
is readily calculable, because the convective heat transfer is negligible in the conduction-dominated regime. By solving the heat conduction equation, we obtain
 $\tilde {T}_b = T_h-{\Delta T_l} \tilde y /{\tilde w_b}$
, where
 $\tilde w_b = W/(1 + {{S}}_T^{\ast })$
results from the energy balance between the liquid and solid phases,
 $\Delta T_l/\tilde w_b= \Delta T_s/ ( W-\tilde w_b )$
. Here, the superscript
 $^{\ast }$
indicates that
 ${{S}}_T^\ast$
is the critical subcooling strength required for the base state to reach the onset of instability.
To linearise (2.1), we decompose the flow and temperature fields into the base state
 $ ( \tilde {\boldsymbol{u}}_b, \tilde {p}_b, \tilde T_b )$
and the disturbance state
 $ ( \tilde {\boldsymbol{u}}^{\prime }, \tilde {p}^{\prime }, \tilde T^{\prime } )$
, such that
 $ ( \tilde {\boldsymbol{u}}, \tilde {p}, \tilde T ) = ( \tilde {\boldsymbol{u}}_b, \tilde {p}_b, \tilde T_b )+ ( \tilde {\boldsymbol{u}}^{\prime }, \tilde {p}^{\prime }, \tilde T^{\prime } )$
. Selecting
 $\tilde w_b$
as the length scale,
 $U_0$
and
 $U$
the base and perturbation velocity scales, respectively, we derive the dimensionless linearised equations for
 $ ( \tilde {\boldsymbol{u}}^{\prime }, \tilde {p}^{\prime }, \tilde T^{\prime } )$
 \begin{align} \boldsymbol{\nabla } \boldsymbol{\cdot} \boldsymbol u' &=0 ,\\[-10pt]\nonumber \end{align}
 \begin{align} \frac {\partial {\boldsymbol{ u}' }}{\partial t} + \frac {U_0 \tilde w_b}{\kappa } (\boldsymbol{ u }_b \boldsymbol{\cdot} \boldsymbol{\nabla }{\boldsymbol{u}'}+\boldsymbol{ u }' \boldsymbol{\cdot} \boldsymbol{\nabla }{ \boldsymbol{u}_b} ) &= \frac { {{Ra}}{Pr}\gamma ^3}{\big(1+{{S}}_T^{\ast }\big)^3} T' \boldsymbol{e_x}+ {Pr} {\nabla ^2} \boldsymbol{ u }' -\boldsymbol{\nabla }{{ p'} },\\[-10pt]\nonumber \end{align}
 \begin{align} \frac {\partial {T'}}{\partial t} - v' + \frac {U_0 \tilde w_b}{\kappa }\boldsymbol{u}_b\boldsymbol{\cdot} \boldsymbol{\nabla } T' &= {\nabla ^2} T', \end{align}
where we have also chosen
 $\tilde w_b^2/\kappa$
as the characteristic time,
 $\rho _0 \kappa U/\tilde w_b$
as the characteristic pressure and
 $\Delta T_l U \tilde w_b /\kappa$
as the characteristic temperature. Here,
 $v^{\prime }$
denotes the
 $y$
-component of the dimensionless perturbation velocity
 $\boldsymbol{u}^{\prime }$
.
We note that
 $U_0\tilde w_b/\kappa$
in (2.4b
) and (2.4c
) represents the Péclet number, which measures the relative strength of convection to conduction. Since this number is inherently small in the conduction-dominated base state, we simplify the theoretical analysis by neglecting all terms involving
 $U_0\tilde w_b/\kappa$
in (2.4). This assumption proves reasonable, as will be verified a posterior by numerical simulations (see Appendix B). With this simplification, we obtain
 \begin{align} \boldsymbol{\nabla } \boldsymbol{\cdot} \boldsymbol u' &=0 ,\\[-10pt]\nonumber \end{align}
 \begin{align} \frac {\partial {\boldsymbol{ u}' }}{\partial t} &= \frac { {{Ra}}{Pr}\gamma ^3}{\big(1+{{S}}_T^{\ast }\big)^3} T' \boldsymbol{e_x}+ {Pr}\nabla ^2 \boldsymbol{ u }' -\boldsymbol{\nabla }{{ p'} },\\[-10pt]\nonumber \end{align}
 \begin{align} \frac {\partial {T'}}{\partial t} - v' &= \nabla ^2 T'. \end{align}
Using the normal mode approach, a dimensionless perturbation field
 $\phi$
of either the velocity, temperature or pressure is expressed as
 $\phi ' (x,y,t)=\hat \phi (y)\exp (\mathrm{i}\mathcal{K}x+\sigma t)$
, where
 $\hat \phi$
presents the complex magnitude of perturbation,
 $\mathcal{K}$
and
 $\sigma$
stand for the wavenumber and growth rate, respectively; here,
 $\mathrm{i}=\sqrt {-1}$
. Substituting the normal modes into (2.5), we obtain the governing equations for the perturbation magnitudes
 \begin{align} 0&=\mathrm{i}\mathcal{K}\hat u +\frac {\partial \hat v}{\partial y},\\[-10pt]\nonumber \end{align}
 \begin{align} \sigma \hat u &=\frac {{{Ra}}{Pr}\gamma ^3}{\big(1+{{{S}}_T^{\ast }}\big)^3} \hat T +{Pr}\left (\frac {\partial ^2 \hat u}{\partial y^2} -\mathcal{K}^2 \hat u\right )-\mathrm{i}\mathcal{K}\hat p,\\[-10pt]\nonumber \end{align}
 \begin{align} \sigma \hat v &= {Pr} \left (\frac {\partial ^2 \hat v}{\partial y^2}-\mathcal{K}^2\hat v \right )-\frac {\partial \hat p}{\partial y},\\[-10pt]\nonumber \end{align}
 \begin{align} \sigma \hat T &= \left ( \frac {\partial ^2 \hat T}{\partial y^2}-\mathcal{K}^2\hat T \right )+\hat v. \end{align}
The corresponding boundary conditions at the hot wall
 $y=0$
are
 \begin{align} \hat u = \hat v =0,\ \hat T =0. \end{align}
Those at the melting interface
 $y=1$
read
 \begin{align} \hat u = \hat v =0,\ \mathcal{K} \hat T \mathrm{coth}\big(\mathcal{K} {{{S}}_T^{\ast }}\big) + \frac {\partial \hat T}{\partial y}=0, \end{align}
where the condition for
 $\hat {T}$
is derived from the Stefan condition (Davis, Müller & Dietsche Reference Davis, Müller and Dietsche1984; Toppaladoddi & Wettlaufer Reference Toppaladoddi and Wettlaufer2019; Lu et al. Reference Lu, Zhang, Luo, Wu and Yi2022).
Equations (2.6), (2.7) and (2.8) indicate that the transition depends on
 $Pr$
,
 ${Ra}$
,
 $\gamma$
and
 ${{S}}_T^{\ast }$
. To investigate the influence of these parameters, we simplify (2.5) into a single equation representing the marginal state (
 $\sigma =0$
). Taking the divergence of (2.5b
) and using (2.5a
), we derive
 \begin{equation} 0 =\frac {{{Ra}}{Pr}\gamma ^3}{\big(1+{{S}}_T^{\ast }\big)^3} \frac {\partial T'}{\partial x}-{\nabla ^2}{{ p'} }. \end{equation}
Next, differentiating (2.9) with respect to
 $y$
results in
 \begin{equation} 0 =\frac {{{Ra}}{Pr}\gamma ^3}{\big(1+{{S}}_T^{\ast }\big)^3} \frac {\partial ^2 T'}{\partial x \partial y}-{\nabla ^2}{\frac {\partial p'}{\partial y} }. \end{equation}
We then take the Laplacian of the
 $y$
-component of (2.5b
) and obtain
 \begin{equation} \frac {\partial }{\partial t} {\nabla ^2} {v' }={Pr}{\nabla ^4} v'-{\nabla ^2}\frac {\partial p'}{\partial y}. \end{equation}
Further subtracting (2.10) from (2.11) yields
 \begin{equation} \frac {\partial }{\partial t} {\nabla ^2} {v' }={Pr}{\nabla ^4} v'-\frac {{{Ra}}{Pr}\gamma ^3}{\big(1+{{S}}_T^{\ast }\big)^3} \frac {\partial ^2 T'}{\partial x \partial y}. \end{equation}
Incorporating the normal modes into (2.5c
) and (2.12), the perturbation magnitudes at the marginal state (
 $\sigma =0$
) are governed by
 \begin{align} \mathcal{K}^2\hat T-\hat v-\hat T^{(2)} & = 0, \end{align}
 \begin{align} -\mathrm{i}\mathcal{K}\gamma ^3{{Ra}}\hat T^{(1)} +\mathcal{K}^2\big(1+{{S}}_T^\ast \big)^3\big(\mathcal{K}^2\hat v-2\hat v^{(2)}\big)+\big(1+{{S}}_T^\ast \big)^3\hat v^{(4)} & =0, \end{align}
where
 $\hat T^{(n)} = {\partial ^n \hat T}/{\partial y^n}$
and
 $\hat v^{(n)} = {\partial ^n \hat v}/{\partial y^n}$
. By eliminating
 $\hat v$
, we derive
 \begin{equation} \mathcal{K}^6\hat T - \frac {\mathrm{i}{{Ra}}\gamma ^3 \mathcal{K}\hat T^{(1)}}{\big(1+{{{S}}_T^\ast }\big)^3} =3\mathcal{K}^4\hat T^{(2)}-3\mathcal{K}^2\hat T^{(4)}+\hat T^{(6)}, \end{equation}
which suggests that the transition is characterised solely by a critical effective Rayleigh number
 ${{Ra}}_e^{\ast }={{Ra}} \gamma ^3/(1+{{{S}}_T^\ast })^3$
.
2.3. Results and discussions
Realising the critical liquid fraction
 $f^{\ast }=1/ ( 1+{{S}}_T^{\ast } )$
upon substituting
 $\tilde w_b=W/(1+{{S}}_T^{\ast })$
into (2.3), we further obtain
 \begin{equation} f^{\ast }=\left (\frac {{{Ra}}_e^{\ast }}{{{Ra}} \gamma ^3}\right )^{1/3}. \end{equation}
Applying a spectral method (Weideman & Reddy Reference Weideman and Reddy2000) to (2.6)–(2.8), we calculate
 $f^{\ast }=1/ ( 1+{{S}}_T^{\ast } )$
for various configurations within the ranges of
 $10^6 \leqslant {Ra} \leqslant 10^{10}$
,
 $10^{-5} \leqslant Pr \leqslant 10^3$
and
 $0.5 \leqslant \gamma \leqslant 2$
, further yielding
 ${{Ra}}_e^{\ast }$
via (2.15). The results consistently exhibit a similar trend across these ranges. This trend is revealed by a representative set of data presented in figure 2.
Figure 2(a) shows that
 ${{Ra}}_e^{\ast }$
remains constant with respect to
 ${Ra}$
. Additionally,
 ${{Ra}}_e^{\ast }$
is independent of
 $Pr$
when
 ${Pr}\lt 10^{-3}$
and
 ${Pr}\gt 10$
, plateauing at
 $6248$
and
 $5200$
, respectively (figure 2
b). Notably,
 $f^{\ast }$
values corresponding to both the highest and lowest values of
 ${{Ra}}_e^{\ast }$
are closely matched, as indicated by
 $ ( 6248/5200 )^{1/3}\approx 1.06$
. Consequently, in the subsequent theoretical modelling,
 $f^{\ast }$
can be approximated using the median value of
 ${{Ra}}_e^{\ast }=5724$
. However, such an approximation fails for narrow (small
 $\gamma$
) cavities, where
 ${{Ra}}_e^{\ast }$
increases rapidly when
 $\gamma$
decreases from
 $0.75$
, as evidenced in figure 2(c). This failure stems from the stronger confinement effect, as commonly observed in low-aspect-ratio canonical Rayleigh–Bénard convection (Wang et al. Reference Wang, Ma, Chen and Sun2012; Huang et al. Reference Huang2013b
; Huang & Xia Reference Huang and Xia2016; Yu et al. Reference Yu, Goldfaden, Flagstad and Scheel2017; Shishkina Reference Shishkina2021; Ahlers et al. Reference Ahlers2022).
Typical dependence of the critical liquid fraction
 $f^{\ast }$
and critical effective Rayleigh number
 ${{Ra}}_e^{\ast }$
on (a)
 $Ra$
with
 ${Pr}=10$
and
 $\gamma =1$
, (b)
 $Pr$
with
 ${Ra}=10^6$
and
 $\gamma =1$
and (c)
 $\gamma$
with
 ${Ra}=10^6$
and
 ${Pr}=10$
.

Having derived the transition criterion
 $f^{\ast }$
, we employ it to develop the mathematical model for the melting curve. Following Esfahani et al. (Reference Esfahani, Hirata, Berti and Calzavarini2018), Favier et al. (Reference Favier, Purseed and Duchemin2019) and Yang et al. (Reference Yang, Chong, Liu, Verzicco and Lohse2022), we start from the dimensional energy equation for both phases (Voller, Cross & Markatos Reference Voller, Cross and Markatos1987; Huang et al. Reference Huang, Wu and Cheng2013a
)
 \begin{equation} \frac {\partial {\tilde T}}{\partial \tilde t}+\boldsymbol{\tilde u} \boldsymbol{\cdot} \boldsymbol{\nabla } \tilde {T} ={\kappa \nabla ^2 \tilde {T}} -\frac {\mathcal{L}}{C_p}\frac {\partial {f_{loc}}}{\partial \tilde t}, \end{equation}
where
 $f_{loc}$
represents the local liquid fraction (see (A6)) and its volume average is equivalent to the macroscopic counterpart
 $f$
in (2.3). The first and last terms represent the change rates of the sensible and latent heats, respectively. The ratio of the two terms, i.e. the Stefan number, is typically far below unity; namely,
 ${St}=C_p\Delta T_l/\mathcal L\ll 1$
, because of the high
 $\mathcal L$
of PCMs. This condition as commonly satisfied in prior studies (Beckermann & Viskanta Reference Beckermann and Viskanta1989; Regin, Solanki & Saini Reference Regin, Solanki and Saini2009; Arasu & Mujumdar Reference Arasu and Mujumdar2012; Ho & Gao Reference Ho and Gao2013; Kean, Sidik & Kaur Reference Kean, Sidik and Kaur2019; Khan & Khan Reference Khan and Khan2019), allowing for neglect of the first term.
Further applying Gauss’s theorem, we obtain the integral form of (2.16)
 \begin{equation} \frac {\mathcal{L}}{C_p}\frac {\partial f}{\partial \tilde t} W =\kappa \left [\left\langle \frac {\partial \tilde T}{\partial \tilde y}\right\rangle _{\tilde y=W} - \left\langle \frac {\partial \tilde T}{\partial \tilde y}\right\rangle _{\tilde y=0} \right ], \end{equation}
where
 $\langle \partial \tilde T/ \partial \tilde y \rangle _{\tilde y=W}$
, the average temperature gradient at the cold wall, varies over time generally due to the advancing melting interface. However, in the limit of
 ${{St}}\ll 1$
as revealed above, the interfacial velocity is negligible compared with the conduction rate, as implied by the normalised Stefan condition
 $\boldsymbol{\tilde V} \boldsymbol{\cdot} \boldsymbol{n}/({\kappa }/H)={{St}} (\boldsymbol{\nabla } T_{s}+ \boldsymbol{\nabla } T_{l})\boldsymbol{\cdot} \boldsymbol{n}$
. Consequently, the conduction process can be considered quasi-steady on the time scale of the interfacial evolution, leading the temperature gradient at the cold wall to be
 \begin{equation} \left\langle \frac {\partial \tilde T}{\partial \tilde y}\right\rangle _{\tilde y=W}=-\frac { \Delta T_s}{W-\tilde {w}}, \end{equation}
where
 $W{-}\tilde w$
quantifies the average thickness of the solid phase (see figure 1
a).
At the hot wall, the temperature gradient
 $\langle \partial \tilde T/ \partial \tilde y \rangle _{\tilde y=0}$
depends on the conduction and convection states of the liquid phase. When conduction dominates, this gradient becomes
 $-\langle \partial \tilde T/\partial \tilde y\rangle _{\tilde y=0}=\Delta T_l/\tilde w$
, which combining (2.17) and (2.18) yields the conduction melting curve in the implicit form
 \begin{equation} \frac {f(1+{{S}}_T)(f-2{{S}}_T+f{{S}}_T)-2{{S}}_T\ln [1-f(1+{{S}}_T)]}{2(1+{{S}}_T)^3} = \textit {Fo}{St}. \end{equation}
Due to the subcooling effects, this solution differs from the classical Stefan solution
 $f \sim \sqrt {\textit {Fo}}$
(Esfahani et al. Reference Esfahani, Hirata, Berti and Calzavarini2018; Fu et al. Reference Fu, Yan, Gurumukhi, Garimella, King and Miljkovic2022), but recovers to it when
 ${{S}}_T=0$
.
The present model is compared with (a–c) experimental measurements (squares) of n-octadecane (
 $Pr=56$
) in a cubic cavity (Ho & Gao Reference Ho and Gao2013), and (d–f) our two-dimensional numerical data (circles) for a rectangular cavity. The numerical data in (d–f) are represented on a log–log scale in (g–i) to highlight the three melting regimes.

As convection dominates, the temperature gradient can be modelled as
 $-\langle \partial \tilde T/\partial \tilde y \rangle _{\tilde y=0}={\textit {Nu}} \Delta T_l/H$
following (2.3), resulting in the convection melting curve
 \begin{equation} \frac {f}{{\textit {Nu}}\gamma }-\frac {{{S}}_T}{({\textit {Nu}}\gamma )^2 }\ln \left [ {\textit {Nu}}\gamma (f-1)+{{S}}_T \right ]= \textit {Fo} {St} +C, \end{equation}
where
 $C$
is a constant to be determined. Because both melting curves concatenate at
 $ ( {\textit {Fo}}^{\ast } {St},f^{\ast } )$
, subtracting (2.19) from (2.20) yields the constant
 \begin{align} C &=\frac {f^{\ast }}{{\textit {Nu}}\gamma }-\frac {{{S}}_T}{({\textit {Nu}}\gamma )^2 }\ln \left [ {\textit {Nu}}\gamma (f^{\ast }-1)+{{S}}_T \right ] \nonumber \\[4pt] & \quad -\frac {f^{\ast }(1+{{S}}_T)(f^{\ast }-2{{S}}_T+f^{\ast }{{S}}_T)-2{{S}}_T\ln [1-f^{\ast }(1+{{S}}_T)]}{2(1+{{S}}_T)^3}, \end{align}
where the Nusselt number is expressed using established models, specifically
 $\textit {Nu} \approx 0.5{{Ra}}^{1/4}{Pr}^{1/4}$
for
 ${Pr}\leqslant 0.1$
and
 $\textit {Nu} \approx 0.24{{Ra}}^{0.26}{Pr}^{0}$
for
 $ Pr\gt 0.1$
(Beckermann & Viskanta Reference Beckermann and Viskanta1989; Shishkina Reference Shishkina2016; Wang et al. Reference Wang, Liu, Verzicco, Shishkina and Lohse2021).
By substituting (2.21) into (2.20), the domain of the logarithmic function necessitates
 \begin{equation} f \lt f_s=1-\frac {{{S}}_T}{{\textit {Nu}} \gamma }. \end{equation}
This indicates that melting will cease at a saturated liquid fraction
 $f_s$
, leaving a portion of solid PCM unmelted.
Thus far, we have derived the critical liquid fraction
 $f^{\ast }$
and established a mathematical model for the melting curve. As shown in figure 3(a–c), the theoretical melting curves agree well with the prior experimental data (Ho & Gao Reference Ho and Gao2013). Besides, these curves also capture the trend revealed in our two-dimensional simulations, see figure 3(d–f). In the long-time limit, these curves asymptotically flatten, converging to
 $f_s$
as expected. To better characterise the transition, we depict these curves on a log–log scale in figure 3(g–i). The temporal evolution of
 $f$
exhibits three distinct phases: the first two follow a power-law relationship
 $f \sim (\textit {Fo} {St})^\beta$
with exponents
 $\beta \approx 0.5$
and
 $\beta \approx 1.0$
, respectively, followed by a saturated phase. Notably, this power-law scaling is exact in no-subcooling cases (
 ${{S}}_T=0$
), where
 $\beta =0.5$
and
 $1.0$
correspond to the conduction-dominated and convection-dominated regimes, respectively (Esfahani et al. Reference Esfahani, Hirata, Berti and Calzavarini2018; Favier et al. Reference Favier, Purseed and Duchemin2019; Li et al. Reference Li, Jiao and Jia2022). For present subcooling scenarios (
 ${{S}}_T\gt 0$
), the first two regimes with different
 $\beta$
are precisely demarcated by the predicted transition criterion
 $f=f^{\ast }$
(grey dashed line). Our theory’s predictive ability is further validated through benchmark comparisons with both our simulations and published data (Beckermann & Viskanta Reference Beckermann and Viskanta1989) as detailed in Appendix A.
Despite the generally satisfactory agreement between theoretical predictions and the experimental/numerical data, slight discrepancies are observed. They arise from two approximations: (i) neglecting the time variation of sensible heat in (2.16) and (ii) assuming a steady temperature gradient at the cold wall to obtain (2.18). Both approximations hold when
 ${St} \ll 1$
. At
 ${St} = 0.1$
, figure 3 indicates that the maximum relative error between the theoretical and numerical predictions of
 $f$
is
 ${\approx}15\,\%$
. This error increases with
 $St$
, reaching
 ${\approx}20\,\%$
when
 ${St} \in ( 0.2, 0.4 )$
, see Appendix C.
We now exploit the theoretical melting curve
 $f(\textit {Fo})$
to predict the key performance indicators. We start with the energy density
 $\textit {ED}$
as the cumulative energy stored per unit volume of PCM (Woods et al. Reference Woods, Mahvi, Goyal, Kozubal, Odukomaiya and Jackson2021; Fu et al. Reference Fu, Yan, Gurumukhi, Garimella, King and Miljkovic2022), which depends on the liquid fraction
 $f$
through
 \begin{equation} \textit {ED}(\tilde {t})=\rho [C_p(T_f -T_c)+\mathcal{L}] f . \end{equation}
Here, we have neglected the liquid’s sensible heat that plays a negligible role, as demonstrated in Fu et al. (Reference Fu, Yan, Gurumukhi, Garimella, King and Miljkovic2022) and confirmed by our experimentally verified calculations (see Appendix E). Notably, the maximum value of
 $\textit {ED}$
, reached at
 $f=f_s$
, represents the energy storage capacity, whereas the temporal derivative of
 $\textit {ED}$
serves as another indicator, the power density (Woods et al. Reference Woods, Mahvi, Goyal, Kozubal, Odukomaiya and Jackson2021; Fu et al. Reference Fu, Yan, Gurumukhi, Garimella, King and Miljkovic2022).
Practically, (2.23) characterises how design parameters of a PCM system affect its performance via the dimensionless numbers encoded in the melting curve. This characterisation, requiring only simple algebraic calculations, enables the rapid determination of parameters customised to meet specified performance criteria, thereby streamlining the system’s design.
Besides precisely characterising performance, the theoretical solutions also provide general guidance for optimising design parameters. For example, the critical liquid fraction
 $f^{\ast }$
signifies the duration of the conduction-dominated regime, which features inefficient heat transfer. Hence, reducing
 $f^{\ast }$
can enhance the melting rate (Sun et al. Reference Sun, Zhang, Medina and Lee2016; Azad et al. Reference Azad, Groulx and Donaldson2021a
), i.e. the power density. In the current configuration, this can be achieved by increasing the aspect ratio
 $\gamma$
, see (2.15).
3. Conclusion
By employing linear stability analysis and the integral energy equation, we have developed a theoretical framework for modelling the melting process and performance of PCM systems. Focusing on a exemplary system characterised by lateral heating, we derive an experimentally and numerically validated mathematical model for the melting curve. This curve facilitates rapid designs of PCM systems tailored to specific performance targets. Furthermore, we illustrate, in Appendices D–F, the theoretical framework’s versatility by modelling a variety of other representative PCM configurations, with theoretical predictions corroborated by prior studies (Dhaidan et al. Reference Dhaidan, Khodadadi, Al-Hattab and Al-Mashat2013; Kean et al. Reference Kean, Sidik and Kaur2019; Korti & Guellil Reference Korti and Guellil2020). These configurations vary in material species ranging from pure PCM to nanoparticle-enhanced PCM, in geometries including an inclined rectangular cavity and an annular tube and in operational conditions, such as isothermal and constant power heating. Overall, our investigation exemplifies the application of thermo-hydrodynamic theory and physics in facilitating the development of engineering solutions for energy applications.
Funding
L.Z. acknowledges the partial support received from the National University of Singapore, under the startup grant A-0009063-00-00. The computation of the work was performed on resources of the National Supercomputing Centre, Singapore (https://www.nscc.sg).
Declaration of interests
The authors report no conflict of interest.
Appendix A. Numerical Method
In this section, we first present the numerical method used to simulate the melting process of PCM. We then validate the numerical solver using published data.
The numerical simulations of the melting process are performed using the lattice Boltzmann method (Huang et al. Reference Huang, Wu and Cheng2013a
; Luo et al. Reference Luo, Yao, Yi and Tan2015), which employs a density distribution
 $\eta _i$
and temperature distribution
 $\zeta _i$
to describe the evolution of velocity and temperature, respectively. The evolution equations at grid location
 ${\boldsymbol{x}}$
are given by
 \begin{align} \eta _i(\boldsymbol{x}+\boldsymbol{e}_i, t+1) & =\eta _i(\boldsymbol{x}, t) + \frac {1}{\tau _v}\left [\eta _i^{eq}(\boldsymbol{x}, t) -\eta _i(\boldsymbol{x}, t)\right ] + F_i, \end{align}
 \begin{align} \zeta _i(\boldsymbol{x}+\boldsymbol{e}_i, t+1) & =\zeta _i(\boldsymbol{x}, t) + \frac {1}{\tau _T}\left [\zeta _i^{eq}(\boldsymbol{x}, t)-\zeta _i(\boldsymbol{x}, t) \right ] + S, \end{align}
where
 $\boldsymbol{e}_i$
is the discrete velocity in direction
 $i$
, and
 $\tau$
with different subscripts represents the dimensionless relaxation time. Here,
 $F_i$
is the discretised body force and
 $S$
represents the latent heat source. The equilibrium distributions are expressed as
 \begin{align} \eta _i^{eq}& =\tilde \rho \omega _i \big[ 1+3\boldsymbol{e}_i \boldsymbol{\cdot} \boldsymbol{\tilde u}+4.5(\boldsymbol{e}_i \boldsymbol{\cdot} \boldsymbol{\tilde u})^2 -1.5 \boldsymbol{\tilde u}^2\big], \end{align}
 \begin{align} \zeta _i^{eq}& =\tilde T \omega _i \big[ 1+3\boldsymbol{e}_i \boldsymbol{\cdot} \boldsymbol{\tilde u}+4.5(\boldsymbol{e}_i \boldsymbol{\cdot} \boldsymbol{\tilde u})^2 -1.5 \boldsymbol{\tilde u}^2\big]. \end{align}
The weight coefficient in direction
 $i$
is represented by
 $w_i$
. The density, velocity and temperature are calculated as
 \begin{equation} \tilde \rho =\sum _i \eta _i, \ \tilde \rho \boldsymbol{\tilde u}=\sum _i \eta _i\boldsymbol{e}_i,\ \tilde T=\sum _i \zeta _i. \end{equation}
Notably, all quantities are expressed in lattice units, which can be converted to physical units according to specific rules (Feng, Han & Owen Reference Feng, Han and Owen2007; Xia et al. Reference Xia, Fu, Feng, Gong and Yu2024).
The discretised body force in (A1a ) reads (Guo & Shu Reference Guo and Shu2013)
 \begin{equation} F_i = 3 \omega _i \boldsymbol{e}_i \boldsymbol{\cdot} [- \tilde \rho \boldsymbol{g}\alpha (\tilde T-T_0)]. \end{equation}
The source term in (A1b ) is
 \begin{equation} S = -\omega _i \frac {\mathcal L}{C_p} [{f_{loc}}(\boldsymbol{x},t)- {f_{loc}}(\boldsymbol{x},t-\Delta t)], \end{equation}
which quantifies the propagation effects of melting interface. The local liquid fraction
 ${f_{loc}} (\boldsymbol{x},t)$
is determined from the enthalpy interpolation
 \begin{equation} {f_{loc}} (\boldsymbol{x},t)=\left \{ \begin{array}{lr} 0, & \ \mathrm{if}\ \mathcal H\lt \mathcal H_s=C_p T_f \\[6pt] \frac {\mathcal H- \mathcal H_s}{\mathcal H_l- \mathcal H_s},& \ \mathrm{if}\ \mathcal H_s \leqslant \mathcal H \leqslant \mathcal H_l=\mathcal H_s+\mathcal L \\[6pt] 1, & \ \mathrm{if}\ \mathcal H\gt H_l, \end{array} \right . \end{equation}
where the enthalpy is calculated as
 $\mathcal H=C_p \tilde T +{f_{loc}}(\boldsymbol{x}, t-\Delta t)\mathcal L$
.
By Chapman–Enskog analysis, the mesoscale evolution equations, (A1a
) and (A1b
), recover the macroscopic conservation laws in the limit of low Mach number (Guo & Shu Reference Guo and Shu2013; Huang et al. Reference Huang, Wu and Cheng2013a
). Additionally, this analysis shows that
 $\tau _v = 3\nu +0.5$
and
 $\tau _T=3\kappa +0.5$
.
Comparison between our numerical results and those from Beckermann & Viskanta (Reference Beckermann and Viskanta1989) when
 ${{Ra}}=4.877\times 10^5$
,
 ${Pr}=0.0208$
,
 ${{St}}=7.557\times 10^{-2}$
,
 $\gamma =1$
and
 ${{S}}_T=0.971$
. (a) Interface position at the end of the melting process, with the inset showing the temperature field and streamlines; (b) liquid fraction
 $f$
versus
 $\textit {Fo}{St}$
.

Using the above method, we conduct two-dimensional direct numerical simulations for a lateral heating cavity. The non-equilibrium extrapolation scheme (Guo, Zheng & Shi Reference Guo, Zheng and Shi2002) is implemented to impose both the velocity and temperature boundary conditions. Following previous studies (Favier et al. Reference Favier, Purseed and Duchemin2019; Purseed et al. Reference Purseed, Favier, Duchemin and Hester2020), we assume identical physical properties for the solid and liquid phases. Additionally, micro-scale Gibbs–Thomson effects are neglected, ensuring
 $\tilde T_l = \tilde T_s =T_f$
at the melting interface (Davis et al. Reference Davis, Müller and Dietsche1984; Toppaladoddi & Wettlaufer Reference Toppaladoddi and Wettlaufer2019; Lu et al. Reference Lu, Zhang, Luo, Wu and Yi2022). In figure 4, we compare our numerical results with prior experimental and two-dimensional numerical data (Beckermann & Viskanta Reference Beckermann and Viskanta1989). The demonstrated agreement between the three datasets validates our numerical implementation.
Moreover, the numerical data in figure 4(b) further validate our derived melting curves and the transition criterion. This indicates that our results are applicable not only to the organic PCM n-octadecane, as discussed in the main article, but also to metallic materials (
 ${Pr}=0.0208$
herein corresponding to Gallium (Beckermann & Viskanta Reference Beckermann and Viskanta1989)).
Appendix B. A Posterior Justification of Neglecting Advection Term
We neglect the advection terms in (2.4) to simply the stability analysis, assuming a low Péclect number (
 $Pe = U_0\tilde w_b/\kappa$
) in the conduction-dominated regime. This assumption is validated by examining the evolution of
 $Pe$
in melting processes of three configurations, as shown in figure 5. Within the conduction-dominated regime (
 $f\lt f^{\ast }$
),
 $Pe$
remains low, reaching critical values of 0.22, 0.44 and 0.027 when
 $f =f^{\ast }$
. This directly justifies our low-
 $Pe$
assumption. Furthermore, the predictive capacity (see figure 3
g–i) of the theoretical criterion (2.15) derived from the simplified perturbation equations indirectly corroborates the neglect of advection terms.
Evolution of Péclet number in three configurations: (a)
 ${{Ra}}=1.0 \times 10^6$
,
 ${Pr}=10.0$
,
 ${{St}}=0.1$
,
 $\gamma =3$
and
 ${{S}}_T=0.468$
; (b)
 ${{Ra}}=1.0\times 10^7$
,
 ${Pr}=0.1$
,
 ${{St}}=0.1$
,
 $\gamma =1$
and
 ${{S}}_T=1$
; (c)
 ${{Ra}}=1.0\times 10^8$
,
 ${Pr}=1.0$
,
 ${{St}}=0.1$
,
 $\gamma =1$
and
 ${{S}}_T=0.5$
. The vertical lines represent the critical liquid fraction
 $f^{\ast }$
. These configurations match those in figure 3(g)–(i).

Appendix C. Effect of Stefan Number on the Accuracy of the Theoretical Model
As discussed in the main text, our theory assumes
 ${St} \ll 1$
, so its accuracy depends on the value of
 $St$
. To investigate this dependence, we conduct a series of simulations, as depicted in figure 6. As expected, the discrepancy between theoretical and numerical predictions increases with growing
 $St$
for different parametric combinations. Notably, even though the maximum relative error reaches
 $20\,\%$
, an overall acceptable agreement is seen in figure 6(a,d,g), where
 ${St} = 0.2 \sim 0.4$
. Thus, we may conclude that the model is valid for
 ${St} \lessapprox ( 0.2\sim 0.4 )$
. Indeed, most
 $St$
values in previous studies (Beckermann & Viskanta Reference Beckermann and Viskanta1989; Regin et al. Reference Regin, Solanki and Saini2009; Arasu & Mujumdar Reference Arasu and Mujumdar2012; Ho & Gao Reference Ho and Gao2013; Kean et al. Reference Kean, Sidik and Kaur2019; Khan & Khan Reference Khan and Khan2019) fall within this range, suggesting the relevance of our theoretical model.
Effects of the Stefan number on the validity of the model, illustrated for different configurations: (a–c)
 ${{Ra}}=10^6$
,
 ${Pr}=10$
,
 $\gamma =3$
and
 ${{S}}_T=0.468$
; (d–f)
 ${{Ra}}=10^7$
,
 ${Pr}=0.1$
,
 $\gamma =1$
and
 ${{S}}_T=1$
; (g–i)
 ${{Ra}}=10^8$
,
 ${Pr}=1.0$
,
 $\gamma =1$
and
 ${{S}}_T=0.5$
.

Appendix D. Melting of Nanoparticle-Enhanced PCM in a Basal Heating Cavity
Here, we apply the theoretical framework to a basal heating configuration, which differs from the lateral heating configuration in two ways. First, the isothermal heat source now serves as the cavity’s bottom wall, instead of the vertical wall. Second, the storage materials are now nanoparticle-enhanced PCM (NEPCM), rather than pure PCM. The analytical solution derived from the theoretical framework successfully predicts the performance of different NEPCMs, despite featuring slightly different material properties. This demonstrates that the framework can accurately evaluate the effects of material properties. With this verified solution, we further provide a new explanation for how nanoparticles affect the melting rate.
D.1. Analytical solution
The basal heating configuration, shown in figure 7(a), can be obtained by simply rotating the lateral heating configuration by 90 degrees in the counter-clockwise direction. This rotation does not alter the energy equation or the dimensionless numbers, as repeated below for completeness
 \begin{equation} \frac {\partial {\tilde T}}{\partial \tilde t}+\boldsymbol{\tilde u} \boldsymbol{\cdot} \boldsymbol{\nabla } \tilde {T} =\kappa {\nabla ^2}\tilde {T} -\frac {\mathcal{L}}{C_p}\frac {\partial {f_{loc}}}{\partial \tilde t}, \end{equation}
 \begin{equation} {{Ra}}=\frac {g\alpha \Delta T_l H^3}{\nu \kappa },\ {Pr}=\frac {\nu }{\kappa },\ {St}=\frac { C_p \Delta T_l}{\mathcal{L}}, \ {{S}}_T=\frac {\Delta T_s}{\Delta T_l},\ \gamma =\frac {W}{H}. \end{equation}
However, the rotation changes the thermal boundary conditions, thus leading to a different melting behaviour. Consequently, the Nusselt number
 $\textit {Nu}$
, Fourier time
 $\textit {Fo}$
, liquid fraction
 $f$
and effective Rayleigh number
 ${Ra}_e$
are redefined as
 \begin{align} {\textit {Nu}}&=-\frac {\tilde h}{\Delta T_l} \left\langle \frac {\partial \tilde T}{\partial \tilde x} \right\rangle _{\tilde x=0},\\[-10pt]\nonumber \end{align}
 \begin{align} {\textit {Fo}}&=\frac {\kappa \tilde t}{H^2},\\[-10pt]\nonumber \end{align}
 \begin{align} f&=\frac {\tilde h}{H},\\[-10pt]\nonumber \end{align}
 \begin{align} {Ra}_e&=\frac {g\alpha \Delta T_l \tilde h^3}{\nu \kappa }={Ra} f^3, \end{align}
where
 $\tilde h$
is the average height of the liquid layer, and
 $\langle \ \rangle _{\tilde x=0}$
denotes spatial averaging along the hot wall at
 $\tilde x = 0$
(figure 7
a).
(a) A rectangular cavity filled with subcooled PCM, with the temperature maintained at
 $T_h$
(hot) and
 $T_c$
(cold) at the bottom and top boundaries, respectively. Panels (b) and (c) show typical temperature fields before and after the onset of convection, simulated at
 ${Ra}=10^6$
,
 $Pr=10$
,
 ${St}=0.1$
,
 ${{S}}_T=1.0$
and
 $\gamma =2.0$
. Only the bottom halves of the fields are presented here.

The transition criterion to differentiate melting regimes in this configuration can be obtained through linear stability analysis. The base flow is
 $\tilde {\boldsymbol{u}}_b = {\textbf{0}}$
, since the buoyancy is now horizontally homogeneous as indicated by
 $\partial \tilde T /\partial \tilde y =0$
(figure 7
a). Consequently, the instability phenomenon is very similar to that of the canonical Rayleigh–Bénard convection (figure 7
b,c), and has been extensively investigated (Davis et al. Reference Davis, Müller and Dietsche1984; Kim, Lee & Choi Reference Kim, Lee and Choi2008; Vasil & Proctor Reference Vasil and Proctor2011; Esfahani et al. Reference Esfahani, Hirata, Berti and Calzavarini2018; Madruga & Curbelo Reference Madruga and Curbelo2018; Favier et al. Reference Favier, Purseed and Duchemin2019; Purseed et al. Reference Purseed, Favier, Duchemin and Hester2020).
For the present configuration, the transition criterion is described by a critical effective Rayleigh number
 ${{Ra}}_e^{\ast }$
. It ranges from 1708 to 1493 (Davis et al. Reference Davis, Müller and Dietsche1984), depending on the relative heights of the liquid and solid layers when the melting process is saturated. The highest and lowest
 ${{Ra}}_e^{\ast }$
correspond to similar liquid fractions, as indicated by
 $ ( 1708/1493 )^{1/3}= 1.05$
, following (D3d
). Thus, the critical liquid fraction
 $f^{\ast }$
in subsequent theoretical modelling can be approximated by the median value, analogous to the lateral heating configuration
 \begin{equation} f^{\ast }=\left (\frac {1600.5}{{{Ra}}}\right )^{1/3}. \end{equation}
With this transition criterion
 $f^{\ast }$
, we proceed to develop the mathematical model for the melting curve, following the same framework as in the lateral heating configuration. Neglecting the first term of (D1) and applying Gauss’s theorem to the remaining terms, we obtain
 \begin{equation} \frac {\mathcal{L}}{C_p}\frac {\partial f}{\partial \tilde t} H = \kappa \left [\left\langle \frac {\partial \tilde T}{\partial \tilde x}\right\rangle _{\tilde x=H} - \left\langle \frac {\partial \tilde T}{\partial \tilde x}\right\rangle _{\tilde x=0} \right ]. \end{equation}
For the same reasons as in the lateral heating configuration, the temperature gradient at the cold wall can be considered steady, as
 \begin{equation} \left\langle \frac {\partial \tilde T}{\partial \tilde x} \right \rangle _{\tilde x=H}=-\frac { \Delta T_s}{H-\tilde {h}}, \end{equation}
where
 $H-\tilde h$
quantifies the average height of the solid phase (see figure 7
a).
At the hot wall, the temperature gradient
 $\langle \partial \tilde T/ \partial \tilde x \rangle _{\tilde x=0}$
depends on the conduction and convection states of the liquid phase. When conduction dominates, this gradient becomes
 $-\langle \partial \tilde T/\partial \tilde x\rangle _{\tilde x=0}=\Delta T_l/\tilde h$
, which on combining (D5) and (D6) yields the conduction melting curve
 \begin{equation} \frac {f(1+{{S}}_T)(f-2{{S}}_T+f{{S}}_T)-2{{S}}_T\ln [1-f(1+{{S}}_T)]}{2(1+{{S}}_T)^3} = \textit {Fo}{St}. \end{equation}
This curve exactly matches that in the lateral heating configurations, since the conduction heat transfer solely depends on molecular motion, which is irrelevant to the orientation of the heat source.
As convection dominates, the temperature gradient can be modelled as
 $-\langle \partial \tilde T/\partial \tilde x \rangle _{\tilde x=0}={\textit {Nu}} \Delta T_l/ \tilde h$
following (D3a
), which rearranges (D5) to
 \begin{equation} \frac {\partial f}{\partial \tilde t} = {St} \frac {\kappa }{H^2} \left [ \frac {\textit {Nu}}{f} -\frac {{{S}}_T}{1-f} \right ]. \end{equation}
The Nusselt number in the present configuration is
 $\textit {Nu} \approx 0.1 {Ra}_e^{1/3} = 0.1 {Ra}^{1/3} f$
(Favier et al. Reference Favier, Purseed and Duchemin2019), a typical result predicted by the Grossmann–Lohse theory (Ahlers, Grossmann & Lohse Reference Ahlers, Grossmann and Lohse2009). Substituting this correlation into (D8), we obtain the convection melting curve
 \begin{equation} \frac {f \mathcal{F} -{{S}}_T \ln (f\mathcal{F}+{{S}}_T-\mathcal{F})}{\mathcal{F}^2} = \textit {Fo} {St} +C, \end{equation}
where
 $\mathcal{F} =0.1{Ra}^{1/3}$
and
 $C$
is a constant to be determined. This curve differs from that in the lateral heating configuration, because the convection heat transfer depends on fluid flow, which in turn is influenced by the orientation of the heat source.
Because both conduction and convection melting curves concatenate at
 $ ( {\textit {Fo}}^{\ast } {St},f^{\ast } )$
, subtracting (D7) from (D9) yields the constant
 \begin{align} C &= \frac {f^{\ast } \mathcal{F} -{{S}}_T \ln (f^{\ast }\mathcal{F}+{{S}}_T-\mathcal{F})}{\mathcal{F}^2} \nonumber\\[10pt]& -\frac {f^{\ast }(1+{{S}}_T)(f^{\ast }-2{{S}}_T+f^{\ast }{{S}}_T)-2{{S}}_T\ln [1-f^{\ast }(1+{{S}}_T)]}{2(1+{{S}}_T)^3}. \end{align}
By substituting (D10) into (D9), the domain of the logarithmic function necessitates
 \begin{equation} f \lt f_s=1-\frac {{{S}}_T}{\mathcal F}. \end{equation}
This indicates that melting will cease at a saturated liquid fraction
 $f_s$
, leaving a portion of solid PCM unmelted.
For now, we have derived the analytical solutions for the basal heating configuration, using the theoretical framework outlined in the main article for the lateral heating configuration. These solutions are independent of the cavity’s aspect ratio
 $\gamma$
, whereas those for the lateral configuration depend on
 $\gamma$
. In the following, we will verify the new solutions by the results of Kean et al. (Reference Kean, Sidik and Kaur2019).
D.2. Verification of the analytical solutions
The NEPCM used in Kean et al. (Reference Kean, Sidik and Kaur2019) consists of paraffin wax and various concentrations of
 $\mathrm{Al}_2\mathrm{ O}_3$
nanoparticles, which can address the poor thermal conductivity of traditional PCMs (Levin, Shitzer & Hetsroni Reference Levin, Shitzer and Hetsroni2013; Kibria et al. Reference Kibria, Anisur, Mahfuz, Saidur and Metselaar2015; Jebasingh & Arasu Reference Jebasingh and Arasu2020; Tariq et al. Reference Tariq, Ali, Akram, Janjua and Ahmadlouydarab2020; Yang, Huang & Zhou Reference Yang, Huang and Zhou2020). The thermophysical properties of paraffin wax,
 $\mathrm{Al}_2\mathrm{O}_3$
nanoparticles and NEPCM are summarised in table 1. Here, an experimentally fitted model is utilised to calculate the NEPCM’s density
 $\rho$
, specific heat
 $C_p$
, latent heat
 $\mathcal{L}$
, dynamic viscosity
 $\mu$
and thermal conductivity
 $K$
(Chow, Zhong & Beam Reference Chow, Zhong and Beam1996; Vajjha, Das & Namburu Reference Vajjha, Das and Namburu2010), as
 \begin{align} \rho & = \Psi \rho _{np} +(1-\Psi )\rho _{pw},\\[-10pt]\nonumber \end{align}
 \begin{align} C_p & =\frac {\Psi (\rho c_p)_{np} + (1-\Psi )(\rho C_p)_{pw}}{\rho },\\[-10pt]\nonumber \end{align}
 \begin{align} \mathcal{L} & =\frac {(1-\Psi )(\rho \mathcal L)_{pw}}{\rho },\\[-10pt]\nonumber \end{align}
 \begin{align} \mu & =0.983\exp (12.959\Psi )\mu _{pw},\\[-10pt]\nonumber \end{align}
 \begin{align} K & = \frac {K_{np}+2K_{pw}-2(K_{pw}-K_{np})\Psi }{K_{np}+2K_{pw}+(K_{pw}-K_{np})\Psi }K_{pw}\nonumber\\[4pt]& \quad + 5\times 10^4 \beta _k \zeta \Psi (\rho C_{p})_{pw} \sqrt {\frac {1.381 \times 10^{-23} \tilde T}{\rho _{np} d_{np}}} m, \end{align}
where
 $\Psi$
represents the volume fraction of nanoparticles; here, the subscripts ‘
 $\textit pw$
’ and ‘
 $\textit np$
’ denote paraffin wax and
 $\mathrm{Al}_2\mathrm{O}_3$
nanoparticles, respectively. In (D12e
),
 $d_{np}$
denotes the nanoparticle diameter,
 $\zeta$
is a correction factor equal to the local liquid fraction and
 $\beta _k$
and
 $m$
are expressed by
 \begin{align} \beta _k & =8.4407(100\Psi )^{-1.07304}, \nonumber \\[6pt] m & =(2.8217\times 10^{-2}\Psi + 3.917\times 10^{-3})\frac {T}{273} -(3.0669\times 10^{-2}\Psi + 3.91123\times 10^{-3}). \end{align}
In Kean et al. (Reference Kean, Sidik and Kaur2019), the cavity dimensions are
 $W=H=0.025\ \mathrm{m}$
, and
 $d_{np}=59\ \mathrm{nm}$
. The temperatures at hot and cold walls are
 $T_h=330\ \mathrm{K}$
and
 $T_c=300\ \mathrm{K}$
, respectively. The properties of the NEPCM depend on the temperature field
 $\tilde T$
, which can be obtained by simulations but poses a challenge in model calculations. Consequently, we choose the reference temperature
 $T_0=(T_h+T_f)/2$
as the characteristic value of
 $\tilde T$
. At this characteristic temperature, the properties of the NEPCM can be calculated using (D12) and (D13), as listed in table 1. Notably, other characteristic temperatures, such as
 $T_h$
or
 $T_f$
, will not significantly affect the results.
Properties of paraffin wax,
 $\mathrm{Al}_2\mathrm{O}_3$
nanoparticles and two different NEPCMs (Arasu & Mujumdar Reference Arasu and Mujumdar2012; Kean et al. Reference Kean, Sidik and Kaur2019).

With the properties listed in table 1, the dimensionless numbers in (D2) can be calculated for pure paraffin wax, NEPCM with
 $2\,\%$
 $\mathrm{Al}_2\mathrm{O}_3$
, and NEPCM with
 $5\,\%$
 $\mathrm{Al}_2\mathrm{O}_3$
. The resulting three sets of numbers can then be substituted into the analytical solutions, (D4), (D7), (D9) and (D11), to generate three melting curves. As shown in figure 8, these curves agree with the numerical data of Kean et al. (Reference Kean, Sidik and Kaur2019), thereby verifying our theoretical solutions. With these verified solutions, we will further discuss the effects of nanoparticles on the melting rate.
Comparison between our theoretical prediction and numerical results (squares) of Kean et al. (Reference Kean, Sidik and Kaur2019) for a cavity filled with: (a) pure paraffin wax, (b) NEPCM with
 $2\,\%$
 $\mathrm{Al}_2\mathrm{ O}_3$
and (c) NEPCM with
 $5\,\%$
 $\mathrm{Al}_2\mathrm{O}_3$
.

D.3. Effects of nanoparticles on melting rate
According to (D9), the dimensionless melting times
 $\textit {Fo} {St}$
to achieve
 $f=0.5$
are 0.0332, 0.0399 and 0.0462 for pure paraffin wax, NEPCM with
 $2\,\%$
 $\mathrm{Al}_2\mathrm{O}_3$
and NEPCM with
 $5\,\%$
 $\mathrm{Al}_2\mathrm{O}_3$
, respectively. Correspondingly, the dimensional times
 $\tilde t = \textit {Fo} H^2/\kappa$
are 2480.3, 2197.9 and 2285.7 s, confirming the numerically revealed guideline that NEPCM with
 $2\,\%$
 $\mathrm{Al}_2\mathrm{O}_3$
exhibits the optimal melting rate (Kean et al. Reference Kean, Sidik and Kaur2019). This demonstrates that, although pure paraffin wax, NEPCM with
 $2\,\%$
 $\mathrm{Al}_2\mathrm{O}_3$
, and NEPCM with
 $5\,\%$
 $\mathrm{Al}_2\mathrm{O}_3$
have slightly different properties (table 1), their performance can be accurately differentiated by the present model.
The non-monotonic dependence of the melting rate on
 $\Psi$
is widely attributed to the competition between
 $\mu$
and
 $K$
(Ho et al. Reference Ho, Chen and Li2008, Reference Ho, Liu, Chang and Lin2010; Arasu & Mujumdar Reference Arasu and Mujumdar2012; Ho & Gao Reference Ho and Gao2013; Kibria et al. Reference Kibria, Anisur, Mahfuz, Saidur and Metselaar2015). When
 $\Psi$
increases, both
 $K$
and
 $\mu$
of NEPCM are enlarged. These studies argued that a larger
 $K$
enhances heat transfer thus benefits melting, while an augmented
 $\mu$
hinders heat convection and hence degenerates melting. These opposing effects collectively lead to a non-monotonic variation in melting rate with
 $\Psi$
. Despite its general acceptance, this explanation might lack rigour. According to
 ${{Ra}}={g\alpha \Delta T_l H^3}/{(\nu \kappa )}={g\alpha \Delta T_l H^3 \rho ^2 C_p}/{(\mu K)}$
, increasing
 $K$
and
 $\mu$
both decrease
 $Ra$
, thereby diminishing convection and negatively impacting melting. This indicates that the effects of
 $K$
and
 $\mu$
are not always antagonistic, contrary to the reported explanation. Additionally, nanoparticles not only affect
 $K$
and
 $\mu$
but also change
 $\rho$
,
 $C_p$
and
 $\mathcal L$
, as illustrated in table 1. Thus, the reported explanation, which only considers
 $K$
and
 $\mu$
in competition, might not fully elucidate the impacts of nanoparticles on the melting rate.
On the other hand, our model offers a more rigorous explanation for the non-monotonic relation. Our analytical solution, (D7) and (D9), shows that the melting rate depends on three dimensionless parameters,
 $Ra$
,
 $St$
and
 ${{S}}_T$
. Because the fusion temperature
 $T_f$
barely changes with
 $\Psi$
(Yang et al. Reference Yang, Huang and Zhou2020), the impact of
 ${{S}}_T$
can be safely neglected, allowing us to focus on
 $Ra$
and
 $St$
only. As depicted in figure 8, increasing
 $\Psi$
decreases
 $Ra$
and increases
 $St$
simultaneously. A lower
 $Ra$
weakens convection, thereby impeding melting. Conversely, a higher
 ${St}=C_p\Delta T_l/\mathcal L$
signifies a lower latent heat, hence accelerating melting. These two contrasting trends thus result in the non-monotonic dependence of the melting rate on
 $\Psi$
. The expressions for
 $Ra$
and
 $St$
include all the properties affected by nanoparticles, i.e.
 $K$
,
 $\mu$
,
 $\rho$
,
 $C_p$
and
 $\mathcal L$
. Hence, compared with the reported explanation, our explanation based on
 $Ra$
and
 $St$
encodes a more comprehensive account of how nanoparticles influence the melting rate.
(a) An inclined cavity filled with subcooled PCM, with the bottom wall heated by a parallel electrical heater. Panels (b) and (c) show a comparison between the melting curve and the experimental results (Korti & Guellil Reference Korti and Guellil2020), when the inclination angle
 $\theta =0$
and
 $\pi /4$
, respectively. Panels (d) and (e) are similar to (b) and (c), but for the storage energy.

Appendix E. Melting of PCM in An Inclined Cavity
This section illustrates the application of the theoretical framework in the configuration of an inclined cavity. Compared with the lateral heating configuration, this configuration has a distinct geometric feature characterised by the inclined angle. Moreover, the heat source in this configuration operates at a constant power, rather than maintaining an isothermal temperature. Despite these differences, the melting curve for the current configuration can be derived using the same theoretical framework. Thus, it is reasonable to claim that the theoretical framework is capable of considering the effects of various geometric features and operational conditions. Using the resulting curve, we further calculate the storage energy, which is consistent with the experimental data (Korti & Guellil Reference Korti and Guellil2020), confirming the effectiveness of the framework in predicting the overall system performance.
The inclined cavity investigated here matches that in Korti & Guellil (Reference Korti and Guellil2020), as shown in figure 9(a). Such an inclined setting is typically encountered when PCM containers are deployed on the non-flat surface of a working device (Khan & Singh Reference Khan and Singh2024). The dimensions of this cavity are
 $L=0.045 \ \mathrm{m}$
in depth,
 $W=0.12 \ \mathrm{m}$
in width and
 $H=0.12\ \mathrm{m}$
in height. All its walls are insulated except for the bottom one, which receives heat from a parallel electrical heater operating at a constant power of
 $q=2700\ \mathrm{W\,m^{-2}}$
. These thermal boundary conditions are frequently encountered in applications such as electronic cooling and solar energy collection. The entire system can rotate by an angle
 $\theta$
(figure 9
a), and maintains this orientation. The PCM (paraffin wax, CAS 8002-74-2) is initially in the solid phase at a temperature of
 $T_c=296.65 \ \mathrm{K}$
. The thermophysical properties of the PCM are summarised in table 2.
Properties of the paraffin wax, CAS 8002-74-2 (Korti & Guellil Reference Korti and Guellil2020).

Using the same framework as applied to the lateral heating cavity, the melting curve for the inclined cavity can be derived as follows. By neglecting the sensible heat term in (2.16) and applying Gauss’s theorem to the remaining terms, we obtain
 \begin{equation} \frac {\mathcal{L}}{C_p}\frac {\partial f}{\partial \tilde t}W H = \int (\kappa \boldsymbol{\nabla } \tilde T)_{\tilde x=0} \boldsymbol{\cdot} \boldsymbol{n} \mathrm{d}A. \end{equation}
The area element at the bottom wall is
 $\mathrm{d}A=\mathrm{d}y\times 1$
, with
 $\boldsymbol{n}=(-1,\ 0)$
representing the outward unit normal vector (figure 9
a). The temperature gradient at this wall
 $(\boldsymbol{\nabla } \tilde T)_{\tilde x=0}$
can be related to the heater’s power
 $q$
, as explained below.
The PCM container is separated from the electrical heater by a small gap, within which vertical air plumes arise due to buoyancy (figure 9 a). Receiving it from the heater, the plumes transfer the heat to the cavity when they impinge on the bottom wall. Thus, during the impingement process, we obtain
 \begin{equation} -\rho C_p \kappa (\boldsymbol{\nabla } \tilde T)_{\tilde x=0}=q(\cos \theta ,\ \sin \theta ), \end{equation}
where the right-hand side represents the heat flux carried by the plumes, as shown in figure 9(a). This equation indicates that the wall temperature gradient does not depend on the conduction and convection melting regimes. Therefore, linear stability analysis, which is required in the lateral heating configuration to distinguish different regimes, is not necessary in this configuration.
Based on (E2), the integration of wall temperature gradient can be calculated as
 \begin{equation} \int (\kappa \boldsymbol{\nabla } \tilde T)_{\tilde x=0} \boldsymbol{\cdot} \boldsymbol{n} \mathrm{d}A = \int _0^W \frac {q}{\rho C_p} \cos \theta \mathrm{d}y =\frac {q\cos \theta }{\rho C_p}W. \end{equation}
Subsequently, the melting curve can be obtained from (E1), as
 \begin{equation} f=t\cos \theta , \end{equation}
where the dimensionless time is
 $t=q \tilde t/(\rho H \mathcal L)$
. This curve does not impose any constraint on the liquid fraction
 $f$
. Thus, its saturated value is
 $f_s =1$
, indicating that the solid PCM can be completely melted. Notably, at a large inclination, e.g.
 $\theta \geqslant \pi /2$
, the vertical air plumes do not impinge on the bottom wall. Accordingly, (E2) no longer holds, and determining
 $ (\boldsymbol{\nabla } \tilde T)_{\tilde x=0}$
would require analysis of the flow field within the gap. This is beyond the scope of this study, which is hence not pursued here.
According to (E4), the derived melting curve accounts for the effects of material properties (
 $\rho$
and
 $\mathcal L$
), geometric features (
 $H$
and
 $\theta$
) and operational condition (
 $q$
). This curve is well verified against the experimental results (Korti & Guellil Reference Korti and Guellil2020) at
 $\theta =0$
and
 $\theta =\pi /4$
, as shown in in figures 9(b) and 9(c). This verified curve can then be used to calculate the energy density (2.23). The energy density
 $\textit {ED}$
, when multiplied by the container volume (
 $W\times H \times L$
), yields the storage energy, which is consistent with the experimental result (figure 9
d,e), thereby confirming the model’s effectiveness. The power density is the time derivative of
 $\textit {ED}$
, which is hence not verified here separately.
Appendix F. Melting of PCM in An Annular Tube
Here, we apply the theoretical framework to the configuration of an annular tube. This configuration differs significantly from the lateral heating configuration in terms of the container’s geometry. Moreover, the heat source in this configuration operates at constant power, rather than maintaining an isothermal temperature. Despite these differences, the melting curve for the current configuration can be derived using the same theoretical framework. This curve is well validated by the experimental results (Dhaidan et al. Reference Dhaidan, Khodadadi, Al-Hattab and Al-Mashat2013), confirming the capability of the theoretical framework to account for the effects of various geometric features and operational conditions.
(a) An annular tube filled with subcooled PCM. (b) Comparison between our predicted melting curve and the experimental results (Dhaidan et al. Reference Dhaidan, Khodadadi, Al-Hattab and Al-Mashat2013).

The configuration of the annular tube is the same as that in Dhaidan et al. (Reference Dhaidan, Khodadadi, Al-Hattab and Al-Mashat2013), as shown in figure 10(a). In this set-up, the outer shell and inner tube are coaxially arranged with radii of of
 $R_o=22.25 \ \mathrm{mm}$
and
 $R_i = 9.5 \ \mathrm{mm }$
, respectively. The outer shell is insulated, while the inner tube is heated by an electrical heater operating at a constant power
 $q$
. The space between the shell and tube contains n-octadecane paraffin. Initially, this PCM is in the solid phase at a temperature of
 $T_c=295.85 \ \mathrm{K}$
, and its thermophysical properties are summarised in table 3.
Properties of n-octadecane paraffin (Dhaidan et al. Reference Dhaidan, Khodadadi, Al-Hattab and Al-Mashat2013).

Following the same framework outlined in the main article, the melting curve for this annular tube is derived as follows. By neglecting the sensible heat term in (2.16) and applying Gauss’s theorem to the remaining terms, we obtain
 \begin{equation} \frac {\mathcal{L}}{C_p}\frac {\partial f}{\partial \tilde t} \big({\pi} R_o^2-R_i^2\big) = \int (\kappa \boldsymbol{\nabla } \tilde T)_{\tilde r=R_i} \boldsymbol{\cdot} \boldsymbol{n} \mathrm{d}A. \end{equation}
The area element of the tube wall is
 $\mathrm{d}A=\mathrm{d}\theta R_i \times 1$
, with
 $\boldsymbol{n}=(-\cos \theta ,-\sin \theta )$
representing the outward unit normal vector (figure 10
a). The temperature gradient at this wall
 $( \boldsymbol{\nabla } \tilde T)_{\tilde r=R_i}$
can be related to the heater’s power
 $q$
, as shown below.
The inner tube is separated from the electrical heater by a small gap, within which vertical air plumes arise due to buoyancy (figure 10 a). These plumes receive heat from the heater, and then transfer it to the upper half of the inner tube when they impinge on the tube wall. Thus, during the impingement process, we obtain
 \begin{equation} -\rho C_p \kappa (\boldsymbol{\nabla } \tilde T)_{\tilde r=R_i}=q(0,1), \end{equation}
where the right-hand side represents the heat flux carried by the plumes, as shown in figure 10(a). This equation indicates that the wall temperature gradient does not depend on the conduction and convection melting regimes. Therefore, linear stability analysis is not necessary here.
Using (F2), the integration of wall temperature gradient can be calculated by
 \begin{equation} \int (\kappa \boldsymbol{\nabla } \tilde T)_{\tilde r=R_i} \boldsymbol{\cdot} \boldsymbol{n} \mathrm{d}A = \int _0^\pi \frac {q}{\rho C_p} \sin \theta \ R_i \mathrm{d}\theta =\frac {2 R_i q}{\rho C_p}. \end{equation}
Subsequently, the melting curve can be obtained from (F1) as
 \begin{equation} f=t, \end{equation}
where the dimensionless time is
 $t=2R_i q \tilde t/[\pi \rho \mathcal L (R_o^2-R_i^2)]$
. This curve does not impose any constraint on
 $f$
. Thus, the saturated value should be
 $f_s =1$
, indicating that the solid PCM can be completely melted.
According to (F4), the derived melting curve accounts for the effects of material properties (
 $\rho$
and
 $\mathcal L$
), geometric features (
 $R_i$
and
 $R_o$
) and operational condition (
 $q$
). Figure 10(b) suggests that this curve agrees reasonably well with the experimental data (Dhaidan et al. Reference Dhaidan, Khodadadi, Al-Hattab and Al-Mashat2013) when
 $q =1821.3 \ \mathrm{ W\,m^{-2}}$
and
 $q =3022.5 \ \mathrm{W\,m^{-2}}$
, verifying our theoretical solutions.


 Open access

