1 Introduction
1.1 Background
Free-surface waves induced by flow over a submerged obstacle can broadly be divided into waves in which the dominant effect is gravity, and waves in which the dominant effect is surface tension, known as capillary waves. The behaviour of waves on the length scale of large obstacles, such as ships or submarines, tends to be dominated by gravitational effects; however, surface tension plays an important role at smaller scales. In this study, we perform an asymptotic study of capillary waves caused by flow over a submerged source in the small-surface-tension limit.
Much of the early theoretical work on the behaviour of capillary waves on a steady stream is summarised in Whitham (Reference Whitham1974), which contains a demonstration that capillary waves caused by flow past an obstacle have a group velocity faster than the flow speed in two dimensions, and therefore any steady wavetrain must be found upstream from the obstacle. Early studies on the behaviour of capillary waves in the absence of gravity include Crapper (Reference Crapper1957), who derived an exact closed-form solution for two-dimensional capillary waves on infinitely deep water, and Kinnersley (Reference Kinnersley1976), who obtained similar solutions for capillary waves on water of finite depth.
Further studies on related two-dimensional capillary wave systems include Vanden-Broeck & Keller (Reference Vanden-Broeck and Keller1980), who discovered a new family of nonlinear capillary wave solutions on deep water. Hogan (Reference Hogan1979, Reference Hogan1984, Reference Hogan1986) studied particle trajectories in capillary wave systems, finding a range of symmetric and anti-symmetric wave patterns. More recently, Vanden-Broeck, Miloh & Spivack (Reference Vanden-Broeck, Miloh and Spivack1998) extended the results of Crapper (Reference Crapper1957) and Kinnersley (Reference Kinnersley1976) to axisymmetric domains, while Crowdy (Reference Crowdy1999) extended the solutions by Kinnersley (Reference Kinnersley1976) in order to consider capillary waves on the surface of multiply connected fluid domains. Crowdy (Reference Crowdy2001) and Blyth & Vanden-Broeck (Reference Blyth and Vanden-Broeck2004) used complex variable methods to determine the behaviour of capillary waves on a flat and curved fluid sheet respectively, and Vanden-Broeck (Reference Vanden-Broeck1996) studied the behaviour of capillary waves in systems with varying surface tension. Vanden-Broeck (Reference Vanden-Broeck2004) provides a broad summary of known results on two-dimensional nonlinear capillary wave systems, including flows past geometries and around obstacles. Importantly, we note that Chapman & Vanden-Broeck (Reference Chapman and Vanden-Broeck2002) studied the behaviour of exponentially small capillary waves in two dimensions, using asymptotic methods similar to those applied in the present study.
Each of these previous investigations concentrated on capillary waves in two dimensions. Capillary waves in three-dimensional systems are less well studied. There do exist a large number of numerical studies into the behaviour of gravity–capillary waves induced by flow past an obstacle or pressure distribution in three dimensions. Many of these are found in Dias & Kharif (Reference Dias and Kharif1999) and Vanden-Broeck (Reference Vanden-Broeck2010), and the references therein. Other three-dimensional studies have concentrated on exploring capillary wave behaviour caused by rotating obstacles, such as whirligig beetles (Tucker Reference Tucker1969; Chepelianskii, Chevy & Raphael Reference Chepelianskii, Chevy and Raphael2008). In particular, we will note that our results are qualitatively similar to figure 2 of Tucker (Reference Tucker1969), which depicts an experimental image of a whirligig beetle travelling through water in a straight line. This experimental fluid regime is consistent with the parameter regime in the present study, although, of course, the beetle is not submerged.
Here we are concerned with three-dimensional capillary waves in the small-surface-tension limit. This is a challenging limit to explore, as the behaviour of capillary waves past a submerged obstacle in this limit cannot be captured by an asymptotic power series: the capillary wave amplitude is typically exponentially small in the surface tension.
We can motivate this claim by considering a steady train of two-dimensional surface waves on deep water. From Whitham (Reference Whitham1974), we find that, after neglecting gravitational effects, the wavelength of two-dimensional linearised capillary waves, denoted by
 $\unicode[STIX]{x1D706}$
, on a steady flow with velocity
 $U$
, representative length scale
 $L$
, surface tension
 $\unicode[STIX]{x1D70E}$
and density
 $\unicode[STIX]{x1D70C}$
is given by
 $$\begin{eqnarray}\frac{\unicode[STIX]{x1D706}}{L}=\frac{2\unicode[STIX]{x03C0}\unicode[STIX]{x1D70E}}{\unicode[STIX]{x1D70C}LU^{2}}=2\unicode[STIX]{x03C0}\unicode[STIX]{x1D716},\end{eqnarray}$$
where
 $\unicode[STIX]{x1D716}=\unicode[STIX]{x1D70E}/\unicode[STIX]{x1D70C}LU^{2}$
is the inverse Weber number. Since the velocity potential
 $\unicode[STIX]{x1D719}$
satisfies Laplace’s equation, solutions which oscillate with the required wavelength are given (up to a phase shift) by
 $$\begin{eqnarray}\unicode[STIX]{x1D719}=(C_{1}\text{e}^{y/\unicode[STIX]{x1D716}}+C_{2}\text{e}^{-y/\unicode[STIX]{x1D716}})\sin (x/\unicode[STIX]{x1D716}),\end{eqnarray}$$
where all distances have been scaled by
 $L$
, and
 $C_{1}$
and
 $C_{2}$
are arbitrary constants. Thus we might expect the impact of a submerged object on waves on the free surface to decay exponentially with the distance of the object from the free surface relative to
 $\unicode[STIX]{x1D716}$
. Consequently, asymptotic studies of capillary wave behaviour in the limit
 $\unicode[STIX]{x1D716}\rightarrow 0$
require the use of exponential asymptotic techniques.
While the neglect of gravity in the present study limits the range of its applicability, it provides a step towards an analysis of a system containing both gravity and capillary waves. In two dimensions an exponential asymptotic analysis has been performed on gravity–capillary systems with small surface tension and small Froude number by Trinh & Chapman (Reference Trinh and Chapman2013a ,Reference Trinh and Chapman b ). These studies found an intricate interplay between gravity and capillary waves with a structure considerably more complicated than that of each effect considered in isolation. An equivalent three-dimensional analysis would be challenging, and this study at least provides an answer in the limit that capillarity dominates gravity.
Exponential asymptotic methods have been applied in order to study a range of other wave problems arising in fluid dynamics. Chapman & Vanden-Broeck (Reference Chapman and Vanden-Broeck2006) applied exponential asymptotic methods to resolve the low speed paradox, finding the behaviour of exponentially small two-dimensional gravity waves over a step in the small-Froude-number limit. This was extended in Lustri, McCue & Binder (Reference Lustri, McCue and Binder2012) to describe the waves caused by flow past submerged slopes, ridges or trenches, by Lustri, McCue & Chapman (Reference Lustri, McCue and Chapman2013) to describe gravity waves caused by flow past a submerged line source and by Trinh, Chapman & Vanden-Broeck (Reference Trinh, Chapman and Vanden-Broeck2011), Trinh & Chapman (Reference Trinh and Chapman2014) in order to describe gravity waves caused by ship hulls in two dimensions. These ideas were extended to three dimensions by Lustri & Chapman (Reference Lustri and Chapman2013) for the case of steady linearised flow past a source, and Lustri & Chapman (Reference Lustri and Chapman2014) for the corresponding unsteady problem. Shallow gravity–capillary waves with small surface tension have also been the subject of a number of studies using exponential asymptotics, including Pomeau, Ramani & Grammaticos (Reference Pomeau, Ramani and Grammaticos1988), Boyd (Reference Boyd1991, Reference Boyd1998), Grimshaw & Joshi (Reference Grimshaw and Joshi1995), Yang & Akylas (Reference Yang and Akylas1996), Grimshaw (Reference Grimshaw, Steinrück, Pfeiffer, Rammerstorfer, Salençon, Schrefler and Serafini2011), Trinh (Reference Trinh, Steinrück, Pfeiffer, Rammerstorfer, Salençon, Schrefler and Serafini2011).
Aside from Lustri & Chapman (Reference Lustri and Chapman2013, Reference Lustri and Chapman2014), each of the previous exponential asymptotic studies on fluid flow behaviour have been performed in two dimensions. We will therefore follow the methodology of Lustri & Chapman (Reference Lustri and Chapman2013, Reference Lustri and Chapman2014), in which we linearise the problem around the source strength in order to fix the position of the boundary in the linearised regime. We will then apply exponential asymptotic techniques directly to the flow equations in order to determine the fluid potential, and the free-surface position.
1.2 Fluid regime
The combination of inviscid flow and capillary-dominated surface waves is an unusual one. This implies that we are considering systems in which both viscous effects and gravitational effects are negligible compared to surface tension. For the inviscid fluid flow model to be valid, we require that the inverse of the Reynolds number, given by
 $1/Re=\unicode[STIX]{x1D707}/\unicode[STIX]{x1D70C}UL$
where
 $\unicode[STIX]{x1D707}$
is the dynamic viscosity of the fluid, be small. In this case, the Bernoulli condition for gravity–capillary waves, expressed in terms of the surface tension parameter
 $\unicode[STIX]{x1D716}$
and the Froude number
 $F$
, is given by
 $$\begin{eqnarray}\frac{1}{2}(|\unicode[STIX]{x1D735}\unicode[STIX]{x1D719}|^{2}-1)+\frac{\unicode[STIX]{x1D709}}{F^{2}}+\unicode[STIX]{x1D716}\unicode[STIX]{x1D705}=0\quad \text{on}~z=\unicode[STIX]{x1D709},\end{eqnarray}$$
where
 $\unicode[STIX]{x1D719}$
is the complex potential,
 $\unicode[STIX]{x1D709}$
is the free-surface position,
 $\unicode[STIX]{x1D705}$
is the surface curvature and the Froude number is given by
 $F=U/\sqrt{gL}$
. We see that, for the surface behaviour to be dominated by surface tension effects, we require
 $1/F^{2}\ll \unicode[STIX]{x1D716}$
. Consequently, the regime under consideration is given by
 $$\begin{eqnarray}Re^{-1},\quad F^{-2}\ll \unicode[STIX]{x1D716}\ll 1.\end{eqnarray}$$
In contrast to the associated analysis on gravity waves performed by Lustri & Chapman (Reference Lustri and Chapman2013, Reference Lustri and Chapman2014), this set of scalings is not relevant to the study of submerged obstacles such as submarines. These scalings are instead associated with ripples caused by small submerged objects, such as fish or insects, which move rapidly, or by thin sheets of fast moving fluid.
For example, using values of the density, viscosity and surface tension of water/air at
 $20\,^{\circ }\text{C}$
from Batchelor (Reference Batchelor1953) we require that
 $$\begin{eqnarray}U\ll 72~\text{m}~\text{s}^{-1},\quad L\ll 2.7~\text{mm},\quad LU^{2}\gg 0.000073~\text{m}^{3}~\text{s}^{-2}.\end{eqnarray}$$
Using values
 $L=1$
mm and
 $U=0.5~\text{m}~\text{s}^{-1}$
, gives
 $Re^{-1}\approx 0.002008$
,
 $F^{-2}\approx 0.03922$
and
 $\unicode[STIX]{x1D716}\approx 0.2917$
. Studies of capillary waves in liquids other than water (such as liquid silicon or liquid gallium, whose capillary waves were investigated in Fork et al. (Reference Fork, Anderson, Boyce, Johnson and Mei1996) and Regan et al. (Reference Regan, Pershan, Magnussen, Ocko, Deutsch and Berman1996) respectively), will necessarily produce different parameter regimes in which the current analysis is asymptotic valid. We note that, as is typical of asymptotic results, the expressions for capillary wave behaviour obtained in this study are still useful in practice even outside of the regime of formal validity. For example, we will show in figure 4 that the asymptotic wave behaviour provides an accurate approximation even for values of
 $\unicode[STIX]{x1D716}$
that are not extremely small.
1.3 Methodology
In order to study the behaviour of capillary waves due to flow past submerged obstacles, we will adapt the exponential asymptotic methodology of Lustri & Chapman (Reference Lustri and Chapman2013) for the steady flow case, and Lustri & Chapman (Reference Lustri and Chapman2014) for the unsteady flow case. These studies considered flow past submerged obstacles in the small-Froude-number limit. The surface waves were found to be exponentially small in this limit, and therefore could not be studied using classical asymptotic power series techniques. Instead, exponential asymptotic techniques were applied to determine the solution, and it was found that the gravity waves were switched on as certain curves on the free surface, known as Stokes curves, were crossed. We will see that similar behaviour is present in the solution to the capillary wave problem in the small-surface-tension limit.
Stokes (Reference Stokes1864) first observed that a function containing multiple exponential terms in the complex plane can contain curves along which the behaviour of the subdominant exponential changes rapidly. These curves are known as Stokes lines. This investigation will apply the exponential asymptotic technique developed by Olde Daalhuis et al. (Reference Olde Daalhuis, Chapman, King, Ockendon and Tew1995) and extended by Chapman et al. (Reference Chapman, King, Ockendon and Adams1998) for investigating the smooth, rapid switching of exponentially small asymptotic contributions across Stokes lines.
The first step in this technique is to express the solution as an asymptotic power series, such as
 $$\begin{eqnarray}f(x;\unicode[STIX]{x1D716})\sim \mathop{\sum }_{n=0}^{\infty }\unicode[STIX]{x1D716}^{n}f_{n}(x)\quad \text{as}~\unicode[STIX]{x1D716}\rightarrow 0.\end{eqnarray}$$
As the capillary wave problem is singularly perturbed in the small-surface-tension limit, the series will be divergent. However, the error of the divergent series approximation can be minimised by truncating the series after some finite number of terms, known as the optimal truncation point. To find the optimal truncation point, we follow the commonly used heuristic described by Boyd (Reference Boyd1999), in which the series is truncated at its smallest term. Chapman et al. (Reference Chapman, King, Ockendon and Adams1998) observed that the optimal truncation point tends to become large in the asymptotic limit, and hence knowledge of the behaviour of the late-order terms of the series (that is, the form of
 $a_{n}$
in the limit that
 $n\rightarrow \infty$
) is sufficient to truncate the asymptotic series optimally.
In singular perturbation problems, Dingle (Reference Dingle1973) noted that successive terms in the asymptotic series expansion are typically obtained by repeated differentiation of an earlier term in the series. Consequently, singularities present in the early terms of the series expression will persist into later terms. Furthermore, as these singularities are repeatedly differentiated, the series terms will diverge as the ratio between a factorial and the increasing power of a function
 $\unicode[STIX]{x1D712}$
which is zero at the singularity. Chapman et al. (Reference Chapman, King, Ockendon and Adams1998) therefore propose that the asymptotic behaviour of the series terms may be expressed as a sum of factorial-over-power ansatz expressions, each associated with a different early-order singularity, such as
 $$\begin{eqnarray}f_{n}\sim \frac{F\unicode[STIX]{x1D6E4}(n+\unicode[STIX]{x1D6FE})}{\unicode[STIX]{x1D712}^{n+\unicode[STIX]{x1D6FE}}}\quad \text{as}~n\rightarrow \infty ,\end{eqnarray}$$
where
 $\unicode[STIX]{x1D6E4}$
is the gamma function defined in DLMF (2018),
 $F$
,
 $\unicode[STIX]{x1D6FE}$
and
 $\unicode[STIX]{x1D712}$
are functions that do not depend on
 $n$
, and
 $\unicode[STIX]{x1D712}=0$
at the singularity in the early series terms. They conclude that the correct late-term behaviour may be represented as the sum of these ansatz expressions, each associated with a different singularity of the leading-order solution. The global behaviour of the functions
 $F$
,
 $\unicode[STIX]{x1D6FE}$
and
 $\unicode[STIX]{x1D712}$
may be found by substituting this ansatz directly into the equations governing the terms of the asymptotic series, and then matching to the local behaviour in the neighbourhood of the singularity under consideration.
The late-order term behaviour given in (1.7) is related to applying a Wentzel–Kramers–Brillouin (WKB) ansatz of the form
 $F\text{e}^{-\unicode[STIX]{x1D712}/\unicode[STIX]{x1D716}}$
to the equation for
 $f$
linearised about the truncated expansion. The behaviour of
 $\unicode[STIX]{x1D712}$
, or the singulant, therefore plays an important role in understanding the Stokes line behaviour. In fact, Dingle (Reference Dingle1973) notes that Stokes switching takes place on curves where the switching exponential is maximally subdominant to the leading-order behaviour; this occurs where the singulant is purely real and positive. Hence, the singulant provides a useful condition to determine the possible location of Stokes lines:
 $$\begin{eqnarray}\text{Re}(\unicode[STIX]{x1D712})>0,\quad \text{Im}(\unicode[STIX]{x1D712})=0.\end{eqnarray}$$
We also note another interesting class of curves, known as anti-Stokes lines. These are curves across which an exponentially small solution contribution switches to instead be exponentially large in the asymptotic limit. From the WKB ansatz of the exponential contribution, it is apparent that anti-Stokes lines correspond to curves satisfying
 $$\begin{eqnarray}\text{Re}(\unicode[STIX]{x1D712})=0.\end{eqnarray}$$
Once the form of the late-order terms is established, we may find the smallest term in the series, and hence truncate the series optimally. This gives
 $$\begin{eqnarray}f(x;\unicode[STIX]{x1D716})=\mathop{\sum }_{n=0}^{N-1}\unicode[STIX]{x1D716}^{n}a_{n}(x)+R_{N},\end{eqnarray}$$
where
 $N(x;\unicode[STIX]{x1D716})$
is the optimal truncation point, and
 $R_{N}$
is the now exponentially small remainder term.
The method of Olde Daalhuis et al. (Reference Olde Daalhuis, Chapman, King, Ockendon and Tew1995) now involves substituting the truncated series expression back into the original problem, obtaining an equation for the remainder term. The switching behaviour of this remainder is found by solving the remainder equation in the neighbourhood of Stokes lines; in fact, the condition (1.8) for the position of the Stokes lines can be found directly through this process. This methodology is sufficient to determine the capillary wave behaviour in steady three-dimensional flow over a submerged source.
However, this methodology alone is not enough to explain the behaviour seen in the unsteady capillary wave problem. The exponential asymptotic methodology of Olde Daalhuis et al. (Reference Olde Daalhuis, Chapman, King, Ockendon and Tew1995) and Chapman et al. (Reference Chapman, King, Ockendon and Adams1998) was developed for investigating ordinary differential equations. Because the flow surface is two-dimensional, we require the extension of these techniques to partial differential equations which was developed by Chapman & Mortimer (Reference Chapman and Mortimer2005).
Initially, the method is identical, however in some partial differential equations (and indeed, in higher-order differential equations), further variants of Stokes switching may occur. If the remainder itself is expanded as
 $$\begin{eqnarray}R_{N}\sim \text{e}^{-\unicode[STIX]{x1D712}/\unicode[STIX]{x1D716}}\mathop{\sum }_{n=0}^{\infty }\unicode[STIX]{x1D716}^{n}R_{N}^{(n)}\quad \text{as}~\unicode[STIX]{x1D716}\rightarrow 0,\end{eqnarray}$$
then again applying the method of Olde Daalhuis et al. (Reference Olde Daalhuis, Chapman, King, Ockendon and Tew1995) and Chapman et al. (Reference Chapman, King, Ockendon and Adams1998), we truncate optimally, giving
 $$\begin{eqnarray}R_{N}=\text{e}^{-\unicode[STIX]{x1D712}/\unicode[STIX]{x1D716}}\mathop{\sum }_{n=0}^{M-1}\unicode[STIX]{x1D716}^{n}R_{N}^{(n)}+S_{M},\end{eqnarray}$$
where
 $S_{M}$
is the new (doubly) exponentially subdominant remainder term. It is obviously possible to formulate problems in which the remainder
 $S_{M}$
may be expanded as another exponentially subdominant divergent asymptotic series, and so on. Hence, we find that a hierarchy of increasingly exponentially subdominant late-order contributions may be present in the asymptotic expression.
The unsteady capillary wave problem contains two distinct pairs of exponentials in the asymptotic solution, related to steady and transient rippling behaviour, and the switching interaction between these pairs plays an important role in describing the solution. In this case, switching also occurs when one exponential component is maximally subdominant to another exponential component. To find curves along which an exponential component with singulant
 $\unicode[STIX]{x1D712}_{1}$
can switch a subdominant exponential component with singulant
 $\unicode[STIX]{x1D712}_{2}$
, the switching condition instead becomes
 $$\begin{eqnarray}\text{Re}(\unicode[STIX]{x1D712}_{2})>\text{Re}(\unicode[STIX]{x1D712}_{1}),\quad \text{Im}(\unicode[STIX]{x1D712}_{2})=\text{Im}(\unicode[STIX]{x1D712}_{1}).\end{eqnarray}$$
Note that setting
 $\unicode[STIX]{x1D712}_{1}=0$
, corresponding to the leading-order algebraic contribution to the solution, reproduces the condition (1.8).
Finally, in order to fully describe the solution behaviour for the unsteady capillary wave problem, we must also consider a further variant of Stokes switching behaviour, known as higher-order Stokes phenomenon. Higher-order Stokes switching was first observed by Berk, Nevis & Roberts (Reference Berk, Nevis and Roberts1982) and Aoki, Koike & Takei (Reference Aoki, Koike, Takei, Kawai and Fujita2002), and explained in detail by Howls, Langman & Olde Daalhuis (Reference Howls, Langman and Olde Daalhuis2004), Body, King & Tew (Reference Body, King and Tew2005) and Chapman & Mortimer (Reference Chapman and Mortimer2005). These studies found that higher-order Stokes switching behaviour typically plays a role when there are three or more singulants contributing to the solution (including the algebraic-order singulant,
 $\unicode[STIX]{x1D712}=0$
).
When an ordinary Stokes line is crossed, an exponentially small contribution is switched on. This small exponential term is multiplied by a prefactor known as a Stokes switching parameter. When a higher-order Stokes line is crossed, this switching parameter itself is switched on or off. The effect of this higher-order switching is that ordinary Stokes lines themselves are switched on or off as higher-order Stokes lines are crossed. This switching occurs at points on higher-order Stokes lines where multiple ordinary Stokes lines intersect, known as Stokes crossing points. The practical effect of this switching is that ordinary Stokes lines can terminate at Stokes crossing points.
Howls et al. (Reference Howls, Langman and Olde Daalhuis2004) showed that when a problem contains three or more singulant contributions, associated with
 $\unicode[STIX]{x1D712}_{1}$
,
 $\unicode[STIX]{x1D712}_{2}$
and
 $\unicode[STIX]{x1D712}_{3}$
, higher-order Stokes lines can follow curves satisfying the criterion
 $$\begin{eqnarray}\text{Im}\left[\frac{\unicode[STIX]{x1D712}_{3}-\unicode[STIX]{x1D712}_{2}}{\unicode[STIX]{x1D712}_{3}-\unicode[STIX]{x1D712}_{1}}\right]=0.\end{eqnarray}$$
Unsteady free-surface flow, such as the unsteady gravity wave problem considered in Lustri & Chapman (Reference Lustri and Chapman2014), does contain three interacting contributions (exponentially small steady and transient ripples, and algebraic effects which have
 $\unicode[STIX]{x1D712}=0$
); hence, higher-order Stokes lines must play a role in the solution. It is therefore not sufficient to find the ordinary Stokes lines in this problem, as the Stokes structure would be incorrect. Instead we must also determine the higher-order Stokes line behaviour, and therefore the location at which the ordinary Stokes lines are switched on and off. This will permit us to determine the full asymptotic free-surface wave behaviour.
We note that the capillary wave problem considered in the present study is linear, and that the solution can be written as a multiple integral. A number of exponential asymptotic methods have been developed for the study of integral equations, including Berry & Howls (Reference Berry and Howls1990), Berry (Reference Berry, Segur, Tanveer and Levine1991), Bennett et al. (Reference Bennett, Howls, Nemes and Olde Daalhuis2018) and elsewhere. It is possible that these methods could be applied to obtain equivalent results from the integral form of the solution; however, we elect to apply exponential asymptotic analysis directly to the governing equations of the system.
2 Steady flow
2.1 Formulation
We consider the steady-state problem of uniform flow past a submerged point source in three dimensions. We suppose that the strength of the source is small so that the problem may be linearised.
2.1.1 Full problem
We consider a three-dimensional incompressible, irrotational, inviscid free-surface flow of infinite depth with a submerged point source at depth
 $H$
and upstream flow velocity
 $U$
. We normalise the fluid velocity with
 $U$
and distance with a typical length
 $L$
, giving non-dimensionalised source depth
 $h=H/L$
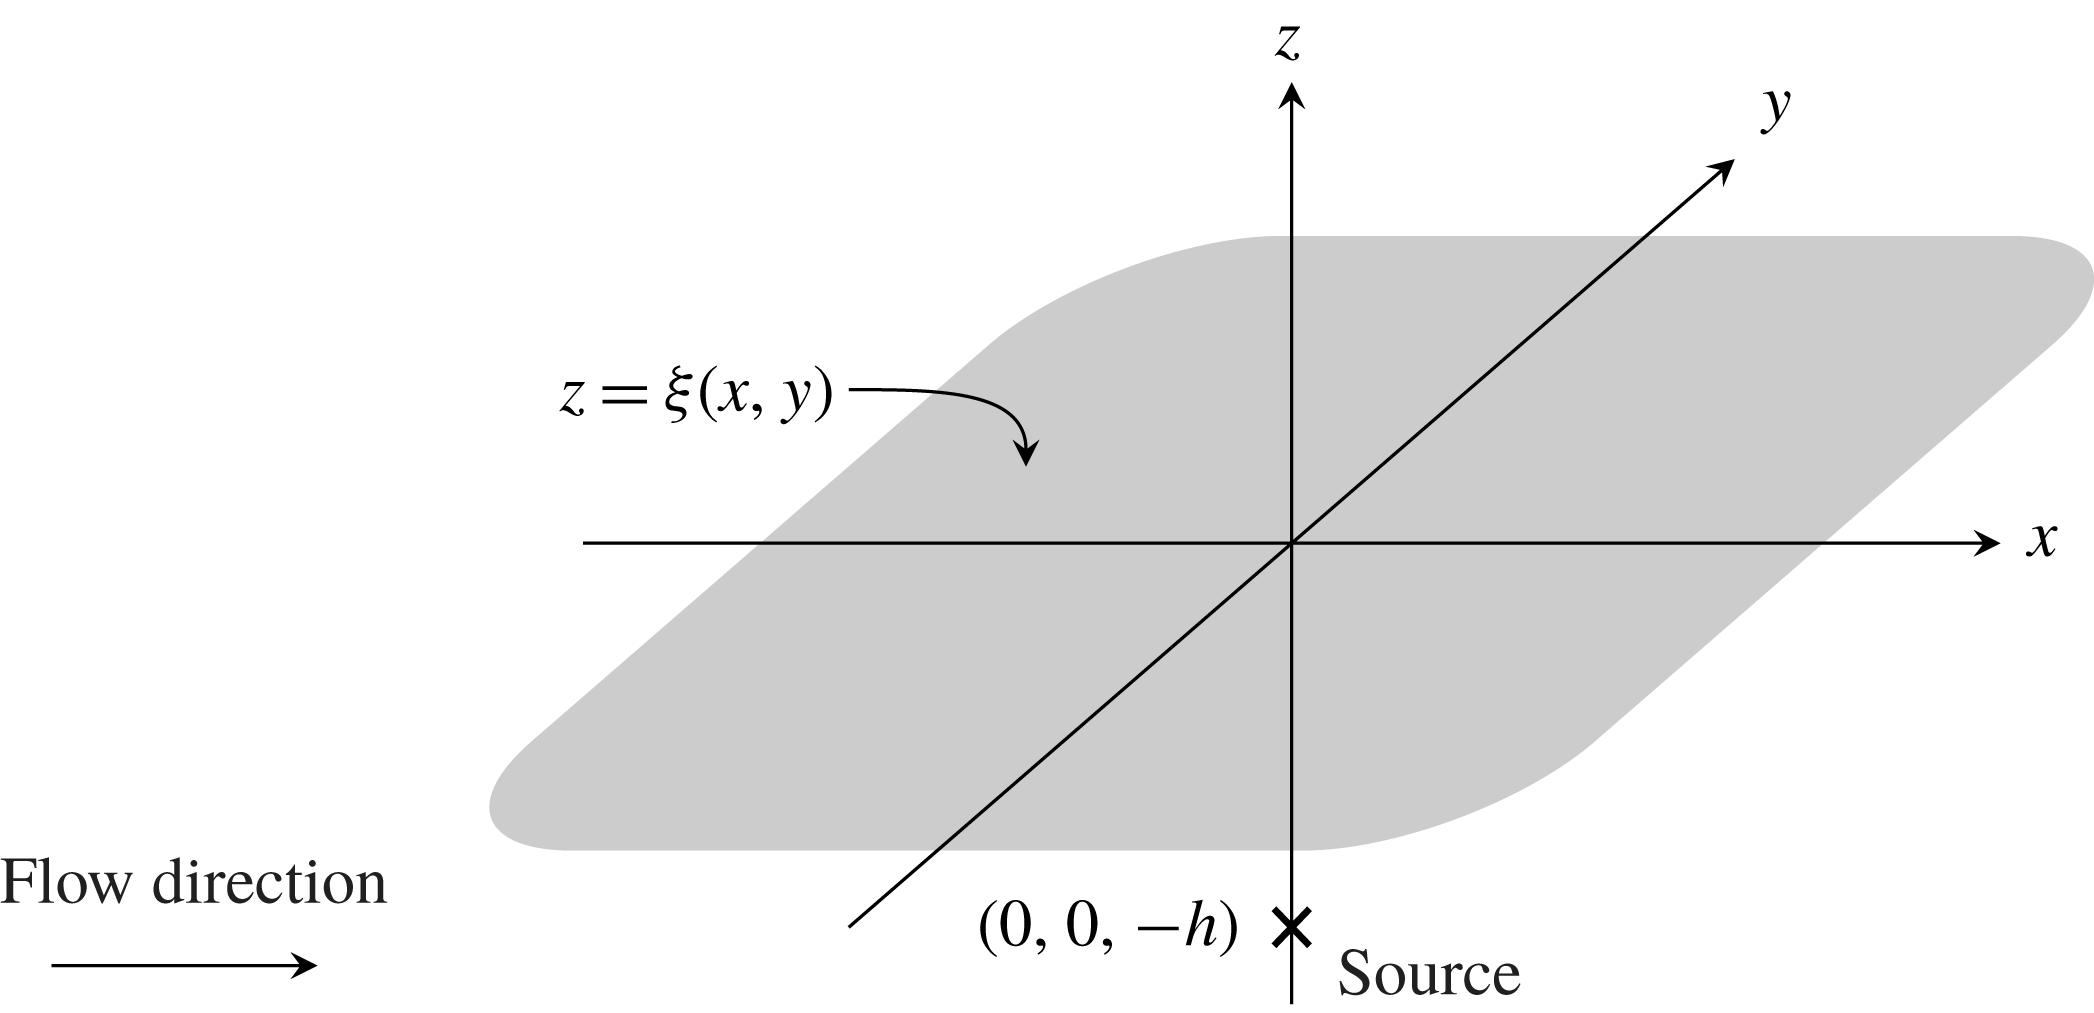
, shown schematically in figure 1.
Prescribed fluid configuration for three-dimensional flow over a source. The shaded region represents the position of the free surface
 $\unicode[STIX]{x1D709}(x,y)$
, and the cross represents the position of the source. The flow region lies below the free surface, and the mean flow is moving from left to right, with flow velocity
 $U$
in the unscaled problem. The waves form upstream from the obstacle, which is consistent with the theory of Whitham (Reference Whitham1974) for two-dimensional capillary waves. The fluid surface is not flat, but is depicted here as such for illustrative purposes only.

Denoting the (non-dimensional) position of the free surface by
 $z=\unicode[STIX]{x1D709}(x,y)$
, the (non-dimensional) velocity potential satisfies
 $$\begin{eqnarray}\unicode[STIX]{x1D6FB}^{2}\unicode[STIX]{x1D719}=0,\quad -\infty <z<\unicode[STIX]{x1D709}(x,y),\end{eqnarray}$$
with kinematic and dynamic boundary conditions
 $$\begin{eqnarray}\displaystyle & \unicode[STIX]{x1D709}_{x}\unicode[STIX]{x1D719}_{x}+\unicode[STIX]{x1D709}_{y}\unicode[STIX]{x1D719}_{y}=\unicode[STIX]{x1D719}_{z},\quad z=\unicode[STIX]{x1D709}(x,y), & \displaystyle\end{eqnarray}$$
 $$\begin{eqnarray}\displaystyle & {\textstyle \frac{1}{2}}(|\unicode[STIX]{x1D735}\unicode[STIX]{x1D719}|^{2}-1)+\unicode[STIX]{x1D716}\unicode[STIX]{x1D705}=0,\quad z=\unicode[STIX]{x1D709}(x,y), & \displaystyle\end{eqnarray}$$
where
 $\unicode[STIX]{x1D705}$
represents the curvature of the free surface, positive if the centre of curvature lies in the fluid region, and the inverse Weber number
 $\unicode[STIX]{x1D716}=\unicode[STIX]{x1D70E}/\unicode[STIX]{x1D70C}LU^{2}$
, where
 $\unicode[STIX]{x1D70E}$
represents the surface tension parameter and
 $\unicode[STIX]{x1D70C}$
represents the fluid density. The curvature is given by
 $$\begin{eqnarray}\unicode[STIX]{x1D705}=-\unicode[STIX]{x1D735}_{s}\boldsymbol{\cdot }\left[\frac{\unicode[STIX]{x1D735}_{s}\unicode[STIX]{x1D709}}{\sqrt{1+|\unicode[STIX]{x1D735}_{s}\unicode[STIX]{x1D709}|^{2}}}\right],\end{eqnarray}$$
where
 $\unicode[STIX]{x1D735}_{s}$
represents the surface gradient of the flow. We are concerned with the free-surface behaviour in the limit
 $0<\unicode[STIX]{x1D716}\ll 1$
, in which the surface-tension effects become small. Since the flow is uniform in the far field,
 $\unicode[STIX]{x1D719}_{x}\rightarrow 1$
there, while at the source
 $$\begin{eqnarray}\unicode[STIX]{x1D719}\sim \frac{\unicode[STIX]{x1D6FF}}{4\unicode[STIX]{x03C0}\sqrt{x^{2}+y^{2}+(z+h)^{2}}}\quad \text{as}~(x,y,z)\rightarrow (0,0,-h).\end{eqnarray}$$
We will be concerned with the limit
 $0<\unicode[STIX]{x1D6FF}\ll \unicode[STIX]{x1D716}$
, so that the disturbance to the free stream is weak and the equations may be linearised in
 $\unicode[STIX]{x1D6FF}$
. The asymptotic expressions obtained in this study therefore a useful approximation to the full nonlinear problem in regimes which satisfy the condition that
 $0<\unicode[STIX]{x1D6FF}\ll \unicode[STIX]{x1D716}\ll 1$
.
Finally, we incorporate a radiation condition which states that the steady surface capillary waves must propagate upstream.
2.1.2 Linearisation
We linearise about uniform flow by setting
 $$\begin{eqnarray}\unicode[STIX]{x1D719}=x+\unicode[STIX]{x1D6FF}\tilde{\unicode[STIX]{x1D719}},\quad \unicode[STIX]{x1D709}=\unicode[STIX]{x1D6FF}\tilde{\unicode[STIX]{x1D709}},\end{eqnarray}$$
to give, at leading order in
 $\unicode[STIX]{x1D6FF}$
 $$\begin{eqnarray}\displaystyle & \unicode[STIX]{x1D6FB}^{2}\tilde{\unicode[STIX]{x1D719}}=0,\quad -\infty <z<0, & \displaystyle\end{eqnarray}$$
 $$\begin{eqnarray}\displaystyle & \tilde{\unicode[STIX]{x1D719}}_{z}-\tilde{\unicode[STIX]{x1D709}}_{x}=0,\quad z=0, & \displaystyle\end{eqnarray}$$
 $$\begin{eqnarray}\displaystyle & \tilde{\unicode[STIX]{x1D719}}_{x}-\unicode[STIX]{x1D716}(\tilde{\unicode[STIX]{x1D709}}_{xx}+\tilde{\unicode[STIX]{x1D709}}_{yy})=0,\quad z=0, & \displaystyle\end{eqnarray}$$
where the boundary conditions are now applied on the fixed surface
 $z=0$
. The far-field conditions imply that
 $\tilde{\unicode[STIX]{x1D719}}\rightarrow 0$
as
 $x^{2}+y^{2}+z^{2}\rightarrow \infty$
, while near the source
 $$\begin{eqnarray}\tilde{\unicode[STIX]{x1D719}}\sim \frac{1}{4\unicode[STIX]{x03C0}\sqrt{x^{2}+y^{2}+(z+h)^{2}}}\quad \text{as}~(x,y,z)\rightarrow (0,0,-h).\end{eqnarray}$$
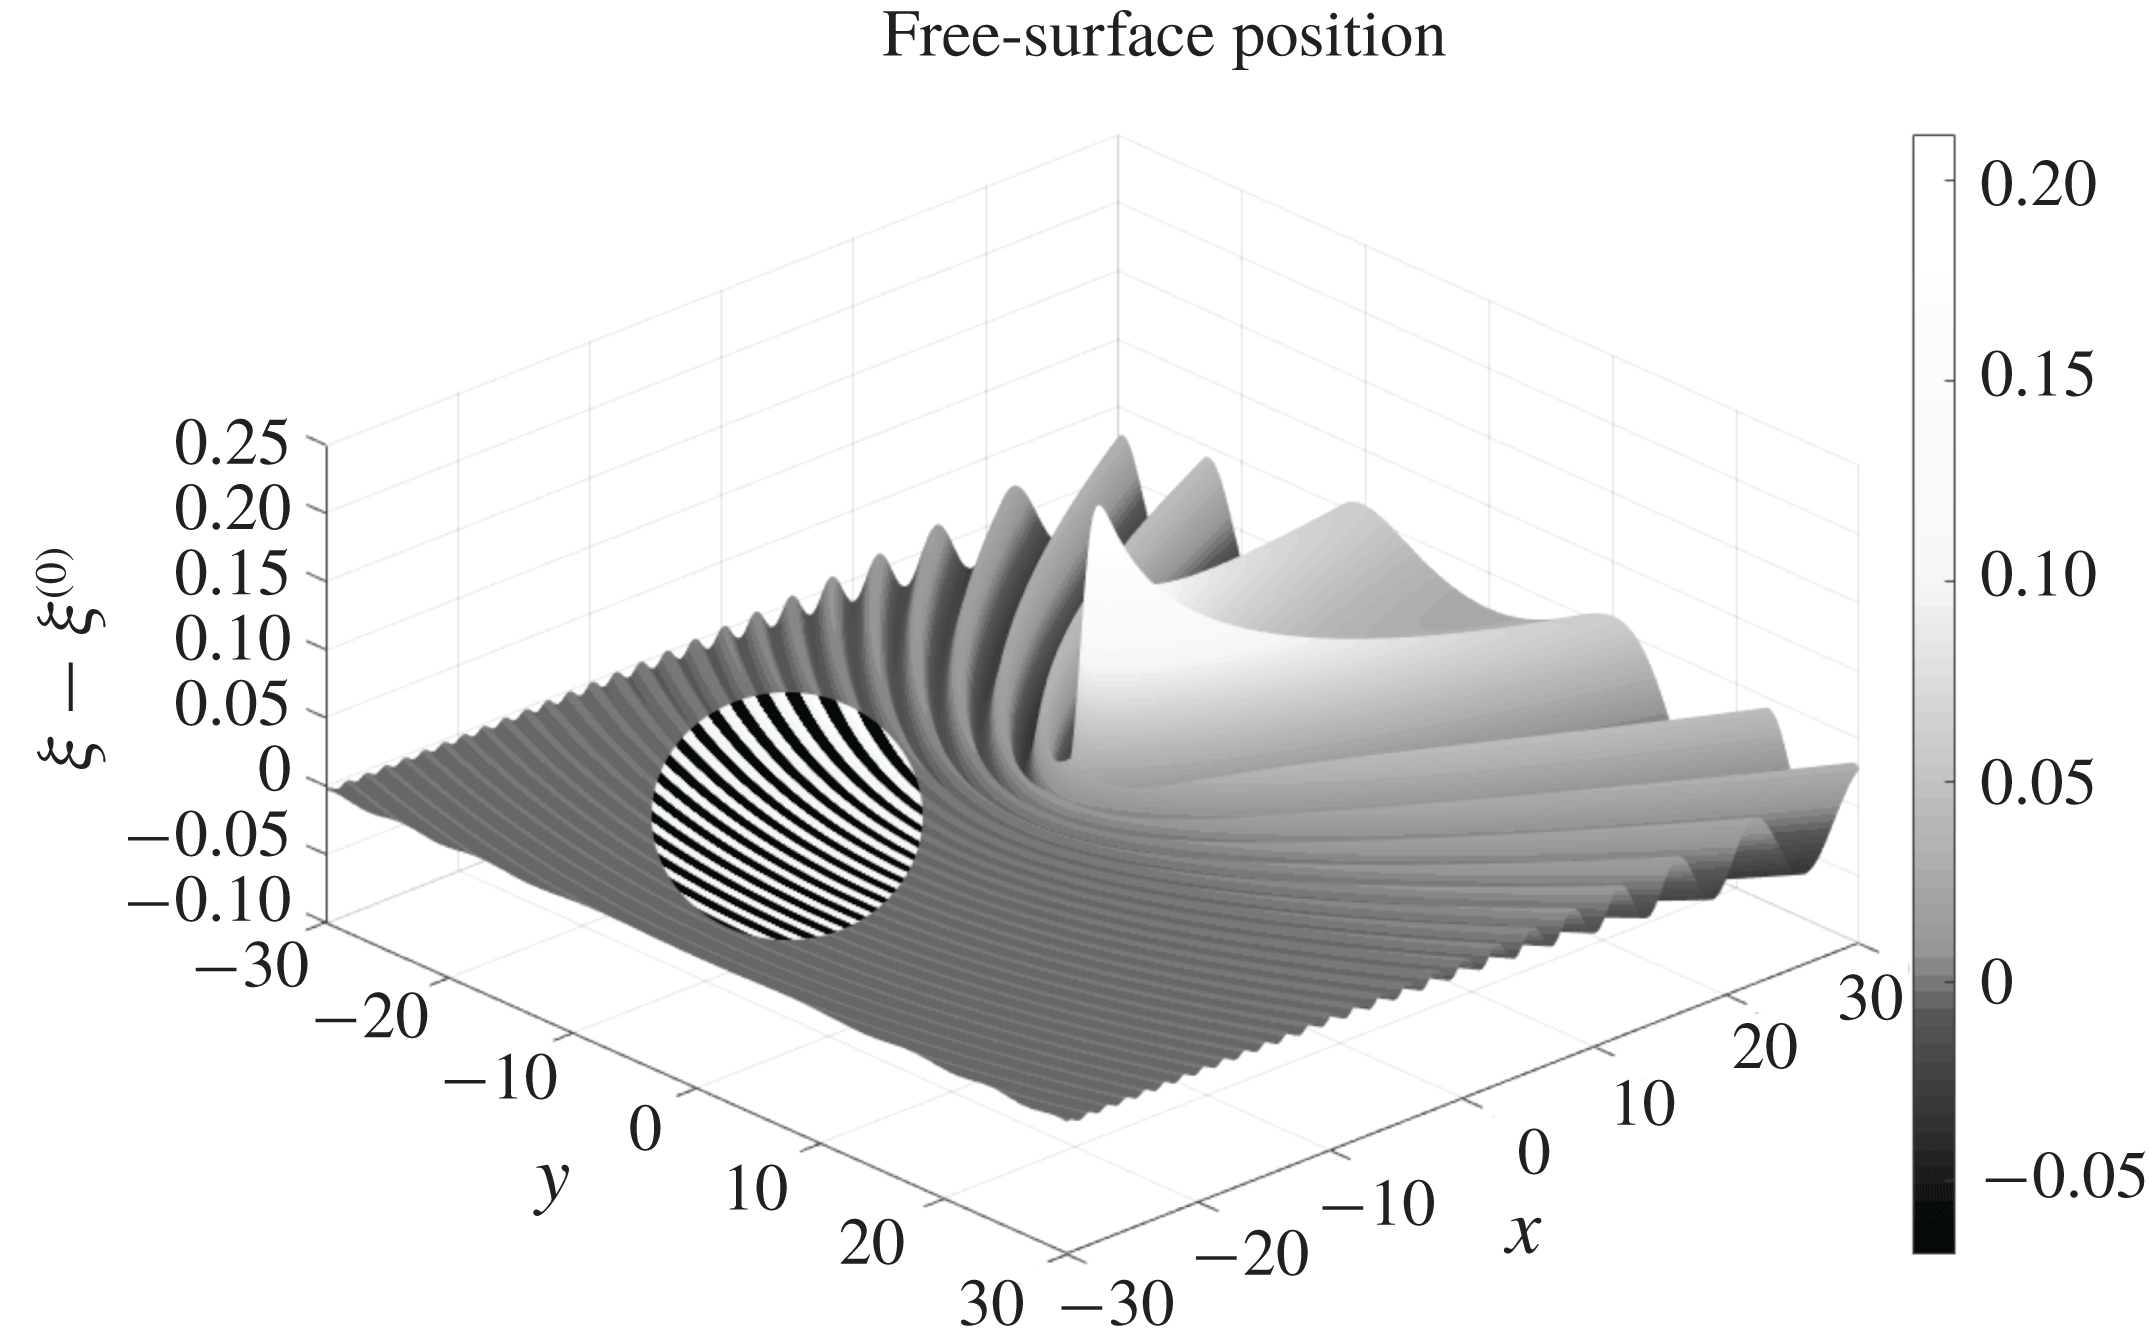
With the addition of a radiation condition, specifying that capillary waves must propagate upstream from the source, the system described in (2.7)–(2.10) completely specifies the linearised version of the three-dimensional problem shown in figure 1. We can solve the linearised problem numerically using a modified version of the algorithm from Lustri & Chapman (Reference Lustri and Chapman2013, Reference Lustri and Chapman2014) to obtain free-surface profiles such as that illustrated in figure 2.
Surface plot of the modified free-surface position
 $\unicode[STIX]{x1D709}-\unicode[STIX]{x1D709}^{(0)}$
, where
 $\unicode[STIX]{x1D709}^{(0)}$
is the leading-order free-surface profile given in (2.17), with
 $h=1$
and
 $\unicode[STIX]{x1D716}=0.2$
, with flow in the positive
 $x$
-direction. The figure depicts capillary waves extending behind the disturbance in the direction of the flow origin, in addition to lower-order algebraic effects ahead of the disturbance. The contrast is increased in a circular region in order to make the position of the capillary waves visually distinguishable.

We analytically continue the free surface such that
 $x,y\in \mathbb{C}$
, with the free surface still satisfying
 $z=0$
. This does not change the form of (2.7)–(2.10), but it does mean that the two-dimensional physical free surface is now a subset of a four-dimensional complexified free surface.
2.2 Series expression
Following the approach of Lustri & Chapman (Reference Lustri and Chapman2013), we first expand the fluid potential and free-surface position as a power series in
 $\unicode[STIX]{x1D716}$
,
 $$\begin{eqnarray}\tilde{\unicode[STIX]{x1D719}}\sim \mathop{\sum }_{n=0}^{\infty }\unicode[STIX]{x1D716}^{n}\unicode[STIX]{x1D719}^{(n)},\quad \tilde{\unicode[STIX]{x1D709}}\sim \mathop{\sum }_{n=0}^{\infty }\unicode[STIX]{x1D716}^{n}\unicode[STIX]{x1D709}^{(n)},\end{eqnarray}$$
to give for
 $n\geqslant 0$
,
 $$\begin{eqnarray}\displaystyle & \unicode[STIX]{x1D6FB}^{2}\unicode[STIX]{x1D719}^{(n)}=0,\quad -\infty <z<0, & \displaystyle\end{eqnarray}$$
 $$\begin{eqnarray}\displaystyle & \unicode[STIX]{x1D719}_{z}^{(n)}-\unicode[STIX]{x1D709}_{x}^{(n)}=0,\quad z=0, & \displaystyle\end{eqnarray}$$
 $$\begin{eqnarray}\displaystyle & \unicode[STIX]{x1D719}_{x}^{(n)}-\unicode[STIX]{x1D709}_{xx}^{(n-1)}-\unicode[STIX]{x1D709}_{yy}^{(n-1)}=0,\quad z=0, & \displaystyle\end{eqnarray}$$
with the convention that
 $\unicode[STIX]{x1D719}^{(-1)}=0$
. The far-field behaviour tends to zero at all orders of
 $n$
, and the singularity condition (2.10) is applied to the leading-order expression, giving
 $$\begin{eqnarray}\unicode[STIX]{x1D719}^{(0)}\sim \frac{1}{4\unicode[STIX]{x03C0}\sqrt{x^{2}+y^{2}+(z+h)^{2}}}\quad \text{as}~(x,y,z)\rightarrow (0,0,-h).\end{eqnarray}$$
The leading-order solution is given by
 $$\begin{eqnarray}\displaystyle & \displaystyle \unicode[STIX]{x1D719}^{(0)}=\frac{1}{4\unicode[STIX]{x03C0}\sqrt{x^{2}+y^{2}+(z+h)^{2}}}-\frac{1}{4\unicode[STIX]{x03C0}\sqrt{x^{2}+y^{2}+(z-h)^{2}}}, & \displaystyle\end{eqnarray}$$
 $$\begin{eqnarray}\displaystyle & \displaystyle \unicode[STIX]{x1D709}^{(0)}=-\frac{xh}{2\unicode[STIX]{x03C0}(y^{2}+h^{2})\sqrt{x^{2}+y^{2}+h^{2}}}-\frac{1}{2\unicode[STIX]{x03C0}(y^{2}+h^{2})}, & \displaystyle\end{eqnarray}$$
where the leading-order free-surface behaviour is set to be undisturbed far ahead of the source.
Through repeated iteration of (2.13)–(2.14), we find that the position of singularities in subsequent terms of the series (2.11) remains constant, while the power of the singularity increases at each order, as we expect for such singular perturbation problems (see Chapman & Vanden-Broeck Reference Chapman and Vanden-Broeck2006).
2.3 Late-order terms
In order to optimally truncate the asymptotic series prescribed in (2.11), we must determine the form of the late-order terms. To accomplish this, we make a factorial-over-power ansatz (see Chapman et al. Reference Chapman, King, Ockendon and Adams1998), having the form
 $$\begin{eqnarray}\unicode[STIX]{x1D719}^{(n)}\sim \frac{\unicode[STIX]{x1D6F7}(x,y,z)\unicode[STIX]{x1D6E4}(n+\unicode[STIX]{x1D6FE})}{\unicode[STIX]{x1D712}(x,y,z)^{n+\unicode[STIX]{x1D6FE}}},\quad \unicode[STIX]{x1D709}^{(n)}\sim \frac{\unicode[STIX]{x1D6EF}(x,y)\unicode[STIX]{x1D6E4}(n+\unicode[STIX]{x1D6FE})}{\unicode[STIX]{x1D712}(x,y,0)^{n+\unicode[STIX]{x1D6FE}}},\quad \text{as}~n\rightarrow \infty ,\end{eqnarray}$$
where
 $\unicode[STIX]{x1D6FE}$
is a constant. In order that (2.18) is the power series developed in § 2.2, we require that the singulant,
 $\unicode[STIX]{x1D712}$
, satisfies
 $$\begin{eqnarray}\unicode[STIX]{x1D712}=0\quad \text{on}~x^{2}+y^{2}+(z\pm h)^{2}=0,\end{eqnarray}$$
where the sign chosen depends upon which of the two singularities is being considered. For complex values of
 $x$
,
 $y$
and
 $z$
, this defines a four-dimensional hypersurface. Irrespective of which singularity is under consideration, this hypersurface intersects the four-dimensional complexified free surface on the two-dimensional hypersurface satisfying
 $x^{2}+y^{2}+h^{2}=0$
.
It is important to note that the expression for
 $\unicode[STIX]{x1D709}^{(n)}$
is restricted to
 $z=0$
, as it describes the free-surface position. This does not pose a problem for the subsequent analysis, but does ensure that care must be taken at each stage to determine whether we are considering the full flow region, or just the free surface.
2.3.1 Calculating the singulant
Applying the ansatz expressions in (2.18) to the governing equation (2.12) and taking the first two orders as
 $n\rightarrow \infty$
gives
 $$\begin{eqnarray}\displaystyle & \unicode[STIX]{x1D712}_{x}^{2}+\unicode[STIX]{x1D712}_{y}^{2}+\unicode[STIX]{x1D712}_{z}^{2}=0, & \displaystyle\end{eqnarray}$$
 $$\begin{eqnarray}\displaystyle & 2\unicode[STIX]{x1D6F7}_{x}\unicode[STIX]{x1D712}_{x}+2\unicode[STIX]{x1D6F7}_{y}\unicode[STIX]{x1D712}_{y}+2\unicode[STIX]{x1D6F7}_{z}\unicode[STIX]{x1D712}_{z}=-(\unicode[STIX]{x1D712}_{xx}+\unicode[STIX]{x1D712}_{yy}+\unicode[STIX]{x1D712}_{zz}), & \displaystyle\end{eqnarray}$$
while the boundary conditions on
 $z=0$
become, to leading order,
 $$\begin{eqnarray}\displaystyle & -\unicode[STIX]{x1D712}_{z}\unicode[STIX]{x1D6F7}+\unicode[STIX]{x1D712}_{x}\unicode[STIX]{x1D6EF}=0, & \displaystyle\end{eqnarray}$$
 $$\begin{eqnarray}\displaystyle & \unicode[STIX]{x1D712}_{x}\unicode[STIX]{x1D6F7}+(\unicode[STIX]{x1D712}_{x}^{2}+\unicode[STIX]{x1D712}_{y}^{2})\unicode[STIX]{x1D6EF}=0. & \displaystyle\end{eqnarray}$$
The system in (2.22)–(2.23) has non-zero solutions when
 $$\begin{eqnarray}\unicode[STIX]{x1D712}_{x}^{2}=-\unicode[STIX]{x1D712}_{z}(\unicode[STIX]{x1D712}_{x}^{2}+\unicode[STIX]{x1D712}_{y}^{2}),\end{eqnarray}$$
which gives the result
 $$\begin{eqnarray}\unicode[STIX]{x1D712}_{z}=-\frac{\unicode[STIX]{x1D712}_{x}^{2}}{\unicode[STIX]{x1D712}_{x}^{2}+\unicode[STIX]{x1D712}_{y}^{2}}.\end{eqnarray}$$
Using (2.25), we find a relationship between
 $\unicode[STIX]{x1D6F7}$
and
 $\unicode[STIX]{x1D6EF}$
by rearranging (2.22) to obtain
 $$\begin{eqnarray}\unicode[STIX]{x1D6EF}=-\frac{\unicode[STIX]{x1D712}_{x}}{\unicode[STIX]{x1D712}_{x}^{2}+\unicode[STIX]{x1D712}_{y}^{2}}\unicode[STIX]{x1D6F7}.\end{eqnarray}$$
Applying (2.25) to (2.20) evaluated on
 $z=0$
gives a singulant equation for
 $\unicode[STIX]{x1D712}$
on the free surface,
 $$\begin{eqnarray}\unicode[STIX]{x1D712}_{x}^{4}+(\unicode[STIX]{x1D712}_{x}^{2}+\unicode[STIX]{x1D712}_{y}^{2})^{3}=0.\end{eqnarray}$$
Here though, because the singularity lies below the fluid surface, we must solve (2.27) for complex
 $x$
and
 $y$
with the boundary condition
 $$\begin{eqnarray}\unicode[STIX]{x1D712}=0\quad \text{on}~x^{2}+y^{2}+h^{2}=0.\end{eqnarray}$$
Parametrising (2.28) as
 $$\begin{eqnarray}x_{0}=s,\quad y_{0}=\pm \text{i}\sqrt{s^{2}+h^{2}},\quad \unicode[STIX]{x1D712}_{0}=0,\end{eqnarray}$$
and solving (2.27) using Charpit’s method (see Ockendon et al. Reference Ockendon, Howison, Lacey and Movchan1999) gives
 $$\begin{eqnarray}\unicode[STIX]{x1D712}=\pm \frac{9x(x^{2}+y^{2})s^{3}+h(2h^{2}+9x^{2}-6y^{2})s^{2}+6x(y^{2}-h^{2})s-4h(h^{2}+y^{2})}{3(2h^{2}+3x^{2})},\end{eqnarray}$$
where
 $s$
is a solution to
 $$\begin{eqnarray}9(x^{2}+y^{2})s^{4}+12xhs^{3}+(4h^{2}+9x^{2}+12y^{2})s^{2}+12xhs+4(h^{2}+y^{2})=0.\end{eqnarray}$$
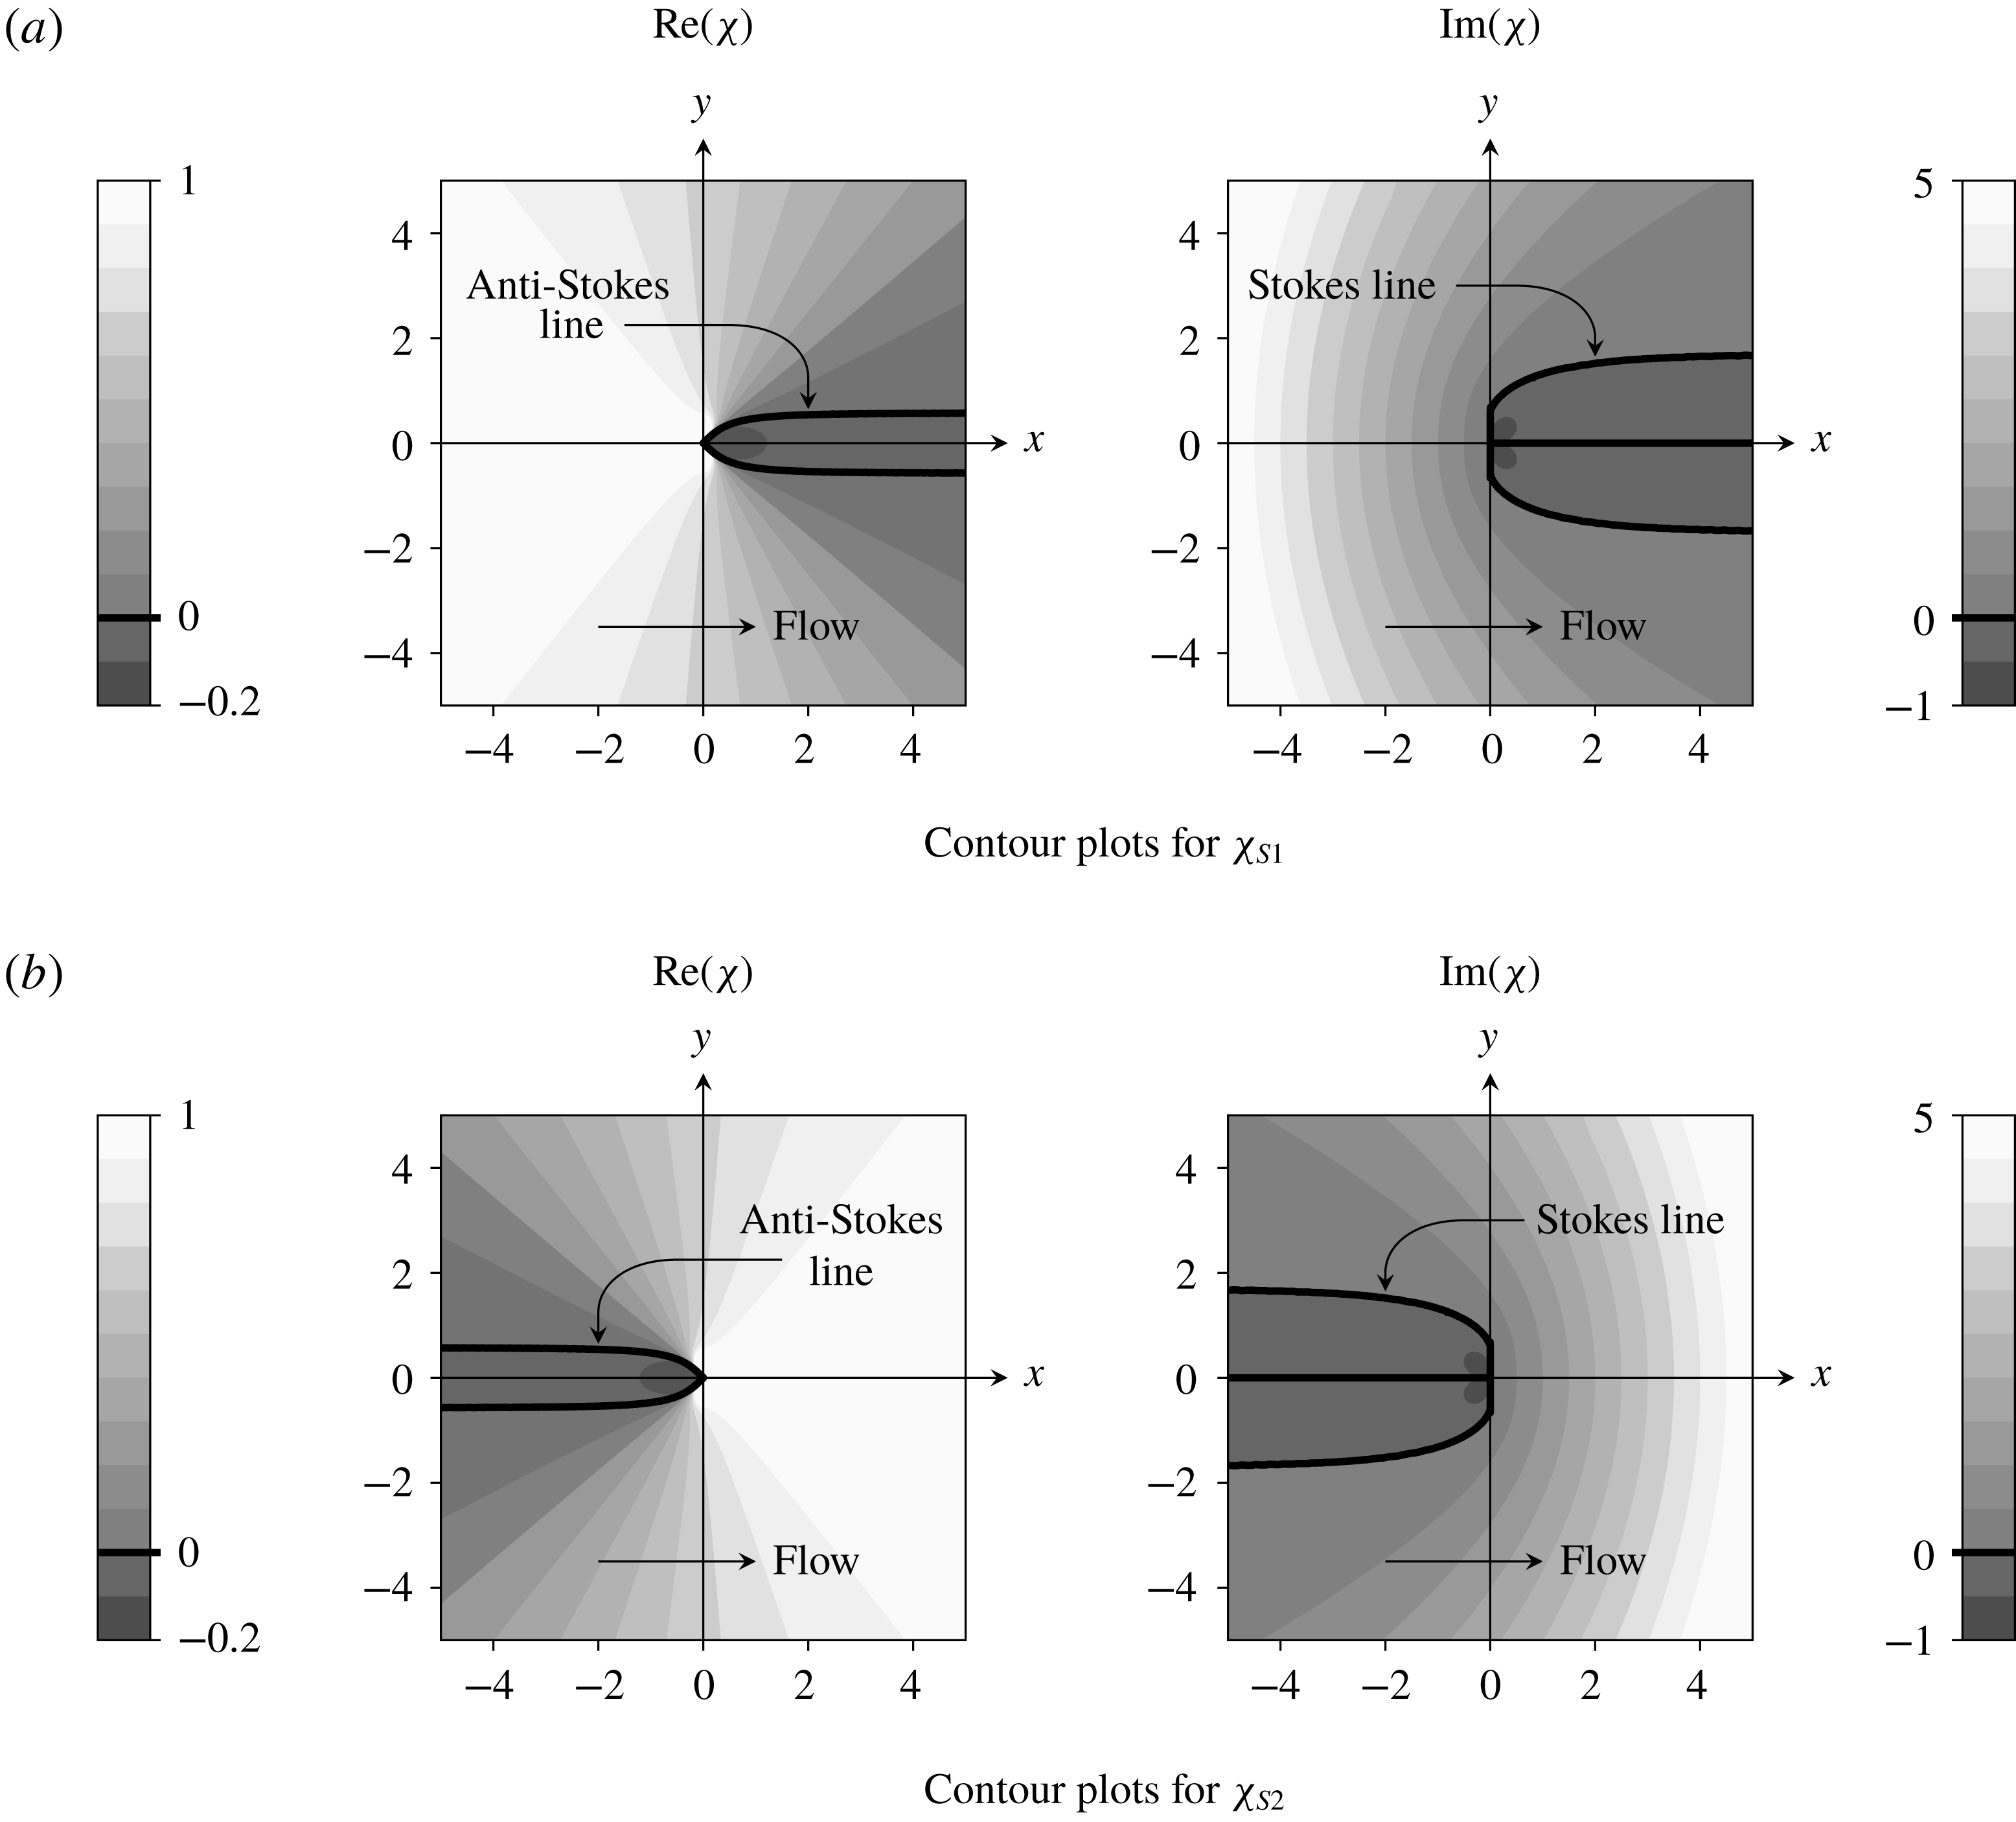
Singulants obtained by solving (2.27) with boundary data (2.28). The remaining singulant expressions are given by
 $-\unicode[STIX]{x1D712}_{S1,2}$
, as well as
 $\pm \overline{\unicode[STIX]{x1D712}}_{S1,2}$
, where the bar denotes complex conjugation. The flow direction is indicated on each plot. The contributions associated with
 $\pm \unicode[STIX]{x1D712}_{S2}$
,
 $\pm \overline{\unicode[STIX]{x1D712}}_{S2}$
, as well as
 $-\unicode[STIX]{x1D712}_{S1}$
and
 $-\overline{\unicode[STIX]{x1D712}}_{S1}$
, will either produce waves directly downstream from the source, or contain no Stokes switching behaviour at all; hence, these singulants cannot generate exponentially small wave behaviour. Conversely, surface behaviour associated with
 $\unicode[STIX]{x1D712}_{S1}$
and
 $\overline{\unicode[STIX]{x1D712}}_{S1}$
will produce exponentially small waves in the upstream far field which are switched on across the Stokes line satisfying
 $\text{Im}(\unicode[STIX]{x1D712})=0$
. Note that there is no switching across the curve
 $y=0$
,
 $x>0$
even though
 $\text{Im}(\unicode[STIX]{x1D712})=0$
there because
 $\text{Re}(\unicode[STIX]{x1D712})<0$
in this region.

Equations (2.30)–(2.31) give eight possible expressions for the singulant (corresponding to the choice of sign in (2.30) and the four solutions to (2.31)). These therefore give eight possible sets of late-order behaviour in the problem.
Contour plots illustrating the behaviour of the singulant terms are presented in figure 3 for
 $h=1$
. To indicate that we are considering the steady behaviour, we have labelled the singulants as
 $\unicode[STIX]{x1D712}_{S1}$
and
 $\unicode[STIX]{x1D712}_{S2}$
, where the number indicates two different solutions from which all eight singulant expressions may be easily obtained. Specifically, the eight expressions are given by
 $\pm \unicode[STIX]{x1D712}_{S1,2}$
and
 $\pm \overline{\unicode[STIX]{x1D712}}_{S1,2}$
, where the bar denotes complex conjugation. We also note that
 $\unicode[STIX]{x1D712}_{S2}$
may be obtained by reflecting
 $\unicode[STIX]{x1D712}_{S1}$
in the
 $y$
-axis.
We recall from the methodology description that Stokes switching of exponentially small contributions to the solution occurs across curves known as Stokes lines, which must satisfy the condition on the singulant given in (1.8). As we have obtained explicit expressions for the singulant, we are able to determine the location of the Stokes lines in the solution, illustrated in figure 3 for
 $\unicode[STIX]{x1D712}_{S1}$
and
 $\unicode[STIX]{x1D712}_{S2}$
. The Stokes lines are illustrated by bold curves in the plots of
 $\text{Im}(\unicode[STIX]{x1D712})$
in figure 3. While we used the condition (1.8) to identify the Stokes line locations, it appears also as a consequence of the matched asymptotic analysis, which may be seen in appendix B.
We may also determine the location of anti-Stokes lines using (1.9), which are depicted as bold curves on the plots of
 $\text{Re}(\unicode[STIX]{x1D712})$
in this figure. These curves are important, as we know that the corresponding exponential contribution must be inactive in any region containing anti-Stokes lines, as otherwise it would become exponentially large (and therefore dominant) as the anti-Stokes lines are crossed.
From figure 3, we therefore see that any free-surface behaviour associated with
 $\unicode[STIX]{x1D712}_{S2}$
or
 $\overline{\unicode[STIX]{x1D712}}_{S2}$
must be switched on in the downstream region, and hence produce capillary waves in the downstream far field, which violates the radiation condition. Furthermore, both
 $-\unicode[STIX]{x1D712}_{S2}$
or
 $-\overline{\unicode[STIX]{x1D712}}_{S2}$
have
 $\text{Re}(\unicode[STIX]{x1D712})<0$
across the Stokes line (satisfying
 $\text{Im}(\unicode[STIX]{x1D712})=0$
), and hence no Stokes switching can occur. This is also true of
 $-\unicode[STIX]{x1D712}_{S1}$
and
 $-\overline{\unicode[STIX]{x1D712}}_{S1}$
. Consequently, none of these singulant contributions will produce exponentially small free-surface capillary waves.
However,
 $\unicode[STIX]{x1D712}_{S1}$
and
 $\overline{\unicode[STIX]{x1D712}}_{S1}$
have
 $\text{Re}(\unicode[STIX]{x1D712})>0$
across the Stokes line, as well as in the entire region in which the associated exponentially small wave behaviour is switched on. Additionally, the wave behaviour is upstream from the obstacle. From this, we conclude that the capillary wave behaviour on the free surface is caused by the late-order terms associated with
 $\unicode[STIX]{x1D712}_{S1}$
and
 $\overline{\unicode[STIX]{x1D712}}_{S1}$
. The full Stokes structure of the solution is therefore depicted in figure 3(a).
Comparing the Stokes structure in figure 3(a) with the numerical free-surface plot in figure 2, we see that the region upstream of the Stokes line in which the exponentially small ripples are present in the solution corresponds to the numerically calculated ripples in the surface plot. There are other features in the numerical plot which do not correspond to exponentially small ripples, and are present on both sides of the Stokes line; these features are not waves, but rather non-wave-like disturbances to the undisturbed flow found at algebraic orders of
 $\unicode[STIX]{x1D716}$
in the small-surface-tension limit.
As
 $\unicode[STIX]{x1D712}_{S1}$
and
 $\overline{\unicode[STIX]{x1D712}}_{S1}$
are the only contributions to the steady capillary wave behaviour, we will subsequently denote these as
 $\unicode[STIX]{x1D712}_{S}$
and
 $\overline{\unicode[STIX]{x1D712}}_{S}$
respectively.
2.3.2 Calculating the prefactor
In order to obtain a complete expression for the late-order terms (2.18), we require an expression for the prefactors,
 $\unicode[STIX]{x1D6F7}$
and
 $\unicode[STIX]{x1D6EF}$
. To find the prefactor equation, we consider the next order in (2.13)–(2.14) as
 $n\rightarrow \infty$
. Expanding the prefactors in the form of a power series in
 $n$
as
 $n\rightarrow \infty$
,
 $$\begin{eqnarray}\unicode[STIX]{x1D6F7}=\unicode[STIX]{x1D6F7}_{0}+\frac{1}{n}\unicode[STIX]{x1D6F7}_{1}+\cdots ,\quad \unicode[STIX]{x1D6EF}=\unicode[STIX]{x1D6EF}_{0}+\frac{1}{n}\unicode[STIX]{x1D6EF}_{1}+\cdots\end{eqnarray}$$
and applying the late-order ansatz to (2.20)–(2.23) now gives
 $$\begin{eqnarray}\displaystyle & -\unicode[STIX]{x1D712}_{z}\unicode[STIX]{x1D6F7}_{1}+\unicode[STIX]{x1D712}_{x}\unicode[STIX]{x1D6EF}_{1}=-\unicode[STIX]{x1D6F7}_{0,z}+\unicode[STIX]{x1D6EF}_{0,x}, & \displaystyle\end{eqnarray}$$
 $$\begin{eqnarray}\displaystyle & \unicode[STIX]{x1D712}_{x}\unicode[STIX]{x1D6F7}_{1}+(\unicode[STIX]{x1D712}_{x}^{2}+\unicode[STIX]{x1D712}_{y}^{2})\unicode[STIX]{x1D6EF}_{1}=\unicode[STIX]{x1D6F7}_{0,x}+2\unicode[STIX]{x1D712}_{x}\unicode[STIX]{x1D6EF}_{0,x}+2\unicode[STIX]{x1D712}_{y}\unicode[STIX]{x1D6EF}_{0,y}+(\unicode[STIX]{x1D712}_{xx}+\unicode[STIX]{x1D712}_{yy})\unicode[STIX]{x1D6EF}_{0}. & \displaystyle\end{eqnarray}$$
This system only has non-trivial solutions for
 $\unicode[STIX]{x1D6F7}_{1}$
and
 $\unicode[STIX]{x1D6EF}_{1}$
when
 $$\begin{eqnarray}\unicode[STIX]{x1D712}_{x}(\unicode[STIX]{x1D6F7}_{0,z}-\unicode[STIX]{x1D6EF}_{0,x})=\unicode[STIX]{x1D712}_{z}(\unicode[STIX]{x1D6F7}_{0,x}+2\unicode[STIX]{x1D712}_{x}\unicode[STIX]{x1D6EF}_{0,x}+2\unicode[STIX]{x1D712}_{y}\unicode[STIX]{x1D6EF}_{0,y}+(\unicode[STIX]{x1D712}_{xx}+\unicode[STIX]{x1D712}_{yy})\unicode[STIX]{x1D6EF}_{0}).\end{eqnarray}$$
Since we are presently interested in the leading-order behaviour of the prefactor, for ease of notation we now omit the subscripts and denote
 $\unicode[STIX]{x1D6EF}_{0}$
by
 $\unicode[STIX]{x1D6EF}$
and
 $\unicode[STIX]{x1D6F7}_{0}$
by
 $\unicode[STIX]{x1D6F7}$
. This gives
 $$\begin{eqnarray}\unicode[STIX]{x1D6F7}_{z}=\unicode[STIX]{x1D6EF}_{x}+\frac{\unicode[STIX]{x1D712}_{z}}{\unicode[STIX]{x1D712}_{x}}(\unicode[STIX]{x1D6F7}_{x}+2\unicode[STIX]{x1D712}_{x}\unicode[STIX]{x1D6EF}_{x}+2\unicode[STIX]{x1D712}_{y}\unicode[STIX]{x1D6EF}_{y}+(\unicode[STIX]{x1D712}_{xx}+\unicode[STIX]{x1D712}_{yy})\unicode[STIX]{x1D6EF}).\end{eqnarray}$$
Now, to solve the prefactor equation (2.21), we use this result, as well as (2.25), to express the original equation entirely in terms of
 $x$
and
 $y$
derivatives. The resultant expression has the same ray equations as the singulant. Hence, we can express the prefactor equation using the characteristic variable of the singulant,
 $s$
, which is given in terms of physical variables in (2.31). To fully determine the prefactor, we must subsequently match the solution of the prefactor equation to the behaviour of the flow in the neighbourhood of the singularity, as described in Chapman et al. (Reference Chapman, King, Ockendon and Adams1998). This analysis is performed in appendix A, and gives
 $$\begin{eqnarray}\displaystyle \unicode[STIX]{x1D6F7} & = & \displaystyle \frac{s\sqrt{2}}{4\unicode[STIX]{x03C0}^{3/2}h^{3/2}}\nonumber\\ \displaystyle & & \displaystyle \times \left[1-\frac{3h^{4}(4s^{4}+6s^{2}h^{2}-3h^{4})(s-x)}{s^{3}(3s^{2}+2h^{2})(2s^{4}+3h^{4})}\right]^{s^{2}(24s^{8}+34s^{6}h^{2}+36s^{4}h^{4}+35h^{6}s^{2}+14h^{8})/2h^{6}(3h^{4}-6s^{2}h^{2}-4s^{4})}\!,\nonumber\\ \displaystyle & & \displaystyle\end{eqnarray}$$
where
 $s$
is the solution of (2.31) corresponding to the singulant illustrated in figure 3.
Finally, to find
 $\unicode[STIX]{x1D6FE}$
, we ensure that the strength of the singularity in the late-order behaviour
 $\unicode[STIX]{x1D719}^{(n)}$
, given in (2.18) is consistent with the leading-order behaviour
 $\unicode[STIX]{x1D719}^{(0)}$
, which has strength
 $1/2$
. It is clear from the recurrence relation (2.14) that the strength of the singularity will increase by one between
 $\unicode[STIX]{x1D719}^{(n-1)}$
and
 $\unicode[STIX]{x1D719}^{(n)}$
. This implies that near the singularity at
 $x^{2}+y^{2}+h^{2}=0$
,
 $$\begin{eqnarray}\frac{\unicode[STIX]{x1D6F7}\unicode[STIX]{x1D6E4}(\unicode[STIX]{x1D6FE})}{\unicode[STIX]{x1D712}^{\unicode[STIX]{x1D6FE}}}\rightarrow \frac{\unicode[STIX]{x1D6FC}(x,y)}{(x^{2}+y^{2}+h^{2})^{1/2}},\end{eqnarray}$$
where
 $\unicode[STIX]{x1D6FC}$
is of order one in the limit. From (2.37), we see that the prefactor is also order one in this limit, while the local analysis near the singularity (A 9) showed that
 $1/\unicode[STIX]{x1D712}$
will be a singularity with strength one at
 $x^{2}+y^{2}+h^{2}=0$
. Consequently, matching the order of the expressions in (2.38) gives
 $\unicode[STIX]{x1D6FE}=1/2$
.
We have therefore completely described the late-order terms given in (2.18), where (2.26) is used to determine the value of
 $\unicode[STIX]{x1D6EF}$
.
In appendix B, we use the form of the late-order terms ansatz in (2.18) in order to apply the matched asymptotic expansion methodology of Olde Daalhuis et al. (Reference Olde Daalhuis, Chapman, King, Ockendon and Tew1995). We optimally truncate the asymptotic series, and then find an equation for the exponentially small truncation remainder. Using this expression, we determine where the exponentially small remainder varies rapidly, which corresponds to the location of Stokes lines. If we had not applied the condition in (1.8), this would have been necessary to determine the Stokes structure of the solution. Finally, we use matched asymptotic expansions in the neighbourhood of the Stokes lines in order to determine the quantity that is switched on as the Stokes lines are crossed.
Using this method, we find that the exponentially small contributions to the fluid potential (denoted
 $\unicode[STIX]{x1D719}_{exp}$
) and free-surface position (denoted
 $\unicode[STIX]{x1D709}_{exp}$
) are switched on across the Stokes line, and in regions in which they are active, they are given by
 $$\begin{eqnarray}\unicode[STIX]{x1D719}_{exp}\sim \frac{2\unicode[STIX]{x03C0}\text{i}\unicode[STIX]{x1D6F7}}{\sqrt{\unicode[STIX]{x1D716}}}\text{e}^{-\unicode[STIX]{x1D712}_{S}/\unicode[STIX]{x1D716}}+\text{c.c.},\quad \unicode[STIX]{x1D709}_{exp}\sim \frac{2\unicode[STIX]{x03C0}\text{i}\unicode[STIX]{x1D6EF}}{\sqrt{\unicode[STIX]{x1D716}}}\text{e}^{-\unicode[STIX]{x1D712}_{S}/\unicode[STIX]{x1D716}}+\text{c.c.},\end{eqnarray}$$
where c.c. denotes the complex conjugate contribution. In particular, the expression for
 $\unicode[STIX]{x1D709}_{exp}$
contains exponentially small oscillations representing the capillary ripples on the free surface.
2.4 Results and comparison
Evaluating the amplitude of the waves using
 $\unicode[STIX]{x1D709}_{exp}$
from (2.39) along
 $y=0$
gives
 $$\begin{eqnarray}\unicode[STIX]{x1D709}_{exp}\sim \frac{\text{i}}{\sqrt{2\unicode[STIX]{x03C0}\unicode[STIX]{x1D716}(4h-3\text{i}x)}}\text{e}^{-(h-\text{i}x)/\unicode[STIX]{x1D716}}+\text{c. c.},\quad \unicode[STIX]{x1D716}\rightarrow 0.\end{eqnarray}$$
In the limit that
 $x$
becomes large and negative, we find that the amplitude of the capillary waves along
 $y=0$
is given by
 $$\begin{eqnarray}\text{Amplitude}\sim \frac{2\text{e}^{-h/\unicode[STIX]{x1D716}}}{\sqrt{6\unicode[STIX]{x03C0}\unicode[STIX]{x1D716}|x|}},\quad x\rightarrow -\infty ,\,\unicode[STIX]{x1D716}\rightarrow 0.\end{eqnarray}$$
This provides us with the means to check the accuracy of our approximation. We can compare the amplitude of the asymptotic results with those of numerically calculated free-surface profiles, calculated using an adaption of the method described Lustri & Chapman (Reference Lustri and Chapman2013).
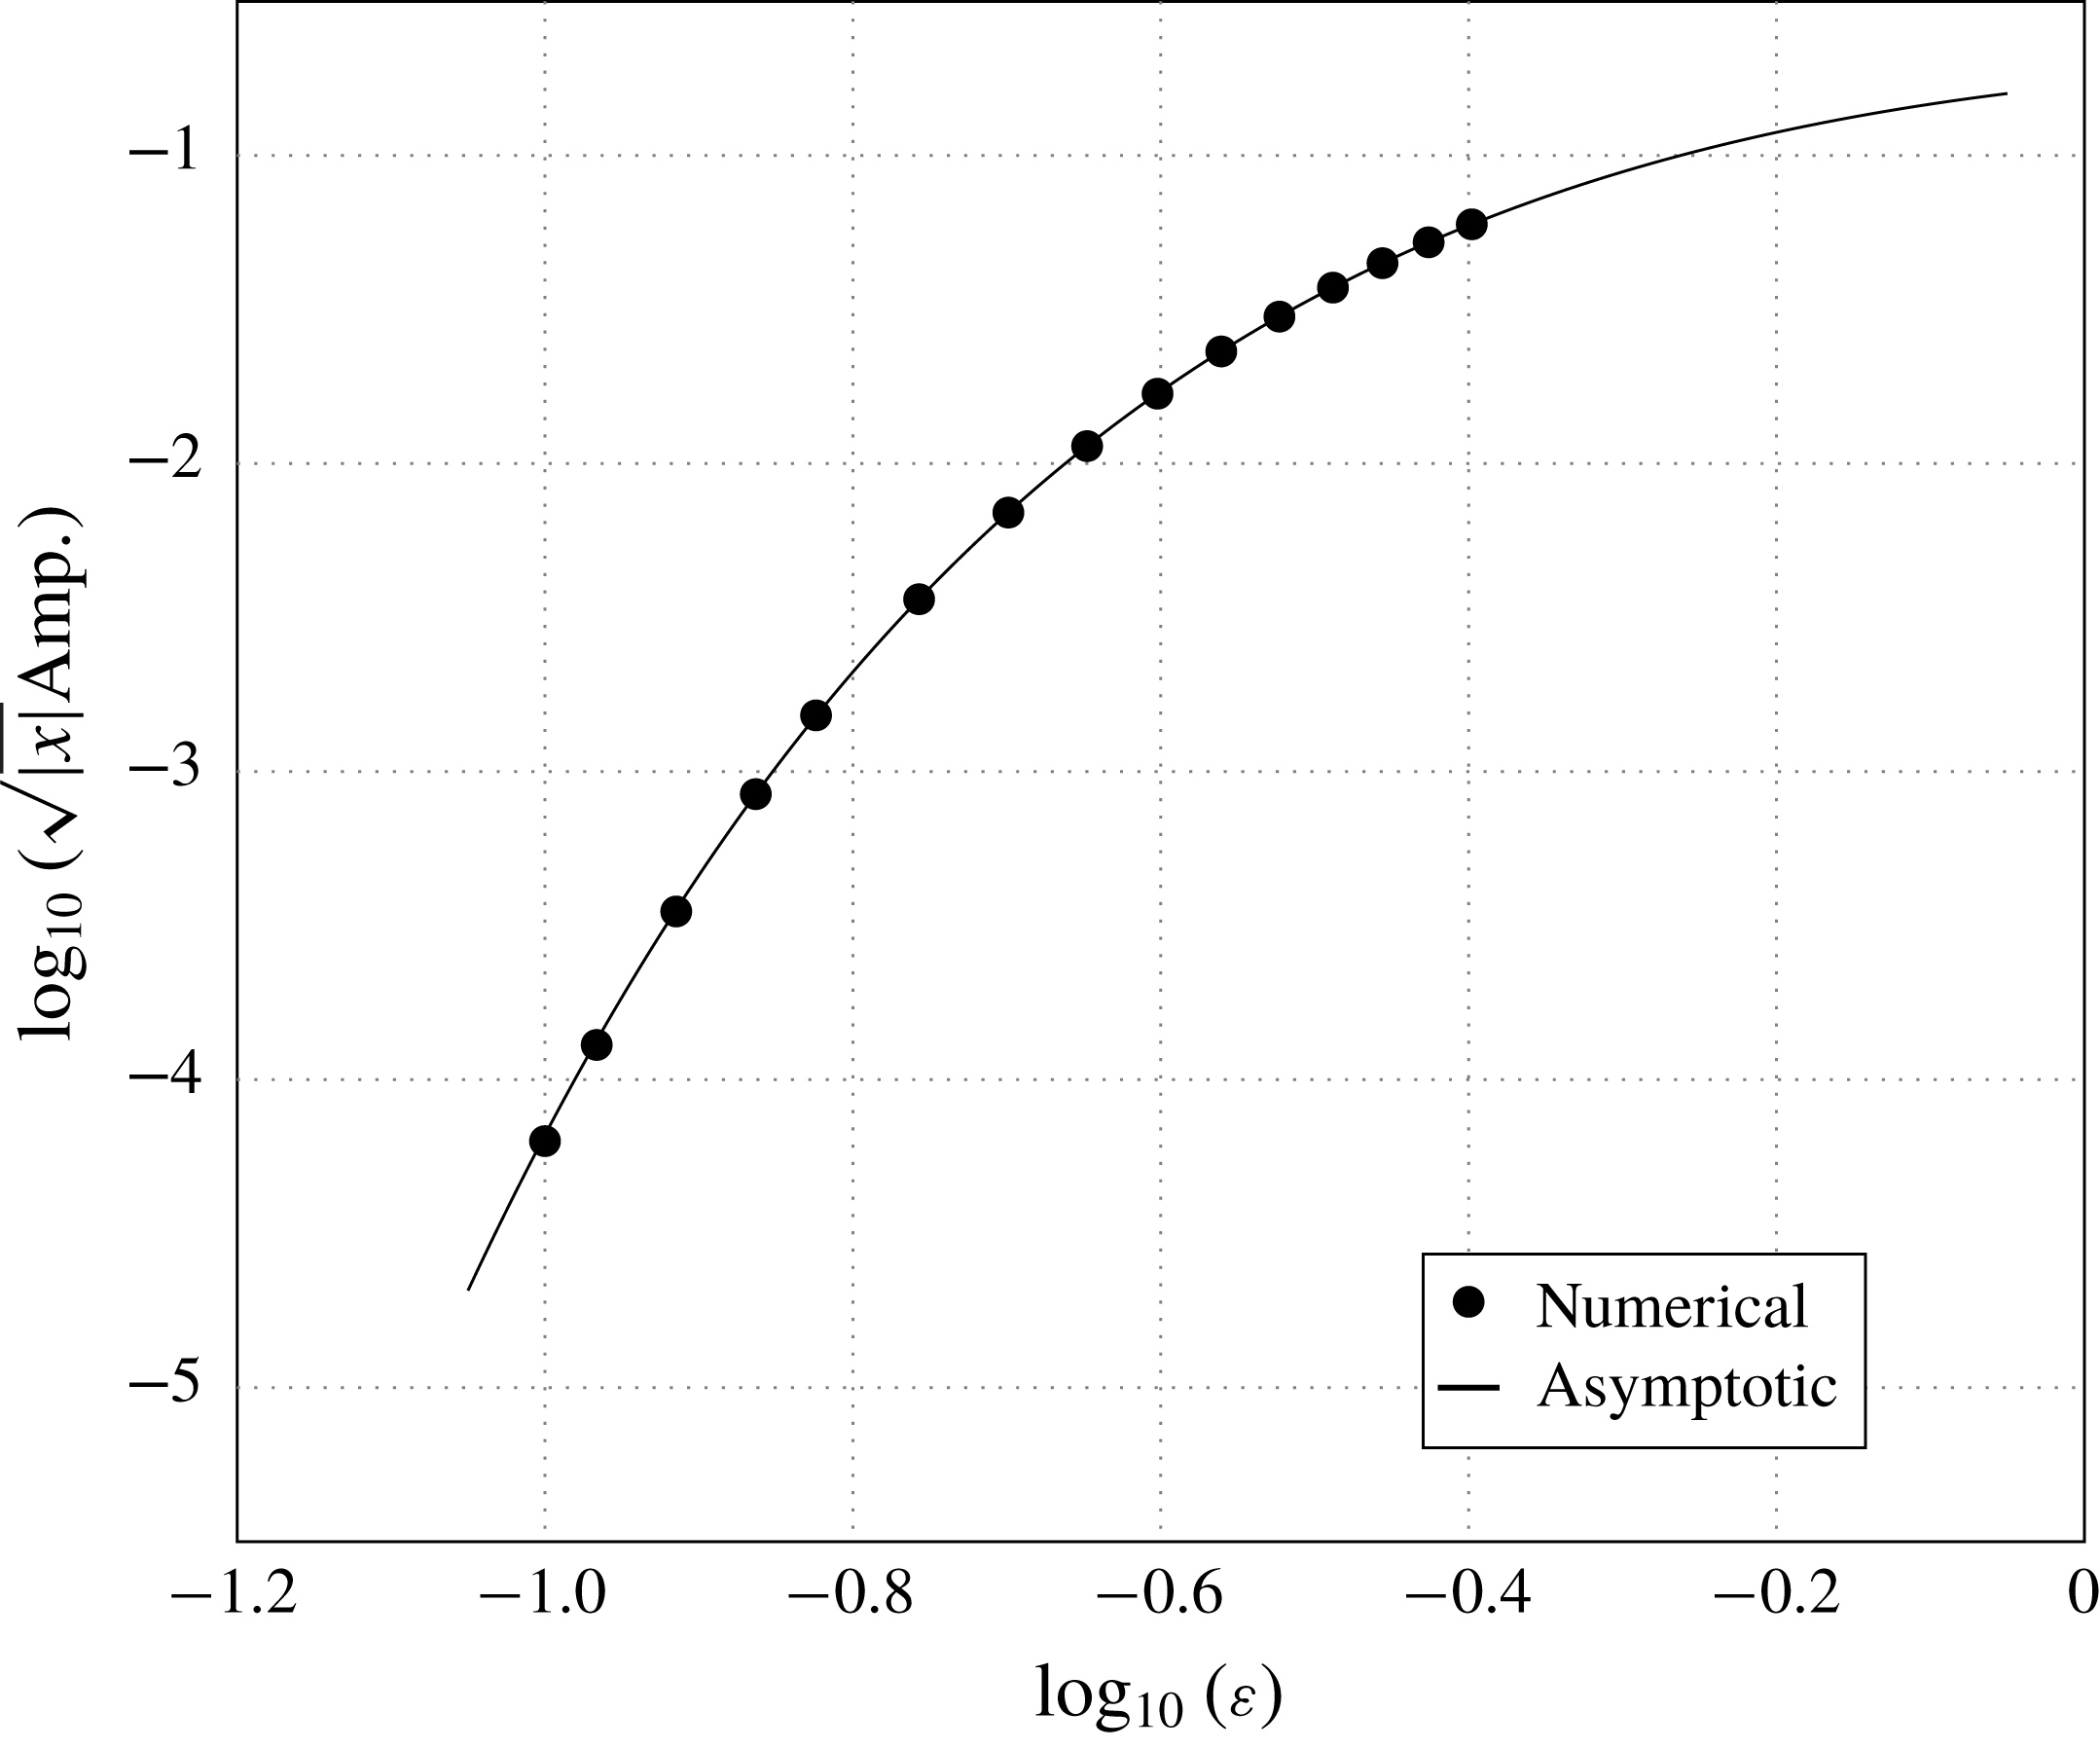
In figure 4, we illustrate the scaled numerical amplitude (circles) against the asymptotic prediction from (2.41), computed for
 $h=1$
over a range of
 $\unicode[STIX]{x1D716}$
values. It is apparent that there is strong agreement between the numerical and the asymptotic results. For values of
 $\unicode[STIX]{x1D716}$
smaller than those depicted, it becomes numerically challenging to compute the wave behaviour, due to the very small amplitude of the resulting waves.
Numerical (dots) verses scaled asymptotic (line) amplitude of capillary waves in the far field (
 $x\rightarrow -\infty$
) along
 $y=0$
for
 $h=1$
.

We see that the asymptotic prediction agrees with the numerically computed results even when
 $\unicode[STIX]{x1D716}$
is not extremely small. This implies that the wave approximation obtained in this study is useful even outside the flow regime in which the asymptotic analysis is formally valid.
3 Unsteady flow
3.1 Formulation
In this section, we consider the same flow configuration described in § 2; however, we permit the system to vary in time. We prescribe the initial state of the flow and investigate the resultant unsteady behaviour.
3.1.1 Full problem
We again consider three-dimensional potential flow with infinite depth and a submerged point source at depth
 $H$
and upstream flow velocity
 $U$
. We normalise the fluid velocity with
 $U$
and distance by with an unspecified length
 $L$
, giving non-dimensionalised source depth
 $h=H/L$
.
Denoting the (non-dimensional) position of the free surface by
 $z=\unicode[STIX]{x1D709}(x,y,t)$
, the (non-dimensional) velocity potential again satisfies Laplace’s equation (2.1), however the kinematic and dynamic boundary conditions respectively become
 $$\begin{eqnarray}\displaystyle & \unicode[STIX]{x1D709}_{x}\unicode[STIX]{x1D719}_{x}+\unicode[STIX]{x1D709}_{y}\unicode[STIX]{x1D719}_{y}+\unicode[STIX]{x1D709}_{t}=\unicode[STIX]{x1D719}_{z},\quad z=\unicode[STIX]{x1D709}(x,y,t), & \displaystyle\end{eqnarray}$$
 $$\begin{eqnarray}\displaystyle & \unicode[STIX]{x1D719}_{t}+{\textstyle \frac{1}{2}}(\unicode[STIX]{x1D719}_{t}+|\unicode[STIX]{x1D735}\unicode[STIX]{x1D719}|^{2}-1)+\unicode[STIX]{x1D716}\unicode[STIX]{x1D705}=0,\quad z=\unicode[STIX]{x1D709}(x,y,t), & \displaystyle\end{eqnarray}$$
where
 $\unicode[STIX]{x1D716}$
again denotes the inverse Weber number, and
 $\unicode[STIX]{x1D705}$
the curvature of the surface. The far-field conditions are identical to those in § 2. The source condition is given by (2.5). As the problem is unsteady, we do not require a radiation condition, but rather specify that the free surface must be waveless in the far field. Finally, we require an initial condition, as in Lustri & Chapman (Reference Lustri and Chapman2014), we specify that the initial state is given by the leading-order solution to the steady problem, given in (2.16)–(2.17). Hence the initial behaviour takes the form
 $$\begin{eqnarray}\displaystyle & \displaystyle \unicode[STIX]{x1D719}(x,y,z,0)=\frac{\unicode[STIX]{x1D6FF}}{4\unicode[STIX]{x03C0}\sqrt{x^{2}+y^{2}+(z+h)^{2}}}-\frac{\unicode[STIX]{x1D6FF}}{4\unicode[STIX]{x03C0}\sqrt{x^{2}+y^{2}+(z-h)^{2}}}, & \displaystyle\end{eqnarray}$$
 $$\begin{eqnarray}\displaystyle & \displaystyle \unicode[STIX]{x1D709}(x,y,0)=-\frac{\unicode[STIX]{x1D6FF}xh}{2\unicode[STIX]{x03C0}(y^{2}+h^{2})\sqrt{x^{2}+y^{2}+h^{2}}}-\frac{\unicode[STIX]{x1D6FF}}{2\unicode[STIX]{x03C0}(y^{2}+h^{2})}. & \displaystyle\end{eqnarray}$$
The reason for this choice of initial condition is that it enables us to focus on wave generation rather than the bulk flow adjusting to the presence of the source; in particular it guarantees that the leading-order solution is steady, and hence that the leading-order behaviour
 $\unicode[STIX]{x1D719}^{(0)}(x,y,z,t)=\unicode[STIX]{x1D719}(x,y,z,0)$
and
 $\unicode[STIX]{x1D709}^{(0)}(x,y,t)=\unicode[STIX]{x1D709}(x,y,0)$
. Note that it does not imply that any subsequent order is steady.
3.1.2 Linearisation
We again linearise about uniform flow, and find that the governing equation (2.7) is valid in the unsteady problem. However, the boundary conditions become
 $$\begin{eqnarray}\displaystyle & \tilde{\unicode[STIX]{x1D719}}_{z}-\tilde{\unicode[STIX]{x1D709}}_{x}-\tilde{\unicode[STIX]{x1D709}}_{t}=0,\quad z=0, & \displaystyle\end{eqnarray}$$
 $$\begin{eqnarray}\displaystyle & \tilde{\unicode[STIX]{x1D719}}_{x}+\tilde{\unicode[STIX]{x1D719}}_{t}-\unicode[STIX]{x1D716}(\tilde{\unicode[STIX]{x1D709}}_{xx}+\tilde{\unicode[STIX]{x1D709}}_{yy})=0,\quad z=0, & \displaystyle\end{eqnarray}$$
where the boundary conditions are again applied on the fixed surface
 $z=0$
. The far-field conditions imply that
 $\tilde{\unicode[STIX]{x1D719}}\rightarrow 0$
as
 $x^{2}+y^{2}+z^{2}\rightarrow \infty$
, while near the source, (2.10) still holds. The initial condition is still given by (3.3)–(3.4).
We again analytically continue the free surface such that
 $x,y\in \mathbb{C}$
, with the free surface still satisfying
 $z=0$
. We do not, however, need to analytically continue
 $t$
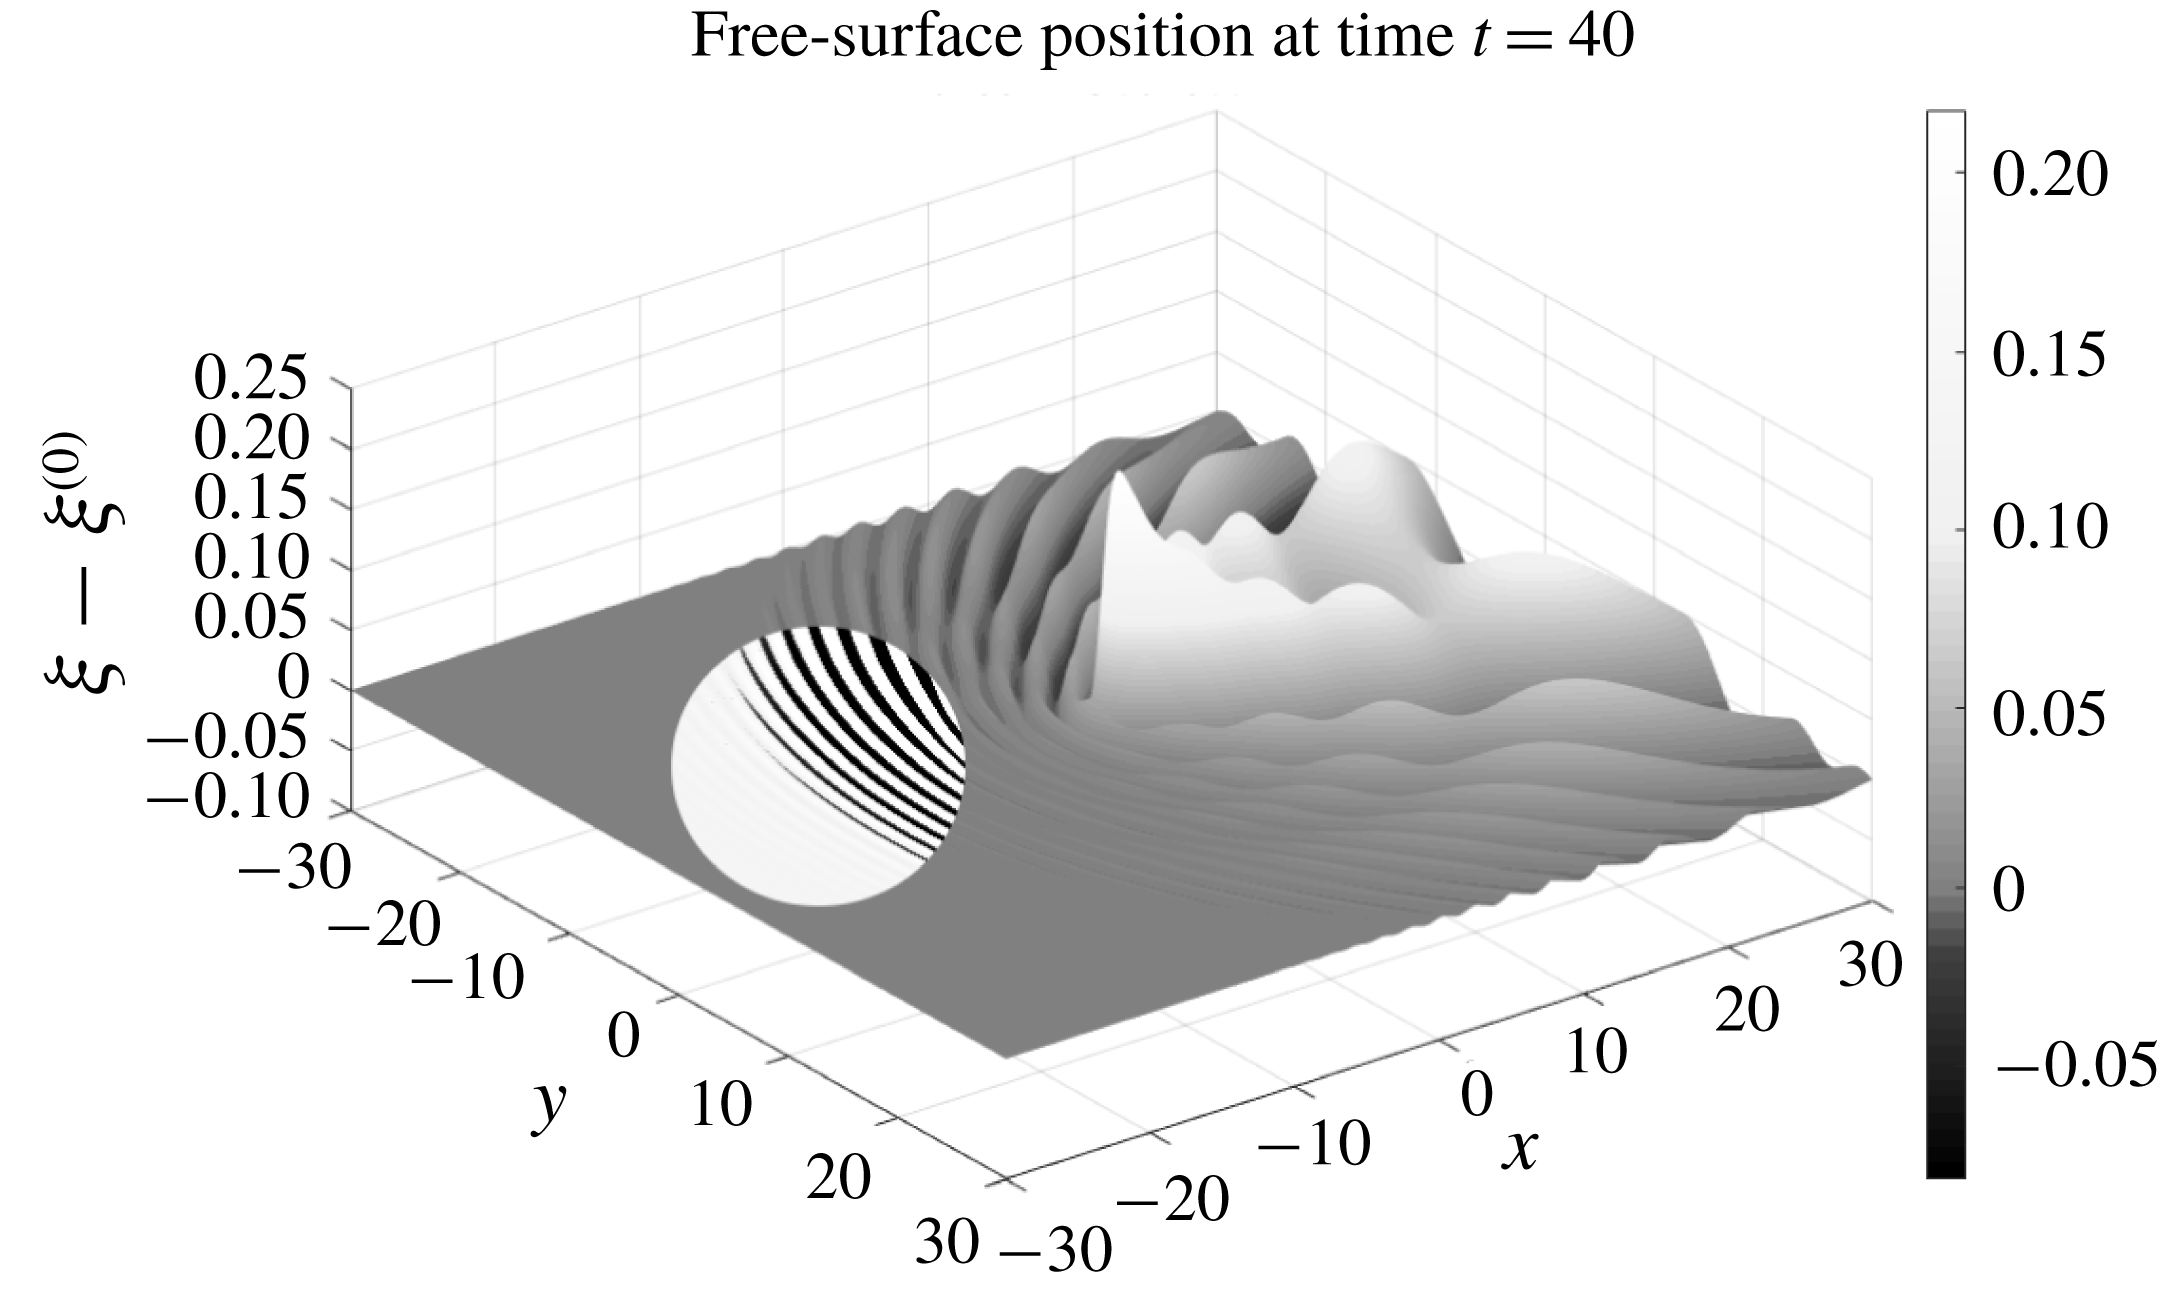
in this problem. Continuation does not change the form of (2.7)–(2.10), but it does mean that the three-physical free surface (with two spatial and one time dimensions) is now a subset of a five-dimensional complexified free surface. We can again solve the linearised problem numerically using the method from Lustri & Chapman (Reference Lustri and Chapman2014), to obtain numerical free-surface profiles such as that illustrated in figure 5.
Surface plot of the modified free-surface position
 $\unicode[STIX]{x1D709}-\unicode[STIX]{x1D709}^{(0)}$
, where
 $\unicode[STIX]{x1D709}^{(0)}$
is the leading-order free-surface profile given in (2.17), with
 $h=1$
and
 $\unicode[STIX]{x1D716}=0.2$
. The initial condition of the flow is given by
 $\unicode[STIX]{x1D709}=\unicode[STIX]{x1D709}^{(0)}$
, and therefore
 $\unicode[STIX]{x1D709}-\unicode[STIX]{x1D709}^{(0)}=0$
. This image corresponds to
 $t=40$
. Flow is in the positive
 $x$
-direction. We can see capillary waves extending upstream from the obstacle, however they have not propagated to the negative edge of the displayed region. In order to show the position of the wavefront clearly, the contrast has been increased in a circular region of the figure.

3.1.3 Series expression
Again, we expand the fluid potential and free-surface position as a power series in
 $\unicode[STIX]{x1D716}$
. The governing equation is given by (2.12), while the boundary conditions become for
 $n\geqslant 0$
,
 $$\begin{eqnarray}\displaystyle & \displaystyle \unicode[STIX]{x1D719}_{z}^{(n)}-\unicode[STIX]{x1D709}_{x}^{(n)}-\unicode[STIX]{x1D709}_{t}^{(n)}=0,\quad z=0, & \displaystyle\end{eqnarray}$$
 $$\begin{eqnarray}\displaystyle & \displaystyle \unicode[STIX]{x1D719}_{x}^{(n)}+\unicode[STIX]{x1D719}_{t}^{(n)}-\unicode[STIX]{x1D709}_{xx}^{(n-1)}-\unicode[STIX]{x1D709}_{yy}^{(n-1)}=0,\quad z=0, & \displaystyle\end{eqnarray}$$
again with the convention that
 $\unicode[STIX]{x1D709}^{(-1)}=0$
. The far-field behaviour tends to zero at all orders of
 $n$
, and the singularity condition (2.10) is applied to the leading-order expression, giving the source condition in (2.15). The initial condition is obtained using (3.3)–(3.4). As the leading-order behaviour is steady, we find that
 $\unicode[STIX]{x1D719}^{(0)}=\unicode[STIX]{x1D719}^{(0)}(x,y,z,0)$
and
 $\unicode[STIX]{x1D709}^{(0)}=\unicode[STIX]{x1D709}^{(0)}(x,y,0)$
.
3.2 Late-order terms
In order to optimally truncate the asymptotic series prescribed in (2.11), we must determine the form of the late-order terms. To accomplish this, we make the new unsteady factorial-over-power ansatz (Chapman et al. Reference Chapman, King, Ockendon and Adams1998)
 $$\begin{eqnarray}\unicode[STIX]{x1D719}^{(n)}\sim \frac{\unicode[STIX]{x1D6F7}(x,y,z,t)\unicode[STIX]{x1D6E4}(n+\unicode[STIX]{x1D6FE})}{\unicode[STIX]{x1D712}(x,y,z,t)^{n+\unicode[STIX]{x1D6FE}}},\quad \unicode[STIX]{x1D709}^{(n)}\sim \frac{\unicode[STIX]{x1D6EF}(x,y,t)\unicode[STIX]{x1D6E4}(n+\unicode[STIX]{x1D6FE})}{\unicode[STIX]{x1D712}(x,y,0,t)^{n+\unicode[STIX]{x1D6FE}}},\quad \text{as}~n\rightarrow \infty ,\end{eqnarray}$$
which varies now in
 $t$
, as well as the spatial dimensions. A nearly identical analysis to § 2.3.1 gives the singulant equation on the free surface as
 $$\begin{eqnarray}(\unicode[STIX]{x1D712}_{x}+\unicode[STIX]{x1D712}_{t})^{4}+(\unicode[STIX]{x1D712}_{x}^{2}+\unicode[STIX]{x1D712}_{y}^{2})^{3}=0.\end{eqnarray}$$
In considering the unsteady flow problem, we will restrict our attention to the singulants, ignoring the prefactor equation, and use the singulant behaviour to determine the position of Stokes lines and wave regions on the free surface.
3.2.1 Calculating the singulant
To determine the singulant behaviour on the free surface, we note that the leading-order behaviour does have singularities on the analytically continued free surface located at
 $x^{2}+y^{2}+(z\pm h)^{2}=0$
for all time, and that these are identical to those described in (§ 3.2.1). As a consequence, wave behaviour associated with
 $\unicode[STIX]{x1D712}_{1}$
and
 $\overline{\unicode[STIX]{x1D712}}_{1}$
will be present on the free surface. The presence of these waves is unsurprising, as the steady wave behaviour satisfies (2.8)–(2.9), as well as the governing equation.
However, we do see from figure 3 that these singulants lead to wave behaviour far upstream of the obstacle, which violates the prescribed (waveless) far-field condition. Consequently, we infer that there must be another wave contribution, which introduces more complicated Stokes line behaviour into the unsteady problem.
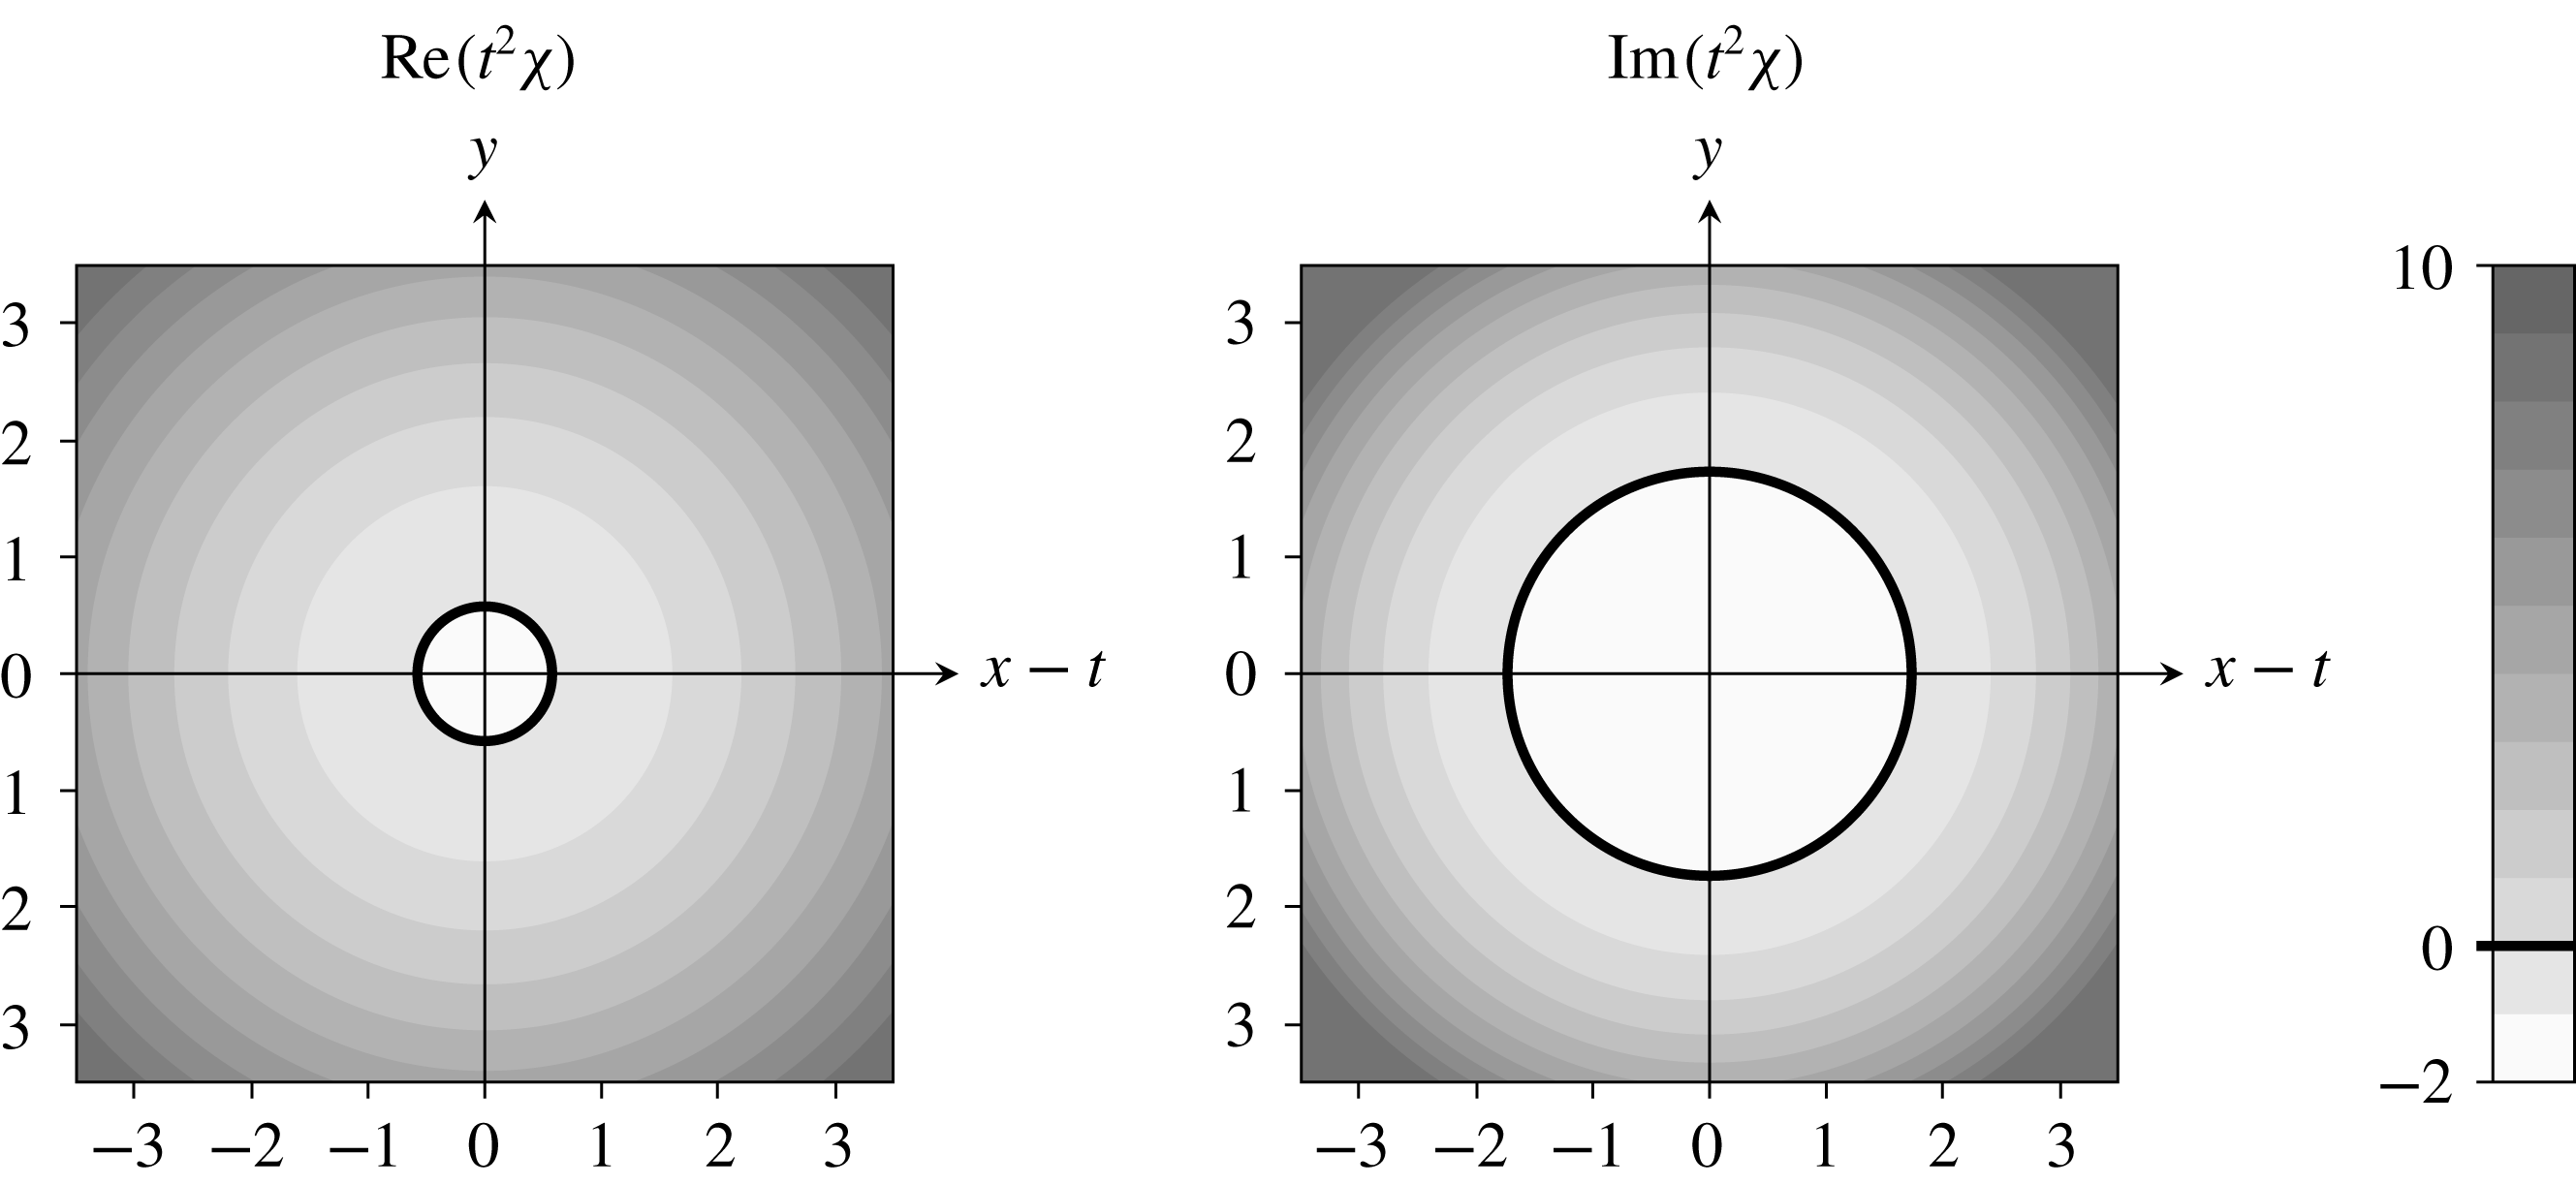
Singulant behaviour
 $\unicode[STIX]{x1D712}_{U}$
, obtained by solving (3.13) with boundary data (3.14). The expression is scaled by
 $t^{2}$
and presented in a frame moving with the flow, so that the resultant behaviour is constant in time. The remaining singulant expressions associated with unsteady behaviour are given by
 $-\unicode[STIX]{x1D712}_{U}$
, as well as
 $\pm \overline{\unicode[STIX]{x1D712}}_{U}$
. We see that Stokes switching is possible for
 $\unicode[STIX]{x1D712}_{U}$
as
 $\text{Re}(\unicode[STIX]{x1D712})>0$
across the Stokes line satisfying
 $\text{Re}(\unicode[STIX]{x1D712})=0$
. There is an anti-Stokes line inside the Stokes line, meaning that any surface wave behaviour would become exponentially large as this line is crossed. Consequently, we conclude that the unsteady exponentially small contribution cannot be present inside the Stokes line, and must instead be switched on outside. The same is true of the contribution associated with
 $\overline{\unicode[STIX]{x1D712}}_{U}$
. However,
 $\text{Re}(-\unicode[STIX]{x1D712}_{U})$
and
 $\text{Re}(-\overline{\unicode[STIX]{x1D712}}_{U})$
are both negative as the Stokes line is crossed, and hence these singulants cannot produce any Stokes switching on the free surface.

Specifically, we note that a second singularity is present in the unsteady problem, introduced in the unsteady second-order terms. As in Chapman (Reference Chapman1996) and Lustri & Chapman (Reference Lustri and Chapman2014), we require that all characteristics pass through the disturbance located at
 $x^{2}+y^{2}+(z\pm h)^{2}=0$
when
 $t=0$
. As in Lustri & Chapman (Reference Lustri and Chapman2014), we observe that this singularity corresponds to the instantaneous initial change introduced into the flow at
 $t=0$
. Hence, we apply the boundary conditions
 $$\begin{eqnarray}x_{0}=s,\quad y_{0}=\pm \text{i}\sqrt{s^{2}+h^{2}},\quad \unicode[STIX]{x1D712}_{0}=0,\quad t=0.\end{eqnarray}$$
The singulant equation (3.10) may again be solved using Charpit’s method, however the analysis is simpler if we note that the solution may be expressed in a reduced set of coordinates
 $$\begin{eqnarray}\unicode[STIX]{x1D70F}=t,\quad \unicode[STIX]{x1D70C}=\sqrt{(x-t)^{2}+y^{2}},\end{eqnarray}$$
implying that the solution is radially symmetric about the propagating point
 $x=t$
. This is consistent with the boundary data and reduces the singulant equation (3.10) to
 $$\begin{eqnarray}\unicode[STIX]{x1D712}_{\unicode[STIX]{x1D70F}}^{4}+\unicode[STIX]{x1D712}_{p}^{6}=0,\end{eqnarray}$$
with the boundary conditions becoming
 $$\begin{eqnarray}\unicode[STIX]{x1D70F}_{0}=0,\quad \unicode[STIX]{x1D70C}_{0}=\pm \text{i}h,\quad \unicode[STIX]{x1D712}_{0}=0.\end{eqnarray}$$
Solving this much simpler equation using Charpit’s method gives four non-zero solutions, which take the form
 $$\begin{eqnarray}\unicode[STIX]{x1D712}=\pm \frac{4\text{i}(\unicode[STIX]{x1D70C}\pm \text{i}h)^{3}}{27\unicode[STIX]{x1D70F}^{2}},\end{eqnarray}$$
where the signs may be chosen independently. We will refer to the solution with the first sign being positive and the second being negative as
 $\unicode[STIX]{x1D712}_{U}$
, and hence the remaining possible singulant expressions are given by
 $-\unicode[STIX]{x1D712}_{U}$
and
 $\pm \overline{\unicode[STIX]{x1D712}}_{U}$
. We illustrate this singulant behaviour in figure 6. Importantly, we see from (3.15) that
 $$\begin{eqnarray}\text{Re}(\unicode[STIX]{x1D712}_{U})=0\quad \text{on}~\unicode[STIX]{x1D70C}=\frac{h}{\sqrt{3}},\quad \text{Im}(\unicode[STIX]{x1D712}_{U})=0\quad \text{on}~\unicode[STIX]{x1D70C}=\sqrt{3}h.\end{eqnarray}$$
The first of these conditions describes the location of anti-Stokes lines, while the second describes the location of Stokes lines. These may be seen clearly in figure 6, where the anti-Stokes and Stokes lines are described by concentric circles about
 $x=t$
. Importantly, the anti-Stokes lines are always contained within the Stokes lines, meaning that any waves contained within the Stokes line circle will produce exponentially large behaviour on the free surface. Consequently, we conclude the free surface can only contain wave behaviour outside the Stokes lines.
Furthermore, we see that only
 $\unicode[STIX]{x1D712}_{U}$
and
 $\overline{\unicode[STIX]{x1D712}}_{U}$
have
 $\text{Re}(\unicode[STIX]{x1D712})>0$
as the Stokes line is crossed. Therefore, it is only these contributions that will be switched across the Stokes lines. Hence, inside the Stokes line, there are no exponentially small free-surface waves associated with the unsteady contribution, but as the Stokes line is crossed, waves associated with
 $\unicode[STIX]{x1D712}_{U}$
and
 $\overline{\unicode[STIX]{x1D712}}_{U}$
will be switched on.
3.3 Stokes line interactions
We have shown that there are two sets of Stokes line behaviours on the free surface, associated with
 $\unicode[STIX]{x1D712}_{S}$
,
 $\unicode[STIX]{x1D712}_{U}$
and their complex conjugate expressions, across which the leading-order behaviour switched on exponentially small contributions to the free-surface behaviour. However, to fully describe the free-surface behaviour, we must consider Stokes lines caused by the interaction between
 $\unicode[STIX]{x1D712}_{S}$
and
 $\unicode[STIX]{x1D712}_{U}$
, as well as the interaction between
 $\overline{\unicode[STIX]{x1D712}}_{S}$
and
 $\overline{\unicode[STIX]{x1D712}}_{U}$
. In this section, we will restrict our attention to
 $\unicode[STIX]{x1D712}_{S}$
and
 $\unicode[STIX]{x1D712}_{U}$
, noting that the same switching behaviour will be demonstrated by the complex conjugate expressions.
In previous analyses of the Stokes structure of partial differential equations (Howls et al.
Reference Howls, Langman and Olde Daalhuis2004; Chapman & Mortimer Reference Chapman and Mortimer2005), it was found that Stokes switching may also occur when one exponentially subdominant contribution switches on a further subdominant contribution. Hence, we find that Stokes switching also occurs on curves satisfying
 $\text{Im}(\unicode[STIX]{x1D712}_{S})=\text{Im}(\unicode[STIX]{x1D712}_{U})$
and
 $\text{Re}(\unicode[STIX]{x1D712}_{U})<\text{Re}(\unicode[STIX]{x1D712}_{S})$
, across which the capillary wave behaviour associated with
 $\unicode[STIX]{x1D712}_{U}$
is switched on.
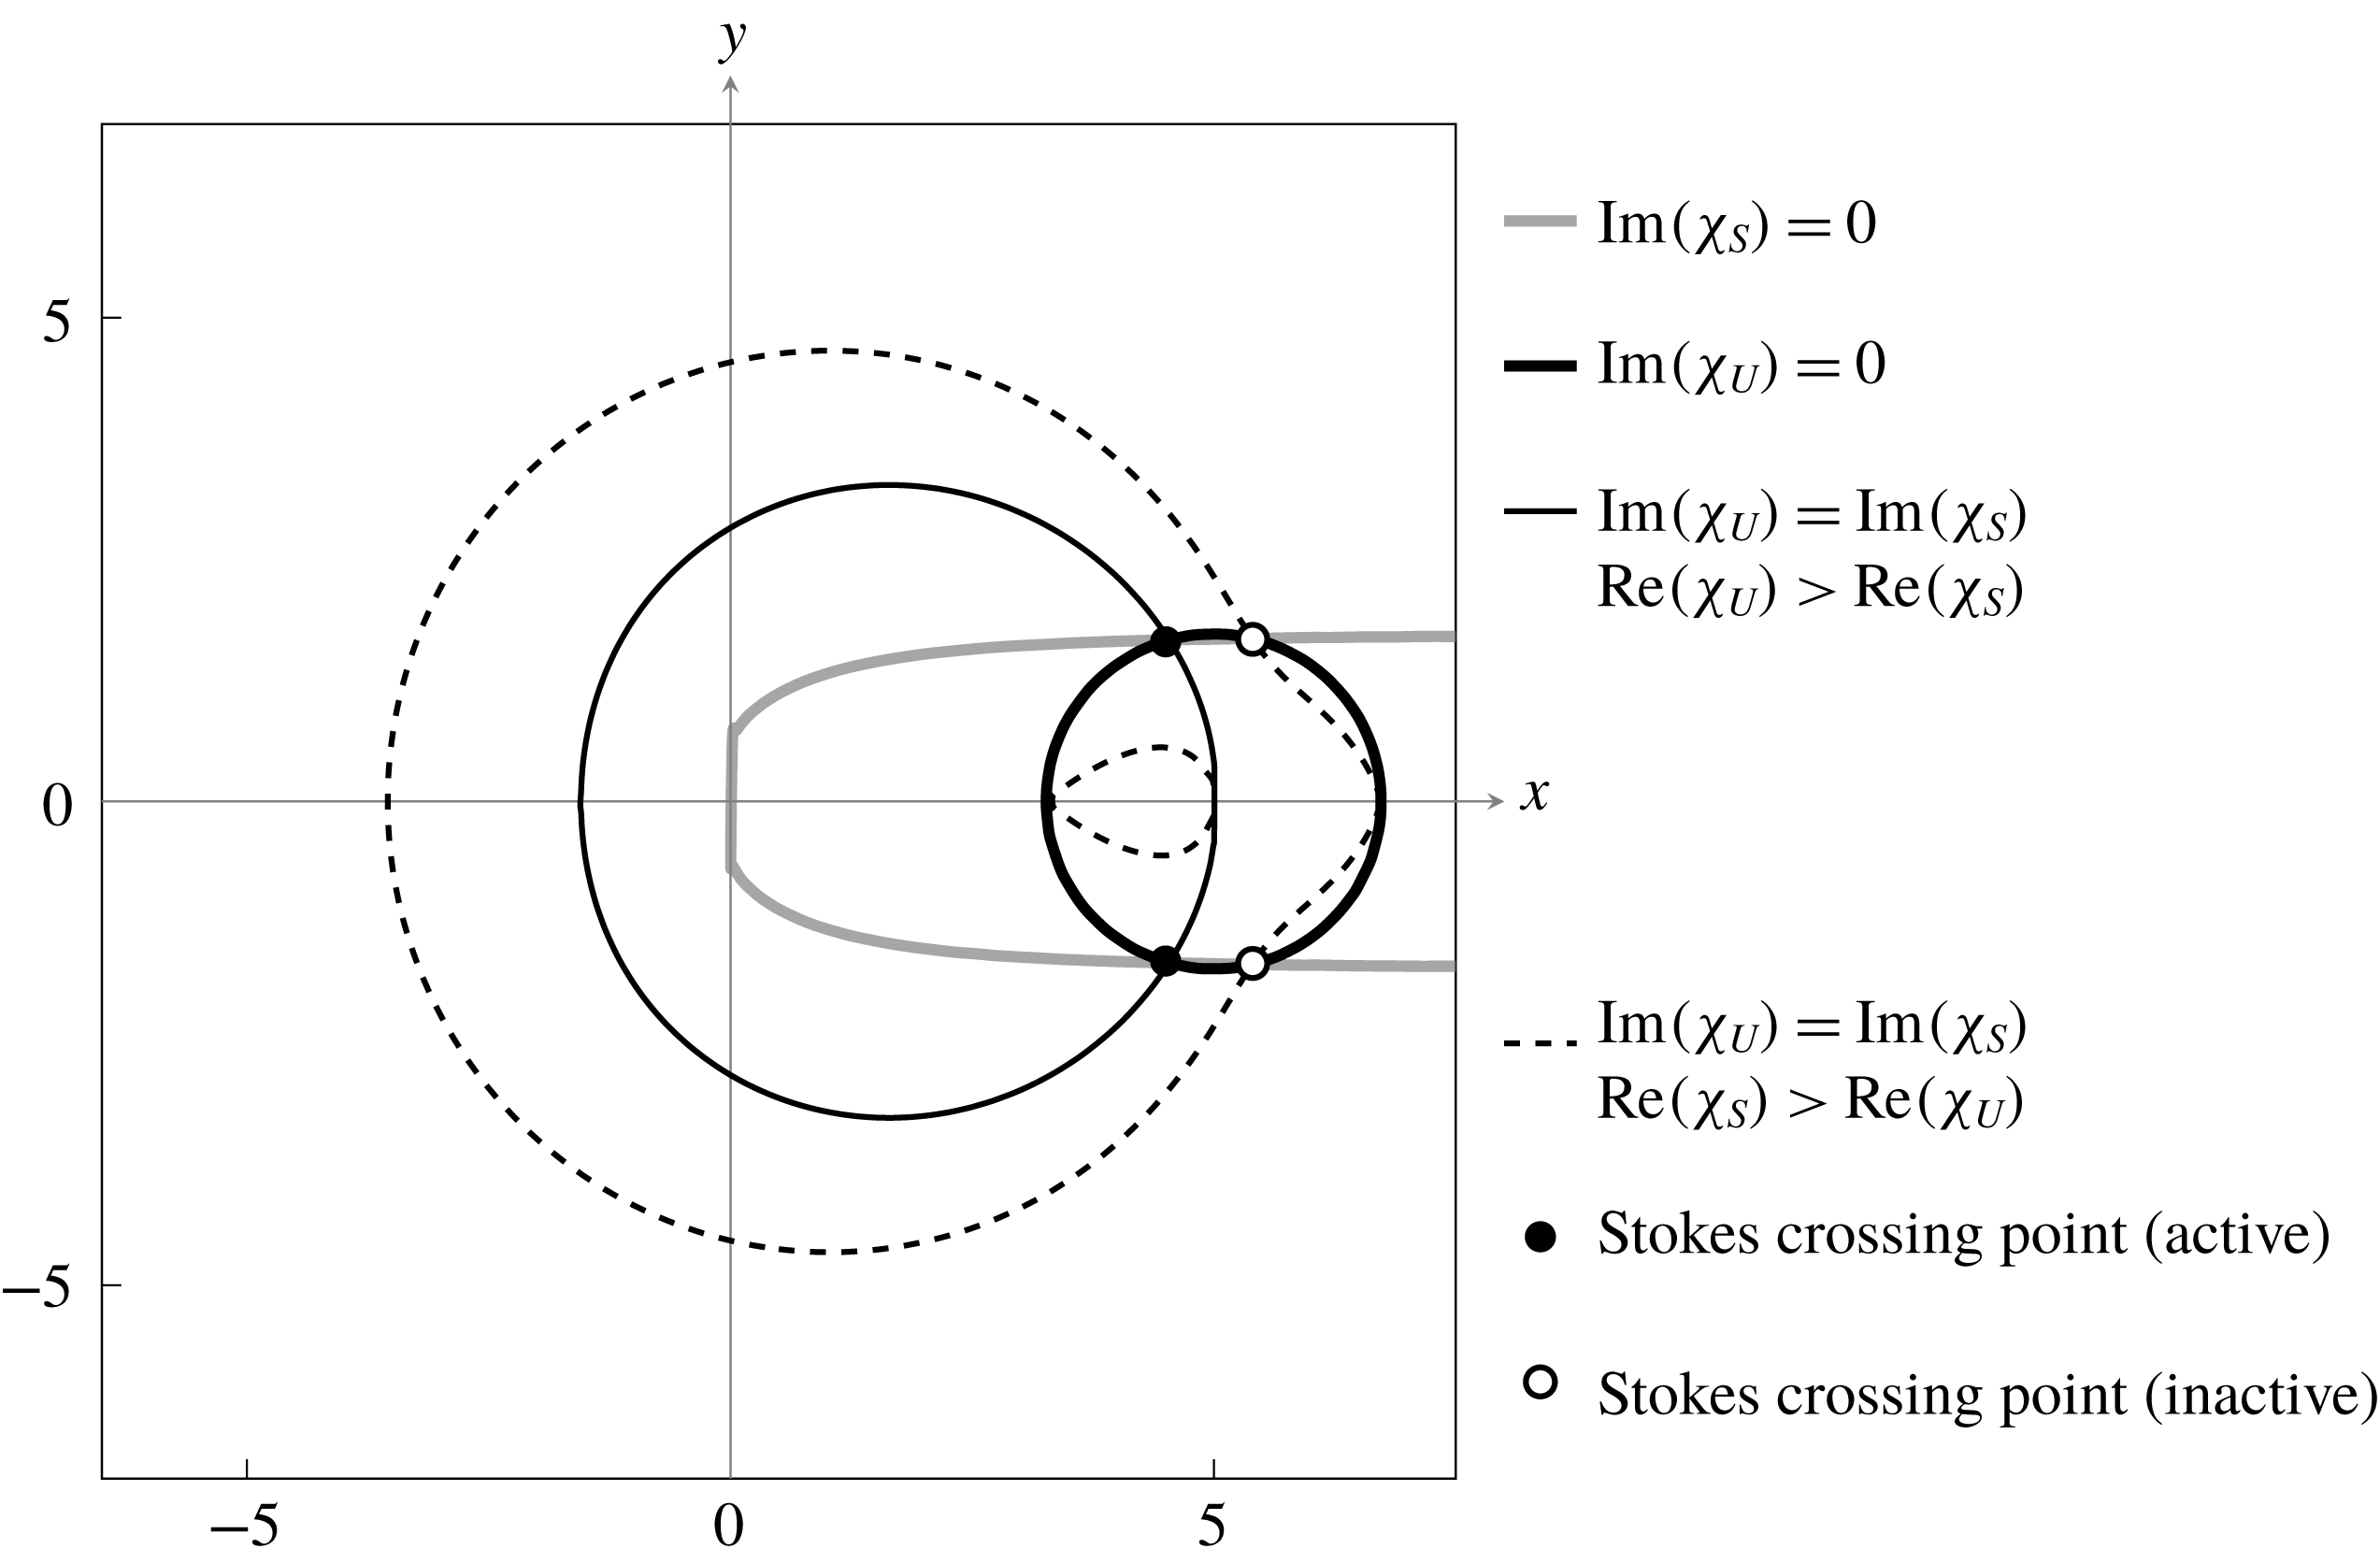
Consequently, the complete Stokes structure contains three sets of equal phase lines, which are illustrated in figure 7 for
 $t=5$
and
 $h=1$
, although the equal phase line following
 $y=0$
has been omitted, as it was established in § 2 to be inactive. We have also illustrated the anti-Stokes line along which
 $\text{Re}(\unicode[STIX]{x1D712}_{S})=\text{Re}(\unicode[STIX]{x1D712}_{U})$
.
Relevant Stokes lines present on the free surface for
 $t=5$
and
 $h=1$
. The wide grey and black curves are the Stokes lines associated with the steady and unsteady contributions (satisfying
 $\text{Im}(\unicode[STIX]{x1D712}_{S})=0$
and
 $\text{Im}(\unicode[STIX]{x1D712}_{U})=0$
) respectively. The solid narrow curve is a Stokes line across which the unsteady contribution switches the steady contribution (satisfying
 $\text{Im}(\unicode[STIX]{x1D712}_{S})=\text{Im}(\unicode[STIX]{x1D712}_{U})$
and
 $\text{Re}(\unicode[STIX]{x1D712}_{U})>\text{Re}(\unicode[STIX]{x1D712}_{S})$
). The dashed narrow curves are Stokes lines across which the steady contribution would switch the unsteady contribution, however these contributions are inactive. The filled circles are Stokes crossing points, at which Stokes lines terminate. The empty circles are potential Stokes crossing points where at least one of the contributions is inactive, and therefore nothing occurs.

It is not possible, however, for all potential Stokes lines to be active throughout the domain. We recall from Howls et al. (Reference Howls, Langman and Olde Daalhuis2004), and Chapman & Mortimer (Reference Chapman and Mortimer2005) that Stokes lines may become inactive as they cross higher-order Stokes lines, which satisfy (1.14). The position of higher-order Stokes lines is obtained by allowing
 $\unicode[STIX]{x1D712}_{1}=\unicode[STIX]{x1D712}_{S}$
,
 $\unicode[STIX]{x1D712}_{2}=\unicode[STIX]{x1D712}_{U}$
, and
 $\unicode[STIX]{x1D712}_{3}=0$
, which corresponds to algebraic contributions to the surface behaviour.
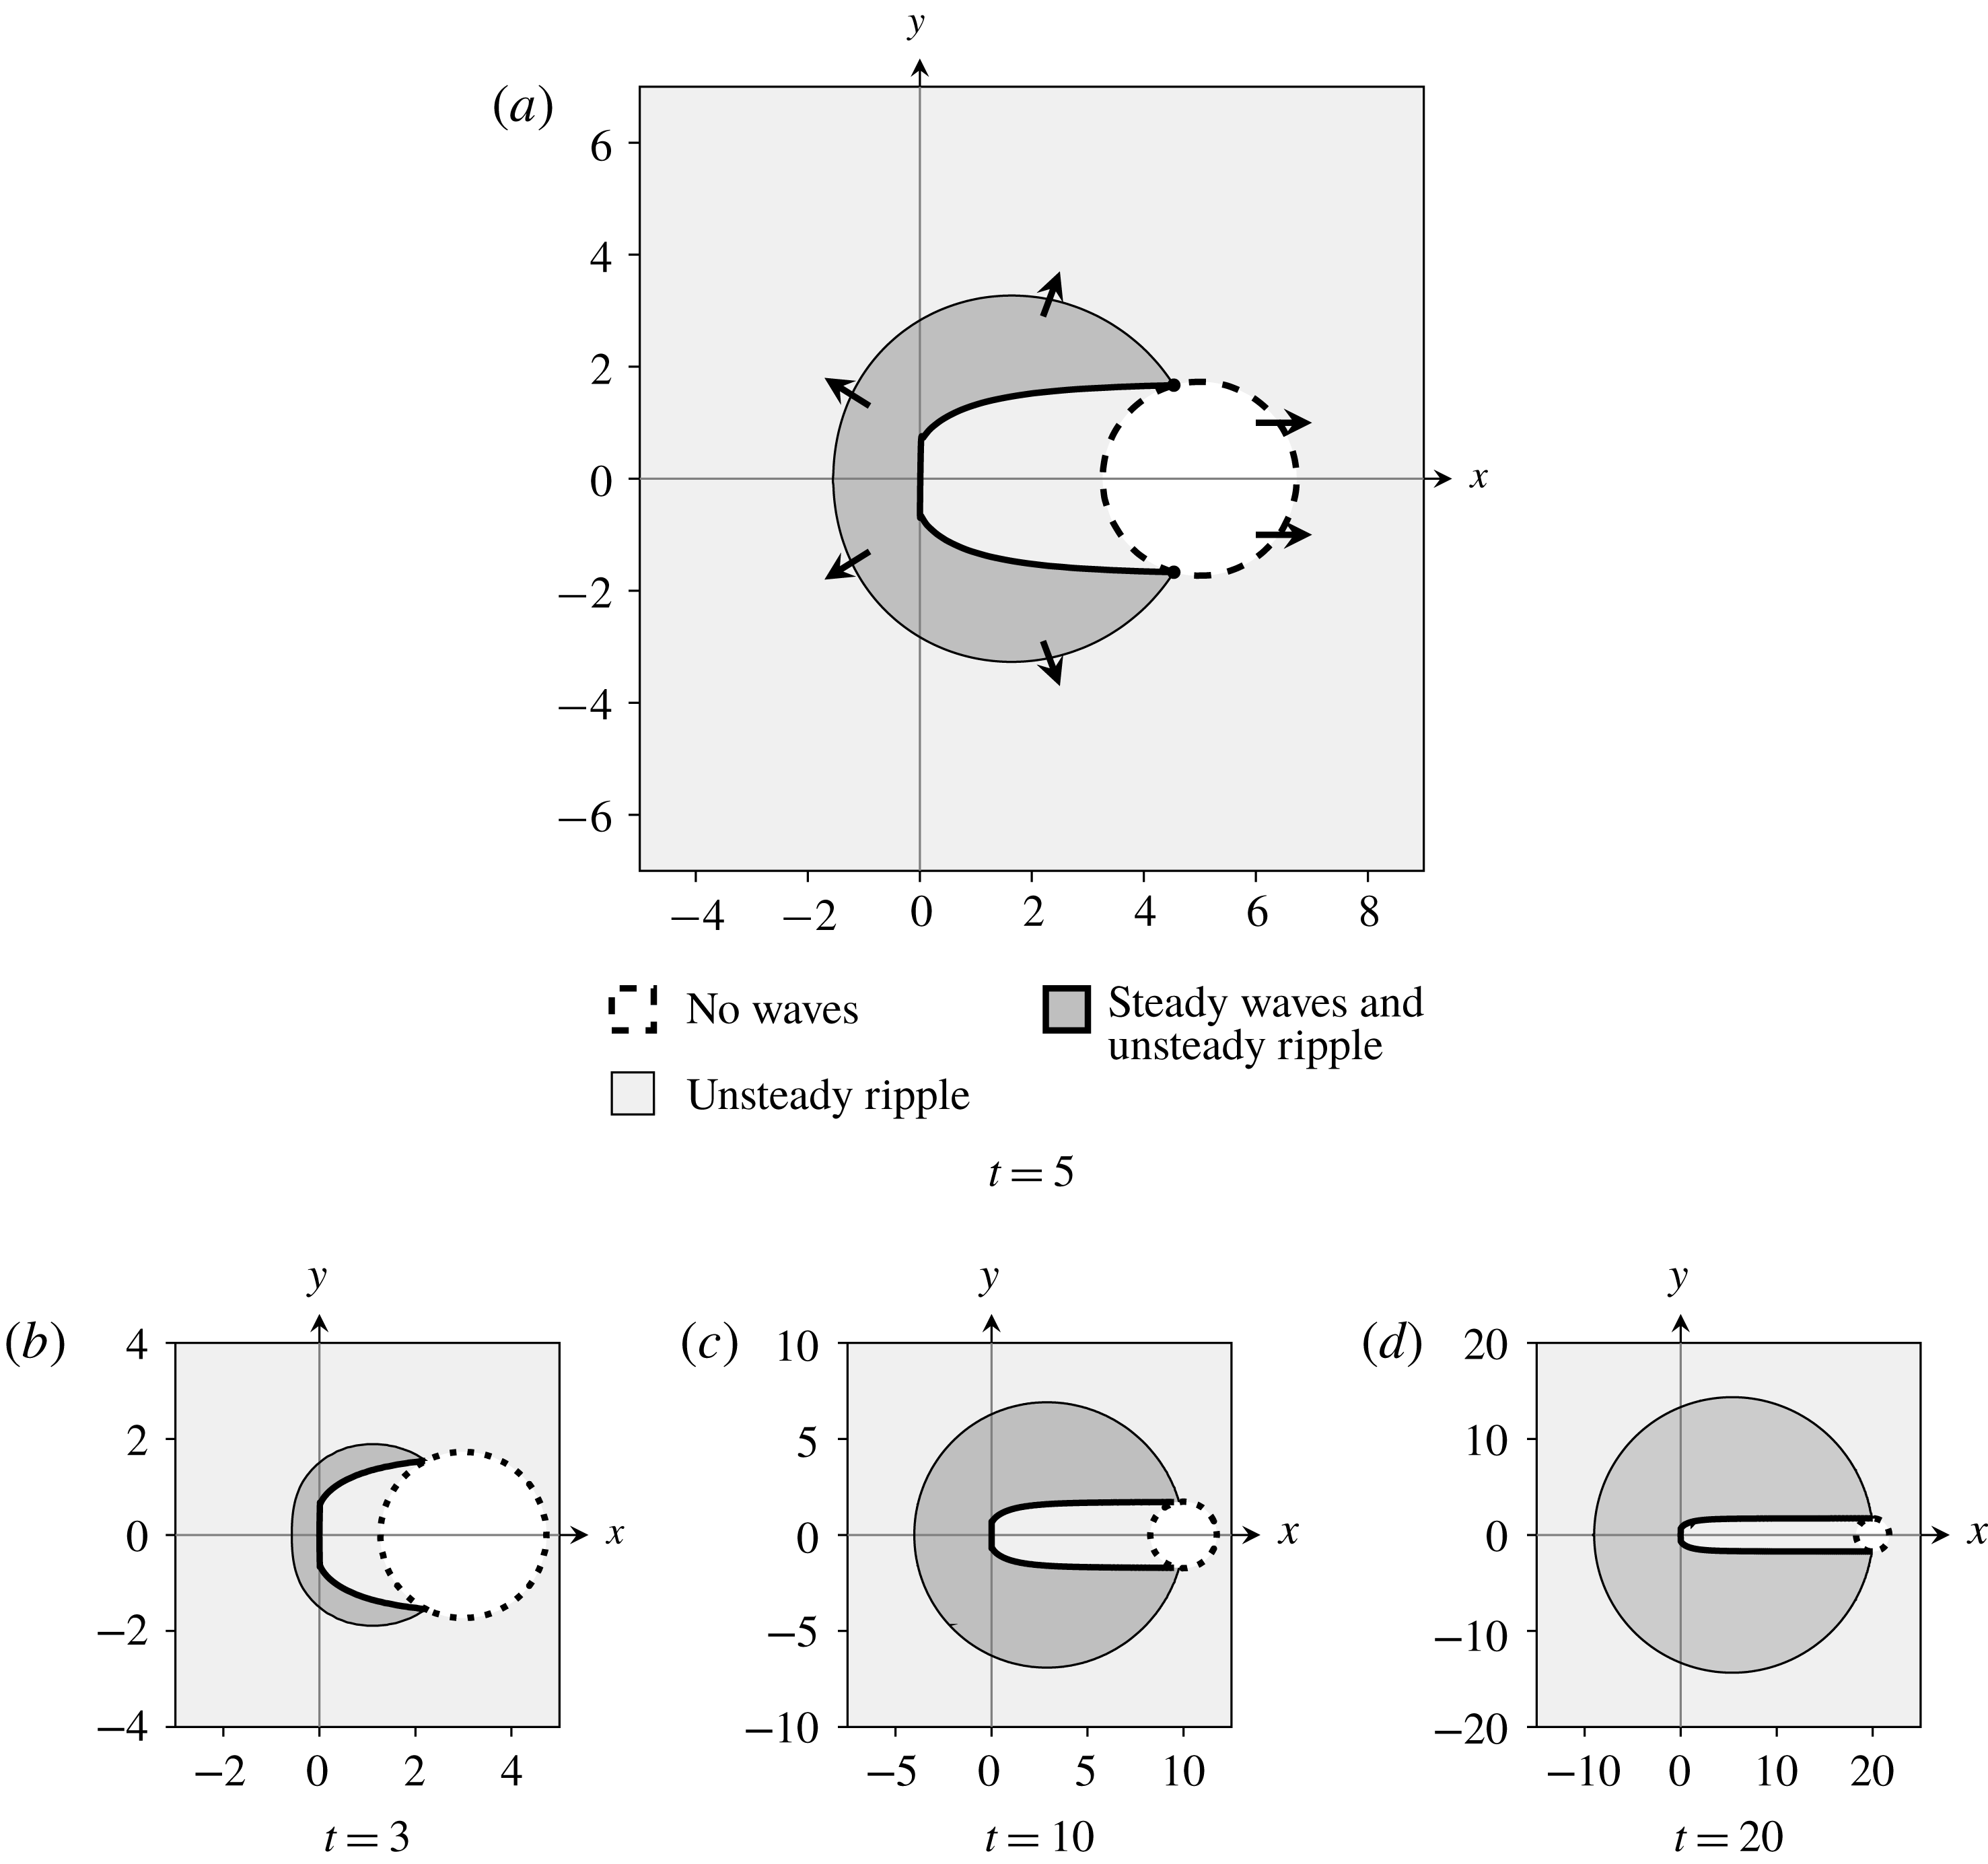
Higher-order Stokes lines contain important points known as Stokes crossing points (SCP), at which three different Stokes lines intersect. Importantly, ordinary Stokes lines can terminate at these points. For simplicity, we do not illustrate the full higher-order Stokes line in figure 7, and instead show only SCP, represented as circles. Noting that Stokes lines can terminate at Stokes crossing points, we determine that the region in which the unsteady ripple and steady waves are present are those indicated in figure 8, again for
 $h=1$
, over a range of times.
In this figure, we see that dashed curve satisfying
 $\text{Im}(\unicode[STIX]{x1D712}_{S})=\text{Im}(\unicode[STIX]{x1D712}_{U})$
does not contribute to the free-surface behaviour. This is because the steady wave contribution would exponentially dominate (and therefore switch) the unsteady ripple across this curve. However, the capillary wave contribution is switched off along the inner curve, and therefore is not present in this region, and therefore no Stokes switching occurs. We therefore find that the free-surface wave behaviour consists of an unsteady ripple present outside a circular region of growing radius, and an expanding region containing steady waves that spreads outwards from
 $(x,y)=(0,0)$
. For small values of
 $t$
, the steady wave region disappears entirely. As
 $t\rightarrow \infty$
, the radius of this expanding region becomes infinite, and the steady wave behaviour is equivalent to that obtained for the steady problem in § 2.
Regions of the free surface containing exponentially small contributions to the surface behaviour for
 $h=1$
and (a)
 $t=5$
, (b)
 $t=3$
, (c)
 $t=10$
and (d)
 $t=20$
. In the white region, no contributions are present. In the light grey region, the expanding ripple centred about
 $x=t$
is present, while in the dark grey region, both the unsteady ripple and the steady waves are present on the free surface. The arrows in (a) indicate the direction in which the Stokes lines move over time. The waveless region has constant radius of
 $\sqrt{3}h$
and is present downstream from the obstacle. The region containing steady waves tends to an expanding circular region with a narrow section removed.

By solving
 $$\begin{eqnarray}\text{Im}(\unicode[STIX]{x1D712}_{S})=\text{Im}(\unicode[STIX]{x1D712}_{U}),\end{eqnarray}$$
we can determine the position of the expanding capillary wavefront. This becomes
 $$\begin{eqnarray}x=\frac{4((t-x)^{2}-3h^{2})\sqrt{(t-x)^{2}}}{27t^{2}}.\end{eqnarray}$$
We recall that on
 $y=0$
, the singulant is given by
 $\unicode[STIX]{x1D712}_{S}=h\pm \text{i}x$
for
 $x<0$
. If we define a moving frame
 $\unicode[STIX]{x1D702}=x+t/2$
, and equate
 $\text{Im}(\unicode[STIX]{x1D712}_{S})$
with the imaginary part of the corresponding unsteady singulant from (3.15), we find that
 $$\begin{eqnarray}0=\frac{2(h^{2}-\unicode[STIX]{x1D702}^{2})}{3t}+O(t^{-2})\quad \text{as}~t\rightarrow \infty .\end{eqnarray}$$
Matching this expression at
 $O(t^{-1})$
as
 $t\rightarrow \infty$
gives the boundary of the expanding capillary wave region on
 $y=0$
as one of
 $\unicode[STIX]{x1D702}=h$
or
 $\unicode[STIX]{x1D702}=-h$
in this limit. We see from figure 7 that the active Stokes line is located at the interior of these two points, and therefore that the front position tends to
 $\unicode[STIX]{x1D702}\rightarrow h$
as
 $t\rightarrow \infty$
, or
 $$\begin{eqnarray}x\sim -t/2+h\quad \text{as}~t\rightarrow \infty .\end{eqnarray}$$
3.4 Results and comparison
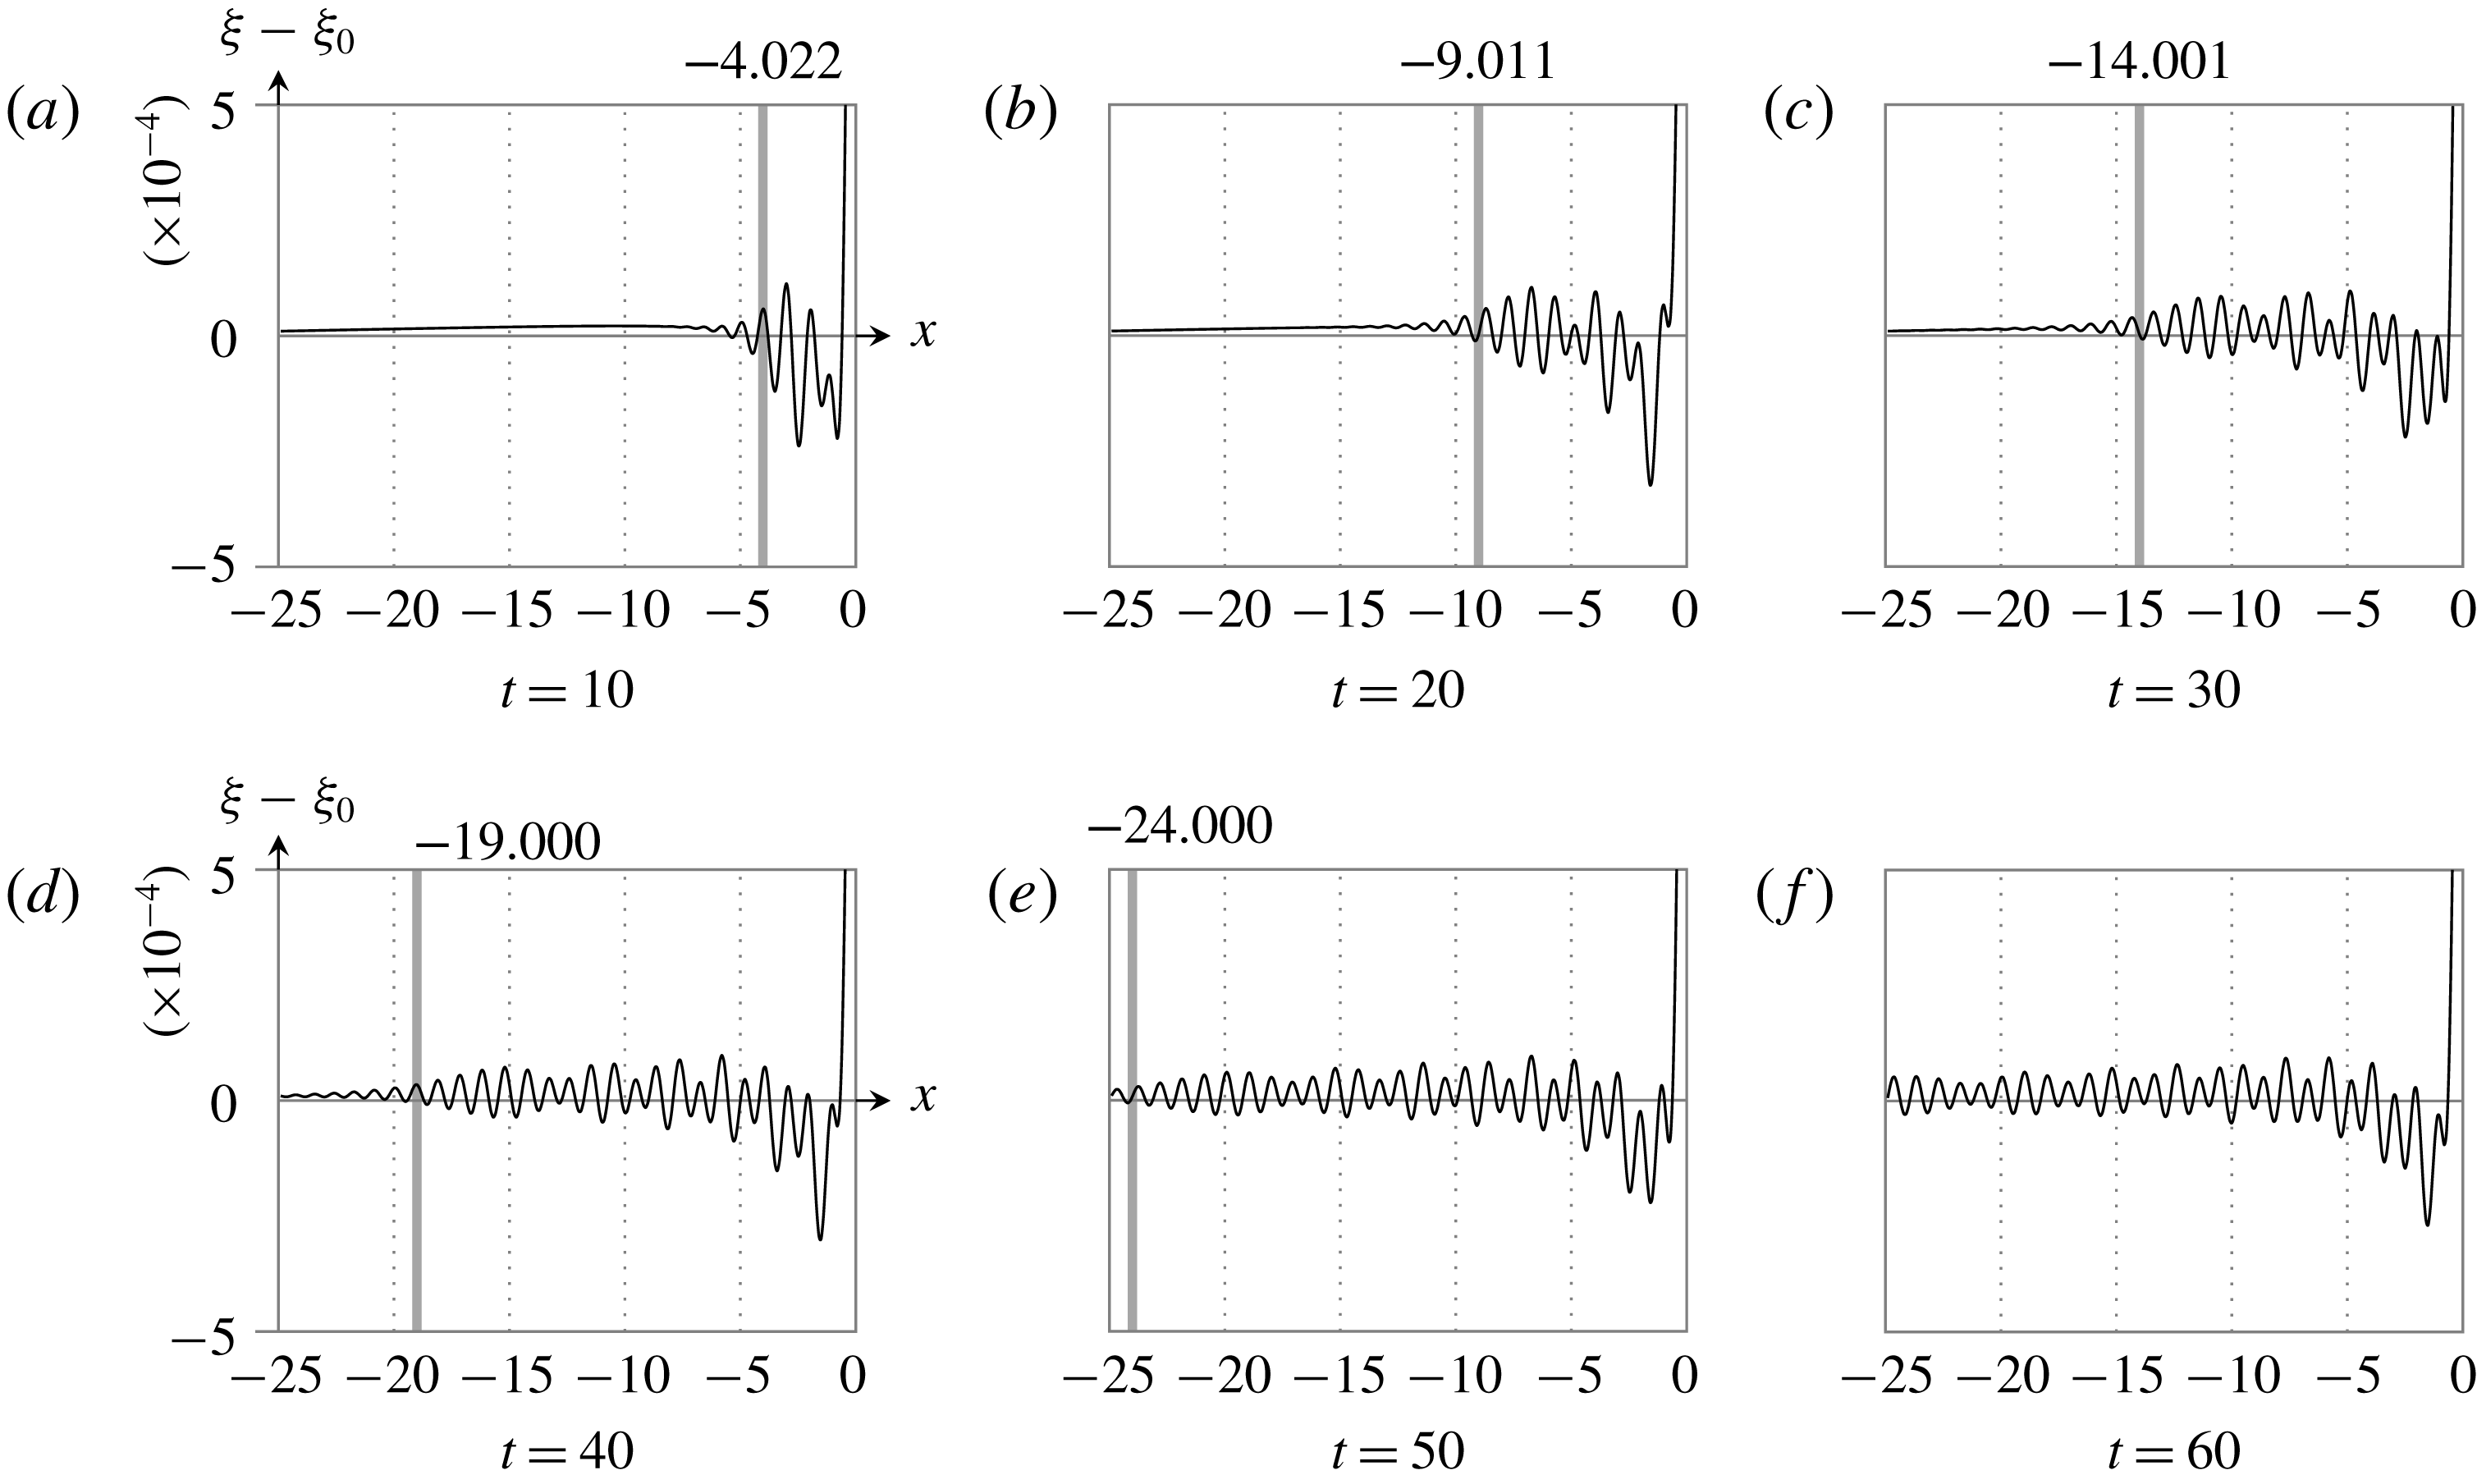
In figure 9, we compare these results to numerical computations, obtained using the numerical scheme adapted from the algorithm detailed in Lustri & Chapman (Reference Lustri and Chapman2014). In this figure we show that the expanding front matches the position obtained by solving
 $\text{Im}(\unicode[STIX]{x1D712}_{S})=\text{Im}(\unicode[STIX]{x1D712}_{U})$
exactly. In each case, we expect that the waves will switch on as the Stokes line is crossed, and consequently that the waves have half-amplitude at this point, and rapidly decay as it is crossed. This is consistent with the computed free-surface behaviour. We see that the position of the Stokes line accurately describes the boundary of the capillary wave region, and therefore the propagation of these capillary waves.
Results for
 $\unicode[STIX]{x1D716}=0.15$
at (a)
 $t=10$
, (b)
 $t=20$
, (c)
 $t=30$
, (d)
 $t=40$
, (e)
 $t=50$
and (f)
 $t=60$
. The
 $x$
position of the Stokes line is marked by a vertical grey stripe. This is where waves should be half-amplitude, decaying exponentially as this line is crossed. The axes are only shown on the first figure of each row, but are identical for each figure.

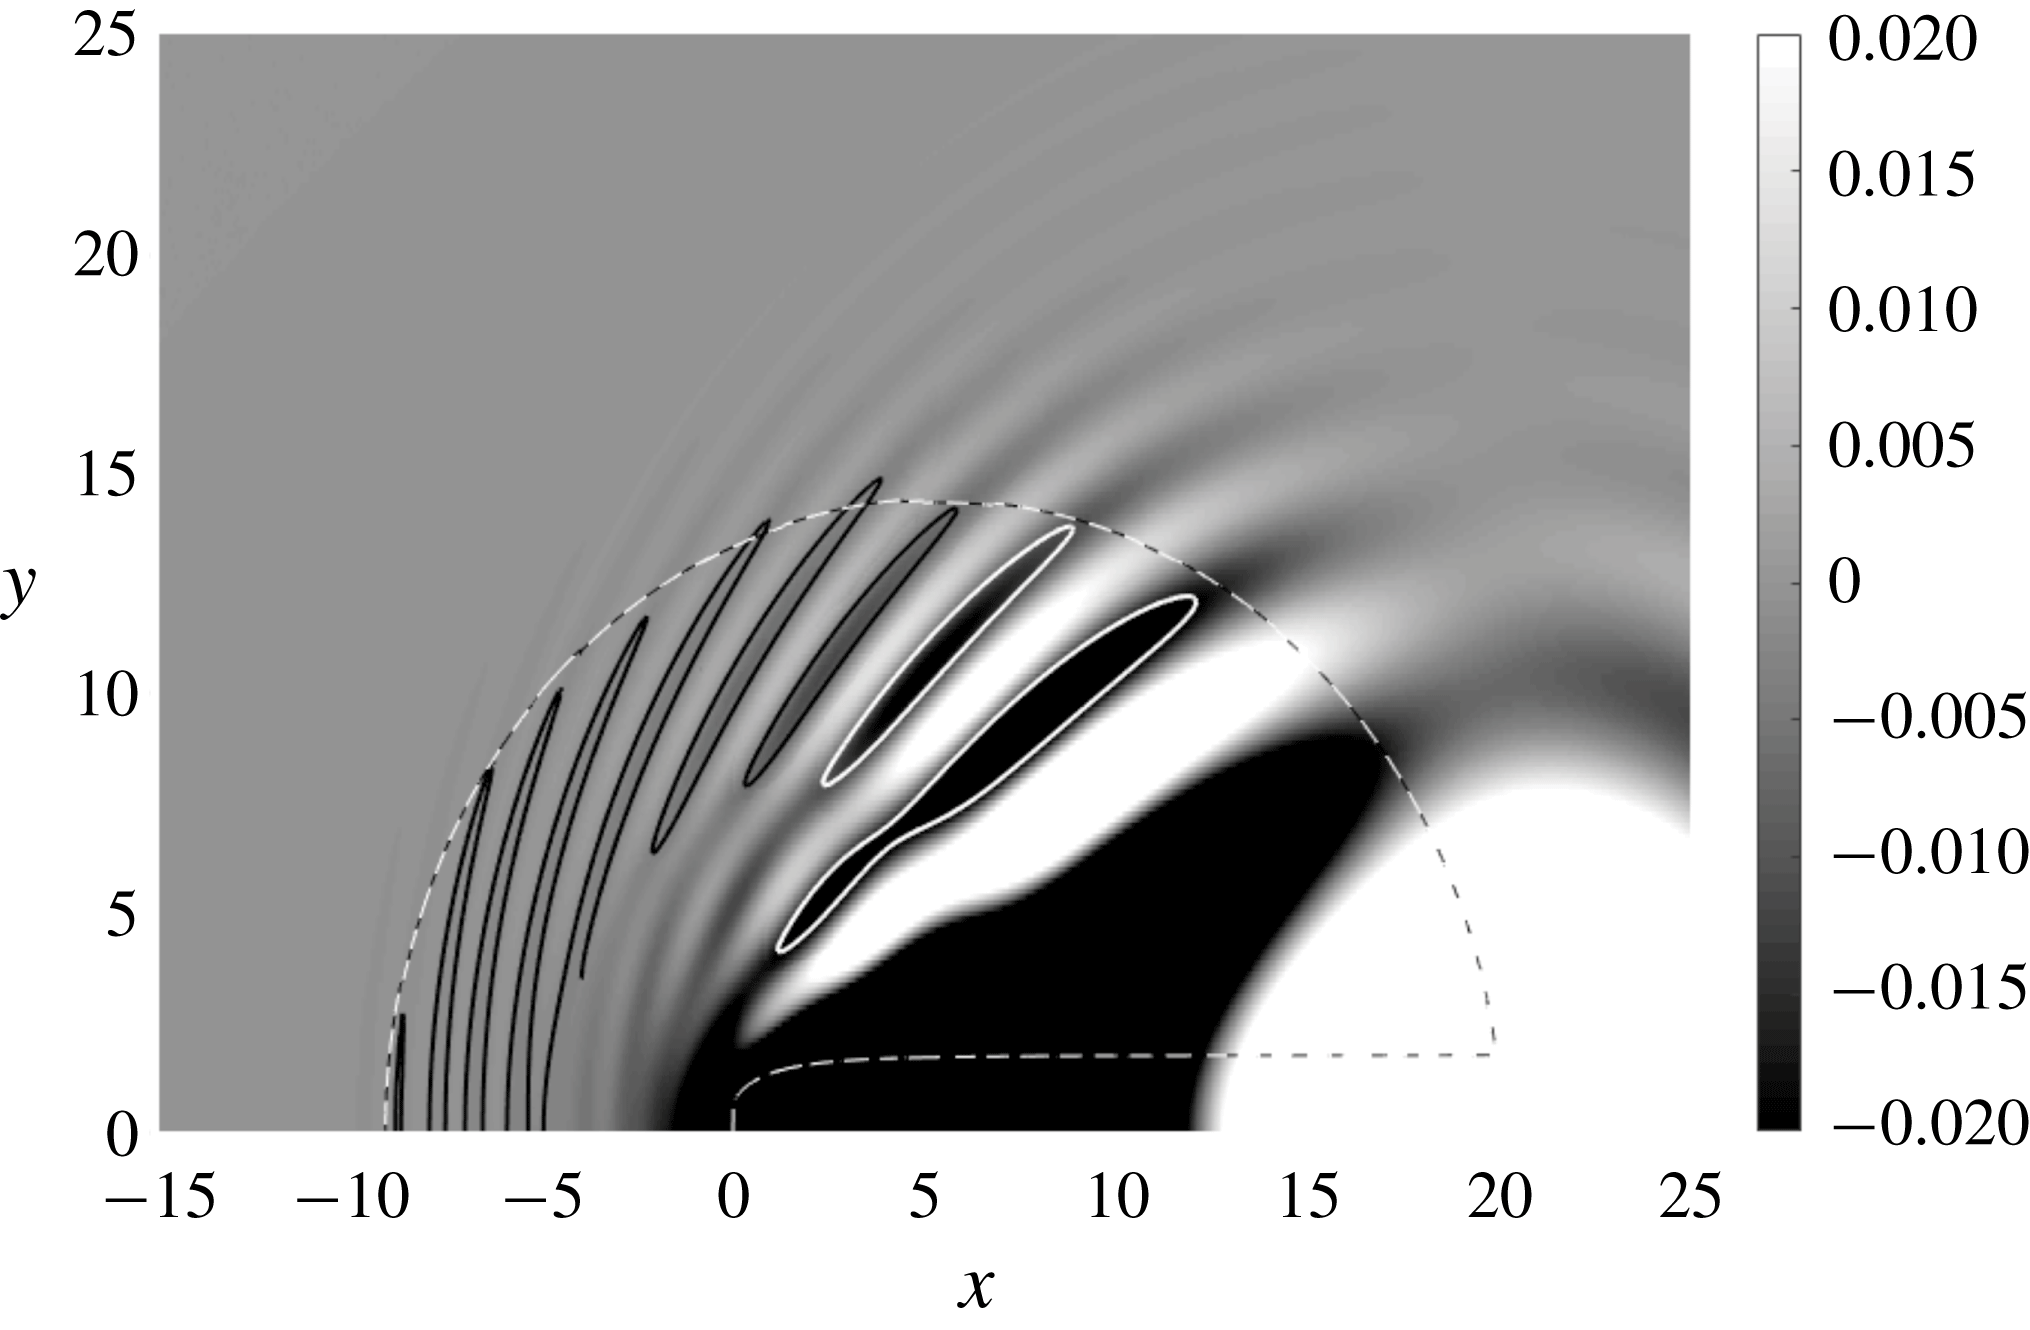
Modified free surface at
 $t=20$
, with
 $\unicode[STIX]{x1D716}=0.15$
, obtained numerically. The dashed curve illustrates the Stokes curve. The black and white solid curves denote the point at which each wave takes half of the maximum wave amplitude for that particular wave trough. It can be seen that each of the indicated troughs reduces to half amplitude approximately as the Stokes line is crossed. There is some visible wave behaviour outside this region, due to the fact that Stokes switching behaviour is smooth for finite
 $\unicode[STIX]{x1D716}$
.

Finally, in figure 10, we show the full computed two-dimensional system for
 $t=20$
and
 $\unicode[STIX]{x1D716}=0.15$
, with the position of the Stokes line overlaid. We see that the capillary waves are clearly switched on in the interior of the predicted Stokes line, decaying to half of the maximum wave amplitude at the Stokes line, and rapidly decaying away as the Stokes line is crossed into the exterior region.
4 Discussion and conclusions
4.1 Conclusions
In this investigation, we calculated the behaviour of steady and unsteady capillary waves on the free surface of flow over a point source in three dimensions in the low-surface-tension limit. We considered the source to be weak, and therefore linearised the problem about the undisturbed solution. In the analysis of the unsteady capillary wave problem, the flow was initially set to be waveless.
We subsequently applied exponential asymptotic techniques in order to determine the behaviour of the resultant capillary waves. By analysing the Stokes switching behaviour present in the solution to the problem, we were able to determine the form of the waves on the free surface. Examples of this behaviour are illustrated in figure 2 for the steady flow problem, and figure 5 for the unsteady flow problem. We note that the steady wave behaviour seen in figure 2, with the behaviour illustrated in figure 3(a) is qualitatively similar to the flow induced by a whirligig beetle in figure 2 of Tucker (Reference Tucker1969).
In the steady case, the far-field amplitude of these capillary waves was compared to numerical solutions to the linearised equations in figure 4. The numerical results were obtained by formulating the solution to the linearised system as an integral equation using methods similar to those given in Lustri & Chapman (Reference Lustri and Chapman2013), and evaluating the integral numerically. The comparison showed agreement between the asymptotic and numerical wave amplitudes.
We then considered the behaviour of unsteady capillary waves, in order to determine how these waves propagate over time. We found that there is a transient component of the surface behaviour generated by the initial disturbance. This transient surface behaviour switched on capillary waves across a second-generation Stokes line, which moves in space as
 $t$
increases. We also determined the location of higher-order Stokes phenomenon, which determined locations at which Stokes curves terminate; this was required in order to complete the Stokes structure of the unsteady problem, illustrated in figure 7. This analysis showed that the steady capillary waves are restricted to a circular region of increasing size, with the downstream region removed.
Finally, we compared the position of the spreading wavefront predicted by the asymptotics with numerical solutions to the unsteady problem. The numerical solutions were obtained by formulating an integral expression for the surface behaviour in a similar fashion to Lustri & Chapman (Reference Lustri and Chapman2014) and computing the solution to the integrals. The results are seen in figures 9 and 10, and show agreement between the asymptotic and numerical results.
The natural next step in this investigation is to study the Stokes structure that appears in systems in which both gravity and capillary waves play an important role. Following the work of Trinh & Chapman (Reference Trinh and Chapman2013a ,Reference Trinh and Chapman b ), we expect that the behaviour of surface waves in these systems requires determining not only the individual gravity and capillary wave contributions, but also the higher-order and second-generation Stokes interactions within the system. A brief analysis of the combined gravity–capillary wave problem is included in appendix C, in which the singulant equation is obtained; however, solving this singulant equation is a challenging numerical problem that is beyond the scope of this study.
Appendix A. Finding the prefactor
A.1 Prefactor equation
In order to solve the prefactor equation (2.21), we will express the equation on the free surface entirely in terms of
 $x$
and
 $y$
derivatives. This will result in an equation that has the exact same ray structure as the singulant equation (2.27), and hence the solution may be obtained in terms of the same characteristic variables. To accomplish this, we must eliminate the
 $z$
derivatives from all relevant quantities. Equations (2.25) and (2.36) give appropriate expressions for
 $\unicode[STIX]{x1D712}_{z}$
and
 $\unicode[STIX]{x1D6F7}_{z}$
respectively, however we must still consider the second derivative terms that will appear in the equation.
Taking derivatives of (2.25) and rearranging gives
 $$\begin{eqnarray}\displaystyle & \displaystyle \unicode[STIX]{x1D712}_{xz}=-\frac{2\unicode[STIX]{x1D712}_{x}\unicode[STIX]{x1D712}_{xx}}{\unicode[STIX]{x1D712}_{x}^{2}+\unicode[STIX]{x1D712}_{y}^{2}}+\frac{2\unicode[STIX]{x1D712}_{x}^{2}(\unicode[STIX]{x1D712}_{x}\unicode[STIX]{x1D712}_{xx}+\unicode[STIX]{x1D712}_{y}\unicode[STIX]{x1D712}_{xy})}{(\unicode[STIX]{x1D712}_{x}^{2}+\unicode[STIX]{x1D712}_{y}^{2})^{2}}, & \displaystyle\end{eqnarray}$$
 $$\begin{eqnarray}\displaystyle & \displaystyle \unicode[STIX]{x1D712}_{yz}=-\frac{2\unicode[STIX]{x1D712}_{x}\unicode[STIX]{x1D712}_{xy}}{\unicode[STIX]{x1D712}_{x}^{2}+\unicode[STIX]{x1D712}_{y}^{2}}+\frac{2\unicode[STIX]{x1D712}_{x}^{2}(\unicode[STIX]{x1D712}_{x}\unicode[STIX]{x1D712}_{xy}+\unicode[STIX]{x1D712}_{y}\unicode[STIX]{x1D712}_{yy})}{(\unicode[STIX]{x1D712}_{x}^{2}+\unicode[STIX]{x1D712}_{y}^{2})^{2}}, & \displaystyle\end{eqnarray}$$
 $$\begin{eqnarray}\displaystyle & \displaystyle \unicode[STIX]{x1D712}_{zz}=\frac{4\unicode[STIX]{x1D712}_{x}^{2}\unicode[STIX]{x1D712}_{y}^{2}(\unicode[STIX]{x1D712}_{xx}\unicode[STIX]{x1D712}_{y}^{2}-2\unicode[STIX]{x1D712}_{x}\unicode[STIX]{x1D712}_{y}\unicode[STIX]{x1D712}_{xy}+\unicode[STIX]{x1D712}_{x}^{2}\unicode[STIX]{x1D712}_{yy})}{(\unicode[STIX]{x1D712}_{x}^{2}+\unicode[STIX]{x1D712}_{y}^{2})^{4}}. & \displaystyle\end{eqnarray}$$
Using (A 1)–(A 3), as well as (2.25), (2.26) and (2.36) we are finally able to write the prefactor equation (2.21) in terms of
 $x$
and
 $y$
derivatives on
 $z=0$
as
 $$\begin{eqnarray}[4\unicode[STIX]{x1D712}_{x}^{3}+6\unicode[STIX]{x1D712}_{x}(\unicode[STIX]{x1D712}_{x}^{2}+\unicode[STIX]{x1D712}_{y}^{2})]\unicode[STIX]{x1D6F7}_{x}+[6\unicode[STIX]{x1D712}_{y}(\unicode[STIX]{x1D712}_{x}^{2}+\unicode[STIX]{x1D712}_{y}^{2})]\unicode[STIX]{x1D6F7}_{y}=G(x,y)\unicode[STIX]{x1D6F7},\end{eqnarray}$$
where
 $$\begin{eqnarray}\displaystyle G(x,y) & = & \displaystyle \left[\frac{6\unicode[STIX]{x1D712}_{x}^{2}\unicode[STIX]{x1D712}_{y}^{2}(\unicode[STIX]{x1D712}_{x}^{2}-\unicode[STIX]{x1D712}_{y}^{2})}{(\unicode[STIX]{x1D712}_{x}^{2}+\unicode[STIX]{x1D712}_{y}^{2})^{2}}-(\unicode[STIX]{x1D712}_{x}^{2}+\unicode[STIX]{x1D712}_{y}^{2})^{2}\right]\unicode[STIX]{x1D712}_{xx}\nonumber\\ \displaystyle & & \displaystyle +\left[\frac{8\unicode[STIX]{x1D712}_{x}^{3}\unicode[STIX]{x1D712}_{y}(\unicode[STIX]{x1D712}_{x}^{2}-2\unicode[STIX]{x1D712}_{y}^{2})}{(\unicode[STIX]{x1D712}_{x}^{2}+\unicode[STIX]{x1D712}_{y}^{2})^{2}}\right]\unicode[STIX]{x1D712}_{xy}+\left[\frac{2\unicode[STIX]{x1D712}_{x}^{4}(\unicode[STIX]{x1D712}_{x}^{2}-5\unicode[STIX]{x1D712}_{y}^{2})}{(\unicode[STIX]{x1D712}_{x}^{2}+\unicode[STIX]{x1D712}_{y}^{2})^{2}}-(\unicode[STIX]{x1D712}_{x}^{2}+\unicode[STIX]{x1D712}_{y}^{2})^{2}\right]\unicode[STIX]{x1D712}_{yy}.\qquad\end{eqnarray}$$
This equation may be solved using the method of characteristics, giving the ray equations (with characteristic variable
 $u$
) as
 $$\begin{eqnarray}\frac{\text{d}x}{\text{d}u}=4\unicode[STIX]{x1D712}_{x}^{3}+6\unicode[STIX]{x1D712}_{x}(\unicode[STIX]{x1D712}_{x}^{2}+\unicode[STIX]{x1D712}_{y}^{2})^{2},\quad \frac{\text{d}y}{\text{d}u}=6\unicode[STIX]{x1D712}_{y}(\unicode[STIX]{x1D712}_{x}^{2}+\unicode[STIX]{x1D712}_{y}^{2})^{2},\quad \frac{\text{d}\unicode[STIX]{x1D6F7}}{\text{d}u}=G(x,y)\unicode[STIX]{x1D6F7}.\end{eqnarray}$$
The first two of these equations govern the ray paths, and importantly, are identical to the ray equations associated with (2.27). This allows (A 6) to be written in terms of the associated Charpit variables, and solved to give
 $$\begin{eqnarray}\displaystyle \unicode[STIX]{x1D6F7}(s,u) & = & \displaystyle \unicode[STIX]{x1D6F7}(s,0)\nonumber\\ \displaystyle & & \displaystyle \times \left[1+\frac{6s^{6}u(4s^{4}+6s^{2}h^{2}-3h^{4})}{h^{7}(2s^{4}+3h^{4})}\right]^{s^{2}(24s^{8}+34s^{6}h^{2}+36s^{4}h^{4}+35h^{6}s^{2}+14h^{8})/6h^{6}(3h^{4}-6s^{2}h^{2}-4s^{4})}\!,\nonumber\\ \displaystyle & & \displaystyle\end{eqnarray}$$
where the characteristic variable
 $u$
is given by
 $$\begin{eqnarray}u=-\frac{h^{11}(s-x)}{2s^{9}(3s^{2}+2)}.\end{eqnarray}$$
Selecting the corresponding expression for
 $s$
in terms of
 $x$
and
 $y$
from (2.31) gives the solution in terms of the physical coordinates
 $x$
and
 $y$
. To find an expression for
 $\unicode[STIX]{x1D6F7}(s,0)$
, the behaviour of the system in the neighbourhood of
 $u=0$
must be computed and matched to this outer solution.
A.2 Inner problem
To solve the inner problem, we first consider the behaviour of
 $\unicode[STIX]{x1D712}_{L1}$
near the singularity at
 $x^{2}+y^{2}+(z+h)^{2}=0$
, which takes the form
 $$\begin{eqnarray}\unicode[STIX]{x1D712}_{L1}\sim \frac{x^{2}}{2h^{3}}(x^{2}+y^{2}+(z+h)^{2}).\end{eqnarray}$$
In the prefactor equation (2.37), we see that the unknown coefficient is a function of
 $s$
. From (2.29), it follows that
 $s\sim x$
near the singularity at
 $t=0$
. Hence, we define a system of inner coordinates given by
 $$\begin{eqnarray}\unicode[STIX]{x1D716}\unicode[STIX]{x1D70E}_{1}=\frac{x^{2}}{2h^{3}}(x^{2}+y^{2}+(z+h)^{2}),\quad \unicode[STIX]{x1D716}\unicode[STIX]{x1D70E}_{2}=\frac{x^{2}}{2h^{3}}(x^{2}+y^{2}+(z-h)^{2}),\quad \unicode[STIX]{x1D706}=x.\end{eqnarray}$$
To leading order in
 $\unicode[STIX]{x1D716}$
, the linearised governing equation (2.7) becomes (omitting the bars)
 $$\begin{eqnarray}3\unicode[STIX]{x1D70E}_{1}\unicode[STIX]{x1D719}_{\unicode[STIX]{x1D70E}_{1}\unicode[STIX]{x1D70E}_{1}}+3\unicode[STIX]{x1D70E}_{2}\unicode[STIX]{x1D719}_{\unicode[STIX]{x1D70E}_{2}\unicode[STIX]{x1D70E}_{2}}+\unicode[STIX]{x1D706}\unicode[STIX]{x1D719}_{\unicode[STIX]{x1D706}\unicode[STIX]{x1D70E}_{2}}+\unicode[STIX]{x1D706}\unicode[STIX]{x1D719}_{\unicode[STIX]{x1D706}\unicode[STIX]{x1D70E}_{1}}=0,\end{eqnarray}$$
where terms containing derivatives with respect to both
 $\unicode[STIX]{x1D70E}_{1}$
and
 $\unicode[STIX]{x1D70E}_{2}$
were disregarded due to the form of the inner expansion, (A 15). Similarly, the boundary conditions (2.8)–(2.9) become
 $$\begin{eqnarray}\displaystyle & h\unicode[STIX]{x1D719}_{\unicode[STIX]{x1D70E}_{1}}-h\unicode[STIX]{x1D719}_{\unicode[STIX]{x1D70E}_{2}}-\unicode[STIX]{x1D706}\unicode[STIX]{x1D709}_{\unicode[STIX]{x1D70E}_{1}}-\unicode[STIX]{x1D706}\unicode[STIX]{x1D709}_{\unicode[STIX]{x1D70E}_{2}}=0\quad \text{on}~\unicode[STIX]{x1D70E}_{1}=\unicode[STIX]{x1D70E}_{2}, & \displaystyle\end{eqnarray}$$
 $$\begin{eqnarray}\displaystyle & h\unicode[STIX]{x1D719}_{\unicode[STIX]{x1D70E}_{1}}+h\unicode[STIX]{x1D719}_{\unicode[STIX]{x1D70E}_{2}}-\unicode[STIX]{x1D706}\unicode[STIX]{x1D709}_{\unicode[STIX]{x1D70E}_{1}\unicode[STIX]{x1D70E}_{1}}-\unicode[STIX]{x1D706}\unicode[STIX]{x1D709}_{\unicode[STIX]{x1D70E}_{2}\unicode[STIX]{x1D70E}_{2}}=0\quad \text{on}~\unicode[STIX]{x1D70E}_{1}=\unicode[STIX]{x1D70E}_{2}. & \displaystyle\end{eqnarray}$$
Finally, by expressing the leading-order behaviour (2.16) in terms of the local variables, we find that
 $$\begin{eqnarray}\unicode[STIX]{x1D719}^{(0)}\sim \frac{\unicode[STIX]{x1D706}\sqrt{2}}{8\unicode[STIX]{x03C0}h^{3/2}\unicode[STIX]{x1D716}^{1/2}\unicode[STIX]{x1D70E}_{1}^{1/2}}-\frac{\unicode[STIX]{x1D706}\sqrt{2}}{8\unicode[STIX]{x03C0}h^{3/2}\unicode[STIX]{x1D716}^{1/2}\unicode[STIX]{x1D70E}_{2}^{1/2}}.\end{eqnarray}$$
We now define the series expansion near the singularity on the complexified free surface as
 $$\begin{eqnarray}\unicode[STIX]{x1D719}\sim \mathop{\sum }_{n=0}^{\infty }\left[\frac{a_{n}(\unicode[STIX]{x1D706})\unicode[STIX]{x1D6E4}(n+1/2)}{\unicode[STIX]{x1D70E}_{1}^{n+1/2}}+\frac{b_{n}(\unicode[STIX]{x1D706})\unicode[STIX]{x1D6E4}(n+1/2)}{\unicode[STIX]{x1D70E}_{2}^{n+1/2}}\right],\quad \unicode[STIX]{x1D709}\sim \mathop{\sum }_{n=0}^{\infty }\left[\frac{2c_{n}(\unicode[STIX]{x1D706})\unicode[STIX]{x1D6E4}(n+1/2)}{\unicode[STIX]{x1D70E}_{1}^{n+1/2}}\right],\end{eqnarray}$$
where the latter expression is only valid on the free surface itself, on which
 $\unicode[STIX]{x1D70E}_{1}=\unicode[STIX]{x1D70E}_{2}$
. The factor of two is included for subsequent algebraic convenience, and has no effect on the solution to the problem as
 $c_{n}$
is unknown at this stage. From (A 14), we have
 $$\begin{eqnarray}a_{0}(\unicode[STIX]{x1D706})=\frac{\unicode[STIX]{x1D706}\sqrt{2}}{8\unicode[STIX]{x03C0}h^{3/2}},\quad b_{0}(\unicode[STIX]{x1D706})=-\frac{\unicode[STIX]{x1D706}\sqrt{2}}{8\unicode[STIX]{x03C0}h^{3/2}}.\end{eqnarray}$$
We are interested in the behaviour of the terms on the complexified free surface in the neighbourhood of the singularity at
 $x^{2}+y^{2}+h^{2}=0$
. Consequently, we apply the series expression to (A 12) on the surface (defined by
 $\unicode[STIX]{x1D70E}_{1}=\unicode[STIX]{x1D70E}_{2}$
) and match in the limit that
 $\unicode[STIX]{x1D70E}_{1}$
(and therefore
 $\unicode[STIX]{x1D70E}_{2}$
) tend to zero, giving
 $$\begin{eqnarray}-h(a_{n}-b_{n})-2\unicode[STIX]{x1D706}c_{n}=0,\quad n\geqslant 0.\end{eqnarray}$$
Applying the series expansion to (A 13) and matching in the same limit gives
 $$\begin{eqnarray}-h(n+3/2)(a_{n}+b_{n})+2c_{n+1}=0,\quad n\geqslant 0.\end{eqnarray}$$
We are interested in the behaviour on the complexified free surface; however, restricting the domain in this fashion means that it is impossible to distinguish between the contributions from the series in
 $\unicode[STIX]{x1D70E}_{1}$
and the series in
 $\unicode[STIX]{x1D70E}_{2}$
. However, we see that the two contributions have equal magnitude in (A 14). As the singular behaviour of the problem is preserved in all higher orders (Dingle Reference Dingle1973), we conclude that this must be true of the contributions at all subsequent orders. We therefore specify that
 $|a_{n}|=|b_{n}|$
in order to maintain consistency with the leading-order behaviour. This may only be accomplished if we divide the two equations given in (A 17)–(A 18) into four equations such that
 $$\begin{eqnarray}\left.\begin{array}{@{}rl@{}}-ha_{n}-\unicode[STIX]{x1D706}c_{n}=0, & -h(n+1/2)a_{n}+\unicode[STIX]{x1D706}c_{n+1}=0,\\ hb_{n}-\unicode[STIX]{x1D706}c_{n}=0, & -h(n+1/2)b_{n}+\unicode[STIX]{x1D706}c_{n+1}=0.\end{array}\right\}\end{eqnarray}$$
We will consider only the first two of these equations, noting that the remaining equations imply that
 $b_{n}=(-1)^{n}a_{n}$
. Eliminating
 $c_{n}$
from this system gives
 $$\begin{eqnarray}a_{n+1}=(n+1/2)a_{n}=\frac{a_{0}\unicode[STIX]{x1D6E4}(n+1/2)}{\unicode[STIX]{x1D6E4}(1/2)}.\end{eqnarray}$$
Hence, using the expression for
 $a_{0}$
given in (A 16), we may match the local series expression given in (A 15) with the prefactor given in (2.37). Noting that
 $\unicode[STIX]{x1D706}$
is the local expression for
 $s$
in the outer solution, and that
 $\unicode[STIX]{x1D6F7}(s,0)$
in the outer coordinates matches with
 $a_{n}(\unicode[STIX]{x1D706})+b_{n}(\unicode[STIX]{x1D706})$
in the inner coordinates, we find that
 $$\begin{eqnarray}\unicode[STIX]{x1D6F7}(s,0)=\frac{s\sqrt{2}}{4\unicode[STIX]{x03C0}^{3/2}h^{3/2}}.\end{eqnarray}$$
Hence, we are able to completely describe the late-order behaviour of terms in (2.11), with the complete expression given in (2.37).
Appendix B. Stokes smoothing
The asymptotic series given in (2.11) may be truncated to give
 $$\begin{eqnarray}\overline{\unicode[STIX]{x1D719}}=\mathop{\sum }_{n=0}^{N-1}\unicode[STIX]{x1D716}^{n}\unicode[STIX]{x1D719}^{(n)}+R^{(N)},\quad \overline{\unicode[STIX]{x1D709}}=\mathop{\sum }_{n=0}^{N-1}\unicode[STIX]{x1D716}^{n}\unicode[STIX]{x1D709}^{(n)}+S^{(N)},\end{eqnarray}$$
where
 $N$
will be chosen in order to minimise the remainders
 $R^{(N)}$
and
 $S^{(N)}$
. Applying this series expression to (2.7) gives
 $$\begin{eqnarray}\unicode[STIX]{x1D6FB}^{2}R^{(N)}=0,\end{eqnarray}$$
while the boundary conditions (2.8)–(2.9) become on
 $z=0$
,
 $$\begin{eqnarray}\displaystyle & R_{z}^{(N)}-S_{x}^{(N)}=0, & \displaystyle\end{eqnarray}$$
 $$\begin{eqnarray}\displaystyle & R_{x}^{(N)}+\unicode[STIX]{x1D716}(S_{xx}^{(N)}+S_{yy}^{(N)})=-\unicode[STIX]{x1D716}^{N}(\unicode[STIX]{x1D709}_{xx}^{(N-1)}-\unicode[STIX]{x1D709}_{yy}^{(N-1)}), & \displaystyle\end{eqnarray}$$
having made use of the relationship in (2.14) and the fact that
 $\unicode[STIX]{x1D719}_{x}^{(0)}=0$
. The homogeneous form of (B 2)–(B 4) is satisfied as
 $\unicode[STIX]{x1D716}\rightarrow 0$
by
 $$\begin{eqnarray}R^{(N)}\sim \unicode[STIX]{x1D6F7}\text{e}^{-\unicode[STIX]{x1D712}/\unicode[STIX]{x1D716}},\quad S^{(N)}\sim \unicode[STIX]{x1D6EF}\text{e}^{-\unicode[STIX]{x1D712}/\unicode[STIX]{x1D716}},\end{eqnarray}$$
where
 $\unicode[STIX]{x1D712}$
is one of the singulants determined from (2.30)–(2.31).
We therefore set the remainder terms for the inhomogeneous problem to take the form
 $$\begin{eqnarray}R^{(N)}=A(x,y,z)\unicode[STIX]{x1D6F7}\text{e}^{-\unicode[STIX]{x1D712}/\unicode[STIX]{x1D716}},\quad S^{(N)}=B(x,y)\unicode[STIX]{x1D6EF}\text{e}^{-\unicode[STIX]{x1D712}/\unicode[STIX]{x1D716}},\end{eqnarray}$$
where
 $A$
and
 $B$
are Stokes switching parameters. From (B 3), we see that
 $A=B$
on
 $z=0$
.
To determine the late-order term behaviour, we will require the first correction term for the prefactors, and we therefore set
 $$\begin{eqnarray}\unicode[STIX]{x1D6F7}=\unicode[STIX]{x1D6F7}_{0}+\unicode[STIX]{x1D716}\unicode[STIX]{x1D6F7}_{1}+\cdots ,\quad \unicode[STIX]{x1D6EF}=\unicode[STIX]{x1D6EF}_{0}+\unicode[STIX]{x1D716}\unicode[STIX]{x1D6EF}_{1}+\cdots .\end{eqnarray}$$
Applying the remainder forms given in (B 6) to the boundary conditions, (B 3) and (B 4), gives after some rearrangement
 $$\begin{eqnarray}-A\unicode[STIX]{x1D712}_{x}\unicode[STIX]{x1D6EF}_{1}+A\unicode[STIX]{x1D712}_{z}\unicode[STIX]{x1D6F7}_{1}=A\unicode[STIX]{x1D6EF}_{0,x}+A_{x}\unicode[STIX]{x1D6EF}_{0}-A\unicode[STIX]{x1D6F7}_{0,z}-A_{z}\unicode[STIX]{x1D6F7}_{0},\qquad\end{eqnarray}$$
 $$\begin{eqnarray}\displaystyle -A\unicode[STIX]{x1D712}_{x}\unicode[STIX]{x1D6F7}_{1}+A(\unicode[STIX]{x1D712}_{x}^{2}+\unicode[STIX]{x1D712}_{y}^{2})\unicode[STIX]{x1D6EF}_{1} & = & \displaystyle 2A\unicode[STIX]{x1D712}_{x}\unicode[STIX]{x1D6EF}_{0,x}+2A\unicode[STIX]{x1D712}_{y}\unicode[STIX]{x1D6EF}_{0,y}+2A_{x}\unicode[STIX]{x1D712}_{x}\unicode[STIX]{x1D6EF}_{0}\nonumber\\ \displaystyle & & \displaystyle +\,2A_{y}\unicode[STIX]{x1D712}_{y}\unicode[STIX]{x1D6EF}_{0}+A(\unicode[STIX]{x1D712}_{xx}+\unicode[STIX]{x1D712}_{yy})\unicode[STIX]{x1D6EF}_{0}\nonumber\\ \displaystyle & & \displaystyle -\,A\unicode[STIX]{x1D6F7}_{0,x}-A_{x}\unicode[STIX]{x1D6F7}_{0}+\unicode[STIX]{x1D716}^{N}\text{e}^{\unicode[STIX]{x1D712}/\unicode[STIX]{x1D716}}(\unicode[STIX]{x1D709}_{xx}^{(N-1)}+\unicode[STIX]{x1D709}_{yy}^{(N-1)}).\qquad\end{eqnarray}$$
Combining these expressions, and making use of (2.36) to eliminate terms and (2.14) to simplify the right-hand side gives
 $$\begin{eqnarray}A_{z}\unicode[STIX]{x1D6F7}_{0}-A_{x}\unicode[STIX]{x1D6EF}_{0}+2A_{y}\unicode[STIX]{x1D712}_{y}\unicode[STIX]{x1D6EF}_{0}+2A_{x}\unicode[STIX]{x1D712}_{x}\unicode[STIX]{x1D6EF}_{0}-A_{x}\unicode[STIX]{x1D6F7}_{0}\sim -\unicode[STIX]{x1D716}^{N}\unicode[STIX]{x1D719}_{x}^{(N)}\text{e}^{\unicode[STIX]{x1D712}/\unicode[STIX]{x1D716}}.\end{eqnarray}$$
As only the leading-order prefactor behaviour appears in the final expression, we will no longer retain the subscripts. Applying the late-order ansatz gives
 $$\begin{eqnarray}A_{z}\unicode[STIX]{x1D6F7}-A_{x}\unicode[STIX]{x1D6EF}+2A_{y}\unicode[STIX]{x1D712}_{y}\unicode[STIX]{x1D6EF}+2A_{x}\unicode[STIX]{x1D712}_{x}\unicode[STIX]{x1D6EF}-A_{x}\unicode[STIX]{x1D6F7}\sim \unicode[STIX]{x1D716}^{N}\frac{\unicode[STIX]{x1D712}_{x}\unicode[STIX]{x1D6F7}\unicode[STIX]{x1D6E4}(N+3/2)}{\unicode[STIX]{x1D712}^{N+3/2}}\text{e}^{\unicode[STIX]{x1D712}/\unicode[STIX]{x1D716}}.\end{eqnarray}$$
Motivated by the homogeneous solution, we express the equation in terms of
 $\unicode[STIX]{x1D712}$
and
 $y$
, and apply (2.26) to obtain
 $$\begin{eqnarray}A_{\unicode[STIX]{x1D712}}=\unicode[STIX]{x1D716}^{N}\text{e}^{\unicode[STIX]{x1D712}/\unicode[STIX]{x1D716}}\frac{\unicode[STIX]{x1D6E4}(N+3/2)}{\unicode[STIX]{x1D712}^{N+3/2}}.\end{eqnarray}$$
The optimal truncation point is given by
 $N\sim |\unicode[STIX]{x1D712}|/\unicode[STIX]{x1D716}$
in the limit that
 $\unicode[STIX]{x1D716}\rightarrow 0$
. We write
 $\unicode[STIX]{x1D712}=r\text{e}^{\text{i}\unicode[STIX]{x1D703}}$
, with
 $r$
and
 $\unicode[STIX]{x1D703}$
real so that
 $N=r/\unicode[STIX]{x1D716}+\unicode[STIX]{x1D6FC}$
, where
 $\unicode[STIX]{x1D6FC}$
is necessary to make
 $N$
an integer. Since
 $N$
depends on
 $r$
but not
 $\unicode[STIX]{x1D703}$
, we write
 $$\begin{eqnarray}\frac{\unicode[STIX]{x2202}}{\unicode[STIX]{x2202}\unicode[STIX]{x1D712}}=-\frac{\text{i}\text{e}^{-\text{i}\unicode[STIX]{x1D703}}}{r}\frac{\unicode[STIX]{x2202}}{\unicode[STIX]{x2202}\unicode[STIX]{x1D703}}.\end{eqnarray}$$
Using Stirling’s formula on the resultant expression gives
 $$\begin{eqnarray}A_{\unicode[STIX]{x1D703}}\sim \frac{\text{i}\sqrt{2\unicode[STIX]{x03C0}r}}{\unicode[STIX]{x1D716}}\exp \left(\frac{r}{\unicode[STIX]{x1D716}}(\text{e}^{\text{i}\unicode[STIX]{x1D703}}-1)-\text{i}\unicode[STIX]{x1D703}\left(\frac{r}{\unicode[STIX]{x1D716}}+\unicode[STIX]{x1D6FC}-\frac{1}{2}\right)\right).\end{eqnarray}$$
This variation is exponentially small, except in the neighbourhood of the Stokes line, given by
 $\unicode[STIX]{x1D703}=0$
, where it is algebraically large To investigate the rapid change in
 $A$
in the vicinity of the Stokes line, we set
 $\unicode[STIX]{x1D703}=\unicode[STIX]{x1D716}^{1/2}\hat{\unicode[STIX]{x1D703}}$
, giving
 $$\begin{eqnarray}A_{\hat{\unicode[STIX]{x1D703}}}\sim \text{i}\sqrt{\frac{2\unicode[STIX]{x03C0}r}{\unicode[STIX]{x1D716}}}\text{e}^{-r\hat{\unicode[STIX]{x1D703}}^{2}/2},\end{eqnarray}$$
so that
 $$\begin{eqnarray}A\sim \text{i}\sqrt{\frac{2\unicode[STIX]{x03C0}}{\unicode[STIX]{x1D716}}}\int _{-\infty }^{\unicode[STIX]{x1D703}\sqrt{r/\unicode[STIX]{x1D716}}}\text{e}^{-t^{2}/2}\,\text{d}t+C,\end{eqnarray}$$
where
 $C$
is constant. Thus, as the Stokes line is crossed,
 $A$
rapidly increases from 0 to
 $2\unicode[STIX]{x03C0}\text{i}\unicode[STIX]{x1D716}^{-1/2}$
. Using (B 6), we find the variation in the fluid potential, and we subsequently use (B 3) to relate
 $B$
to
 $A$
, and therefore find the variation in the free-surface behaviour as the Stokes line is crossed. The Stokes line variation for the potential and free-surface position are respectively given by
 $$\begin{eqnarray}[R^{(N)}]_{-}^{+}=\frac{2\unicode[STIX]{x03C0}\text{i}\unicode[STIX]{x1D6F7}}{\sqrt{\unicode[STIX]{x1D716}}}\text{e}^{-\unicode[STIX]{x1D712}_{S}/\unicode[STIX]{x1D716}},\quad [S^{(N)}]_{-}^{+}=\frac{2\unicode[STIX]{x03C0}\text{i}\unicode[STIX]{x1D6EF}}{\sqrt{\unicode[STIX]{x1D716}}}\text{e}^{-\unicode[STIX]{x1D712}_{S}/\unicode[STIX]{x1D716}},\end{eqnarray}$$
where we have reintroduced the specific singulant form,
 $\unicode[STIX]{x1D712}_{S}$
. Hence, if we determine the prefactor and singulant behaviour associated with each contribution, (B 17) gives an expression for the behaviour switched on across the appropriate Stokes line. The combined expression for the exponentially small terms in regions where they are active is therefore given by (2.39).
Appendix C. Gravity–capillary waves
The natural sequel to this work is to combine capillary and gravity waves, in order to determine how the two wave contributions interact. It is likely that the Stokes structure will be significantly more complicated than the Stokes structure for either capillary or gravity waves alone. Previous work on the two-dimensional problem by Trinh & Chapman (Reference Trinh and Chapman2013a ,Reference Trinh and Chapman b ) shows that the interaction between Stokes lines associated with gravity and capillary waves plays an important role in the behaviour of waves on the free surface.
Including both gravity and capillary effects in the analysis requires scaling both the Weber number
 $We=\unicode[STIX]{x1D70C}LU^{2}/\unicode[STIX]{x1D70E}$
, and the Froude number
 $F=U/\sqrt{gL}$
, where, as before,
 $\unicode[STIX]{x1D70E}$
is the surface tension,
 $\unicode[STIX]{x1D70C}$
is the fluid density,
 $U$
is the background fluid velocity,
 $L$
is a representative length scale and
 $g$
is the acceleration due to gravity.
As determined by Trinh & Chapman (Reference Trinh and Chapman2013a
,Reference Trinh and Chapman
b
), we see that the scaling in which both gravity and capillary waves play an important role is given by setting
 $F^{2}=\unicode[STIX]{x1D6FD}\unicode[STIX]{x1D716}$
and
 $We^{-1}=\unicode[STIX]{x1D6FD}\unicode[STIX]{x1D70F}\unicode[STIX]{x1D716}^{2}$
as
 $\unicode[STIX]{x1D716}\rightarrow 0$
. The variables
 $\unicode[STIX]{x1D6FD}$
and
 $\unicode[STIX]{x1D70F}$
determine the relationship between the Froude and Weber number.
This gives a system that is nearly identical to (2.1)–(2.5), with the dynamic condition (2.3) now given by
 $$\begin{eqnarray}\frac{\unicode[STIX]{x1D6FD}\unicode[STIX]{x1D716}}{2}(|\unicode[STIX]{x1D735}\unicode[STIX]{x1D719}^{2}|-1)+\unicode[STIX]{x1D709}=\unicode[STIX]{x1D6FD}\unicode[STIX]{x1D70F}\unicode[STIX]{x1D716}^{2}\unicode[STIX]{x1D705}\quad \text{on}~z=\unicode[STIX]{x1D709}(x,y).\end{eqnarray}$$
After linearisation, this boundary condition becomes
 $$\begin{eqnarray}\unicode[STIX]{x1D6FD}\unicode[STIX]{x1D716}\unicode[STIX]{x1D719}_{x}+\unicode[STIX]{x1D709}=\unicode[STIX]{x1D6FD}\unicode[STIX]{x1D70F}\unicode[STIX]{x1D716}^{2}(\unicode[STIX]{x1D709}_{xx}+\unicode[STIX]{x1D709}_{yy})\quad \text{on}~z=0.\end{eqnarray}$$
Applying late-order techniques to the linearised system in a similar fashion to § 2.3 yields the singulant equation
 $$\begin{eqnarray}\unicode[STIX]{x1D6FD}^{2}\unicode[STIX]{x1D712}_{x}^{4}+(\unicode[STIX]{x1D712}_{x}^{2}+\unicode[STIX]{x1D712}_{y}^{2})[\unicode[STIX]{x1D6FD}\unicode[STIX]{x1D70F}(\unicode[STIX]{x1D712}_{x}^{2}+\unicode[STIX]{x1D712}_{y}^{2})-1]^{2}=0,\end{eqnarray}$$
with the boundary condition
 $$\begin{eqnarray}\unicode[STIX]{x1D712}=0\quad \text{on}~x^{2}+y^{2}+h^{2}=0.\end{eqnarray}$$
We see that when
 $\unicode[STIX]{x1D70F}=0$
, this system gives the gravity wave singulant from Lustri & Chapman (Reference Lustri and Chapman2013), while for
 $\unicode[STIX]{x1D70F}=1$
, the capillary wave singulant (2.27) is obtained in the limit
 $\unicode[STIX]{x1D6FD}\rightarrow \infty$
.
The Stokes surfaces can be obtained by obtaining the full set of solutions to this system, and determining the Stokes surfaces. This is a challenging problem involving complex ray tracking, as seen in Stone, Self & Howls (Reference Stone, Self and Howls2017), and is beyond the scope of the present study.