


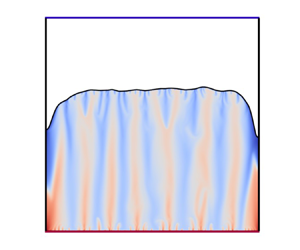



1. Introduction
The liquid–solid phase transition process, characterized by the evolution of a moving interface, is a common phenomenon in geophysics, astrophysics and various industrial applications. Notable examples include glacier melting (Hock Reference Hock2005), solidification of magma chambers (Thomas, Cassoni & MacArthur Reference Thomas, Cassoni and MacArthur1996), aircraft de-icing (Thomas et al. Reference Thomas, Cassoni and MacArthur1996), the dynamics of magma oceans (Ulvrová et al. Reference Ulvrová, Labrosse, Coltice, Råback and Tackley2012) and the melting of phase-change materials (PCMs) (Raoux Reference Raoux2009). In all these examples, gravity plays a pivotal role in influencing the liquid–solid phase transition (Li et al. Reference Li, Ma, Liu, Liu and Wang2017), primarily because buoyancy significantly affects the heat transfer dynamics that is central to the phase-change process.
In geophysical applications on Earth, where gravity is present, various numerical methods have been employed to investigate the impact of factors such as buoyancy, rotation, shear, turbulence and meltwater plumes on the morphological evolution of the liquid–solid interface (Favier, Purseed & Duchemin Reference Favier, Purseed and Duchemin2019; Couston et al. Reference Couston, Hester, Favier, Taylor, Holland and Jenkins2021; Ravichandran & Wettlaufer Reference Ravichandran and Wettlaufer2021; Wilson et al. Reference Wilson, Vreugdenhil, Gayen and Hester2023; Yang et al. Reference Yang, Howland, Liu, Verzicco and Lohse2023b). These studies have also examined the effects of aspect ratio (Hester et al. Reference Hester, McConnochie, Cenedese, Couston and Vasil2021), solid shape (Yang et al. Reference Yang, Howland, Liu, Verzicco and Lohse2024), density anomalies (Wang et al. Reference Wang, Calzavarini, Sun and Toschi2021; Yang et al. Reference Yang, Chong, Liu, Verzicco and Lohse2022) and salinity on the melting process (Du et al. Reference Du, Wang, Jiang, Calzavarini and Sun2023; Yang et al. Reference Yang, Howland, Liu, Verzicco and Lohse2023a) and the bistability property of melting (Purseed et al. Reference Purseed, Favier, Duchemin and Hester2020). Additionally, experimental studies have been conducted to uncover the underlying physics of these phenomena (Davis, Müller & Dietsche Reference Davis, Müller and Dietsche1984; FitzMaurice, Cenedese & Straneo Reference FitzMaurice, Cenedese and Straneo2017; Bushuk et al. Reference Bushuk, Holland, Stanton, Stern and Gray2019; Wang et al. Reference Wang, Calzavarini, Sun and Toschi2021).
It is worth noting that liquid–solid phase transitions also have industrial significance, particularly in latent heat energy storage devices utilizing PCMs. Previous studies have examined how the roughness of the basic morphology of PCMs affects heat transfer efficiency and thus the melting rate (Kamkari & Amlashi Reference Kamkari and Amlashi2017). Most studies have focused on the interplay between buoyancy-driven flow and the evolution of the melting interface. However, there is an increasing demand for harnessing PCMs in microgravity environments, such as in microscale devices (Glicksman, Lupulescu & Koss Reference Glicksman, Lupulescu and Koss2003; Chen et al. Reference Chen, Hao, Yao and Zhang2019) or devices used in space missions. In microgravity, due to the minimal flow occurring in the liquid zone, the melting process is predominantly driven by thermal conduction, leading to a relatively slow melting rate. For the application of PCMs in microgravity, several studies have been conducted, including enhancing effective thermal diffusivity with nano-enhanced PCMs (Hosseinizadeh, Darzi & Tan Reference Hosseinizadeh, Darzi and Tan2012; Dhaidan et al. Reference Dhaidan, Khodadadi, Al-Hattab and Al-Mashat2013), using thermocapillary-driven flow (Sánchez et al. Reference Sánchez, Ezquerro, Fernandez and Rodriguez2020a, Reference Sánchez, Ezquerro, Fernandez and Rodriguez2021; Šeta et al. Reference Šeta, Dubert, Gavalda, Massons, Bou-Ali, Ruiz and Shevtsova2023) and adjusting the positions of heat sources and sinks (Mahmud & Ahmed Reference Mahmud and Ahmed2022). In this work, we demonstrate the potential of using vibration to achieve a superior melting rate in microgravity through vibration-induced convective flow.
Vibroconvection has been shown to be a promising method for driving convective flow and enhancing heat transfer (Gershuni & Lyubimov Reference Gershuni and Lyubimov1998; Mialdun et al. Reference Mialdun, Ryzhkov, Melnikov and Shevtsova2008; Shevtsova et al. Reference Shevtsova, Ryzhkov, Melnikov, Gaponenko and Mialdun2010; Guo et al. Reference Guo, Qin, Wu, Wang, Chong and Zhou2024b; Huang et al. Reference Huang, Wu, Guo, Zhao, Wang, Chong and Zhou2024). Numerous studies have investigated the interaction between vibroconvection and buoyancy-driven convection (Wang, Zhou & Sun Reference Wang, Zhou and Sun2020; Guo et al. Reference Guo, Wang, Wu, Chong and Zhou2022; Wu et al. Reference Wu, Wang, Chong, Dong, Sun and Zhou2022a; Wu, Wang & Zhou Reference Wu, Wang and Zhou2022b), demonstrating the potential of vibration to perturb boundary layers and modulate heat flux. One crucial factor is the relative orientation of the vibrational axis and the temperature gradient (Demin, Gershuni & Verkholantsev Reference Demin, Gershuni and Verkholantsev1996; Cissé, Bardan & Mojtabi Reference Cissé, Bardan and Mojtabi2004). When the vibration direction is perpendicular to the temperature gradient, dynamic destabilization of thermal convection occurs, significantly enhancing heat transfer (Wang et al. Reference Wang, Zhou and Sun2020; Wu et al. Reference Wu, Dong, Wang and Zhou2021). In contrast, when the vibration direction is parallel to the temperature gradient, dynamic stabilization of convective flows results in the suppression of convective heat transfer (Carbo, Smith & Poese Reference Carbo, Smith and Poese2014; Wu et al. Reference Wu, Wang, Chong, Dong, Sun and Zhou2022a). Recently, works by Rahmanian et al. (Reference Rahmanian, Rahmanian-Koushkaki, Moein-Jahromi and Saidur2023) and Guo et al. (Reference Guo, Qu, Yu and Zhou2024a) applied vibration to the problem of PCMs, and their studies demonstrated that the performance of PCM thermal energy storage units can be improved by using a small oscillator plate. They validated the effectiveness and cost-efficiency of this method through numerical analysis.
In microgravity environments, there has been growing interest in studying thermal convection solely driven by vibrations. Vibrations in microgravity can be generated by structural resonances, the operation of spacecraft mechanical systems and astronaut activities. Experimental studies on vibroconvection date back to the Apollo spacecraft missions (Bannister et al. Reference Bannister, Grodzka, Spradley, Bourgeois, Hedden and Facemire1973), where vibrations were found to significantly increase heat transfer compared to pure conduction (Grodzka & Bannister Reference Grodzka and Bannister1975). Subsequent experimental study has shown that external vibrations can significantly affect thermal diffusion processes (Garrabos et al. Reference Garrabos, Beysens, Lecoutre, Dejoan, Polezhaev and Emelianov2007; Braibanti et al. Reference Braibanti2019). Shevtsova et al. (Reference Shevtsova, Ryzhkov, Melnikov, Gaponenko and Mialdun2010) conducted experiments on the flow structure and heat transfer of vibroconvection in a low-gravity environment during parabolic flights, finding that increased vibration intensity significantly enhanced heat transfer via streaming flow. More recently, Guo et al. (Reference Guo, Wu, Wang, Zhou and Chong2023) and Huang et al. (Reference Huang, Wu, Guo, Zhao, Wang, Chong and Zhou2024) revealed unified constitutive laws of heat transport and the transition of flow structure in microgravity vibroconvection. In addition, Sánchez et al. (Reference Sánchez, Yasnou, Gaponenko, Mialdun, Porter and Shevtsova2019, Reference Sánchez, Gaponenko, Yasnou, Mialdun, Porter and Shevtsova2020b) extended the study by exploring instabilities in miscible and immiscible fluids under microgravity, focusing on how external vibrational excitation can control dynamic interface behaviour and pattern selection. This highlights the broader relevance of vibrations not only for heat transfer but also for fluid interface management in space. Porter et al. (Reference Porter, Sánchez, Shevtsova and Yasnou2021) reviewed these developments, emphasizing the potential for controlling fluid instabilities in microgravity.
The previous studies show that, in microgravity environments, vibroconvection is an effective means of enhancing heat transfer efficiency. When vibroconvection is applied to drive the melting process in microgravity, it raises a crucial question: how does vibroconvection affect the morphological evolution of the melting interface? To address this question, we conducted direct numerical simulations of a solid melting in a two-dimensional square cavity subjected to an external temperature difference and vibration, studying the morphology evolution of the melting process driven by vibroconvection under microgravity conditions. The remainder of the article is structured as follows. In § 2, we present the governing equations and numerical set-up. In § 3, we examine the effect of vibroconvection on the evolution of the interface height. In § 4, we investigate the influences of the merging of columnar plumes and peripheral flow near sidewalls. In § 5, we analyse the evolution of the interface roughness amplitude. Finally, we provide a brief conclusion and outlook in § 6.
2. Governing equations and problem set-up
We consider the evolution of a melting solid in a square heated from below as shown in figure 1. The square is bounded by four impenetrable, no-slip walls with a size of  $H$. We adopt a constant temperature
 $T = T_h$ on the bottom plate and
 $T=T_m$ on the top plate with
 $T_m$ being the melting temperature and
 $T_h< T_m$. As gravity is absent in microgravity, a horizontal harmonic vibration
 $A\cos (\varOmega t) \boldsymbol {e}_x$ is imposed to act as an artificial driving (Beysens Reference Beysens2006), which generates vibroconvection (Gershuni & Lyubimov Reference Gershuni and Lyubimov1998; Shevtsova et al. Reference Shevtsova, Ryzhkov, Melnikov, Gaponenko and Mialdun2010; Huang et al. Reference Huang, Wu, Guo, Zhao, Wang, Chong and Zhou2024) driving the melting process. Associated with the vibration, an inertial acceleration of
 $A \varOmega ^2 \cos ( \varOmega t ) \boldsymbol {e}_x$ perpendicular to the temperature gradient is introduced into the system. Here,
 $A$ is the vibration amplitude,
 $\varOmega$ is the vibration frequency and
 $\boldsymbol {e}_x$ is the unit vector in the
 $x$ direction. We employed the phase-field method (Hester et al. Reference Hester, Couston, Favier, Burns and Vasil2020) to simulate the melting of the solid. In this approach, a phase-field value of
 $\phi = 1$ represents the solid phase, while
 $\phi = 0$ represents the liquid phase. Therefore, the melting system is governed by the incompressible Navier–Stokes equations under the Oberbeck–Boussinesq approximation in addition to the dynamic equation of the phase field
 $\phi$. Non-dimensionalized by the cell size
 $H$, the characteristic velocity
 $\beta \varDelta A \varOmega$ and the temperature difference
 $\varDelta = T_h - T_m$, the non-dimensional governing equations for this system read
 $$\begin{gather} \frac{\partial u_i}{\partial t} + u_j\frac{\partial u_i}{\partial x_j} ={-}\frac{\partial p}{\partial x_i} - a^{{-}1}\cos(a^{{-}1}t)\theta\delta_{1i} + \sqrt{\frac{Pr}{2Ra_{{vib}}}}\frac{\partial^2u_i}{\partial x_j\partial x_j} - \frac{\phi u_i}{\eta}, \end{gather}$$
 $$\begin{gather}\frac{\partial\theta}{\partial t}+u_j\frac{\partial\theta}{\partial x_j} = \frac{1}{\sqrt{2{Ra}_{{vib}}Pr}}\frac{\partial^2\theta}{\partial x_j\partial x_j}+St \frac{\partial\phi}{\partial t}, \end{gather}$$
 $$\begin{gather}\frac{\partial\phi}{\partial t}=\frac{6}{5 C St\sqrt{2{Ra}_{{vib}}Pr}} \left[\frac{\partial^2\phi}{\partial x_j\partial x_j}-\frac{1}{\epsilon^2}\phi(1-\phi) (1-2\phi+C\theta)\right], \end{gather}$$
with the incompressibility constraint  $\partial u_i / \partial x_i = 0$. Here,
 $u_i$ (
 $\equiv (u,w)$) is the dimensionless fluid velocity,
 $p$ is the dimensionless pressure and
 $\theta = (T-T_m) /\varDelta$ is the dimensionless temperature. In (2.1),
 $\eta$ is the velocity penalty parameter and set equal to the time step (Yang et al. Reference Yang, Howland, Liu, Verzicco and Lohse2023b). In (2.3),
 $\epsilon$ represents the dimensionless thickness of the diffusive interface and is set equal to the grid spacing (Favier et al. Reference Favier, Purseed and Duchemin2019);
 $C$ is a parameter that controls the extent of curvature impact on the melting point at the interface and
 $C=1$ is adopted due to the relatively small local curvature (Couston et al. Reference Couston, Hester, Favier, Taylor, Holland and Jenkins2021; Yang et al. Reference Yang, Howland, Liu, Verzicco and Lohse2023b). In this system, there are four control parameters, namely the vibrational Rayleigh number
 $Ra_{{vib}}$, the Prandtl number
 $Pr$, the Stefan number
 $St$ and the non-dimensional vibration amplitude
 $a$:
 \begin{equation} Ra_{{vib}} = \frac{(\beta A \varOmega \varDelta H)^2}{2\nu \kappa},\quad Pr = \frac{\nu}{\kappa},\quad St = \frac{\mathcal{L}}{c_p\varDelta},\quad a = \frac{\beta A \varDelta}{H}, \end{equation}
where  $\nu$ is the kinematic viscosity coefficient of the liquid,
 $\kappa$ is the thermal diffusivity coefficient (considered a constant and assumed to be equal in both phases),
 $\beta$ is the thermal expansion coefficient,
 $\mathcal {L}$ denotes the latent heat and
 $c_p$ is the specific heat capacity at constant pressure.
Sketch of vibration-induced a solid melting under microgravity conditions in a square cell with the coordinate systems. Lateral vibration is applied to generate convective flow driving the solid melting, and the vibration is perpendicular to the applied temperature gradient.

We note that for the boundary conditions of the velocity field, all solid walls are non-penetrable and non-slip, i.e.  $u = 0$ and
 $w=0$; for boundary conditions of the temperature field, constant temperatures are set on the top and bottom plates, i.e.
 $\theta = 1$ on bottom plates and
 $\theta = 0$ on top plates, while the sidewalls are adiabatic, i.e.
 $\partial _n \theta = 0$. At the liquid–solid interface, the heat flux balance theoretically follows the classical Stefan condition, which is written in dimensionless form:
 \begin{equation} St u_n = \frac{1}{\sqrt{2{Ra}_{{vib}}Pr}} (\partial_n\theta^{(S)} - \partial_n\theta^{(L)}), \end{equation}
where  $u_n$ is the normal velocity of the liquid–solid interface and the superscripts
 $S$ and
 $L$ respectively represent the solid and liquid phases. This Stefan condition (2.5) at the liquid–solid interface has been taken into account in the phase-field method (Favier et al. Reference Favier, Purseed and Duchemin2019; Hester et al. Reference Hester, Couston, Favier, Burns and Vasil2020). For the initial condition, we set a liquid layer with a small height of
 $0.01H$ and a solid layer for other regions. The initial temperature of the solid phase is set equal to the temperature of the top plate (
 $\theta = 0$), while a linear temperature profile is assigned within the liquid phase. The initial velocity field is set to
 $u=0$ and
 $w=0$. With this configuration, the solid undergoes melting from the bottom upwards until complete liquefaction.
We carried out a series of direct numerical simulations to investigate the morphology evolution of a solid melting in microgravity. The governing equations (2.1)–(2.3) of this system are solved using a second-order finite-difference solver, which has been well validated in our previous studies (Wang et al. Reference Wang, Zhou and Sun2020; Guo et al. Reference Guo, Wu, Wang, Zhou and Chong2023; Yang et al. Reference Yang, Howland, Liu, Verzicco and Lohse2023b, Reference Yang, Howland, Liu, Verzicco and Lohse2024). And our numerical code has been adopted in simulating several problems of single-phase and multiphase turbulent flows (Zhao et al. Reference Zhao, Wang, Wu, Chong and Zhou2022a,Reference Zhao, Zhang, Wang, Wu, Chong and Zhoub; Huang et al. Reference Huang, Guo, Wu, Wang, Chong and Zhou2023; Chong et al. Reference Chong, Qiao, Wu and Wang2024; Meng et al. Reference Meng, Zhao, Wu, Wang, Zhou and Chong2024; Zhang & Zhou Reference Zhang and Zhou2024; Zhao et al. Reference Zhao, Wu, Wang, Chang, Zhou and Chong2024). In all runs, we fix the Prandtl number at  $Pr = 10$ for numerical convenience. Note that organic PCMs have high Prandtl numbers, while metals have very low Prandtl numbers. For water, the density anomaly at
 $4\,^{\circ }$C should be considered (Wang et al. Reference Wang, Calzavarini, Sun and Toschi2021; Yang et al. Reference Yang, Chong, Liu, Verzicco and Lohse2022). First,
 $St$ is fixed to 0.1, and we set
 $a=0.01$ and vary
 $Ra_{{vib}}$ from
 $10^5$ to
 $10^9$, corresponding to the heat transport mechanism in the thermal-boundary-layer-dominant regime reported in our previous work (Huang et al. Reference Huang, Wu, Guo, Zhao, Wang, Chong and Zhou2024). The choice of
 $St$ and
 $a$ is made for computational efficiency, and we will discuss the potential effects when considering other values of
 $a$ and
 $St$ to apply to a broader range of PCMs and vibration sources. To accurately resolve the vibration-induced Stokes layer, we refined the mesh in the near-wall region and ensured a minimum of
 $16$ grids within the Stokes layer under high-intensity vibration. The chosen time step,
 $\Delta t$, ensures at least
 $60$ steps per a vibration period. More details of numerical parameters for all runs are given in table 1.
List of the numerical simulations in this study.

3. The evolution of mean height of liquid–solid interface
First, we investigate the temporal evolution of the height of the liquid–solid interface for vibration-induced melting in microgravity. Figure 2 depicts the spatio-temporal evolution of the interface height  $\xi (x,t)$ for different
 $Ra_{{vib}}$. Here, the value of dimensionless height
 $\xi (x,t)$ is extracted at the interface location where the phase-field value is
 $\phi = 0.5$. It is observed that, initially, the interface is relatively uniform along the
 $x$ direction, indicating that heat transfer is dominated by conduction. As
 $\xi (x,t)$ increases with time, vibration-induced convection becomes the primary mode of heat transfer, leading to increased roughness of the interface.
Temporal evolution of the liquid–solid interface for vibration-induced melting in microgravity for different vibrational Rayleigh numbers (a)  $Ra_{{vib}}=10^5$, (b)
 $Ra_{{vib}}=10^7$ and (c)
 $Ra_{{vib}}=10^9$ at fixed
 $Pr=10$.

We then examine the evolution of the mean interface height  $\bar {\xi }(t) = \langle \xi (x, t) \rangle _x$ during vibration-induced melting, where
 $\langle \cdot \rangle _x$ denotes the average over a specific horizontal plane. Figure 3(a) shows the measured mean height
 $\bar {\xi }(t)$ as a function of
 $\tilde {t}$ for different
 $Ra_{vib}$, where
 $\tilde {t} = t \sqrt {Pr/(2 Ra_{{vib}})}$ denotes the time scaled by the viscous time scale. It is seen that the trend of
 $\bar {\xi }(t)$ exhibits two distinct scaling laws with time
 $\tilde {t}$, i.e.
 $\bar {\xi } \sim \tilde {t}^{1/2}$ during the early evolution and
 $\bar {\xi } \sim \tilde {t}$ for the later time. We further plot the interface evolution rate
 $\dot {\bar {\xi }}={\rm d}\bar {\xi }/{\rm d}\tilde {t}$ as a function of
 $\bar {\xi }$. Two different scaling laws are identified. At lower vibration Rayleigh numbers,
 $\dot {\bar {\xi }} \sim \bar {\xi }^{-1}$, while at higher vibration Rayleigh numbers, a flattening of scaling occurs, characterized by
 $\dot {\bar {\xi }} \sim \bar {\xi }^{0}$, implying that the melting rate of the interface becomes constant, independent of the mean interface height and time.
(a) The measured mean interface height  $\bar {\xi }$ as a function of
 $\tilde t$ for different
 $Ra_{{vib}}$. (b) The measured interfacial evolution rate
 $\dot {\bar {\xi }}$ as a function of the mean interface height
 $\bar {\xi }$ for different
 $Ra_{{vib}}$. In (a),
 $\tilde t$ is the dimensionless time by a viscous time scale and the dashed lines represent
 $\bar {\xi } \sim {\tilde t}^{1/2}$ and
 $\bar {\xi } \sim \tilde t$. In (b), the dashed line represents
 $\dot {\bar {\xi }} \sim {\bar {\xi }}^{-1}$.

As the melting is related to the heat transfer mechanism at the liquid–solid interface, we then try to explain those scaling relations from the relation between melting rate and the vertical heat flux. From the Stefan boundary condition (2.5), one obtains
 \begin{equation} \bar{\xi} \frac{\mathrm{d}\bar{\xi}}{\mathrm{d}t} = \frac{1}{St\sqrt{2{Ra}_{{vib}}Pr}} Nu_{{eff}}, \end{equation}
where the effective Nusselt number  $Nu_{{eff}}$ represents the ratio of the vertical heat flux at the liquid–solid interface to the diffusive flux across the liquid layer of a mean height
 $\bar {\xi }$. We calculate
 $Nu_{{eff}}$ according to (3.1). Similar to the heat transport scaling relation in a microgravity vibroconvection system, one can assume that the effective Nusselt number has power-law dependencies on vibrational Rayleigh number (Huang et al. Reference Huang, Wu, Guo, Zhao, Wang, Chong and Zhou2024), i.e.
 $Nu_{{eff}} \sim {{Ra}_{{vib}}^{{eff}}}^{\alpha }$ with
 ${Ra}_{{vib}}^{{eff}} = {Ra}_{{vib}} \bar {\xi }^2$. Substituting the
 $Nu_{{eff}}$ relation into (3.1) allows us to obtain
 \begin{equation} \bar{\xi} \sim {Ra}_{{vib}}^{{\alpha}/{(2-2\alpha)}} Pr^{-({1}/{(2-2\alpha)})} St^{-({1}/{(2-2\alpha)})} \tilde{t}^{{1}/{(2-2\alpha)}}. \end{equation}
To quantify the value of the unknown  $\alpha$ in
 $\bar {\xi }$-scaling relation (3.2), we plot in figure 4 the effective outgoing Nusselt number
 $Nu_{{eff}}$ as a function of
 ${Ra}_{{vib}}^{{eff}}$ for different
 $Ra_{{vib}}$. It is seen that
 $Nu_{eff}$ is nearly constant for small
 $Ra_{vib}$, indicating
 $\alpha = 0$ in the conductive regime, while a scaling relation
 $Nu_{eff} \sim ({Ra}_{{vib}}^{{eff}})^{1/2}$ is obviously found for large
 $Ra_{vib}$, indicating
 $\alpha = 1/2$ in the convective regime (Huang et al. Reference Huang, Wu, Guo, Zhao, Wang, Chong and Zhou2024). Substituting
 $\alpha = 0$ and
 $\alpha = 1/2$ into (3.2) gives two known scaling behaviours of melting rate which are identified above:
 $\bar {\xi } \sim \tilde {t}^{1/2}$ and
 $\bar {\xi } \sim \tilde {t}$. This well explains the transition from
 $\bar {\xi } \sim \tilde {t}^{1/2}$ in the conductive regime to
 $\bar {\xi } \sim \tilde {t}$ in the vibration-induced convection regime. It is worth noting that when a larger amplitude
 $a$ is used, the system's heat transfer characteristics need to be described by the oscillatory Rayleigh number
 $Ra_{os}=(\beta A\varOmega ^2 \varDelta H^3)/vk$ (Huang et al. Reference Huang, Wu, Guo, Zhao, Wang, Chong and Zhou2024). However, this does not affect the scaling law between
 $\bar {\xi }$ and
 $\tilde {t}$. This transition of melting rate from diffusive to convective regimes is also found in solid melting driven by Rayleigh–Bénard convection (Favier et al. Reference Favier, Purseed and Duchemin2019).
The measured interfacial effective Nusselt number  $Nu_{{eff}}$ as a function of effective vibrational Rayleigh number
 ${Ra}_{{vib}}^{{eff}}$ for different
 $Ra_{{vib}}$. The dashed line represents
 $Nu_{{eff}} \sim {{Ra}_{{vib}}^{{eff}}}^{1/2}$.

4. Fluid layer dynamics and its influence on interface shape
Upon establishing a fundamental comprehension of the evolution of mean interface height, attention is redirected towards the underlying dynamics of vibroconvective flow in the liquid layer, which catalyses the genesis of intricate interface morphology. Figure 5 shows the instantaneous flow structure by visualizing the temperature field and velocity field at different mean height  $\bar {\xi }$ for vibrational Rayleigh numbers
 $Ra_{vib} = 10^5, 10^7, 10^9$. For a small vibrational Rayleigh number
 $Ra_{{vib}} = 10^5$ (see figure 5a) at
 $\bar {\xi } = 0.2$, corresponding to
 $Ra_{{vib}}^{{eff}}=4\times 10^3$, the flow structure in the liquid layer exhibits a periodic circulation with a stable temperature distribution in the bulk region. With increasing
 $\bar {\xi }$ (or the effective vibrational Rayleigh number
 $Ra_{{vib}}^{{eff}}$), the periodic circulation intensifies to disturb the temperature field, leading to a slight shift of heat transfer from the pure convection regime. For high vibrational Rayleigh numbers, e.g.
 $Ra_{{vib}} = 10^7$ and
 $Ra_{{vib}} = 10^9$ as shown in figure 5(b,c), since the vibration-induced shear effect becomes strong enough to destabilize the thermal boundary layer, massive columnar thermal plumes erupt from the thermal boundary layer and the flow structure transits into the columnar regime. We notice that as melting proceeds with time, vertical columnar plumes merge into larger and wider plumes. And due to adiabatic and no-slip boundary conditions at the sidewalls, the peripheral flow is formed and leads to heat accumulation near the sidewalls. Both phenomena of plume merging and heat accumulation in peripheral flow near the sidewall result in a more complicated morphology evolution of the liquid–solid interface.
Instantaneous snapshots of the temperature (colour) and velocity (vectors) fields for three different  $\bar {\xi }$, which are (a–c)
 $\bar {\xi }=0.2$, (d–f)
 $\bar {\xi }=0.5$ and (g–i)
 $\bar {\xi }=0.8$, and for three different
 $Ra_{{vib}}$, which are (a,d,g)
 $Ra_{{vib}}=10^5$, (b,e,h)
 $Ra_{{vib}}=10^7$ and (c,f,i)
 $Ra_{{vib}}=10^9$. The rectangles in (d–f) show the region of peripheral flow near the left sidewall.

We start to focus on the effect of plume merging on the morphology evolution of the liquid–solid interface. During the melting process, columnar plumes are generated due to the vibroconvective instability, and they gradually grow under vibration-induced buoyancy until reaching the saturation state. In presence of vertical stretching, new convective instability occurs and causes adjacent plumes to merge, resulting in the formation of larger and more stable columnar thermal structures. Figure 6 presents the temporal evolution of the temperature profile at mid-height  $z=\bar {\xi }/2$ of the liquid domain and clearly shows the merging behaviour of the thermal plumes during melting at
 $Ra_{vib}=10^7$ and
 $Ra_{vib}=10^9$, where the flow structure is almost in the columnar regime. It is seen that after the transition to the columnar regime, massive plumes begin to erupt abruptly, and gradually merge into larger and stable ones with
 $\bar {\xi }$ (or
 $Ra_{{vib}}^{{eff}}$) further increasing. This phenomenon is similar to the merging of convective rolls observed in the melting process in Rayleigh–Bénard convection by Favier et al. (Reference Favier, Purseed and Duchemin2019), where there is an alternation between stable solutions, chaotic solutions and ultimately a transition to turbulent solutions.
Spatio-temporal evolution of the temperature profile at the mid-height of the liquid domain for two vibrational Rayleigh numbers (a)  $Ra_{{vib}}=10^7$ and (b)
 $Ra_{{vib}}=10^9$.

To quantitatively investigate the merging behaviour of columnar plumes, we plot the number of columnar thermal plumes  $K_m$ as a function of the mean interface height
 $\bar {\xi }$ in figure 7(a). Here,
 $K_m$ is obtained by counting the number of extreme points in the temperature profile at mid-height
 $z=\bar {\xi }/2$ of the liquid domain, which is filtered by using
 $T-T_m>cT_{rms}$ to remove the small-scales noise with the tuning coefficient
 $c=0.8$. In fact, when
 $0.6 \leq c \leq 1.0$, the obtained results are not sensitive to the choice of
 $c$. It is observed that with increasing
 $\bar {\xi }$, the number of columnar plumes initially increases, which corresponds to the transition of flow structure from the periodic-circulation regime to the columnar regime, then reaches a maximum and gradually decreases due to the alternating occurrence of secondary bifurcation and nonlinear saturation (Favier et al. Reference Favier, Purseed and Duchemin2019). Due to the oscillatory behaviour of vibroconvective flows, the profiles of
 $K_m$ exhibit some oscillations. By fitting with these profiles in the columnar regime, we found that for the plume merging behaviour, there exists a scaling relation between the columnar plume number
 $K_m$ and the mean interface height
 $\bar {\xi }$, i.e.
 $K_m \sim \bar {\xi }^{-0.70\pm 0.05}$.
The number of columnar thermal plumes (a)  $K_m$ and its rescaled quantity (b)
 $K_m Ra_{{vib}}^{-0.15}$ as functions of the mean interface height
 $\bar {\xi }$ for different
 $Ra_{{vib}}$, which are
 $Ra_{{vib}}=1\times 10^7$,
 $3\times 10^7$,
 $1\times 10^8$,
 $3\times 10^8$ and
 $1\times 10^9$. Plots of
 $K_m$ as a function of
 $\bar {\xi }$ for different (c)
 $a$ and (d)
 $St$, with
 $Ra_{{vib}} = 10^7$. The dashed lines in (a–d) represent the scaling relation of
 $\bar {\xi }^{-0.7}$. The symbols represent the results calculated based on the statistical criteria for columnar thermal plumes.

How can we understand the obtained scaling relation of the columnar plume merging behaviour? We find that the underlying mechanism of plume merging consists of two aspects: one is the effect of the aspect ratio of the liquid layer quantified by the ratio of height to width  $\varGamma$, and the other is the effect of vibrational intensity quantified by the parameter
 $Ra_{vib}$. For the effect of aspect ratio
 $\varGamma$, as the number of columnar plumes linearly increases with increasing width of the liquid layer at fixed height, there exists an inverse relationship between
 $K_m$ and aspect ratio
 $\varGamma$, i.e.
 $K_m \sim \varGamma ^{-1}$. For the
 $Ra_{vib}$ effect, we assume that the columnar plume number
 $K_m$ has a power-law dependency on the vibrational Rayleigh number, i.e.
 $K_m \sim Ra_{vib}^{\gamma }$ with
 $\gamma$ the scaling exponent. During the vibration-induced melting process, both effects contribute to the plume merging behaviour, leading to the scaling relation of
 $K_m$ between the aspect ratio
 $\varGamma = \bar {\xi }$ and the effective Rayleigh number
 $Ra_{{vib}}^{{eff}}$ of the instantaneous liquid layer, i.e.
 $K_m \sim \bar {\xi }^{-1} (Ra_{{vib}}^{{eff}} )^\gamma$. Applying
 $Ra_{{vib}}^{{eff}} = Ra_{vib} \bar {\xi }^{2}$ allows one to rewrite the above relationship:
 $K_m \sim {Ra_{{vib}}^{\gamma }} \bar {\xi }^{2\gamma -1}$. Using the obtained scaling relation
 $K_m \sim \bar {\xi }^{-0.70\pm 0.05}$ in figure 7(a), one readily obtains
 $\gamma = 0.150 \pm 0.025$. The error mainly comes from the varying durations of nonlinear saturation phases for different
 $Ra_{{vib}}$ and minor inaccuracies in counting plume columns. To further confirm the deduced relationship
 $K_m \sim Ra_{vib}^{\gamma } \bar {\xi }^{2\gamma - 1}$ with
 $\gamma = 0.150 \pm 0.025$, we replot figure 7(a) by showing
 $K_m Ra_{vib}^{-0.15}$ as a function of
 $\bar {\xi }$ in figure 7(b). It is found that the curves in the stage of plume merging for all
 $Ra_{vib}$ studied almost collapse showing a remarkable scaling relation:
 $\bar {\xi }^{-0.7}$. Additionally, it is noteworthy that the value of
 $K_m$ is influenced by factors such as
 $St$,
 $a$ and initial perturbations. Particularly in figure 7(c), it can be observed that when
 $Ra_{vib}$ remains constant, the value of
 $K_m$ decreases significantly with an increase of
 $a$. This change is related to the transition in the heat transport mechanism of vibroconvective turbulence (Huang et al. Reference Huang, Wu, Guo, Zhao, Wang, Chong and Zhou2024). However, as depicted in figure 7(c,d), for various
 $St$ and smaller values of
 $a$, the merging behaviour of columnar plumes is invariant. Specifically, for a substantial value of
 $a$, such as
 $a=0.3$, the number of plumes is significantly reduced, rendering the merging pattern less discernible.
We then examine the effect of peripheral flow near sidewalls on the morphology evolution of the liquid–solid interface. Figure 8 shows cumulative basal melting rates  $(\bar {\xi }-0.01)/\tilde {t}_{\bar {\xi }}$ at different mean interface heights for different
 $Ra_{{vib}}$. It is seen that the melting rate near sidewalls is obviously lower than that in the central region, indicating that the melting mechanism by peripheral flow is different from that by the upward and downward columnar plumes. To illustrate the flow characteristics of the peripheral flow region, we plot five snapshots of the instantaneous temperature and velocity fields within one vibration period for
 $Ra_{{vib}}=10^7$ in figure 9(a–e). We observe that during the upper half of the vibration period, the outer flow region exhibits an upward flow trend, while in the lower half of the period, the trend is reversed. Additionally, we plot the time evolution of vertical velocity profiles over
 $0\le x\le 0.1$ and
 $z = 0.1$ over three dimensionless time periods, normalized by the vibration period
 $\tau _w=2{\rm \pi} a$, as shown in figure 9(f). It is evident that the vertical velocity exhibits periodic variations, with a period matching the applied harmonic vibration period. We analyse the effect of peripheral flow only in near-sidewall regions for
 $0\leq x < 1/3$ and
 $2/3 < x \leq 1$, to minimize the influence of columnar plumes in central regions. We define the mean interface height shift
 ${\xi }_s(t) = (\xi _{s,left}(t) + \xi _{s,right}(t))/2$ from the sidewalls to the central regions, where the height shifts for left and right sidewalls are given by
 $$\begin{gather} \xi_{s,left}(t) = \max\{\xi(x,t)\}-\min\{\xi(x,t)\} \quad\text{for}\ 0 \leq x < 1/3, \end{gather}$$
 $$\begin{gather}\xi_{s,right}(t)=\max\{\xi(x,t)\}-\min\{\xi(x,t)\} \quad\text{for}\ 2/3 < x \leq 1. \end{gather}$$
The cumulative basal melt rate at various mean interface heights  $\bar {\xi }$ for different vibrational Rayleigh numbers (a)
 $Ra_{{vib}}=10^5$, (b)
 $Ra_{{vib}}=10^7$ and (c)
 $Ra_{{vib}}=10^9$.

Instantaneous temperature and velocity fields for  $Ra_{{vib}}=10^7$ at phases (a) 0, (b)
 ${\rm \pi} /2$, (c)
 ${\rm \pi}$, (d)
 $3{\rm \pi} /2$ and (e)
 $2{\rm \pi}$. (f) Time evolution of the vertical velocity
 $T|_{0\le x\le 0.1, z=0.1}$. The black circles in the insets of (a–e) indicate the corresponding instant of the phase.

Figure 10 shows the temporal evolution of  $\xi _s(t)$ for different
 $Ra_{vib}$. One sees that the interface height shift
 $\xi _s(t)$ vanishes in the diffusive regime, whereas
 $\xi _s(t)$ grows with time due to the presence of peripheral flow in vibration-induced convection regime. Additionally, with increasing
 $Ra_{vib}$, the maximum value of
 $\xi _s(t)$ initially rises, indicating a greater difference in local heat flux between the columnar thermal structure and peripheral flow regions. At higher
 $Ra_{vib}$, the melting of the upper interface in the peripheral flow region is likely to be disrupted by nearby thermal plumes, as more thermal plumes are generated, reducing the size of the peripheral flow region. In this case,
 $\xi _s(t)$ may decrease. Finally, it should be emphasized that in a thermal vibrational convection system bounded laterally by walls, heat tends to accumulate near the sidewalls (Guo et al. Reference Guo, Wu, Wang, Zhou and Chong2023). When phase change is involved, these wall patterns lead to a reduced melting rate near the sidewalls. It is worth noting that in a rotating system bounded by lateral walls, Ravichandran & Wettlaufer (Reference Ravichandran and Wettlaufer2021) found that heat is primarily transferred through peripheral flow, and the melting rate of the solid region near the wall is significantly faster than that of the interior. This is different from our conclusions, suggesting that the influence of peripheral flow may vary across different systems.
The measured mean interface height shift  $\xi _s$ during the process from the beginning to the interface touching the top plate.

5. Interface roughness characteristics
As both the plume merging and the peripheral flow near sidewalls affect the evolution of intricate interface patterns, it raises a question as to how the roughness of the interface evolves with time. The characteristics of interface roughness are quantified by the root mean square (r.m.s.) of the interface height fluctuation,  $\xi _{rms} = \sqrt {\overline {{\xi ^\prime }^2}}$ with
 $\xi ^\prime = \xi - \bar {\xi }$ the interface height fluctuation. Figure 11(a) plots the measured
 $\xi _{rms}$ as a function of time for different
 $Ra_{vib}$. It is shown that after the transition to the columnar regime,
 $\xi _{rms}$ seems to linearly grow with time, i.e.
 $\xi _{rms} \sim \tilde t$. As the mean height obeys
 $\bar {\xi } \sim \tilde t$ in the columnar regime from (3.2), it allows one to obtain the relation between
 $\xi _{rms}$ and
 $\bar {\xi }$, namely
 $\xi _{rms} \sim \bar {\xi }$, indicating that the r.m.s. height is proportional to the mean height as shown in the inset of figure 11(a). By rescaling
 $\xi _{{rms}}$ as
 $\tilde \xi _{{rms}}=\xi _{{rms}} {Ra_{{vib}}^{1/2}}$, one can observe an approximate scaling law of
 $\tilde \xi _{{rms}} \sim {{Ra}_{{vib}}^{{eff}}}^{1/2}$ as shown in figure 11(b). In addition, we investigate the influence of the amplitude
 $a$ and Stefan number
 $St$ on the scaling relation
 $\tilde \xi _{{rms}} \sim {{Ra}_{{vib}}^{{eff}}}^{1/2}$. Figure 12 depicts
 $\tilde \xi _{{rms}}$ as a function of
 ${Ra}_{{vib}}^{{eff}}$ for different amplitude
 $a$ and Stefan number
 $St$ at fixed
 $Ra_{vib}$. It is observed that the scaling relationship
 $\tilde \xi _{{rms}} \sim {{Ra}_{{vib}}^{{eff}}}^{1/2}$ is quite robust, showing an independency on both the vibration amplitude and Stefan number.
(a) The measured interface roughness amplitude  $\xi _{{rms}}$ as a function of
 $\tilde t$. The inset further shows
 $\xi _{{rms}}$ as a function of mean interface height
 $\bar {\xi }$. (b) Rescaled roughness amplitude
 $\tilde \xi _{{rms}}$ as a function of vibrational Rayleigh number
 ${Ra}_{{vib}}^{{eff}}$. The dashed line in (a) represents
 $\xi _{{rms}} \sim \tilde {t}$ and the dashed line in the inset of (a) represents
 $\xi _{{rms}} \sim \bar {\xi }$. The dashed line in (b) represents
 $\tilde \xi _{{rms}} \sim {{Ra}_{{vib}}^{{eff}}}^{1/2}$.

Rescaled interface roughness amplitude  $\tilde \xi _{{rms}}$ as functions of vibrational Rayleigh number
 ${Ra}_{{vib}}^{{eff}}$ (a) for different dimensionless vibration amplitude
 $a$ and (b) for different
 $St$. The dashed lines in (a,b) represent
 $\tilde \xi _{{rms}} \sim {{Ra}_{{vib}}^{{eff}}}^{1/2}$.

To gain insight into this robust scaling law  $\tilde \xi _{{rms}} \sim {{Ra}_{{vib}}^{{eff}}}^{1/2}$, we follow an approach used in buoyancy-driven melting in Rayleigh–Bénard convection by Yang et al. (Reference Yang, Howland, Liu, Verzicco and Lohse2023b), and try to theoretically understand it. We start from the Stefan boundary condition (2.5), which gives
 \begin{equation} \bar{\xi} \frac{\mathrm{d} \tilde{\xi}}{\mathrm{d} t} = \frac{\sqrt{2}}{2} St^{{-}1} Pr^{{-}1/2} Nu_{loc}, \end{equation}
where  $\tilde {\xi } = Ra_{vib}^{1/2} \xi$, and the local Nusselt number
 $Nu_{loc}$ represents the ratio of the vertical local heat flux at the liquid–solid interface to the diffusive flux across the liquid layer of a mean height
 $\bar {\xi }$. Subtracting (3.1) from (5.1), we obtain
 \begin{equation} \bar{\xi} \frac{\mathrm{d}\widetilde{\xi^{\prime}}}{\mathrm{d} t} = \frac{\sqrt{2}}{2} St^{{-}1} Pr^{{-}1/2} Nu_{loc}^{\prime}, \end{equation}
where  $\widetilde {\xi ^{\prime }} = Ra_{vib}^{1/2} \xi ^\prime$, and
 $Nu_{loc}^{\prime } = Nu_{loc} - Nu_{{eff}}$ is the fluctuating vertical local heat flux. By employing the chain rule, we can establish a connection between
 $\widetilde {\xi ^{\prime }}$ and
 ${Ra}_{{vib}}^{{eff}}$, i.e.
 ${\partial \widetilde {\xi ^{\prime }}}/{\partial {Ra}_{{vib}}^{{eff}}} = ({\partial \widetilde {\xi ^{\prime }}}/{\partial t}) ({\partial t}/{\partial \bar {\xi }}) ({\partial \bar {\xi }}/{\partial {Ra}_{{vib}}^{{eff}}})$. Substituting (3.1) and (5.2) into the above equation of
 ${\partial \widetilde {\xi ^{\prime }}}/{\partial {Ra}_{{vib}}^{{eff}}}$, one obtains
 \begin{equation} \frac{\partial \widetilde{\xi^{\prime}}}{\partial{Ra}_{{vib}}^{{eff}}} = \frac{Nu_{loc}^{\prime}}{2Nu_{{eff}}} {{Ra}_{{vib}}^{{eff}}}^{{-}1/2}. \end{equation}
Equation (5.3) shows the relation between  $\xi ^{\prime }$ and
 $Ra_{vib}^{eff}$ with the unknown term
 ${Nu_{loc}^{\prime }}/{Nu_{{eff}}}$. Here, we measure the conditionally averaged heat fluxes for the hot and cold regions and plot the normalized heat flux fluctuations as a function of
 $Ra_{vib}^{eff}$ for different control parameters
 $Ra_{vib}$,
 $St$ and
 $a$ in figure 13. It can be observed that within a wide range from
 $Ra_{vib}^{eff}=10^5$ to
 $Ra_{vib}^{eff}=10^9$, the contributions to the heat flux from the hot and cold regions remain nearly constant. Since
 ${Nu_{loc}^{\prime }}/{Nu_{{eff}}}$ can be estimated from the difference in the averaged heat flux between the hot and cold regions, one can approximate
 ${Nu_{loc}^{\prime }}/{Nu_{{eff}}} \sim$ constant, namely
 $Nu_{loc}^{\prime }/{Nu_{{eff}}} \approx R_{Nu}$, and integrating (5.3) over
 $Ra_{vib}^{eff}$ allows one to obtain
 $\widetilde {\xi ^{\prime }} \approx R_{Nu} {{Ra}_{{vib}}^{{eff}}}^{1/2}$. Substituting
 $\widetilde {\xi ^{\prime }} \approx R_{Nu} {{Ra}_{{vib}}^{{eff}}}^{1/2}$ into
 $\tilde {\xi }_{rms} = \sqrt {\overline {\widetilde {\xi ^\prime }^2}}$ leads to an analytical relation between
 $\tilde {\xi }_{rms}$ and
 $Ra_{vib}^{eff}$:
 \begin{equation} \tilde\xi_{{rms}} \sim {{Ra}_{{vib}}^{{eff}}}^{1/2}, \end{equation}
which agrees well with the results in figures 11(b) and 12.
The conditionally vertical averaged heat fluxes in the hot region  $\overline {Nu}_{\rm {loc}}^h$ and cold region
 $\overline {Nu}_{{loc}}^c$, normalized by the vertical interface-averaged heat flux
 ${Nu_{{eff}}}$, as a function of effective vibrational Rayleigh number
 ${Ra}_{{vib}}^{{eff}}$ for different
 $Ra_{{vib}}$ and
 $a$ at
 $\bar {\xi }=0.5$ and
 $\bar {\xi }=0.8$, and for different
 $St$ at
 $\bar {\xi }=0.4$ and
 $\bar {\xi }=0.7$. The data points are calculated by taking the average over five consecutive time steps for each
 $\bar {\xi }$, with error bars indicating the range of values.

6. Concluding remarks and outlook
This study employs direct numerical simulation coupled with the phase-field method to study the melting process of a solid phase under two-dimensional vibroconvective flow in microgravity. It is shown that as melting progresses, the heat transfer mechanism transitions from thermal conduction to a vibration-driven thermal convection regime. Correspondingly, the flow structure evolves from a periodic-circulation regime to a columnar regime. The subtle flow structure leads to hot and cold regions in the liquid layer, resulting in non-uniform heat flux and causing the interface to become rough. We characterize the evolution of the liquid–solid interface morphology and find that the transition in the heat transfer mechanism leads to a power-law change in the dependency of the mean interface height on time. We also derive these scaling relations from the Stefan boundary condition based on the mean vertical heat flux at the interface, i.e.  $\bar {\xi } \sim \tilde {t}^{1/(2 - 2 \alpha )}$, where the scaling exponent
 $\alpha = 0$ in the conductive regime and
 $\alpha = 1/2$ in the vibration-induced convective regime.
Furthermore, we find that the morphology evolution of the liquid–solid interface is mainly affected by both the merging behaviour of columnar thermal plumes and the peripheral flow near the sidewalls. This is controlled by the effects of the aspect ratio and vibrational intensity of the liquid layer, i.e.  $K_m \sim \bar {\xi }^{-1} ( Ra_{vib}^{eff} )^{\gamma }$, where
 $K_m$ is the number of columnar plumes. Exponent
 $\gamma = 0.150 \pm 0.025$ is the fitting scaling exponent from numerical data, which is insensitive to the choice of
 $St$ and
 $a$. We then examined the flow characteristics of the peripheral flow and conducted a statistical analysis of the mean interface height shift. Finally, we quantify the evolution characteristics of the interface roughness amplitude and find a power-law dependency of the normalized roughness amplitude on the effective vibrational Rayleigh number,
 $\tilde \xi _{{rms}} \sim {{Ra}_{{vib}}^{{eff}}}^{1/2}$. This scaling relation is found to be robust, showing independence from both the vibration amplitude and Stefan number. Starting from the Stefan boundary condition, we provide a theoretical derivation and demonstrate that this robust power-law relationship holds under the condition that the ratio of the fluctuating local heat flux to the total heat flux at the interface remains nearly constant.
Our findings provide a comprehensive understanding of the morphological changes of a melting solid under the influence of vibroconvection in microgravity. Vibration-induced melting in microgravity opens up new possibilities for actively controlling the melting processes of PCMs, with potential applications in microscale devices and devices for future space exploration. It is worth noting that the vibration source may result in additional energy consumption, so it is important to focus on improving energy efficiency and cost-effectiveness during application. Future studies may consider exploring higher  $Ra_{{vib}}$, where previous research on vibroconvection in single-phase systems reveals the emergence of gyroscopic structures at higher
 $Ra_{{vib}}$ (Guo et al. Reference Guo, Wu, Wang, Zhou and Chong2023). This transition to large-scale flow structures is likely to significantly affect the melting process.
Funding
This work was supported by the Natural Science Foundation of China under grant nos 11988102, 92052201, 12032016, 12072185, 12102246, 12372219, 12173105 and 12421002. This work was also sponsored by Shanghai Gaofeng Project for University Academic Program Development.
Declaration of interests
The authors report no conflict of interest.



