1. Introduction
The study of wetting has a history stretching back more than two centuries, when the equilibrium drop shape on a substrate was described by the three-phase surface energies (Young Reference Young1805). Wetting dynamics, on the other hand, has proven to be more challenging to describe (de Gennes Reference de Gennes1985; Bonn et al. Reference Bonn, Eggers, Indekeu, Meunier and Rolley2009), as the hydrodynamic description is incomplete at the contact line (where the vapour–liquid–solid phases meet), with a diverging viscous stress (Huh & Scriven Reference Huh and Scriven1971; Voinov Reference Voinov1976).
Several theories have been proposed to relax this contact line singularity, e.g. a slip length (Tanner Reference Tanner1979; de Gennes Reference de Gennes1985; Ren, Hu & E Reference Ren, Hu and W.2010), interfacial diffusion (Jacqmin Reference Jacqmin2000; Qian, Wang & Sheng Reference Qian, Wang and Sheng2003; Carlson, Do-Quang & Amberg Reference Carlson, Do-Quang and Amberg2009, Reference Carlson, Do-Quang and Amberg2011; Yue, Zhou & Feng Reference Yue, Zhou and Feng2010) and molecular stochasticity/kinetics (Blake & Haynes Reference Blake and Haynes1969; Davidovitch, Moro & Stone Reference Davidovitch, Moro and Stone2005), all of which have been demonstrated to rationalise different experimental observations. Since it is challenging to characterise the contact line singularity in macroscopic experiments, these theories often rely on ad hoc parameters, and its precise physical nature is still debated (Bonn et al. Reference Bonn, Eggers, Indekeu, Meunier and Rolley2009).
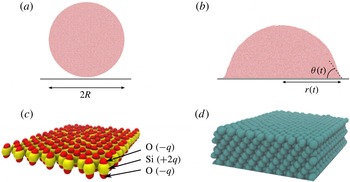
(a) Initial condition of the quasi-2D simulations, where a water droplet with radius
 $R$
is brought into contact with a solid substrate. (b) At time
 $t>0$
after droplet–substrate contact the droplet spreads onto the substrate with a growing wetting radius
 $r(t)$
and a dynamic contact angle
 ${\it\theta}(t)$
. (c) The molecular structure of a silica-like substrate which consists of hexagonally packed rigid
 $\text{SiO}_{2}$
quadrupoles;
 $q$
denotes the atomic charge. (d) A substrate of closely packed Lennard-Jones atoms. It should be noted that the solid substrates illustrated in (c) and (d) have the same equilibrium contact angle
 ${\it\theta}_{0}=37^{\circ }$
when wetted by water.

Particle-based approaches such as molecular dynamics (MD) alleviate the need for boundary conditions at the contact line and allow a detailed study of the dynamics of single-molecule interactions. Over recent decades MD has become an important complement to macroscopic modelling (Koplik, Banavar & Willemsen Reference Koplik, Banavar and Willemsen1988; Thompson & Robbins Reference Thompson and Robbins1989; Gentner, Ogonowski & De Coninck Reference Gentner, Ogonowski and De Coninck2003; Qian, Wang & Sheng Reference Qian, Wang and Sheng2004), particularly since it allows modelling of the nanoscopic physics at the contact line. Studies of wetting using MD have mostly been limited by the available computational power, with system sizes a few times larger than the typical interaction range between molecules of
 ${\approx}$
1 nm (Liu, Qin & Yang Reference Liu, Qin and Yang2010; Ho et al.
Reference Ho, Papavassiliou, Lee and Striolo2011; Ritos et al.
Reference Ritos, Dongari, Borg, Zhang and Reese2013), which may lead to finite-size effects in the results. Many studies have also been limited to monatomic systems (Thompson & Robbins Reference Thompson and Robbins1989; Qian et al.
Reference Qian, Wang and Sheng2003; De Coninck & Blake Reference De Coninck and Blake2008; Winkels et al.
Reference Winkels, Weijs, Eddi and Snoeijer2012; Nakamura et al.
Reference Nakamura, Carlson, Amberg and Shiomi2013), while more experimentally realistic systems, e.g. water on silica, have primarily focused on equilibrium material properties (Lee & Rossky Reference Lee and Rossky1994; Werder et al.
Reference Werder, Walther, Jaffe, Halicioglu and Koumoutsakos2003; Janec̆ek & Netz Reference Janec̆ek and Netz2007).
In order for a molecular description to mimic an experimental system we must account for the molecular structure and interactions of real liquids and solids. Moreover, the droplet size must be significantly larger than the intermolecular interaction range to avoid the influence of finite-size effects on the dynamics. We describe below the wetting dynamics of such a system by deploying a multi-scale approach composed of a combination of large-scale MD and macroscopic phase field (PF) simulations in quasi-2D. The initial droplet shape and the dynamic wetting process are illustrated in figure 1(a,b), which we investigate on a silica-like substrate with surface charges as shown in figure 1(c) and two less realistic Lennard-Jones (LJ) substrates: a substrate consisting of (non-charged) Lennard-Jones atoms (figure 1 d) and a pure Lennard-Jones potential wall. All substrates have the same surface energy, allowing us to quantify the influence of the molecular substrate composition on the wetting dynamics. Moreover, we show that the electrostatic interactions between molecules can generate non-trivial effects at the interface, which alter the dynamics of spreading and limit the molecular motion at the contact line.
2. System parameters, material properties and dimensional analysis
The droplet dynamics can be limited by different physical mechanisms, and to estimate these we begin by measuring the bulk macroscopic material parameters of our molecular system, which are the principal inputs to our continuum model, described further down.
Water is described by the three-site extended simple point charge (SPC/E) model (Berendsen, Grigera & Straatsma Reference Berendsen, Grigera and Straatsma1987), which is computationally efficient and models the molecular dipole moment. Its relevant liquid properties are listed in table 1, as measured using equilibrium MD simulations with particle-mesh Ewald (PME) electrostatics (Essmann et al. Reference Essmann, Perera, Berkowitz, Darden, Lee and Pedersen1995), as described in the next section. The interface thickness is characterised as the length over which the liquid changes to the vapour density.
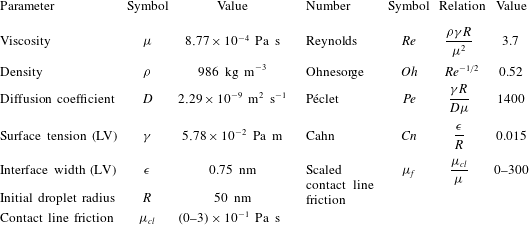
The first three columns give the material properties measured from equilibrium MD simulations. The values for the surface tension
 ${\it\gamma}$
and interface width
 ${\it\epsilon}$
are for the liquid–vapour (LV) interface. The final four columns give several non-dimensional numbers from the scaling analysis, describing the ratios between different physical time and length scales of the wetting dynamics.

There are different time scales that can describe the droplet dynamics of a wetting experiment. Scaling analysis identifies a viscous time
 ${\it\tau}_{{\it\mu}}\equiv {\it\mu}R/{\it\gamma}=0.76~\text{ns}$
, an inertial time
 ${\it\tau}_{{\it\rho}}\equiv \sqrt{{\it\rho}R^{3}/{\it\gamma}}=1.5~\text{ns}$
and a diffusive time
 ${\it\tau}_{D}\equiv R^{2}/D=1.1~{\rm\mu}\text{s}$
(see table 1 for parameter values). The relation between these time scales give us some information about our model system: since
 ${\it\tau}_{D}\gg {\it\tau}_{{\it\mu}},{\it\tau}_{{\it\rho}}$
the dynamics is not believed to be limited by diffusion. Furthermore, these time scales form several non-dimensional numbers: the Ohnesorge number
 $\mathit{Oh}\equiv {\it\tau}_{{\it\rho}}/{\it\tau}_{{\it\mu}}={\it\mu}/\sqrt{{\it\rho}{\it\gamma}R}=0.52$
gives the ratio of inertia–capillary and viscous effects and the Péclet number
 $\mathit{Pe}\equiv {\it\tau}_{{\it\mu}}{\it\tau}_{D}={\it\gamma}R/D{\it\mu}=1400$
gives the ratio of advection and diffusion. By interpreting the characteristic speed as
 $U_{c}\equiv {\it\gamma}/{\it\mu}$
we obtain the ratio between viscous and inertial forces as the Reynolds number
 $\mathit{Re}\equiv {\it\rho}\,U_{c}/{\it\mu}={\it\rho}\,{\it\gamma}R/{\it\mu}^{2}=\mathit{Oh}^{-2}=3.7$
. Since
 $\mathit{Oh}\sim \mathit{Re}\sim 1$
, our system is in a regime where both inertial and viscous forces are important.
Two additional non-dimensional numbers appear in the phase field model. The Cahn number
 $Cn\equiv {\it\epsilon}/R$
gives the ratio between the interface thickness
 ${\it\epsilon}$
and the initial droplet radius
 $R$
, and
 ${\it\mu}_{f}\equiv {\it\mu}_{cl}/{\it\mu}$
is the ratio between the contact line friction parameter
 ${\it\mu}_{cl}$
and the viscosity.
We scale the governing equations and the results as
 $\hat{x}\equiv x/R$
,
 ${\hat{y}}\equiv y/R$
,
 $\hat{r}\equiv r/R$
,
 $\hat{t}\equiv t/{\it\tau}_{{\it\mu}}$
,
 $\hat{p}\equiv p{\it\tau}_{{\it\mu}}/{\it\mu}$
,
 $\hat{{\it\phi}}\equiv {\it\phi}{\it\epsilon}/{\it\gamma}$
, where
 $x$
,
 $y$
are the system coordinates,
 $r=r(t)$
is the wetted radius,
 $t$
is the time,
 $p=p(x,y,t)$
is the pressure and
 ${\it\phi}={\it\phi}(x,y,t)$
is the chemical potential;
 $(\hat{~})$
denotes a non-dimensional variable.
3. Simulation set-up
3.1. Atomistic description: molecular dynamics
We consider the wetting of water molecules on three different substrates: a substrate constructed by an integrated Lennard-Jones (LJ) 10–4 potential wall, a ‘rough’ fcc structure (111 interface) of LJ atoms with a spacing of 0.27 nm (figure 1
d) and a semi-realistic silica that consists of a monolayer of rigid
 $\text{SiO}_{2}$
quadrupoles set in a hexagonal formation with a spacing of 0.45 nm (figure 1
c). The silica differs from the LJ substrates in the ability to form hydrogen bonds with water, which limits the molecular motion on the substrate. The three substrates can be interpreted in terms of the liquid–surface friction, from none (10–4 LJ potential), to intermediate (LJ atomistic) and high (silica). The substrates are atomistically smooth and the 10–4 LJ potential wall interaction is described by
 $$\begin{eqnarray}U=2{\rm\pi}{\it\varepsilon}n\left(\frac{{\it\sigma}^{6}}{h^{4}}-\frac{2{\it\sigma}^{12}}{5h^{10}}\right),\end{eqnarray}$$
where
 $U$
is the interaction potential,
 $n=16~\text{nm}^{-2}$
is the area number density of integrated virtual LJ atoms,
 $h$
is the height of an interacting atom above the wall and
 ${\it\varepsilon}$
and
 ${\it\sigma}$
are Lennard-Jones potential parameters denoting the energy minimum and the bond distance between interacting particles.
To maintain the same equilibrium angle
 ${\it\theta}_{0}=37^{\circ }$
on all substrates, we adjusted the liquid–solid interaction strengths, which are directly related to the surface energies in the system. These energies are related to
 ${\it\theta}_{0}$
through Young’s equation
 ${\it\gamma}\cos {\it\theta}_{0}={\it\gamma}_{SV}-{\it\gamma}_{SL}$
, where
 ${\it\gamma}\equiv {\it\gamma}_{LV},{\it\gamma}_{SL},{\it\gamma}_{SV}$
are the liquid–vapour (LV), solid–liquid (SL) and solid–vapour (SV) surface tensions. The molecular interaction parameters of the substrates that yield
 ${\it\theta}_{0}$
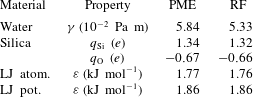
were determined by measuring the contact angle of small water droplets at equilibrium on the substrates. The final parameters are listed in table 2 for PME electrostatics. By keeping
 ${\it\theta}_{0}$
fixed we reduced our parameter space, allowing us to investigate the principal influence of the atomistic composition of our substrates on the wetting dynamics independent of surface energetics.
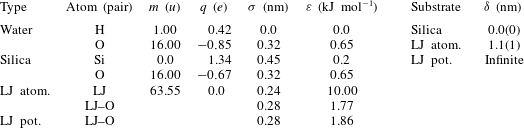
The first six columns give the interaction parameters for a generic LJ substrate atom, and the interaction parameters bond length
 ${\it\sigma}$
and energy
 ${\it\varepsilon}$
between different atom types are calculated using Lorentz–Berthelot combination rules. The LJ–O interactions of the potential and atomistic LJ substrates give an equilibrium contact angle
 ${\it\theta}_{0}=37^{\circ }$
. The final two columns give the slip length
 ${\it\delta}$
measured in MD simulations of water as a function of substrate composition, where the number in parentheses denotes the error.

To characterise the different substrates on the continuum length scales we measured their slip lengths
 ${\it\delta}$
. This property appears in the Navier boundary condition and quantifies the tendency of a liquid to flow along a substrate (Bachelor Reference Bachelor1967). The slip lengths of our atomistic substrates were measured using a Couette flow and are reported in table 2. Since the potential LJ substrate is frictionless it has an infinite slip length.
The quasi-2D droplet cylinder had a periodic width of 4.67 nm and a radius
 $R$
of 50 nm, in total consisting of 1.2 million water molecules. Before it was brought into contact with the substrate, the droplet was equilibrated at a temperature
 $T$
of 300 K by deploying a stochastic dynamics integrator with periodic boundary conditions to mimic an infinite quasi-2D system. After the initial equilibration, a leapfrog integrator was used for the time marching. To mimic the energy dissipation into a large substrate, we coupled the substrate atoms to a velocity rescaling thermostat, dissipating thermal energy using a 10 ps coupling time. The water molecules were not coupled to a thermostat. The electrostatic forces between the partial charges were calculated using the PME method, which takes the Coulomb interactions between all charges in the system into account. In addition, we tested a simplified approach using reaction-field (RF) electrostatics with a cutoff of 0.9 nm. Beyond the cutoff, this treatment assumes a dielectric medium with infinite dielectric constant, which leads to a linear reaction force to the Coulomb potential. The RF treatment is mainly used due to its computational efficiency, as it scales linearly with the number of atoms
 $N$
compared with
 $N\log N$
for the PME treatment. Reaction-field simulations give good results for systems with molecules that have zero net charge, which is valid here. However, they also require a high dielectric constant, which is not true for our droplets since we have both a liquid and a vapour phase. Among the measured equilibrium properties reported in table 1 only the surface tension coefficient
 ${\it\gamma}$
is affected by the electrostatic treatment, decreasing by
 ${\approx}10\,\%$
for the RF compared with the PME prediction. This decrease is related to an overestimation of the surface dipole (surface charge) with the RF treatment, due to favourable interactions between water molecules and the artificial dielectric medium in the vapour phase. It should be noted the surface dipole is absent in the continuum model that we introduce later, but we do not expect this to affect the model. To maintain the same equilibrium contact angle
 ${\it\theta}_{0}=37^{\circ }$
the water–substrate interaction parameters were slightly adjusted for the RF simulations compared with the PME values reported in table 3.
The MD simulations were performed using Gromacs 5.0.3 (Abraham et al.
Reference Abraham, Murtola, Schulz, Páll, Smith, Hess and Lindahl2015) in double precision and with a time step of 2 fs. Every 0.01 ps flow data were collected in bins of size
 $0.25\times 0.25~\text{nm}^{2}$
, then averaged every 1000 collection points to create 2D maps of mass flow, temperature and atom density with a temporal resolution of 10 ps. The simulations were run on the supercomputers Triolith at Linköping University and Beskow at the Royal Institute of Technology, Sweden. We simulated droplets composed of 1.2 million water molecules (3.6 million atoms) for
 ${\approx}8~\text{ns}$
, which on 640 cores took 2 days for PME and 1 day for RF electrostatics.
Material parameters of the MD systems with PME and RF treatments of the electrostatics. To keep the equilibrium contact angle fixed at
 ${\it\theta}_{0}=37^{\circ }$
the molecular interaction parameters of the substrate atoms are slightly adjusted for PME. The water liquid–vapour surface tension changes by approximately 10 % when comparing the PME with the RF treatment, while all other bulk properties are insensitive to the treatment of the electrostatics.

3.2. Continuum description: phase field model
To understand the link between the molecular contact line physics and the macroscopic droplet dynamics, we couple the MD description with a continuum phase field (PF) model, described further by Carlson et al. (Reference Carlson, Do-Quang and Amberg2011). The PF model is based on a phenomenological description of the free energy of the system
 $F=F(x,y,t)$
(Jacqmin Reference Jacqmin2000), which is a function of the non-dimensional concentration
 ${\hat{C}}={\hat{C}}(x,y,t)$
of the two phases interpreted as liquid
 ${\hat{C}}=1$
and vapour
 ${\hat{C}}=-1$
. These two phases are represented by the two minima in the bulk free energy
 ${\it\Psi}({\hat{C}})\equiv ({\hat{C}}+1)^{2}({\hat{C}}-1)^{2}/4$
. The assumption that a variation in concentration
 ${\hat{C}}$
is balanced by a flux, represented by the gradient of the chemical potential
 ${\it\delta}\hat{F}/{\it\delta}{\hat{C}}$
, gives the Cahn–Hilliard equation (Cahn & Hilliard Reference Cahn and Hilliard1958), represented here in a non-dimensional form,
 $$\begin{eqnarray}\frac{\partial {\hat{C}}}{\partial \hat{t}}+\hat{\boldsymbol{u}}\boldsymbol{\cdot }\boldsymbol{{\rm\nabla}}{\hat{C}}=\frac{1}{\mathit{Pe}}\boldsymbol{{\rm\nabla}}\boldsymbol{\cdot }\left(\boldsymbol{{\rm\nabla}}\frac{{\it\delta}\hat{F}}{{\it\delta}{\hat{C}}}\right)=\frac{1}{\mathit{Pe}}\boldsymbol{{\rm\nabla}}\boldsymbol{\cdot }(\boldsymbol{{\rm\nabla}}({\it\beta}{\it\Psi}^{\prime }({\hat{C}})-C_{n}^{2}{\rm\nabla}^{2}{\hat{C}})).\end{eqnarray}$$
Here,
 $C_{n}^{2}{\rm\nabla}^{2}{\hat{C}}$
is the energy cost of having an interface and
 $\hat{\boldsymbol{u}}=\hat{\boldsymbol{u}}(\hat{\boldsymbol{x}},\hat{\boldsymbol{y}},\hat{\boldsymbol{t}})$
is the non-dimensional velocity. A no-flux boundary condition is used for the chemical potential
 $\boldsymbol{{\rm\nabla}}\hat{{\it\phi}}\boldsymbol{\cdot }\boldsymbol{n}=0$
, where
 $\boldsymbol{n}$
is the boundary normal;
 $\boldsymbol{{\rm\nabla}}{\hat{C}}\boldsymbol{\cdot }\boldsymbol{n}=0$
is used for the sides of the domain in contact with ambient air and along the symmetry line. At the solid substrate we use the non-equilibrium wetting boundary condition (Carlson et al.
Reference Carlson, Do-Quang and Amberg2009, Reference Carlson, Do-Quang and Amberg2011)
 $$\begin{eqnarray}{\it\mu}_{f}Cn\left(\frac{\partial {\hat{C}}}{\partial \hat{t}}+\hat{\boldsymbol{u}}\boldsymbol{\cdot }\boldsymbol{{\rm\nabla}}{\hat{C}}\right)=-Cn\boldsymbol{{\rm\nabla}}{\hat{C}}\boldsymbol{\cdot }\boldsymbol{n}+\cos {\it\theta}_{0}g^{\prime }({\hat{C}}),\end{eqnarray}$$
where
 $g({\hat{C}})\equiv (-{\hat{C}}^{3}+3{\hat{C}}+2)/4$
is a function varying the surface energy for a wet or dry substrate. The left-hand side of (3.3) allows for local deviations from equilibrium. Here,
 ${\it\mu}_{f}$
is a scaled phenomenological contact line friction parameter and sets the time scale for the local relaxation of the interface to form the equilibrium contact angle
 ${\it\theta}_{0}$
at the substrate.
Since
 $\mathit{Re}$
is close to unity, viscous and inertial effects are of similar importance for the flow, which is described by the non-dimensional continuity and Navier–Stokes equations,
 $$\begin{eqnarray}\displaystyle & \displaystyle \boldsymbol{{\rm\nabla}}\boldsymbol{\cdot }\hat{\boldsymbol{u}}=0, & \displaystyle\end{eqnarray}$$
 $$\begin{eqnarray}\displaystyle & \displaystyle \mathit{Re}\hat{{\it\rho}}({\hat{C}})\left(\frac{\partial \hat{\boldsymbol{u}}}{\partial \hat{t}}+\hat{\boldsymbol{u}}\boldsymbol{\cdot }\boldsymbol{{\rm\nabla}}\hat{\boldsymbol{u}}\right)=-\boldsymbol{{\rm\nabla}}\hat{p}+\hat{{\it\mu}}({\hat{C}})\boldsymbol{{\rm\nabla}}\boldsymbol{\cdot }(\boldsymbol{{\rm\nabla}}\hat{\boldsymbol{u}}+\boldsymbol{{\rm\nabla}}\hat{\boldsymbol{u}}^{\text{T}})+\frac{\hat{{\it\phi}}\boldsymbol{{\rm\nabla}}{\hat{C}}}{Cn}, & \displaystyle\end{eqnarray}$$
 $\hat{p}$
is the pressure and
 $(\hat{{\it\phi}}\boldsymbol{{\rm\nabla}}{\hat{C}})/Cn$
represents the surface tension force. The density is a function of the different phases and is described as
 $\hat{{\it\rho}}({\hat{C}})=(1+{\hat{C}})/2+{\it\rho}_{g}/2{\it\rho}(1-{\hat{C}})$
, where
 ${\it\rho}$
is the liquid density and
 ${\it\rho}_{g}=10^{-3}{\it\rho}$
is the vapour density. We use a similar functional form for the viscosity,
 $\hat{{\it\mu}}({\hat{C}})=(1+{\hat{C}})/2+{\it\mu}_{g}/2{\it\mu}(1-{\hat{C}})$
, where
 ${\it\mu}$
is the liquid viscosity and
 ${\it\mu}_{g}=0.02{\it\mu}$
is the vapour viscosity. The droplet is assumed to be at ambient constant pressure (
 $\hat{p}=0$
).
Since there is molecular motion along the solid substrate we use a Navier slip condition for the velocity at the solid substrate,
 $$\begin{eqnarray}\boldsymbol{{\rm\nabla}}\hat{\boldsymbol{u}}\boldsymbol{\cdot }\boldsymbol{n}={\it\lambda}\hat{u} _{s},\end{eqnarray}$$
where
 ${\it\lambda}\equiv R/{\it\delta}$
is the non-dimensional slip length and
 $\hat{u} _{s}$
is the computed slip velocity at the substrate.
Together, the coupled Cahn–Hilliard and Navier–Stokes equations represent a phenomenological and isothermal model for the description of droplet spreading of an incompressible liquid. Following Carlson et al. (Reference Carlson, Do-Quang and Amberg2009, Reference Carlson, Do-Quang and Amberg2011), (3.2)–(3.6) are solved using a finite element method with a mesh size of
 $Cn/8$
and with the measured material properties from our equilibrium MD simulations (tables 1 and 2). Our continuum model has only one free parameter: the scaled contact line friction factor
 ${\it\mu}_{f}$
. To illustrate the shape of the droplet and the position of the moving contact line we define the interface along the contour of
 ${\hat{C}}=0$
.
Having thus defined the atomistic and continuum description of the wetting process, we want to characterise the mechanisms dominating the wetting dynamics by comparing the computed dynamics. In particular, we want to see whether the continuum contact line friction parameter
 ${\it\mu}_{f}$
adequately captures the molecular processes at the contact line as a function of the substrate composition.
4. Droplet spreading dynamics
4.1. Substrate physico-chemistry and electrostatic interactions
We begin by analysing the wetting dynamics of the MD model to characterise the influence of our different substrates and the electrostatic treatment. Two measures of the global dynamics of a wetting experiment are the wetting radius
 $r(t)$
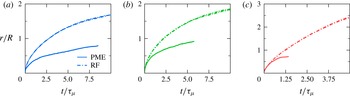
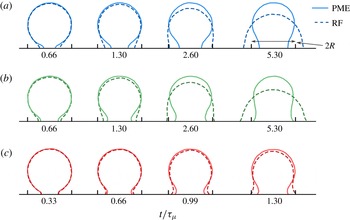
and the droplet interface shape. These measures are shown in figures 2 and 3 for all three substrates using both of the electrostatic treatments. Although all systems have similar equilibrium properties, we see a large influence on the wetting dynamics as a function of the substrate physico-chemistry and the electrostatic treatment.
The spreading radius
 $r(t)$
measured from MD simulations of water droplets with the PME and RF electrostatic treatments for the (a) silica, (b) atomistic LJ and (c) LJ potential substrates. Each panel contains two different simulations, and the curves for
 $r(t)$
are coincident. Although the equilibrium contact angle
 ${\it\theta}_{0}$
is fixed, it is clear that there is a large influence of the substrate physico-chemistry. In addition, we observe that the electrostatic treatment of the water molecules can significantly influence the spreading dynamics, where the full electrostatics (PME) predicts a spreading rate 2–4 times slower than the RF treatment.

Droplet shapes from the MD simulations with different electrostatic treatments, as they spread on three substrates with different compositions: (a) silica; (b) LJ atomistic; (c) LJ potential. The electrostatic treatment only affects the long-time regime, when
 $r/R>0.5$
, and the water–substrate physico-chemistry affects both the spreading rate and the dynamic droplet shape. The interface is extracted at the half-density contour of the droplet.

We will first focus on the influence of the substrate composition, returning to the difference between PME and RF electrostatics further on. We see that the contact line speed increases with the measured slip length
 ${\it\delta}$
(table 2), as the viscous resistance close to the substrate is reduced. Hydrogen bonds can form between water and substrate molecules on the silica, resulting in slower wetting compared with the LJ substrates. Even the organisation of LJ atoms in the substrates can greatly influence the dynamics, as we observe a more rapid wetting on the frictionless LJ potential compared with the atomistic substrates. For the PME spreading curves (figure 2) we see a transition from an
 $r(t)\propto t^{1/2}$
regime to a slower regime, while for RF there is no clear transition within the time simulated. The droplet shapes (figure 3) show that the speed at which a meniscus is formed is also related to the viscous friction, a process that is very slow on the silica substrate compared with either of the LJ substrates. Thus, we see a large influence of substrate physico-chemistry on both of our selected measures of the wetting dynamics. In all simulations we observe local temperature increase of the liquid at the contact line, which scales with the contact line speed. However, this increase is never more than a few per cent and is believed to have a negligible influence on the spreading dynamics.
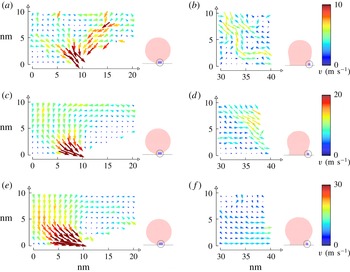
The flow field near the contact line extracted from the MD simulations for
 $r/R$
of 0.2 (a,c,e) and 0.8 (b,d,f), time-averaged over 200 ps: (a,b) silica; (c,d) LJ atomistic; (e,f) LJ potential. At short times, liquid molecules are transported to the contact line from above, near the droplet interface. At long times, the flow has changed characteristics and is parallel with the substrate. We note that the droplet spreading on the silica substrate is approximately half as fast as on the atomistic LJ substrate, and a third as fast as on the potential LJ substrate.

To understand how the flow affects the droplet shape, we have extracted the flow field from the PME simulations, since this is the closest description of a real water system. Time-averaged flow fields close to the contact line are presented in figure 4 for an early regime where
 $r/R=0.2$
and a later regime where
 $r/R=0.8$
. On the silica we observe that at early times there is a significant amount of fluid transported to the contact line along the droplet interface, not from the centre bulk of the droplet. In contrast, the flow becomes more parallel to the substrate at later times. On the LJ substrates the initial regime also entails some transport of fluid from the droplet interface, but it is small compared with the flow from the centre (bulk) of the drop created by the increased substrate slip.
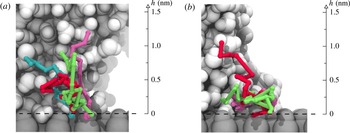
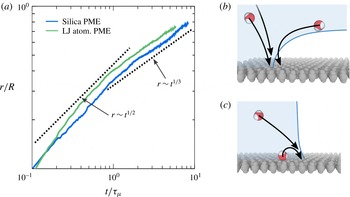
To further characterise the difference in the fluid motion in these regimes, we extract path traces of molecules attached at the contact line on the silica in the two different regimes (figure 5). Our analysis corroborates the flow fields in figure 4, suggesting different physical mechanisms of contact line advancement. In the early regime, most molecules approach the contact line through an advective flow. In contrast, the later regime shows that the contact line largely advances by molecules detaching from the substrate and attaching a single lattice spacing ahead of it. Thus, the main mode of contact line advancement in the slow regime appears to be diffusive. It should be noted that the initial speed of the droplet as it comes into contact with the substrate is much lower than the wetting speed and does not influence our results.
Molecular traces of selected water molecules at the contact line on silica, at
 $r/R$
of 0.3 (a) and 0.8 (b), corresponding to the sampled mass flow of figure 4(a,b). The paths are subdivided into steps of 1 ps and show a history of 10 ps in (a) and 20 ps in (b). (a) Molecules in the early wetting regime approach the contact line through an advective flow, coming from the droplet centre or from the droplet interface. (b) In the later regime we see a mixed process, where the majority of molecules are jumping between the potential minima of the silica substrate through a dissipative process. Only comparatively few molecules at the contact line are arriving through an advective flow from the droplet centre or interface.

(a) The spreading radius
 $r(t)$
for the PME MD simulation on the silica and the atomistic LJ substrate, represented in logarithmic coordinates to highlight two different spreading regimes. In the early regime, molecules are transported to the contact line from above before a foot is formed. After the formation of the wetting foot, molecules have to traverse through its geometry. To illustrate the different regimes, the dotted lines show different power laws with respect to time as
 $r\sim t^{k}$
. (b,c) Sketches of the molecular processes in (b) the short-time initial regime and (c) the long-time diffusive regime.

There is a salient point that we wish to highlight in these results. Our simulations resemble some of the regimes that have previously been identified in wetting dynamics, and we see that they correspond well to two different exponents for the wetting rate
 $r(t)\propto t^{k}$
, illustrated in figure 6. The short-time dynamics
 $k\geqslant 1/2$
indicates inertial effects (Bonn et al.
Reference Bonn, Eggers, Indekeu, Meunier and Rolley2009) or possibly a slip flow (Nakamura et al.
Reference Nakamura, Carlson, Amberg and Shiomi2013), while the late-time spreading rate has a smaller power
 $k\approx 1/3$
but does not follow the classical Tanner’s law which in 2D gives
 $r(t)\propto t^{1/7}$
(Tanner Reference Tanner1979; de Gennes Reference de Gennes1985). However, fluctuations (Davidovitch et al.
Reference Davidovitch, Moro and Stone2005) could shift the power-law dependence from
 $r\propto t^{1/7}$
to
 $r\propto t^{1/4}$
. The molecular motion in the late-time regime could resemble the phenomenological molecular kinetic theory (Blake & Haynes Reference Blake and Haynes1969), which advances the contact line by molecules jumping between potential wells on the substrate. The predicted contact line velocity
 $v_{\mathit{MKT}}=2{\it\kappa}^{0}{\it\Lambda}\sinh (({\it\gamma}(\cos {\it\theta}_{0}-\cos {\it\theta}))/(2nk_{B}T))$
is independent of the flow in the drop and is instead related to the dynamic contact angle
 ${\it\theta}$
, a molecular jump rate
 ${\it\kappa}^{0}$
, a displacement length
 ${\it\Lambda}$
, the site number density
 $n$
and the thermal energy
 $k_{B}T$
. We can estimate the values for these parameters from the PME MD simulations on silica as on average two water molecules form hydrogen bonds with one substrate oxygen molecule, which sets the number density as
 $n=11.4~\text{nm}^{-2}$
. These hydrogen–oxygen bonds between water and substrate molecules form and break at a rate of
 ${\it\kappa}^{0}\approx 0.1~\text{ps}^{-1}$
, measured in an equilibrium simulation. The displacement length is related to the site density, giving
 ${\it\Lambda}\approx n^{-1/2}=0.30~\text{nm}$
. For the later stage of wetting we measure a slowly decreasing contact angle of approximately 90° on the silica. Using these numbers, we estimate the contact line speed from molecular kinetic theory (MKT) as
 $v_{\mathit{MKT}}\approx 30~\text{m s}^{-1}$
, which is off by one order of magnitude compared with the MD simulation
 $v\approx 3~\text{m s}^{-1}$
(figure 2). It is not surprising that MKT predicts a higher velocity, since
 ${\it\kappa}^{0}$
only takes the detachment of a molecule into account, not the subsequently required rearrangement of the hydrogen bonding network. For the atomistic LJ substrate, we note that although the water shows some structuring, there is only a very weak separation of sites, so, rather than hopping, the water slides over the substrate, which is consistent with the observed slip.
One reason for the difference in spreading rate between PME and RF electrostatics in the later stage of wetting is a modified mechanism of advancing the contact line. To clarify the different mechanisms, we use the atomistic LJ substrate as an example, which simplifies the analysis since there are no electrostatic interactions with the substrate. Visual inspection of the trajectories from MD reveals that with RF the contact line is fluctuating and rough, while it is smoother with PME. Manually counting protrusions of 1 nm size at the contact line results in approximately one per 20 nm for PME and one per 10 nm for RF. A Fourier analysis of the contact line fluctuation shows that it is 12 % larger for RF with a 2.3 nm wavelength. To distinguish cause from effect, we simulated a slab of water in equilibrium, confined between two LJ walls separated by 4 nm to generate a contact angle of 60°. Here, we found 10 % larger Fourier components for RF compared with PME. The enhancement of fluctuations with RF is caused by a stronger electric field at the contact line, built up by the molecular electrostatics. For a liquid–vapour interface, we measured a four times stronger field with RF than with PME. With the slab geometry we observed the same factor of four for the field along the substrate at the contact line. Since RF uses a cutoff, the electrostatic interaction of a water dipole with the field is not four times, but twice as high with RF as with PME. This stronger interaction exponentially enhances fluctuations and in particular protrusions of water molecules out of the interface and ahead of the contact line along the substrate. The protrusions advance the contact line faster than the diffusive motion observed with PME. Although the higher fluctuations are an artefact of the RF, it is shown that fluctuations can not only quantitatively affect the flow, but also qualitatively, as with RF
 $r(t)\propto t^{1/2}$
without the change in exponent observed with PME. This is similar to the observation made by Davidovitch et al. (Reference Davidovitch, Moro and Stone2005) for thin film wetting, where thermal fluctuations in the film increase the spreading rate from
 $r\propto t^{1/7}$
to
 $r\propto t^{1/4}$
.
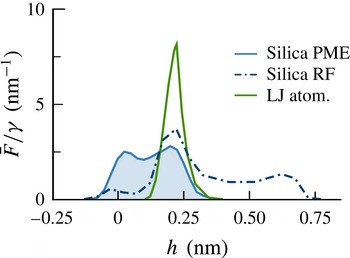
The force per area
 $\bar{F}$
, scaled by the surface tension
 ${\it\gamma}$
, which the substrates exert on a slab of liquid water separated by height
 $h$
from the substrate. On the silica, water molecules can penetrate the space between the upper oxygens, leading to a net force on the liquid in this region below substrate level. Although the driving force is of similar length for the atomistic LJ substrate and the silica with PME electrostatics, the dynamics varies greatly, which can only be connected to the substrate topology. Reaction-field electrostatics leads to a longer interaction range for the charged silica, driving flow over three molecular layers. It should be noted that the area under all curves equals
 ${\it\gamma}\cos {\it\theta}_{0}$
.

Up to now we have mainly looked at flows and the source of friction. With MD we can also quantify the different driving forces in the spreading dynamics by measuring the atomistic interaction forces at the substrate. The force working on the liquid normal to the solid substrate is evaluated as a function of the distance
 $h$
from the substrate, see figure 7. We observe that the interaction range depends on the substrate type, but that it is short,
 $0.25{-}1~\text{nm}$
, even on the PME silica, which is our most realistic substrate. This is independent of the total integrated net force, which is equal to
 ${\it\gamma}\cos {\it\theta}_{0}$
on all substrates. A strong artefact of RF electrostatics is that the force is spread over a longer distance than when using PME, and water molecules are pulled from additional liquid layers. In shear flow, as observed in the later stages of the wetting dynamics, this leads to a faster flow approximately proportional to the interaction range.
4.2. Comparison between MD and PF
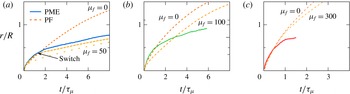
Next, we turn to a comparison between the PME MD spreading dynamics and the PF simulations, using the material parameters in table 2. By comparing the spreading rates for the PF simulation with
 ${\it\mu}_{f}=0$
and the MD simulation for the different substrates, we can clearly distinguish the two different wetting regimes. At short times (
 $r/R<0.5$
), the spreading radii compare favourably between the PF and MD simulations, while they deviate significantly at long times, as seen in figure 8. The contact line advances much faster in the PF simulations with
 ${\it\mu}_{f}=0$
than the corresponding MD simulations. A similar observation was also made when comparing PF simulations with spreading experiments on millimetre-sized water droplets (Carlson, Bellani & Amberg Reference Carlson, Bellani and Amberg2012a
,Reference Carlson, Bellani and Amberg
b
). To obtain a match for
 $r(t)$
between PF and MD we deploy a similar strategy to Carlson et al. (Reference Carlson, Do-Quang and Amberg2009) and adjust the local contact line friction parameter
 ${\it\mu}_{f}$
.
A direct comparison of the wetting dynamics predicted by the MD and the PF simulations: (a) silica; (b) LJ atomistic; (c) LJ potential. The wetting rates show that the short-time initial regime and the long-time regime of the wetting dynamics are captured by the PF model with separate friction parameters
 ${\it\mu}_{f}$
(given on the graphs). In (a), to illustrate the effect of a spatially varying
 ${\it\mu}_{f}$
we use a switch from
 ${\it\mu}_{f}=0$
to
 ${\it\mu}_{f}=50$
, which gives a matching spreading rate between the MD and PF models. Our results suggest that at short times there is a rapid equilibration of the interface, i.e.
 ${\it\mu}_{f}\sim 0$
, and a long-time relaxation where
 ${\it\mu}_{f}>0$
.

Since the short-time initial regime (
 $r/R<0.5$
) appears to be similar for the PF with
 ${\it\mu}_{f}=0$
and MD, we also introduce the contact line friction from that spatial point with a switch
 $(1-\tanh (33(\hat{x}+0.5)))/2$
multiplying
 ${\it\mu}_{f}$
, see figure 8(a). Thus, we assume that there is an initial fast relaxation, which slows down as
 $r/R>0.5$
and
 ${\it\mu}_{f}>0$
. Introducing this spatial switch gives a good agreement between PF and MD for
 $r(t)$
on silica. In a previous combined MD/PF study on a simple Lennard-Jones liquid, a good match was obtained with
 ${\it\mu}_{f}=0$
(Nakamura et al.
Reference Nakamura, Carlson, Amberg and Shiomi2013). This can be explained by the less structured liquid and the large, but not infinite, slip lengths of approximately half of the droplet radius.
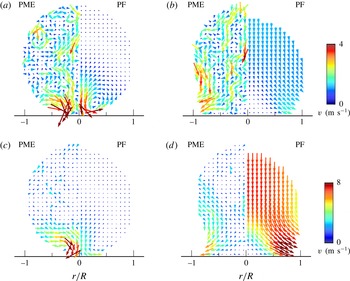
A comparison of the global flow from MD (left half of the droplets) and PF simulations (right half, extracted for
 ${\hat{C}}\geqslant 0$
): (a,b) silica; (c,d) LJ atomistic; shown for the early (
 $r/R=0.2$
) and later (
 $r/R=0.8$
) regimes of wetting for the atomistic substrates. To decrease thermal noise the MD flow was sampled over 300 ps for the early regime (a,c) and 500 ps for the later regime (b,d). For the silica, MD is matched against PF with the switched-on
 ${\it\mu}_{f}=50$
contact line friction factor seen in figure 8. While the wetting rates match qualitatively, the global flow is markedly different. For MD, fluid is pulled in from the sides of the droplet, thinning it out. Thermal fluctuations occur on a length scale comparable to the droplet size. For PF, a consistent global flow is quickly established. For the atomistic LJ substrate, MD is matched against PF, with
 ${\it\mu}_{f}=100$
. As the wetting is faster the thermal noise is decreased, and similarly to the silica a difference in the global flow between MD and PF is observed.

Next, we turn to a comparison of the droplet shapes and the flow fields predicted by the PF and MD simulations. The first thing one notices when looking at the flow fields in figure 9 is the thermal fluctuation in the flow visible on all length scales in the MD results, which is not present in the PF model. Although the wetting rates can be matched using the friction factor
 ${\it\mu}_{f}$
, the local dynamic contact angle differs between the MD and PF simulations. Moreover, a comparison of the flow fields (figure 9) illustrates that there appear to be different modes of mass transport to the contact line inside the droplet. As we have noted earlier, MD simulations indicate that the mass transport to the contact line is in the wall-normal direction and from the interface area of the droplet. The continuum simulations, on the other hand, predict that the liquid is transported from the droplet centreline and along the substrate. The mismatch in flow causes a mismatch in droplet shapes, where in MD the droplet initially thins from the sides by a local flow, whereas in PF the entire droplet moves towards the substrate as it spreads due to a global flow.
The different flow fields predicted in the atomistic and continuum descriptions help us to identify potential mechanisms that affect the dynamics. We want to highlight that the PF model is an ideal isothermal model, without any thermal fluctuations. Fluctuations might indeed be part of the reason why the flow and droplet shapes are predicted to be different for the methods. At short times, inertia dominates and molecular fluctuations are negligible in comparison, but as
 $r(t)$
grows the contact line speed slows down and fluctuations start to affect the droplet dynamics. Although we noted before that fluctuations in
 $r(t)$
are small when comparing different runs with the same parameters, the flow inside the droplet exhibits large fluctuations (see figure 9). Another source of discrepancy might stem from the effective material properties of the droplet, which can vary in the MD simulations, particularly close to interfaces, but are fixed for the PF model.
5. Conclusion
We have combined large-scale MD simulations and continuum PF theory to advance our understanding of the physical mechanisms that can influence the spreading dynamics of water droplets. To move one step closer to an experimentally realisable system, we model water droplets as they wet a silica-like substrate and compare with two simpler unrealistic Lennard-Jones substrates. Our results demonstrate that the wetting dynamics can be significantly affected by the molecular substrate composition, even when the equilibrium contact angle is the same. The silica substrate produces a no-slip boundary condition due to strong hydrogen bonding forces between the water and the substrate molecules. This not only leads to a slower wetting rate, but also qualitatively affects the droplet dynamics compared with the less realistic LJ substrates. We have demonstrated that the driving force for wetting on a silica monolayer has a range of a single molecular diameter, approximately 0.3 nm. A roughness of the substrate on this length scale can therefore effectively block the contact line from advancing, and partly explains why details on the atomistic length scale can have such a large influence on the global wetting dynamics. With PME electrostatics all effective interactions are short ranged, whereas the cutoff employed in the RF electrostatics leads to artefacts at the nanometre length scale that increase the wetting rate. In particular, enhanced thermal fluctuations at the contact line qualitatively change the contact line speed. Two wetting regimes are classified within the dynamics, an initial fast-wetting regime where the contact line advances through advection, followed by a slower regime where the contact line advances by a diffusive-like process.
On transferring the MD system to a continuum description, the slip length is the only material property, among the ones we model, that changes. However, direct comparison between the MD simulations and the continuum PF simulations highlights that an additional contact line friction term is needed to match the spreading radius in time, similar to when comparing with macroscopic experiments (Carlson et al. Reference Carlson, Bellani and Amberg2012a ,Reference Carlson, Bellani and Amberg b ). The continuum simulations help us to identify the different wetting regimes, where at short time there appears to be a rapid relaxation towards equilibrium, which is slowed down at long times. Although the spreading radius can be matched in time for the MD and PF simulations, there are discrepancies in the droplet shape and velocity profile. Part of the explanation for this discrepancy may stem from fluctuations in the MD simulations, which are not present in the continuum description. Although our droplets are large in the context of MD, they are small compared with most experimental set-ups. On increasing the droplet size we increase the influence of inertia, while decreasing that of large-scale thermal fluctuations. These two effects will make the MD behave more like the continuum model, with a flow parallel to the solid substrate near the contact line. However, the processes at the contact line that drive the wetting dynamics are scale invariant and will therefore affect droplets of any size.
The molecular system studied here is first of its kind to blend an experimentally realisable liquid and solid substrate together with a complete description of the electrostatic interactions, which can all have a great influence on the prediction of the droplet spreading dynamics. Our results describe the details of water as it spreads on substrates with different physico-chemistry, and highlight that there are many more questions related to non-equilibrium interactions between complex liquids and solids that remain to be understood in the context of dynamic wetting.
Acknowledgements
We are grateful for stimulating discussions with G. Amberg. B.H. thanks the Center of Smart Interfaces at the Technische Universität Darmstadt for support. This work was supported by the European Research Council (grant no. 258980) and the Swedish e-Science Research Center. Computer resources were provided through the Swedish National Infrastructure for Computing (SNIC 2014/1-30 and 2015/1-30).