Introduction
Haemonchus contortus, commonly known as the barber’s pole worm, is a major nematode parasite affecting ruminant production systems in tropical and subtropical regions worldwide. It evolved in sub-Saharan Africa and is distributed globally due to livestock migration and worm adaptation to different environments (Hoberg et al. Reference Hoberg, Lichtenfels and Gibbons2004). H. contortus infections in ruminants and livestock have been reported worldwide, with high infection rates of 84.6% and 76.4% in Iran and Brazil, respectively (Abbas and Hildreth Reference Abbas and Hildreth2022; Bhat et al. Reference Bhat, Tak, Bhat, Dar and Ahmad2022; Fiel et al. Reference Fiel, Guzmán, Steffan, Rodriguez, Prieto and Bhushan2011; Habte and Ibrahim Reference Habte and Ibrahim2018; Hosseinnezhad et al. Reference Hosseinnezhad, Sharifdini, Ashrafi, Atrkar Roushan, Mirjalali and Rahmati2021; Maciel et al. Reference Maciel, Giménez, Gaona, Waller and Hansen1996; Moreira et al. Reference Moreira, Mota, Gonçalves, Rocha and Borges2021; Shen et al. Reference Shen, Wang, Zhang, Peng, Yang, Wang, Bowman, Hou and Liu2017). Infected livestock experience significant health impacts, including loss of appetite, stunted growth, weakness, anemia, poor fertility, and even the death of lambs and kids, which cause significant economic losses to small ruminant farmers (Escribano et al. Reference Escribano, Saravia, Costa, Castells, Ciappesoni, Riet-Correa and Freire2019; Sanders et al. Reference Sanders, Xie, Gazzola, Li, Abraham, Flanagan, Rus, Miller, Hu, Guynn, Draper, Vakalapudi, Petersson, Zarlenga, Li, Urban, Ostroff, Zajac and Aroian2020). In particular, agriculture is increasing in Southeast Asia, including China, Indonesia, Malaysia, the Philippines, Thailand, and Vietnam, and H. contortus is a major obstacle to husbandry progress (Liang and Paengkoum Reference Liang and Paengkoum2019; Naeem et al. Reference Naeem, Iqbal and Roohi2020).
With the increase in the human population and the frequency of international trade, sheep and goats have become indispensable livestock products for humans, and the requirements for small ruminant products have increased worldwide (Zhu et al. Reference Zhu, Moawad, Wang, Li, Ren and Dai2018). H. contortus, one of the most severe infectious parasitic diseases in sheep, is effectively controlled using anthelmintics. However, long-term use of large amounts of anthelmintics has resulted in resistance in some countries (Ali et al. Reference Ali, Rashid, Shabbir, Shahzad, Ashraf, Sargison and Chaudhry2018; Chaudhry et al. Reference Chaudhry, Redman, Abbas, Muthusamy, Ashraf and Gilleard2015; Chaudhry et al. Reference Chaudhry, Redman, Kaplan, Yazwinski, Sargison and Gilleard2020). For example, H. contortus has been reported to be resistant to benzimidazole in Thailand and the United States of America, and to fenbendazole, albendazole, and mebendazole in India (Pitaksakulrat et al. Reference Pitaksakulrat, Chaiyasaeng, Artchayasawat, Eamudomkarn, Thongsahuan and Boonmars2021a; Yadav et al. Reference Yadav, Kumar, Uppal and Verma1995; Zajac and Gipson Reference Zajac and Gipson2000). The large population size of this parasite and the high level of gene flow between populations are likely to facilitate the emergence and spread of anthelmintic resistance (Blouin et al. Reference Blouin, Yowell, Courtney and Dame1995). Thus, insight into genetic variation and population structure is key to molecular epidemiology, which is beneficial for the prevention and control of haemonchosis.
Mitochondrial DNA, particularly the cytochrome c oxidase subunit 1 (COX1) gene, is commonly used as a genetic barcode in higher animal species (Hebert et al. Reference Hebert, Cywinska, Ball and deWaard2003). Pitaksakulrat et al. analyzed COX1 and identified 122 haplotypes from 130 H. contortus individuals in Thailand (Pitaksakulrat et al. Reference Pitaksakulrat, Chaiyasaeng, Artchayasawat, Eamudomkarn, Boonmars, Kopolrat, Prasopdee, Petney, Blair and Sithithaworn2021b). The COX1 gene was also used to illustrate the morphometric and molecular characteristics of H. contortus in Bengal (Nath et al. Reference Nath, Lee, Park, Choe, Ndosi, Kang, Bia, Eamudomkarn, Mohanta, Islam, Bhuiyan, Jeon and Eom2021). Ribosomal DNA, particularly the internal transcribed spacers 2 (ITS2), is also used for DNA barcoding in basal animal species (Hollingsworth et al. Reference Hollingsworth, Graham and Little2011). H. contortus was identified using PCR assays that amplified the ITS2 sequences with DNA from lamb fecal samples (Sweeny et al. Reference Sweeny, Robertson, Ryan, Jacobson and Woodgate2011), and ITS2 sequences have also been used to detect H. contortus in goats through loop-mediated isothermal amplification (Yang et al. Reference Yang, Qi, Zhang, Gao, Wang, Lei, Tan, Zhao, Fang and Hu2017). Both COX1 and ITS2 have been widely used in the study of intraspecific and interspecific genetic diversity and phylogenetic geography among different geographical populations (Liu et al. Reference Liu, Zhang, Liu, Chang, Su, Fu, Yue, Gao and Wang2016; Zheng et al. Reference Zheng, Chang, Zhang, Tian, Lou, Duan, Guo, Wang and Zhu2014).
In the present study, COX1 and ITS2 sequences were collected from the GenBank database and were analyzed to describe the genetic variation, population structure, and phylogeny of H. contortus. The results have important implications for understanding the molecular epidemiology and for controlling the spread of anthelmintic resistance in H. contortus worldwide.
Materials and methods
Data collection
The H. contortus sequences used in this study were retrieved from the NCBI database (https://www.ncbi.nlm.nih.gov/), a publicly accessible resource based in the USA. COX1 and ITS2 sequences were collected from the earliest available publication date until November 2, 2024. Search terms such as ‘COX’, ‘ITS2’, and ‘H. contortus’ were used to identify relevant sequences. To ensure data accuracy, sequences that did not align with the study objectives were excluded. For instance, sequences from other parasitic species that appeared in the search results were excluded from the analysis. Sequences were grouped according to their reported country of origin as indicated in the metadata associated with each GenBank entry retrieved from the NCBI database. Each sequence was assigned to a geographical group based on the sampling location specified in the original record.
Alignment and haplotype networking
The downloaded sequences were organized into separate categories using the EditSeq software, ensuring that each sequence type was stored in an individual file for subsequent processing. Each sequence type was truncated to a consistent length, and the files were saved in FASTA format using Molecular Evolutionary Genetics Analysis (MEGA) Version 11. To group sequences by geographical origin, DnaSP6 software was employed to generate and save haplotype files .arp and .hap formats (Rozas et al. Reference Rozas, Ferrer-Mata, Sánchez-DelBarrio, Guirao-Rico, Librado, Ramos-Onsins and Sánchez-Gracia2017). Notepad++ was used to convert these file formats into the Nexus format to facilitate further analysis (Maddison et al. Reference Maddison, Swofford and Maddison1997). A template file was created with haplotype and frequency distribution data added to the appropriate sections of the data module and trait locations. Finally, PopArt (Population Analysis with Reticulate Trees) software was utilized to construct the haplotype network. The configuration of properties, including character colors, label fonts, and illustration fonts, was adjusted using the Edit menu.
Phylogenetic analysis
Phylogenetic analyses were conducted using haplotype data for each sequence type in MEGA 11. Given its high accuracy and reliability, the Maximum Likelihood (ML) method was employed to construct two phylogenetic trees for COX1 and ITS2 sequences based on the available haplotype data (Bandelt et al. Reference Bandelt, Forster and Röhl1999). The analysis parameters were set under the ‘PHYLOGENY’ module, and 1,000 bootstrap replicates were performed to assess statistical support for branch stability. The gene sequences of Trichostrongylus colubriformis were used as the outgroup. Phylogenetic trees for both sequence types were saved in .nkw format, with branch haplotype colors modified using an online tool at https://www.chiplot.online/. Haplotype distribution across different countries was visually distinguished by color (Xie et al. Reference Xie, Chen, Cai, Cai, Hu and Wang2023).
Gene flow, diversity and neutrality analyses
Haplotype diversity (Hd), nucleotide diversity (π), Tajima’s D, Fu’s Fs, Fu and Li’s D (FLD), Fu and Li’s F (FLF), fixation index (FST) and other statistical values were calculated using DnaSP6. The two types of processed sequences were uploaded into DnaSP6, and Hd, π, and the number of mutations were determined using the ‘DNA Polymorphism’ option under the ‘Analysis’ menu. The number of parsimony-informative sites was obtained through the ‘Polymorphic Sites’ function. Tajima’s D was assessed using the ‘Tajima’s Test’ option, while FST was calculated under ‘Gene Flow and Genetic Differentiation’, Heatmaps were generated in R (v4.2.1) using the ‘pheatmap’ package, and hierarchical clustering was applied to assess genetic differentiation among geographic populations. Fu’s Fs, FLF, and FLD values were computed using ‘Fu and Li’s (and other) Tests’, COX1 and ITS2 gene sequences were recorded separately.
Results
Data collection
In this study, 890 sequences of H. contortus were examined, including 371 COX1 sequences from 9 countries and 519 ITS2 sequences from 26 countries (Table 1). All sequences were obtained from the NCBI database.
Accession numbers of COX1 sequences and ITS2 sequences of Haemonchus contortus used in present study

Haplotype analysis
Mutations were detected at 190 and 137 points in the COX1 and ITS2 sequences, respectively. A total of 324 haplotypes were identified in the COX1 haplotype network. The major haplotype in the network was Hap05, which contributed 2.43% (9/371), followed by Hap96, which contributed 2.16% (8/371). A single distinct haplotype accounted for 79.78% (296/371) of the total haplotype network. Individual haplotypes came from Nigeria (n = 219), Turkey (n = 3), Austria (n = 69), India (n = 1), Bulgaria (n = 1), Iran (n = 2), and New Zealand (n = 1). Most haplotypes (n = 262) in Nigeria clustered together, except for Hap86, Hap89, Hap98, Hap100, Hap108, Hap115, Hap123, Hap145, Hap160, Hap164, Hap196, Hap206, Hap215, and Hap234. A total of 74 haplotypes in Austria clustered together apart from Hap9 and Hap11 (Figure 1; Table S1).
Median-joining haplotype network of Haemonchus contortus based on COX1 (137 bp) sequences. Each circle represents a unique haplotype, and the size of each circle is proportional to the number of sequences sharing that haplotype. Colors indicate the country of origin (from 9 countries). Small black dots represent median vectors or hypothetical haplotypes inferred to connect existing haplotypes. Sequences were retrieved from the NCBI database. The scale bar indicates the relative size of circles corresponding to 1 and 10 samples, respectively.

The ITS2 network contained 72 haplotypes. The major haplotype in the network was Hap02, which contributed 39.02% (203/519), followed by Hap01 (15.80%; 82/519). A single distinct haplotype accounted for 7.51% (39/519) of the total haplotype network. Individual haplotypes came from the United States of America (n = 6), Malaysia (n = 1), Laos (n = 1), Egypt (n = 3), China (n = 7), Austria (n = 3), Thailand (n = 1), Ghana (n = 1), Mongolia (n = 1), Nigeria (n = 6), Iraq (n = 2), Bangladesh (n = 3), India (n = 1), Pakistan (n = 1), and Cameroon (n = 2) (Figure 2; Table S2).
Median-joining haplotype network of Haemonchus contortus based on ITS2 (116 bp) sequences. Each circle represents a unique haplotype, and the size of each circle is proportional to the number of sequences sharing that haplotype. Colors indicate the country of origin (from 26 countries). Small black dots represent median vectors or hypothetical haplotypes inferred to connect existing haplotypes. Sequences were retrieved from the NCBI database. The scale bar indicates the relative size of circles corresponding to 1 and 10 samples, respectively.

Phylogenetic analyses
The COX1 and ITS2 sequences were aligned to create phylogenetic trees, as shown in Figures 3 and 4. T. colubriformis was added as an outgroups to both phylogenetic analyses. In the phylogenetic tree of COX1, most of the haplotypes from Nigeria were in the same sister clade, except for Hap86, Hap89, Hap98, Hap100, Hap108, Hap115, Hap123, Hap145, Hap164, Hap196, and Hap215, which were divided into two distinct clades: Hap8 was one clade, and the other haplotypes were in the other clade. Most of the haplotypes from Austria were in the same sister clade, except for Hap9, Hap11, and Hap36. From the phylogenetic tree of ITS2, the clade was divided into two distinct clades: Hap57 was in one clade and the other haplotypes were in the other clade. Unlike the phylogenetic tree of COX1, there was no significant clustering of haplotypes across countries that were derived from the same country but were not in the same sister clade, such as Nigeria and Austria.
Phylogenetic tree of Haemonchus contortus sequences based on COX1 (137 bp), constructed using the Maximum Likelihood method. Trichostrongylus colubriformis was used as the outgroup. Colored branches represent haplotypes from different countries. Sequences were retrieved from the NCBI database.

Phylogenetic tree of Haemonchus contortus sequences based on ITS2 (116 bp), constructed using the Maximum Likelihood method. Trichostrongylus colubriformis was used as the outgroup. Colored branches represent haplotypes from different countries. Sequences were retrieved from the NCBI database.

Gene flow, diversity and neutrality analysis
The haplotype diversity of COX1 (0.9984) and ITS2 (0.8060) and the nucleotide diversity of COX1 (0.04634) and ITS2 (0.01700) were determined. To ascertain whether populations were under selection pressure, the values of Tajima’s D and Fu’s Fs were determined, −1.65634 and −32.367 for COX1, and −2.60400 and −32.248 for ITS2 (Table 2).
Diversity and neutrality indices obtained using nucleotide data of COX1 (137 bp) and ITS2 (116 bp) of Haemonchus contortus

Notes:** means p<0.05; *** means p<0.005.
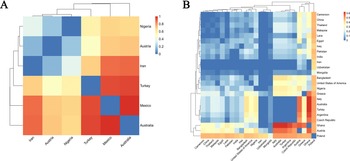
Pairwise FST values were calculated to assess the genetic differentiation among geographic populations based on COX1 and ITS2 datasets. In the COX1 dataset, high FST values were observed between distant populations, such as those from Mexico, Iran, Australia, and Nigeria, with values approaching 1 (Figure 5A; Table S3). In contrast, lower FST values were noted between geographically close populations, such as Austria, Iran, India, and Pakistan. For the ITS2 dataset, FST values were generally lower but still revealed a clear genetic separation between some European and Asian populations. The results are presented in the heatmaps with hierarchical clustering (Figure 5B; Table S4).
Heatmap visualization of pairwise genetic differentiation among Haemonchus contortus populations based on COX1 and ITS2. (A) Pairwise FST values among H. contortus populations from different countries based on COX1 sequences. (B) Pairwise FST values among H. contortus populations from different countries based on ITS2 sequences. The color scale indicates the level of genetic differentiation, with warmer colors representing higher FST. Hierarchical clustering was applied to group populations by genetic similarity.

Discussion
Parasitic nematodes cause socioeconomically important diseases in both humans and animals. Additionally, they also have a substantial adverse impact on human health and agricultural production worldwide. In domestic husbandry, H. contortus infects hundreds of millions of sheep and goats worldwide, causing substantial disease and production losses (Gilleard et al. Reference Gilleard, Kotze, Leathwick, Nisbet, McNeilly and Besier2021). The current study offers significant findings regarding the genetic analyses and global diversity of H. contortus, providing support for molecular epidemiology, which is beneficial for parasite control strategies.
Molecular epidemiological investigations are essential to identify H. contortus dissemination (Thang et al. Reference Thang, Hakim, Rahimi and Ichikawa-Seki2019). Nuclear and mitochondrial DNA markers have been used for nematode species identification and genetic diversity studies. Specifically, COX1 variations are good candidates for genetic diversity and population structure analyses in H. contortus. For instance, analyses of COX1 from Pakistani isolates revealed 91 haplotypes (Hussain et al. Reference Hussain, Periasamy, Nadeem, Babar, Pichler and Diallo2014). Research employing the COX1 gene identified 122 haplotypes from 130 Thailand individuals (Pitaksakulrat et al. Reference Pitaksakulrat, Chaiyasaeng, Artchayasawat, Eamudomkarn, Boonmars, Kopolrat, Prasopdee, Petney, Blair and Sithithaworn2021b). In Brazil, analysis of 142 individuals from Brazil for the COX1 gene revealed 73 unique haplotypes (Brasil et al. Reference Brasil, Nunes, Bastianetto, Drummond, Carvalho, Leite, Molento and Oliveira2012). ITS2 sequence variations can differentiate sympatric species within the Haemonchus genus. Using ITS2 data, Hussain identified three sympatric species of the Haemonchus genus: H. contortus, Haemonchus placei, and Haemonchus longistipes, with 12 distinct genotypes circulating among ruminant hosts in Pakistan (Pitaksakulrat et al. Reference Pitaksakulrat, Chaiyasaeng, Artchayasawat, Eamudomkarn, Boonmars, Kopolrat, Prasopdee, Petney, Blair and Sithithaworn2021b). Few studies have focused on ITS2-based haplotype and polymorphism analyses in H. contortus specifically. Moreover, ITS2 was used to analyze polymorphisms and haplotypes in other parasites; for instance, Clinostomum complanatum was determined to have four haplotypes from all 12 isolates in ITS2 sequences (Simsek et al. Reference Simsek, Yildirim, Yilmaz, Inci, Duzlu, Onder, Ciloglu, Yetismis and Pekmezci2018). Thus, the results of this study showed extremely high global haplotype diversity, with 324 and 72 haplotypes of the COX1 and ITS2 sequences, respectively. This high haplotype diversity demonstrates the rich genetic variation in the species.
H. contortus is characterized by a large population, high proliferation, and high levels of genetic variation in its mitochondrial and ribosomal genomes (Blouin Reference Blouin2002; Troell et al. Reference Troell, Engström, Morrison, Mattsson and Höglund2006). In this study, the haplotype network based on COX1 sequences revealed clear geographic clustering, with samples from the same country often forming distinct clades, despite the high overall haplotype diversity and genetic differentiation among distant populations. These results suggested that globalization-driven animal transportation or trade can significantly increase the risk of cross-border transmission of H. contortus. Therefore, it is crucial for international authorities to establish stringent quarantine protocols for animal parasites and to enhance monitoring systems for cross-border animal trade to effectively mitigate potential transmission risks. In contrast, the ITS2 haplotype network exhibited weaker geographic structuring, with more admixed haplotypes across regions. This suggests that COX1 may more accurately reflect local evolutionary histories, likely due to its higher mutation rate and maternal inheritance. The genetic structure of a population is determined by several factors such as environmental and geographical barriers, population size, and population life patterns (Doyle et al. Reference Doyle, Tracey, Laing, Holroyd, Bartley, Bazant, Beasley, Beech, Britton, Brooks, Chaudhry, Maitland, Martinelli, Noonan, Paulini, Quail, Redman, Rodgers, Sallé, Shabbir, Sankaranarayanan, Wit, Howe, Sargison, Devaney, Berriman, Gilleard and Cotton2020). Our phylogenetic and geographical analyses suggested that intensive animal trade and geographical barriers might have influenced the current distribution of H. contortus worldwide. Although previous studies reported high gene flow in both COX1 and ITS2 (Dey et al. Reference Dey, Zhang, Begum, Alim, Hu and Alam2019; Pitaksakulrat et al. Reference Pitaksakulrat, Chaiyasaeng, Artchayasawat, Eamudomkarn, Boonmars, Kopolrat, Prasopdee, Petney, Blair and Sithithaworn2021b), our findings indicate that COX1 exhibits clearer geographic structuring, while ITS2 shows greater haplotype admixture across regions. This contrast highlights the complementary value of both markers in resolving population structure at different spatial scales. Additionally, the genetic differentiation of H. contortus populations across various geographical regions emphasizes the necessity of implementing region-specific parasite surveillance and control measures. Future parasite management strategies should incorporate local genetic data to avoid the indiscriminate use of broad-spectrum anthelmintics, thereby minimizing the development and dissemination of drug-resistant parasite populations.
Neutrality indices such as Tajima’s D, Fu’s Fs, FLD, and FLF have been used to measure nucleotide variability and population expansion (Ramos-Onsins and Rozas Reference Ramos-Onsins and Rozas2002). Tajima’s D reflects the expansion or contraction of the population size, strength of selection, and population. Tajima’s D measures deviations from the standard neutral model by comparing the number of segregating sites and the average number of nucleotide differences. Positive values may indicate balancing selection or population contraction, whereas negative values typically reflect purifying selection or recent population expansion (Stephens et al. Reference Stephens, Schneider, Tanguay, Choi, Acharya, Stanley, Jiang, Messer, Chew, Han, Duan, Carr, Lee, Koshy, Kumar, Zhang, Newell, Windemuth, Shaner, Arnold, Schulz, Drysdale, Nandabalan, Judson, Ruano and Vovis2001; Vamathevan et al. Reference Vamathevan, Hasan, Emes, Amrine-Madsen, Rajagopalan, Topp, Kumar, Word, Simmons, Foord, Sanseau, Yang and Holbrook2008). In our study, Tajima’s D values were −1.656 for the COX1 gene, a result consistent with a previous study by Hussain, in which Tajima’s D values of the H. contortus COX1 gene were −1.786 in Brazil and −1.532 Pakistan (Hussain et al. Reference Hussain, Periasamy, Nadeem, Babar, Pichler and Diallo2014). This not only indicated that there was a high probability of population increase and expansion in the future, but also that it might continue to exist in the future due to animal movement between countries. The Tajima’s D value for ITS2 (−2.60400) was more negative than that for COX1 (−1.65634), indicating a stronger signal of recent population expansion in ITS2. Our analyses found highly negative and statistically significant differences in Fu’s Fs, FLD, and FLF values in both the COX1 and ITS2 haplotype groups, indicating that these populations were likely to expand globally. Although it is primarily recognized as a parasite in tropical and summer rainfall regions, the ecological adaptability of H. contortus is becoming increasingly important in a wide range of climate zones due to its high levels of genetic polymorphism and high biological potential. A possible further increase in its geographical range, especially due to climate change, could lead to an increased prevalence of haemonchosis in presently low-risk areas, as was the case in our study (Besier et al. Reference Besier, Kahn, Sargison and Van Wyk2016).
Evaluating the association between genetic differentiation (FST) and geographic distance across all pairwise population comparisons enables the assessment of regional equilibrium and helps to elucidate the relative contributions of gene flow and genetic drift to population structure (Hutchison et al. Reference Hutchison and Templeton1999). In this study, pairwise FST values were calculated based on both COX1 and ITS2 datasets to quantitatively assess genetic differentiation among geographically distinct H. contortus populations. The COX1 dataset revealed a strong genetic structure, with FST values approaching 1 between distant populations, such as Iran and Mexico, or Australia and Nigeria, suggesting limited gene flow and substantial genetic divergence. In contrast, lower FST values were observed between geographically proximate populations, such as those from Austria and Iran, or India and Pakistan, indicating potential historical or ongoing genetic exchange. The ITS2 dataset generally displayed lower levels of differentiation, consistent with its more conserved nature, but still revealed a discernible genetic separation between the European, African, and Asian populations. These findings align with the patterns observed in the haplotype network and phylogenetic analyses, collectively supporting the presence of distinct geographic structures driven by both ecological factors and geographic isolation.
In the present study, 190 different mutations were detected across the 137 bp COX1 sequences, and 137 different mutations were detected within the 116 bp ITS2 sequences. The high mutation rate may reflect the long and complex evolutionary history of H. contortus. Some countries, such as Nigeria, Austria, Thailand, and China, have a high number of haplotypes. The number of haplotypes detected in this study and in other countries, such as Italy, Australia, and France, was low. Among the COX1 sequences, Nigeria contained the largest number of haplotypes, followed by Austria. Regarding ITS2, Austria contained the largest number of haplotypes, while Nigeria had the third highest number of haplotypes. Environmental climate change is significantly related to haplotype diversity (Feng et al. Reference Feng, Huang, Lin, Yang and Ma2017), and the higher number of haplotypes and greater haplotype diversity may be due to the environmental climate in Europe. For example, Nigeria has only two seasons (dry and rainy); the rainy season spans from May to October, and the dry season spans from November to April in most parts of the country, which might lead to a significant effect on H. contortus and its hosts (Rose et al. Reference Rose, Caminade, Bolajoko, Phelan, van Dijk, Baylis, Williams and Morgan2016). Therefore, to guide the development of efficient livestock production systems, environmental and farm management innovations should be encouraged to mitigate climate fluctuations and integrate them into sustainable control strategies. Nevertheless, in different countries, it is unclear whether this result is related to the different lengths of H. contortus history, geographical distribution, and the number of samples collected. Given the extensive genetic diversity and environmental influences observed in different geographic populations, molecular markers such as COX1 and ITS2 not only enhance our understanding of the evolutionary history of H. contortus but may also serve as valuable tools for monitoring emerging threats such as anthelmintic resistance. Furthermore, considering the observed haplotype diversity and spatial patterns in both COX1 and ITS2 regions, these markers may serve complementary roles in the molecular surveillance of anthelmintic resistance. COX1, which exhibits high variability and clear regional clustering, could provide a reliable genetic background for tracking the emergence and spread of resistance-associated haplotypes within and across regions. Although ITS2 showed weaker overall geographic resolution, it may still be useful for detecting certain locally circulating genotypes. Future surveillance programs could benefit from integrating COX1 and ITS2 sequence data with known resistance-linked genetic markers to enhance early detection and geographic mapping of drug-resistant H. contortus populations.
In the present study, relatively short sequence fragments were used for phylogenetic and diversity analyses (137 bp for COX1 and 116 bp for ITS2). Although both markers are commonly employed in parasitological genetic studies, the limited sequence length may reduce the resolution and accuracy of phylogenetic reconstructions, potentially leading to underestimation or overestimation of genetic diversity. Short sequences may not fully capture the complete genetic variability of H. contortus populations, and subtle genetic differences may be masked. Therefore, future studies employing longer mitochondrial and ribosomal markers are required to validate and expand upon these findings.
Furthermore, the sequence data analyzed in this study were heavily skewed toward a few countries, particularly Nigeria, Austria, China, and Thailand, while many other regions were underrepresented. This sampling imbalance could bias the estimates of global genetic diversity and population structure, potentially exaggerating patterns in well-sampled regions and overlooking genetic variations in undersampled areas. To achieve a more accurate and comprehensive understanding of the global population dynamics of H. contortus, future molecular epidemiological investigations should prioritize the collection and analysis of more extensive and geographically balanced samples, along with the inclusion of additional genetic markers.
Conclusion
In conclusion, the present study is the first comprehensive global report on the genetic diversity and population structure of H. contortus. Our findings revealed that H. contortus populations exhibit significant genetic variation and rapid expansion potential, with distinct regional genetic characteristics. This knowledge serves as essential baseline data for future molecular epidemiological studies. Importantly, understanding the genetic differentiation across regions will guide the development of targeted parasite monitoring programs, facilitate the establishment of effective region-specific anthelmintic strategies, and aid in minimizing the risk of drug resistance emergence and global parasite transmission.
Supplementary material
The supplementary material for this article can be found at http://doi.org/10.1017/S0022149X25100357.
PCRediT authorship contribution statement
Wei Wei: Writing – review and editing, Writing – original draft, Visualization, Supervision, Project administration, Methodology, Investigation, Formal analysis, Conceptualization. Zhuo Lan: Writing – review and editing, Writing – original draft. Xue-Wei Liu: Formal analysis. Xin-Hui Zhang: Methodology. Xiang Gu: Formal analysis. Rui Wang: Writing – review and editing, Writing – original draft, Visualization, Validation, Software, Resources, Project administration, Methodology, Investigation, Formal analysis, Data curation, Conceptualization.
Financial support
Funding for this study was provided by key R & D and achievement transformation projects of Inner Mongolia, China (grant no. 2023YFDZ0048), National Center of Technology Innovation for Dairy (grant no. 2023-JSGG-5), Technology Support Project of Major Innovation Platform (Base) Construction (grant no. KCX2024016), the National Natural Science Foundation of China (grant no. 32160838), the Natural Science Foundation of Inner Mongolia, China (grant no. 2023LHMS03022, 2023LHMS03005 and 2021MS03088) and Research Project Funding for First-class Disciplines at Inner Mongolia Education Department (grant no. YLXKZX-NND-012).
Competing interests
None.
Ethical standard
This study did not require an ethical approval, as it was based on information/data retrieved from published studies already available in the veterinary public domain.