


Formatting errors were introduced into Table 4 during the production. The publishers apologise for these errors. The table should have been formatted as follows:
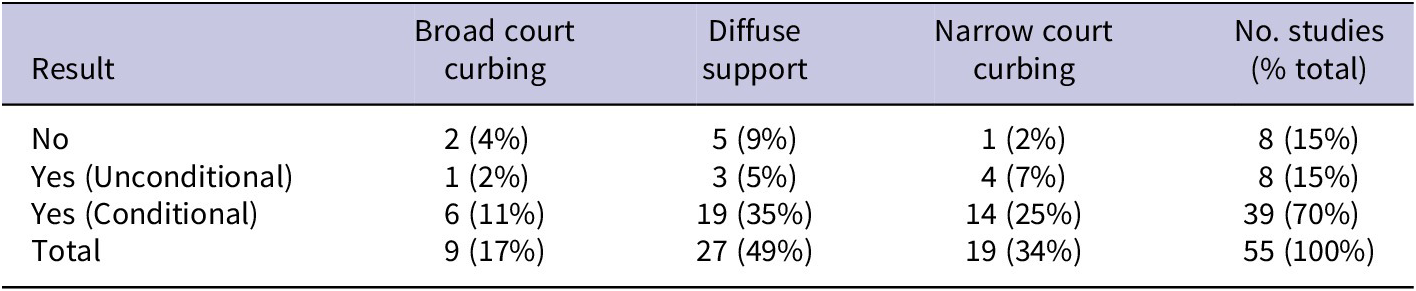
Distribution of Results by Dependent Variable Measures

Table 4. Long description
The table consists of four columns and four data rows.
Columns from left to right are:
1. Result category (No, Yes Unconditional, Yes Conditional, and Total).
2. Broad court curbing.
3. Diffuse support.
4. Narrow court curbing.
5. Total.
Data breakdown by row:
- No: Broad court curbing 2 (4 percent); Diffuse support 5 (9 percent); Narrow court curbing 1 (2 percent); Total 8 (15 percent).
- Yes (Unconditional): Broad court curbing 1 (2 percent); Diffuse support 3 (5 percent); Narrow court curbing 4 (7 percent); Total 8 (15 percent).
- Yes (Conditional): Broad court curbing 6 (11 percent); Diffuse support 19 (35 percent); Narrow court curbing 14 (25 percent); Total 39 (70 percent).
- Total: Broad court curbing 9 (17 percent); Diffuse support 27 (49 percent); Narrow court curbing 19 (34 percent); Total 55 (100 percent).
Statistical note: Chi-squared equals 2.673, p equals 0.614.
Note: Test for independence of dependent variable measures by results:
$ {\chi}^2 $
 = 2.673,
$ p $
 = 0.614.

 Open access

