

Introduction
The concept of judicial independence has been invoked as a key causal variable for important substantive outcomes ranging from regime stability to economic development and the protection of human rights (e.g., North and Weingast Reference North1989; La Porta et al. Reference La Porta2004; Gibler and Randazzo Reference Gibler2011). Researchers have also sought to understand the determinants of judicial independence (e.g., Ginsburg Reference Ginsburg2003; Helmke Reference Helmke2005; Vanberg Reference Vanberg2005; Hayo and Voigt Reference Hayo2007; Carrubba, Gabel, and Hankla Reference Carrubba2008; Clark Reference Clark2010); and, in light of its importance to various aspects of human welfare, the international community spends considerable resources each year promoting judicial reform and tracking its success (Carothers Reference Carothers2006). Despite this attention, researchers have continued to face vexing measurement challenges that complicate efforts to answer even very basic questions. A central obstacle is that judicial independence is not directly observable. A variety of measurement models for similar concepts have been offered (Treier and Jackman Reference Treier2008; Pemstein, Meserve, and Melton Reference Pemstein and Meserve2010); however, essential conceptual features of judicial independence, competing theoretical models of its emergence, as well as practical choices made by past measurement teams have resulted in a need for a new approach.
In this article, we introduce a measurement model for time-series, cross-sectional (TSCS) data that addresses the core challenges of measuring judicial independence globally. The model provides a principled way of dealing with the considerable measurement error in existing scores. It seamlessly accommodates indicators with varying amounts of data missingness, another critical concern of extant measures, and one that is linked importantly to measurement error (Ríos-Figueroa and Staton Reference Ríos-Figueroa and Staton2014). Since consecutive years’ observations of the independence of a state’s judiciary are highly unlikely to be independent, our model assumes that latent judicial independence trends smoothly within countries over time. Yet the model is also sensitive enough to uncover abrupt shifts in the latent characteristic from year to year, an important concern for testing theoretical models of judicial independence. The model also permits the calibration of extant indicators, so that a researcher who wishes to use any one of them—rather than our scale—will be able to compare and align each indicator’s measurement levels to any of the others. Finally, the model constrains estimates of the latent variable to lie on a bounded interval. This reflects the idea not only that judicial independence is a bounded concept but also that judiciaries at the extremes of the scale should be the judiciaries about which we have the least uncertainty.
We use the model to construct a unified measure of latent judicial independence that is available for 200 countries from 1948 to 2012. We provide estimates of uncertainty for each latent value. The latent variable estimates draw on a series of direct and indirect indicators of judicial independence collected by Feld and Voigt (Reference Feld2003), Howard and Carey (Reference Howard and Carey2004), Gwartney and Lawson (Reference Gwartney2007), Cingranelli and Richards (Reference Cingranelli and Richards2010), Marshall and Jaggers (Reference Marshall2010), Keith (Reference Keith2012), Johnson, Souva, and Smith (Reference Johnson and Smith2013), and the PRS Group (2013). In light of the model’s generality, we offer not only a global measure of judicial independence but a way for researchers to uncover the common element in many series of TSCS indicators of a latent variable of interest, assess which of these factors are more or less informative, and characterize the uncertainty in the resulting inferences. Beyond judicial independence, we envision a number of applications in comparative politics and international relations, including, among others, the level of democracy, degree of corruption, or military resolve.Footnote 1
Despite its flexibility, we emphasize that a successful use of the model requires that researchers first present a theoretically valid conceptualization of how the latent variable is expected to manifest, and why. Our model does not replace careful theoretical argumentation; in fact it depends on it. The next section identifies the concept of judicial independence we seek to measure and summarizes both the key measurement challenges we confront and our solutions. We then introduce the model formally and present and validate the results.
Judicial Independence and Its Indicators
There is disagreement over the precise definition of judicial independence (see discussions in Burbank and Friedman [Reference Burbank and Burbank2002] and Keith [Reference Keith2012]). Yet the notion is far from “essentially contested,” as in the case of the rule of law (Waldron Reference Waldron2002), a feature of that concept that greatly complicates its measurement (Nardulli, Peyton, and Bajjalieh Reference Nardulli2013). Scholars generally draw two broad sets of conceptual distinctions. The first relates to the difference between independent judging in practice (de facto independence) and the existence of a set of formal institutions—such as fixed budgets or cumbersome removal procedures—that are thought to provide incentives for independent judging (de jure independence). The second distinction directly concerns the de facto concept. In one common approach, judicial independence is conceived of as “autonomy,” where a judge is thought to be independent to the extent that her decisions reflect only her sincere evaluation of the legal record; that is, the decision process is free from undue external influence, especially from government (Rosenn Reference Rosenn1987; Kornhauser Reference Kornhauser and Burbank2002). Another approach requires not only that an independent judge be autonomous but that she can expect her decisions to be implemented properly, especially by sitting governments. In this second sense, judicial independence is conceptualized as “power.” Independent judges are not only autonomous but influential in the sense that their decisions greatly constrain the choices of other actors (Cameron Reference Cameron and Burbank2002).Footnote 2
We seek to measure the power concept of de facto independence. The power concept is of considerable interest on its own, but there are theoretical reasons to question whether it is feasible to measure autonomy alone. Expectations about the compliance process can influence decision making in the sense that an inability to fully control the implementation of orders can undermine decisional autonomy (e.g., Epstein and Knight Reference Epstein1998; Vanberg Reference Vanberg2005; Carrubba and Zorn Reference Carrubba2010). Insofar as this kind of model describes well the judicial politics of many states, it will be difficult to measure the autonomy of a court without simultaneously measuring its power. Whether independence is conceived of as autonomy or power, the fact that neither is directly observable poses significant challenges for accurate measurement. One methodological response has been to look for specific instances of judicial behavior (e.g., the choice of a peak court to invalidate a law) that under the right conditions, and under a particular theoretical logic, can indicate a form of independence.Footnote 3 Although plausible for a limited set of states, there is nothing close to a representative sample of judicial decisions for all countries, much less over time and for many courts in a state’s system. Nor does the approach generalize across countries in a systematic and consistent manner.Footnote 4
Scholars in need of global measures of judicial independence have therefore turned to expert assessments or nonjudicial proxies that are available for many states and years. Our approach calls for a method that can extract the shared information contained in these distinct efforts. Table 1 summarizes eight indicators of judicial independence, which are described and analyzed in Ríos-Figueroa and Staton (Reference Ríos-Figueroa and Staton2014). Five of the indicators were developed to directly assess judicial autonomy, influence, or both and thus reveal elements of the power concept of judicial independence. The Feld-Voigt and Keith measures target both elements of a power concept of independence.Footnote 5 The Howard-Carey indicator appears to target autonomy only, though again, it is unclear that this is theoretically possible. Cingranelli-Richards (CIRI) targets the power concept by measuring whether governments influence “case outcomes.” The specific concept targeted by the Global Competitiveness Report (GCR) measure is unclear.

Note.—The indicators are summarized more fully in Ríos-Figueroa and Staton (Reference Ríos-Figueroa and Staton2014).
The remaining three indicators may be said to reveal independence indirectly, under a particular theoretical argument. The Polity IV project’s executive constraints indicator (XCONST) was designed to measure the extent to which a state’s decision rules constrain executive discretion. One key element of constraint is an independent judiciary. Moreover, a common explanation of judicial independence suggests that features of a state that limit executive discretion, for example, legislatures that act independently, provide space for independent judging (Staton Reference Staton2006; Ríos-Figueroa Reference Ríos-Figueroa2007; Chávez, Ferejohn, and Weingast Reference Chávez, Ferejohn and Weingast2011). The PRS law and order measure captures important features of the legal system, including judicial independence, but it also measures popular observance of the law. The Contract Intensive Money (CIM) score reflects the proportion of money that is held in banking institutions.Footnote 6 The logic of this proxy measure is that individuals are more likely to keep their financial assets in banks when they believe that a state’s institutions for protecting property rights are credible. The judiciary is central among institutions designed to do so.
Measurement Challenges
In developing a valid cross-national measure of judicial independence over a significant period of time, we confront conceptual, theoretical, and practical challenges, deriving in part from the concept itself and in part from some features of past measurement efforts on which we will draw. These challenges generalize beyond the case of judicial independence, and for that reason, the model we develop is applicable to a variety of measurement challenges in TSCS data. This section elaborates on these challenges and summarizes how we address them.
Conceptual Challenges
Item response theory models in political science commonly have been used for estimating the ideologies of legislators, judges, or political parties from recorded votes (e.g., Bailey Reference Bailey2001; Martin and Quinn Reference Martin2002; Clinton, Jackman, and Rivers Reference Clinton2004b; Voeten Reference Voeten2007; Shor and McCarty Reference Shor2011) or of voters from survey responses (e.g., Jessee Reference Jessee2009; Bafumi and Herron Reference Bafumi and Herron2010). In these cases, the observable indicators of the latent characteristic are produced directly by the units of study: votes are cast; questions are answered. Although researchers may have an expectation of what the latent dimension underlying these outcomes represents, this meaning is ultimately not revealed until after fitting the model and interpreting the results. In comparative research, by contrast, the indicators of the latent concept are not produced by the units themselves, but rather by teams of scholars attempting to assess the underlying concept or by proxies. The meaning of the latent dimension is fixed a priori with reference to some concept, and the indicators are selected on the basis of theoretical judgment regarding how the concept is likely to manifest.Footnote 7
A number of complications emerge from this important distinction in the data-generating process. Most alarmingly, indicators produced by distinct teams may reflect different conceptual definitions of the latent concept. Another complication is that some research teams may simply be better at measuring certain concepts. One possibility is that the set of people knowledgeable about state A (e.g., Russia) is far larger than that about state B (e.g., Suriname). Or it may be that a concept is more relevant to politics in one place than in another and so the ease of measurement is not constant across places even for equally knowledgeable experts.
In our case, there is considerable evidence that teams have in general produced valid measures of the concept (Ríos-Figueroa and Staton Reference Ríos-Figueroa and Staton2014). Yet each relies on slightly different conceptual and operational definitions, even if they have been guided by broadly similar concepts of independence. The PRS targets more than judicial independence, looking for indicators of social order. The XCONST measure is concerned with executive constraints generally, and an executive can be more or less constrained independently of the judiciary. The Howard-Carey team propose that the provision of basic due process rights for the criminally accused is an element of judicial independence that is not necessarily consistent with standard approaches (see the discussion in Keith [Reference Keith2012, 152–53]). The CIRI measure mixes elements of de jure and de facto independence. In spite of these differences, we will make use of all the indicators to generate a measure of latent judicial independence. On their own and given a particular independence concept, each of the indicators might be a less valid measure of the underlying quantity; however, the measurement model is designed to extract relevant common information from all of them. As we will show, the model aligns the indicators on the latent scale, so that researchers can both interpret observed values of one indicator in terms of another and learn about the ability of each indicator to discriminate among different levels of independence (see fig. 4 below). In the event that particular indicators reveal different information about judicial independence, our model can help detect and evaluate these features of the data.
Another conceptual consideration is that the concept of judicial independence has natural boundaries. A judiciary can be only so dependent on a sitting government. Insofar as courts merely reflect the interests of the government, they can be no less independent. Similarly, a judiciary that is fully autonomous and capable of constraining the government’s actions on all policy dimensions is best thought of as an independent political entity. Once the judiciary is this powerful, little is gained conceptually from imagining further degrees of power. Indeed, previous teams have commonly taken this approach, generating categorical measures of independence, in which the highest value indicates “complete independence” (e.g., Howard and Carey Reference Howard and Carey2004; Cingranelli and Richards Reference Cingranelli and Richards2010; Keith Reference Keith2012). This is all to say that the concept of judicial independence has natural upper and lower boundaries.
Of course, many concepts in political science are bounded. Central bank independence provides a clear illustration. At some point, we should treat bankers either as the government itself or as themselves. Income cannot be more equally distributed than on a perfectly equal basis, nor can it be less equally distributed than when a single person controls all of a state’s resources. The ratio between the size of the winning coalition and the selectorate must lie on the unit interval (Bueno de Mesquita et al. Reference Bueno de Mesquita and Siverson2003). At the same time, because the meaning of the scale is known, researchers will often have a relatively clear idea of which countries belong at the top or bottom of the scale, in a way they might not when trying to determine who is the most “conservative” or “liberal” senator, for example (Clinton, Jackman, and Rivers Reference Clinton2004a). Departing from standard (unbounded) item response theory (IRT) models, our approach places bounds on the latent variable, to both improve the conceptual validity of the resulting measures and reduce the estimation uncertainty for countries near the ends of the scale. As we show, even if the underlying concept is unbounded, bounding the latent variable may do little harm to the scale and produce more sensible estimates of uncertainty.
Theoretical Challenges
Theories of judicial independence make radically different predictions about changes over time. One set of models suggests that the concept should evolve slowly, as judges carefully manage their case loads and decisions (e.g., Ginsburg Reference Ginsburg2003; Helmke Reference Helmke2005). Another set of models suggests that independence should grow or shrink abruptly, either because of shifts in exogenous political conditions (e.g., North and Weingast Reference North1989; Ginsburg Reference Ginsburg2003; Ríos-Figueroa Reference Ríos-Figueroa2007) or because critical pieces of new information radically transform a court’s authority (e.g., Carrubba Reference Carrubba2009). To test these claims, we require a systematic measure of the concept that is available for many states over a long time interval, that substantially reduces the error and noise in the individual indicators, and that is flexible enough to capture abrupt changes in judicial independence yet also capable of revealing relatively gradual trends. Unfortunately, the coarseness of extant indicators, as well as the prevalence of missing data evident in table 1, has largely prevented quantitative scholars from even simply describing temporal variation in the concept.
Temporal trending presents a particular problem for the measurement of latent concepts. The underlying characteristic of interest often changes gradually while still subject to occasional, sudden shifts. Manifest indicators, in contrast, contain both noise and measurement error and are therefore more prone to idiosyncratic yearly fluctuations. In many cases, individual indicators may make it appear that abrupt changes have occurred in the latent variable, when the reality is more subtle. Applying measurement models that assume each year’s latent values are independent within a country neglects the temporal aspect of TSCS data and does not necessarily provide for a smoothed latent trend.Footnote 8 Yet, since change really can be abrupt, we must be careful not to smooth away such events. Our approach explicitly allows the latent variable to trend over time, but in a way that also reveals abrupt changes when they occur. Our model is able to estimate any number of different trends in the latent variable over time, on the basis of the highly flexible random walk prior process. The practical benefit to analysts is the possibility of conducting within-country, temporal comparisons over relatively long time intervals.
Practical Challenges
Two final measurement challenges follow from the practicalities of prior measurement efforts. Again, as is evident in table 1, the availability of manifest indicators of judicial independence is highly uneven over time. Missingness is not random, and, critically, missingness is likely related to measurement error. Specifically, measurement teams are most likely to agree with each other in the developed world: considerable disagreement exists at low levels of economic development (Ríos-Figueroa and Staton Reference Ríos-Figueroa and Staton2014). The problem is that developing states are also the most likely to have missing data. Once again, this is a common problem in the measurement of concepts in comparative research. There are typically few theoretically relevant manifest variables per latent variable to begin with—perhaps no more than 10 or 15. Those that do exist rarely span the entire range of countries or years under investigation. Missing data in most comparative indicators are extensive (Honaker and King Reference Honaker2010). With such sparse data, a measurement model is preferred that will be robust to the presence of intervals when data are limited or nonexistent. Our model leverages patterns of agreement between indicators when data are available to help infer latent independence in years in which all extant indicators are missing, subject to the constraint that we have information on the indicators on either side of the period of missing data.Footnote 9
Finally, existing indicators of judicial independence commonly lie on ordinal scales. Our model is designed to synthesize a series of ordinal indicators to infer the values of an underlying, continuous latent measure. In the event that manifest variables are recorded at the interval level, they are often bounded—from above, below, or both. As noted by Pemstein et al. (Reference Pemstein and Meserve2010, 433), “although these scores take on many values and thus resemble interval scales, they do not necessarily provide interval-level information” about the latent variable. The main concern is that the association between a continuous indicator and the latent scale may not be linear; if it is not, then the functional form of the relationship will be unknown. To address this issue, we follow Pemstein et al. and partition manifest variables with interval scales into ordinal-level variables. Indicators containing more observations can be divided more finely into larger numbers of discrete categories, allowing the model to flexibly detect and adjust to nonlinearities in the data, as they arise. This also preserves a consistent interpretation of model parameters across manifest variables.
Model Specification
We describe a latent variable measurement model for comparative TSCS data that estimates smoothly trending values along a unidimensional, bounded interval scale. The latent variable xkt varies across both countries k = 1, … , K and years t = 1, …, T. Although x is unobserved, we assume there to be a series of R observed ordinal variables yr, also measured at the country-year level, that can be taken as discrete indicators, or ratings of the latent concept x. Individually, each observed variable (yr), say the Howard-Carey measure of judicial independence, is an imperfect and incomplete measure of the latent concept; but together, the observed variables are able to reveal variation in the level of the latent variable (x) across countries and over time. Our model provides a statistical mechanism for combining the observed variables for each country and each year ( ) to produce reliable estimates of the underlying level of the latent variable for that country and year (xkt
).
The observed indicators of the latent concept are chosen by the analyst on the basis of a prior theoretical expectation about the implications of larger or smaller values for the latent variable (xkt). Clearly, if we have access to multiple indicators that are specifically designed to capture a particular latent concept, then we are well advised to use them. But we might also consider proxy indicators, especially those that our theories suggest are manifestations of the underlying concept. For example, states with higher levels of democracy may exhibit more frequent leadership change. States with relatively high levels of social capital may have larger participation (per capita) in amateur sports clubs. States with lower levels of judicial independence might exhibit politically motivated purges or a pattern of decision making that is highly sensitive to government preferences. In none of these cases are the observable manifestations of the concept equivalent to the concept itself; however, we can have strong theoretical or conceptual justifications for including them nonetheless. We assume only that x and yr are positively associated (otherwise, treating yr as a manifestation of x is likely incorrect) and that certain indicators may be better or worse measures of the latent variable. This could be due to the inherent difficulty of learning about a particular yr or the possibility that the theory relating x to yr is misguided. We require no other micro-level assumptions about the actual process by which xkt results in  .
To link the latent xkt
to the manifest  , we specify a bounded graded response IRT model. A series of item coefficients, β
r, capture the reliability, or discrimination, of indicator r as a measure of x. Treier and Jackman (Reference Treier2008, 205) describe this parameter as “the extent to which variation in the scores on the latent concepts generates different response probabilities” in the outcome variables. Larger estimates of βr reveal a closer relationship between x and yr. The inverse of this parameter has an equally intuitive interpretation as the “personal error variance” of rater r (Pemstein et al. Reference Pemstein and Meserve2010, 431). A more “noisy” relationship between x and yr is indicated by estimates of βr that are closer to zero. Since we assume that x and yr are positively associated, we restrict βr ≥ 0. This also serves as an identifying restriction for the rotational invariance of the underlying scale.
Denote as Mr the total number of outcome categories for the rth manifest variable, yr. Also let τrm represent the threshold values for item r in the graded response model, with m = 1, … , Mr. The τrm divide adjacent ratings on the latent scale, subject to the constraint that  . Then the link function is written

As xkt
increases, so does the probability of observing larger-numbered outcomes m on the manifest  . The only observed values in equation (1) are the
 on the left-hand side; all other parameters are estimated by the model. We fix τ
r0 = −∞ and τ
rMr
= ∞, and we estimate the remaining Mr
− 1 threshold parameters for each yr
.Footnote 10 The estimated threshold levels τ
rm
will align the observed ratings across the manifest variables, and the spacing between the thresholds for each variable can help indicate which category distinctions are more or less substantively meaningful, relative to the other yr
. We illustrate how below.
To estimate xkt and other auxiliary parameters of interest, we adopt a fully Bayesian approach. Theoretical considerations suggest that x is naturally bounded by a logical minimum and maximum value. Since x is a conceptual variable, we arbitrarily place its lower bound at zero (“none” of the latent characteristic) and its upper bound at one (“all” of the latent characteristic). We achieve a smooth trend in our estimate of the latent variable by assuming it to follow a Bayesian random walk prior process, a form of dynamic latent trait model (e.g., Martin and Quinn Reference Martin2002; Rosas Reference Rosas2009). Within country k, we assume that the latent value x in year t has a normal, but bounded, prior distribution that is centered at the previous value of the latent variable in year t − 1:

The notation  indicates that xkt
cannot exceed the unit interval.Footnote 11 For year t = 1 we assume a noninformative normal prior, also truncated beyond zero and one. The variance parameters
 , which are estimated separately for each country, capture the amount of temporal variation in xkt
. In countries where xkt
is relatively unchanged from year to year—typically because of countries remaining at the maximum or minimum level of x for the entire period of observation—values of
 will be close to zero. In countries where xkt
experiences more substantial or rapid yearly changes,
 can be larger. Letting
 vary by country ensures that countries where xkt
varies greatly are not oversmoothed by comparison to countries where xkt
is more stable. The σ
k
are each assigned uniform priors on the unit interval. This approach will allow for the detection of both smooth and abrupt changes, as is evident in figure 3 below. However, if there is reason to believe that a country has experienced a sudden, “known” break in the time series—as when transitioning from dictatorship to democracy, for example—it may be preferable to divide the country into two periods, estimate the latent variable separately for each subunit, and then reassemble those x values following estimation.
The Bayesian specification allows us to seamlessly handle the frequent occurrence of missing data (Jackman Reference Jackman2000). In each country-year, up to R manifest ratings  are observed. Country-years with greater numbers of observed
 will have more information from which to update xkt
, based on the estimated β
r
. When many
 are missing, the posterior estimate of xkt
will be closer to its prior distribution.Footnote 12 In cases in which every yr
is missing for a given country-year, the random walk process bridges the gap by connecting estimates of xkt
from the last year in which any yr
were observed to those in the next year with an observed value of yr
.
We finalize the model by placing prior distributions over β r and τ rm . The threshold parameters are assigned vague normal priors. To satisfy the constraint that τ rm are increasing over m, we re-sort the thresholds in each iteration of the estimation algorithm, as described by Curtis (Reference Curtis2010). For the item and country parameters β r , we assume moderately informative half-normal priors with variance 0.1. This ensures that the coefficient vector is strictly positive. When there are relatively few manifest variables, as in most comparative research, sensibly chosen prior distributions can prevent coefficient estimates from increasing indefinitely (Bailey Reference Bailey2001). We find that any priors more diffuse than this may allow estimates of β r to grow unrealistically large.
Applying the Model
We apply the model to the eight selected indicators of judicial independence listed in table 1. We thus investigate 200 countries over the 65-year interval from 1948 to 2012. Because many countries were not in existence for the entire study period, there are a total of 9,815 potentially observable country-years in the data set. Between the eight indicators, data coverage is most consistent in the mid-1990s. If every manifest variable had been measured in every country-year, there would be a total of 78,520 observed values of  . In actuality, we observe only 33,354, for an overall missingness rate of 58%. This missingness is distributed unevenly across the eight indicators, with GCR missing fully 94% of the possible country-years and XCONST observed for all but 14%.
Four indicators were coded as ordinal-level variables by their original authors. We convert CIM into an eight-category measure with the first category for values lower than 0.3. The remaining seven categories bin observations into increments of 0.1 on the original scale, up to one. This variable is highly left-skewed, as only 1.4% of observed values fall into the first group. Another 3.4% are in category 2, and 5.5% are in category 3. Feld-Voigt and GCR are divided into six categories of equal width from their minimum to maximum values. Feld-Voigt is recorded as a single value for each country that we assume to have held constant from 1980 to 2003. PRS is already nearly categorical (most values are integers from one to six), so to generate an ordinal measure, we round each rating up to the nearest whole number. The results of our analysis are robust to the categorization rule.
A Latent Measure of Judicial Independence
We estimate the full Bayesian model using a Markov chain Monte Carlo sampling procedure, implemented in the JAGS and R software packages (Plummer Reference Plummer2012; Su and Yajima Reference Su2012; R Core Team 2013).Footnote 13 Our analysis is based on the posterior distribution of parameters xkt
, β
r
, τ
rm
, and  .
Assessing Model Fit
To evaluate the fit of the model, we compare the observed distribution of each indicator variable (yr
) to the predicted distributions based on the model estimates. For each country and year in which a manifest variable ( ) is observed, we resample values of each parameter estimate from their joint posterior distribution and enter them into the data-generating process in equation (1). This produces one set of predicted values for each extant indicator. For example, XCONST is observed for 8,410 country-years, so we generate 8,410 hypothetical values of XCONST based on the fitted model. We then tabulate the frequency with which each rating is predicted for each outcome variable and repeat this simulation a large number of times. This produces a posterior predictive distribution over the possible outcomes of all eight manifest variables.
If the model fits the data, there should be no systematic discrepancies between the observed yr and the posterior predictive distribution. This is what we find (fig. 1). Of the 42 possible ratings, the observed rating frequency falls within the interval spanned by 95% of the posterior predicted frequencies for 41, or 98%, of the ratings. There is no indication that the model is generally prone to over- or underpredicting extreme ratings on the manifest variables, a potential concern given the bounded nature of the latent variable.
Comparison of the observed distributions of the manifest variables (gray bars) to simulated values from the fitted model. Points denote the mean predicted frequencies; vertical lines span 95% of posterior predicted values.

Of the eight manifest variables in our analysis, CIM is arguably the most likely to contain information on a distinct concept. As we note above, to use CIM as a proxy for judicial independence requires a model of how mass financial behavior responds to the performance of the judiciary. This model may not be correct. We investigate the sensitivity of our latent variable estimates to the information contained in the CIM variable by refitting the model excluding CIM. Estimates of  from this specification are highly similar to estimates from the original model. The correlation between the two sets of estimates is above .95 in more than half of the countries and .97 across the complete set of country-years. In future applications in which missing data are especially pervasive, including additional manifest variables can help guard against any single indicator having too great an influence on estimates of the latent variable.
Cross-Sectional Results
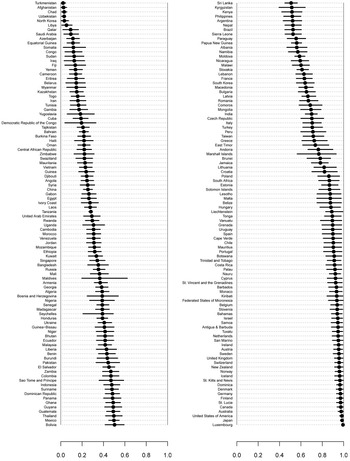
The model produces estimated levels of judicial independence for every country and year in our data set.Footnote 14 As an initial validation of our results, we plot the estimates for 2010, along with an associated measure of uncertainty (fig. 2). The ordering predictably places countries such as North Korea and Libya at the low end of the scale and countries such as Japan and the United States at the top.
Estimates of judicial independence in 192 countries in 2010. Error bars indicate 80% posterior credible intervals.

The countries that are estimated to have the highest and lowest levels of judicial independence are also estimated with the smallest amount of posterior uncertainty. This is just as we should expect: the countries that are more difficult to measure are those toward the center of the scale. However, this result is precisely the opposite of what is found by standard IRT models that assume that the latent variable is unbounded. In the analysis of Pemstein et al. (Reference Pemstein and Meserve2010), for example, the levels of democracy in countries at the absolute top and bottom of the scale are estimated with the greatest amount of uncertainty. This is attributable to the “truncation inherent in the individual component scales” (440). Once countries reach the limits of the scales, there is no more information from which to distinguish one highly democratic country from another. But in our analysis, when countries consistently demonstrate features that reveal very low or very high levels of judicial independence, the estimator can reliably place those countries at precisely the most extreme position on the latent scale.
Temporal Trends in Judicial Independence
Theories of judicial independence commonly make predictions about changes over time; however, the coarseness of the extant indicators, as well as the prevalence of missing data, has largely prevented quantitative scholars from even simply describing temporal variation in the concept. Our model is able to estimate any number of different trends in the latent variable over time, on the basis of the highly flexible random walk prior process. The practical benefit to analysts is the possibility of conducting within-country, temporal comparisons over relatively long time intervals.
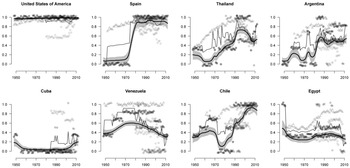
To illustrate, we select eight countries with a variety of temporal patterns of judicial independence and plot the estimated judicial independence, surrounded by an 80% posterior credible interval (fig. 3).Footnote 15 The observed data, rescaled to the unit interval, are shown as points. We also compare our estimates to a naive descriptive estimate obtained by averaging together the available manifest indicators for each country-year. In each case, the assumptions of the model lend considerable statistical power to the estimator, filtering away a large amount of measurement error and stochastic noise and allowing us to uncover small or higher-order trends with much greater reliability.
Trends in judicial independence in eight countries. Points denote the observed data, rescaled to the unit range, and jittered for improved visibility. For indicators that were originally continuous, we plot the original values rather than the ordinal yr . More darkly shaded points indicate manifest variables with larger item discrimination, β r . Seven of the eight yr are shown as circles, but we distinguish CIM by plotting it with triangles. The thick black line represents estimates of the latent xkt , with an 80% posterior credible interval. The thinner, jagged line shows the result of rescaling each of the original eight indicators to the unit range and then taking the average of the observed values in each country-year.

The model reveals a number of temporal trends that should be familiar to judicial scholars. The first column highlights largely temporally invariant patterns that emerge at the top and bottom of the latent scale over the entire period of observation. For the United States, most observed indicators cluster together at the top of the scale, in line with the general consensus that the American judiciary, at least relative to the world, was considerably independent over the last 50 years. The Cuban series reflects a state with very low judicial independence. By 2010, Cuba’s judiciary is estimated to resemble the judiciaries of the Central African Republic and Iran (fig. 2). Cuba also allows us to consider the consequences of simply averaging the indicators and of including hybrid manifest variables in the model. Starting in the 1980s, the light gray points near the top of the figure represent the PRS measure, which detects orderly societies as much as societies in which judiciaries are independent. When data are scarce, the mean will be overly sensitive to individual, discrepant indicators—here, spiking upward as soon as PRS enters the data set. In contrast, as PRS exhibits low discrimination in our model and is in great disagreement with the remaining indicators, our trend line largely ignores its claims about Cuba. Toward the end of the Cuban series, the latent variable estimate increases slightly, as XCONST reports a middling value for Cuba beginning in 2005. This reflects its assessment that Raúl Castro had less control over the Politburo than Fidel. Although this information is not directly related to judicial independence, under our theoretical orientation, a decrease in executive discretion can induce an increase in independence. Critically, the model produces larger bands of uncertainty at the end of the 2000s, which captures the ambiguity among the indicators about this trend.Footnote 16
It is more common for judicial independence to vary over time, in response to significant domestic political events and shifts in government policy. The second column displays cases in which there is a prolonged, unidirectional upward or downward trend. The change is abrupt in Spain, responding very strongly to its transition to democracy in the period immediately following Franco’s death. This change likely reflects explicit efforts of reformers to change the nature of constitutional control in Spain via a system of centralized constitutional review (Guillen Lopez Reference Guillen Lopez2008). But it also reflects the fact that both the Spanish legal culture and Spain’s judiciary were not entirely lined up with the Franco regime. There was clearly a segment of the Spanish judiciary willing to place limits on the state if given the chance (Larkins Reference Larkins1996, 612). If these accounts are correct, then we should have observed an abrupt change in Spanish judicial independence upon the transition to democracy.
Venezuela reflects a different path. The Chavez period was associated with a gradual erosion of judicial independence, through court packing at various levels and targeted purges (Taylor Reference Taylor2009). This change is picked up by the latent measure. The average reflects the noise in the underlying series, which suggests massive drops in 1980 and 2009, which return to previously high levels only in the following year. The Venezuelan panel reveals another subtle feature of the model. While the average tracks the two (and only) observed indicators during the 1960s and 1970s, the smoother from our model is consistently lower. The reason is that observed values between 0.7 and 0.8 on the rescaled XCONST and CIM measures are associated with middling scores for the other indicators. For this reason, the model estimates independence in Venezuela to be closer to the center of the scale during this period.
The remaining four examples show states in which judicial independence has turned, sometimes multiple times, and demonstrates the capacity of the model to identify nonmonotonic patterns in judicial independence. The Chilean series reflects constraints on the judiciary imposed by the Pinochet regime, which were removed considerably after the transition (Scribner Reference Scribner2011).Footnote 17 It also suggests that the judiciary has become an increasing source of constraint in Chilean politics as the years have passed (e.g., Huneeus Reference Huneeus2010; Couso and Hilbink Reference Couso2011). The Thai panel reflects a slightly different pattern. The 1997 Thai constitutional reform was designed to confirm democratic changes in the regime following the Black May Uprising of 1992 and gave new authority to the judiciary to investigate allegations of political corruption. The estimates reflect a sharper increase in judicial independence beginning at the end of the 1980s and peaking in the 1990s. Ginsburg (Reference Ginsburg2009, 96) argues, however, that what gains might have been made in the period following the 1997 reform were undermined by Prime Minister Thaksin, who came to power in 2001. He writes, “Gradually, Thaksin began to influence all the independent political institutions, including the Constitutional Court and those designed to prevent corruption.” As in Cuba, using only the average trend produces a series of misleading peaks and valleys because of the relative paucity of data prior to 1980.
The model can also distinguish more subtle trends in judicial independence, as in Egypt. The Egyptian series suggests a slight rise beginning around 1980, followed by a fall starting in the late 1990s. About this period, Brown (Reference Brown2002, 151–52) describes, “After 1979 (especially after the mid-1980s when the new appointment procedure had begun to seriously affect the composition of the [Constitutional] Court), the Court rapidly distinguished itself as the boldest and most independent judicial actor in Arab history.” Yet in the late 1990s, “The presidency of the Supreme Constitutional Court fell vacant with the retirement of the activist ʿAwad al-Morr. The vacancy was used to pressure the Court into accepting a diminution in its authority to issue retroactive judgments.”
Argentina’s panel is highly informative and speaks directly to the validity of the measure. We would expect a measure of governance in Argentina to be extremely unstable: observing the peaks and valleys in figure 3 is not surprising. And in light of theories like that presented in Helmke (Reference Helmke2005), we would expect to observe changes in the series as regimes destabilize. It is particularly interesting that the estimate detects an upward change in judicial independence beginning in 1980, prior to the fall of the junta. This is consistent with Helmke’s argument, but it is also important to note that the measure responds to features of Argentine judicial politics that are independent of regime change. Chávez et al. (Reference Chávez, Ferejohn and Weingast2011) argue that patterns of judicial independence in Argentina have tracked the fragmentation of government closely, precisely because it was difficult to discipline the court in the absence of interparty coordination. Specifically, they argue that since government was divided during the Alfonsín era (1983–89), the judiciary found space to “challenge the executive” (237). Yet, during the Menem period (1989–97), when government was unified, judicial independence became more compromised. Our estimates support these claims. There is a pronounced increase in judicial independence beginning in the early 1980s, followed by an abrupt change at the end of the decade, precisely when the president began to pack the Supreme Court.
Assessing the Indicators
The model returns information not only about latent judicial independence but about the indicators themselves. Indeed, inferences about the latent variable depend on the relationship between x and each of the manifest yr in country k. This is captured in our model by the discrimination parameters β r and threshold values τ rm . In descending order, the teams’ estimated discrimination parameters are XCONST (12.2), CIRI (6.5), Keith (6.24), Howard-Carey (5.1), CIM (4.6), PRS (3.8), GCR (3.13), and Feld-Voigt (3.0). As is apparent in figure 3, indicators with larger discrimination parameters exhibit greater “pull” on the latent variable.
The relative positioning of the threshold estimates for each indicator is also crucial—especially for scaling xkt during intervals when data are sparse. The thresholds reveal how outcomes on each manifest variable align with one another along the latent scale. Different indicators are better at distinguishing values of xkt at different levels of the latent variable (fig. 4). The three-category indicators Keith, Howard-Carey, and, to a lesser extent, CIRI all partition the scale in a relatively similar fashion: country-years rated 1 (below the lowest threshold) on one variable are likely to be rated 1 on the others as well. This is an important finding in light of disagreements between these teams with respect to operational (and indeed conceptual) definitions of judicial independence summarized in Ríos-Figueroa and Staton (Reference Ríos-Figueroa and Staton2014). Despite these disagreements, the measures ultimately align nearly identically in the latent dimension. By comparison, ratings of 1 on Keith and Howard-Carey roughly correspond to ratings of 3 or less on XCONST and, continuing to read across figure 4, ratings of up to 5 or 6 on CIM. Because CIM is so left-skewed, a country-year can have a relatively high observed value (say, 5 out of 8) and still belong at the low end of the latent scale.
Threshold estimates  for eight indicators of judicial independence. Shading denotes areas of 95% highest posterior density.

The consequences of this indicator realignment are apparent in figure 3. CIM, which is plotted using triangular points, is consistently above the smoothed latent trend. While the trend line for the mean is fooled by these “large” values of CIM, our model recognizes that even when CIM is as high as 0.7 (corresponding to category 5), judicial independence should still be considered low. Similarly, when CIM is above 0.9 (category 8), the country-year is very likely to be scaled as close to 1. Country-years manifesting the highest-category outcomes on Feld-Voigt, PRS, and GCR are even more likely to appear at the top of the latent scale.
Predictive Validation
Another way to evaluate the validity of our measure is to consider its ability to explain variation in other concepts, as anticipated by theory. From the very first, we have made our scores publicly available, encouraging a variety of applications. Although we do not do so here, in fact our measure of judicial independence has been used across a wide range of applied research. We review a few examples here as evidence of predictive validity. Conrad and Ritter (Reference Conrad2013) investigate whether ratification of the international Convention Against Torture (CAT) influences the subsequent behavior of state leaders with respect to human rights. Using our measure, they find that leaders are increasingly likely to ratify the CAT as judicial independence increases but that this effect is attenuated for leaders with strong tenure, who are most likely to violate the substantive provisions of the CAT and thus face potential legal consequences. Melton and Ginsburg (Reference Melton2014) use the measure to reconsider findings in Hayo and Voigt (Reference Hayo2007), showing a weak but positive relationship between institutions thought to promote judicial independence and de facto judicial independence itself. They find that only selection and removal institutions are strongly related to de facto independence. Epperly (Reference Epperly2013) has shown that judicial independence is a critical determinant of whether a leader is able to escape legal punishment after he transitions out of power. Staton, Reenock, and Radean (Reference Staton2013) evaluate the role of judicial independence in regime survival, finding that democratic states are more stable in the presence of independent courts, but only for a sufficient level of development, where the enforcement in the legal system of core democratic understandings is most critical. Similarly, Escriba i Folch and Wright (Reference Escriba i Folch2012) find that autocratic regimes are increasingly likely to transition to democracy—and to do so nonviolently—as judicial independence increases. And with respect to democratic elections, Chernykh (Reference Chernykh2014) finds that parties are more willing to accept the results of an election as judicial independence increases.
Conclusion
Latent concepts pervade studies of politics and law. The most common approach to measuring them has involved the use of single proxy instruments, where scholars at best consider the robustness of findings to alternative proxies. Researchers have recently approached the problem through the application of measurement models designed for the task. In this article, we develop a dynamic bounded graded response IRT model designed for time-series, cross-sectional data. We apply it to the problem of measuring latent judicial independence. Because this model is appropriate for many concepts in need of measurement in comparative politics and international relations, we view its applicability as potentially broad.
We emphasize two features of our approach that represent substantive advancements over existing latent variable models. The first is the assumption that latent judicial independence follows a Bayesian random walk prior process, which permits us to smooth our estimates over time, while maintaining considerable flexibility to detect a variety of temporal trends. As many concepts in international relations and comparative politics change gradually over time, this assumption lends a great deal of statistical power. In a context in which different indicators generally agree but measurement error is significant, smoothing allows us to cut through considerable noise. Second, by bounding the latent variable, we obtain conceptually valid measures with uncertainty estimates that make sense. We should be more confident about the placement of states at either end of the scale than we are about states in the middle. Bounding the latent variable produces this effect.
There are a number of implications of our analysis for the study of judicial independence. Clearly, comparative judicial scholars have been limited by extant indicators of the concept. Related patterns of measurement error and missing data not only have complicated analyses but have rendered some kinds of studies simply impossible to conduct with anything but a rough proxy. The sheer increase in data that we provide addresses these practical problems. We are now in a position to trace judicial independence systematically over a relatively long time period. Importantly, the estimates are neither too sensitive to severe changes in one or two indicators nor completely insensitive to massive changes in political context. We hope that this feature of the measure will allow scholars to more precisely evaluate claims about judicial independence that suggest both dramatic and subtle change over time.
It is also evident that no theory of judicial independence that anticipates only one kind of development over time can explain what we observe. Trends around the globe simply fit multiple patterns. Judicial scholars have always known this, but our estimates demonstrate the point clearly. Some states are highly stable. Some are highly volatile. Others exhibit change, but in one direction, while still others experience considerable backslides or single changes for the better. We hope that our measure will contribute to the further development of theories that are conditional and sensitive to context.
Finally, we believe it is important to stress that scholars who choose to neither use our measure nor estimate their own will do well to at least consider averaging the scores to which they have access. Figure 3 certainly suggests that an average is far more unstable than the estimate we provide, and there are years when it seems artificially high or low. That said, it does a reasonably good job of aggregating the scores. In a pinch, averaging these series is better than selecting any one indicator on more or less arbitrary grounds.
Appendix A
Estimates of judicial independence: all countries


Appendix B
Extending the Model: Measuring Democracy
The method that we have described for synthesizing multiple TSCS indicators can be used to scale other latent variables in comparative research. To illustrate, we extend the analysis of Pemstein et al. (Reference Pemstein and Meserve2010), who employ a standard graded response IRT model to generate a measure of regime type—the Unified Democracy Score, or UDS—from a series of expert ratings. We fit our model to the same set of 10 indicators and compare the resulting latent variable estimates.Footnote 18 The comparison serves multiple purposes. First, it enables us to investigate the substantive added value of the unique elements of our model. Second, it provides validation of our measurement approach versus existing latent variable models. And third, it highlights the conditions under which existing methods may fall short and where the assumptions built into our model will have the greatest impact.
We estimate levels of democracy for 194 countries from 1946 to 2008, for a total of 9,146 country-years. The posterior predictive distribution indicates a satisfactory fit of the model to the data. As an initial validation, the correlation between our estimates of the latent variable and the UDS is .98 overall and .92 in the median country. There are no systematic outliers, nor is there a pronounced nonlinear relationship (fig. B1). However, a closer inspection reveals some important distinctions between the two series. At the extremes of the UDS measure, there is a gap between the very highest and lowest country-years (at 2 and −2, respectively) and the remainder of the data. The reason is that the standard graded response model separates and spaces apart cases once they approach the edges of the unbounded scale. By imposing bounds on the latent variable, our model compresses these country-years at zero and one, which we consider to be a more valid representation of the underlying political reality.
Other differences between our estimates and the UDS become apparent when we examine the time trends in individual countries (fig. B2). The most evident consequence of our modeling assumptions is the greater smoothness of the estimated series. In contrast, the UDS estimates treat each country-year as independent, making them more susceptible to random yearly fluctuations in the observed indicators and highly sensitive to the particular set of ratings that happen to be observed in a given country-year. The same two problems arose when considering the choice of the mean as a measure of the latent variable (e.g., fig. 3). Indeed, figure B2 demonstrates that the graded response model-based UDS tracks extremely closely with an alternative measure based simply on rescaling each indicator to the unit range and taking the average.
In linking consecutive years within each country, our model remains able to detect both gradual and rapid adjustments in countries’ level of democracy. The model consistently rates Switzerland as highly democratic, despite a single anomalous series that is present prior to 1970. In Portugal, the latent variable estimates from our model transition from autocratic to democratic just as quickly as the UDS measure. Early and late in the series, our estimates for Portugal are also closer to the boundaries of the scale than the UDS. The trend in Syria, on the other hand, demonstrates a much more gradual decline, and in a much less erratic manner than would be implied by either the mean or the UDS measure. And where multiple swings and reversals do occur over time, as in Pakistan, the model captures each of those patterns as well.
As researchers begin to draw on larger numbers of manifest variables and with lower rates of missingness, the divergence between estimates based on our approach, the standard graded response model, and even the simple average will become less pronounced. Already in this example, the correlation between both model-based measures and the mean of the observed ratings is .96. But the purpose of estimating a measurement model is not purely to generate estimates of the latent variable. By specifying a complete measurement model, researchers can further evaluate the reliability of each indicator and, country by country, of the measurement process itself.
Estimated levels of democracy, by country and year, using the dynamic, bounded IRT model described in this article, versus the Pemstein et al. (Reference Pemstein and Meserve2010) UDS.

Comparing three estimators of countries’ level of democracy. The thick black line represents estimates based on the model described in this article. The thick gray line shows the UDS estimates produced by the model of Pemstein et al. (Reference Pemstein and Meserve2010), rescaled to the unit range. The thin line indicates the mean of the original set of democracy ratings, also rescaled to the unit range.

 (Gelman and Rubin