I. INTRODUCTION
Emergence of novel processes and materials in the field of 3D printing has revolutionized the industry from being a mere prototyping technique to increasingly become a full-scale manufacturing solution, called additive manufacturing.Reference Liljenhjerte, Upadhyaya and Kumar1–Reference Dugbenoo, Arif, Wardle and Kumar7 Fused filament fabrication (FFF) or fused deposition modeling (FDM) is a commonly used additive manufacturing technique to fabricate 3-dimensional thermoplastic objects. The FFF uses a continuous thermoplastic filament fed through a heated, moving extruder head where the material is melted and extruded continuously bead-by-bead to form a layer and layer-by-layer to form the final part. This process results in anisotropy, thermal gradients, and internal stresses/strains in the final fabricated parts. Over the years, the anisotropic material behavior of FDM components has been extensively studied.Reference Ahn, Montero, Odell, Roundy and Wright8–Reference Arif, Kumar, Varadarajan and Cantwell11 In the FDM process, the semimolten material is deposited in a directional manner resulting in anisotropic material behavior. The anisotropic character of the 3D-printed part is primarily the result of the build direction and the bead angle. During the FFF process, the sequential deposition of material beads and layers cause the accumulation of internal stresses and strains during material build up. Several previous studiesReference Wang, Xi and Jin12–Reference Casavola, Cazzato, Moramarco and Pappalettera15 have reported the internal stresses/strains accumulated in the parts fabricated by the FFF process. The main factors influencing the internal stresses are found to be the heating and reheating effect during the layer-by-layer deposition and the speed at which the material is deposited (printing speed).Reference Sood, Ohdar and Mahapatra16,Reference Zhang, Yan, Zhang and Hu17 Thermal gradients can result from the deposition of hot melt over a previously printed cold layer, the heat transfer within the part and the convective cooling of the part in the build environment. This thermal gradient results in a mismatch in the internal stress across the part thickness (z-direction) which can (at extreme cases) lead to warping of the part, delamination, and part failure.Reference Wang, Xi and Jin12,Reference Turner and Gold18,Reference Zhang, Wang, Yu and Deng19
Though the anisotropic material properties, internal stresses, and the thermal gradients affect the material behavior of the final part significantly, these factors can be optimized to induce a shape change upon thermal stimuli. Zhang et al.Reference Zhang, Yan, Zhang and Hu17,Reference Zhang, Zhang and Hu20 first exploited the internal strain stored in thermoplastic poly-lactic-acid (PLA) fabricated by the FFF method. They showed that the internal stresses/strains stored during the FFF process can be released by heating the material above its glass transition temperature. They showed that the internal strains stored in the polymer is directly dependent on the speed at which the material is deposited (printing speed) and demonstrated the pattern transformations in 2D lattice and self-folding light-weight structures. Liao and coworkersReference Bodaghi, Damanpack and Liao21,Reference Hu, Damanpack, Bodaghi and Liao22 used a thermoplastic polyurethane-based shape memory polymers (SMPs) fabricated by the FFF process to demonstrate self-folding mechanisms in 1D and 2D structures when heated above the glass transition temperature.
The above shape transformations of 3D-printed objects is one of the methods used in 4D printing technique, the term used to define 3D printing of stimuli responsive materials wherein the 3D-printed material continues to evolve in shape/dimension with time. 4D printing is a relatively new term introduced by TibbitsReference Tibbits23,Reference Momeni, Liu and Ni24 in 2013. Another major method involves 3D printing of SMPs followed by a postprocessing step to realize shape changes as demonstrated by Qi and his coworkers.Reference Ge, Dunn, Qi and Dunn25–Reference Liu, Wu, Paulino and Qi27 Tibbits et al.Reference Tibbits28 introduced 4D printing using the multimaterial structure consisting of active and rigid segments. The active material considered was a hydrogel which swells when immersed in water. By optimizing the locations of the active and rigid segments in the 3D-printed structures, unique and controllable shape changes were realized with water as a stimulus.
Our study investigates thermally induced shape transformation behavior of three commonly used 3D-printed thermoplastics, namely, PLA, high-impact-polystyrene (HIPS), and ABS. Initially, the material properties are characterized and the experimental protocol is explained in detail. The mechanism of storage and release of the internal strains are analyzed using a constitutive model proposed by Nguyen et al.Reference Nguyen, Qi, Castro and Long29 The 1D to 2D shape transformations are evaluated both qualitatively and quantitatively and the underlying mechanisms of shape transformations are discussed. The effect of process parameters on 1D to 2D shape transformations is evaluated and the results are discussed. Subsequently, 2D to 3D shape transformations are demonstrated and the effect of the process parameters is investigated. Finally, some applications of this study are demonstrated.
II. EXPERIMENTAL METHODS
A. 3D printing
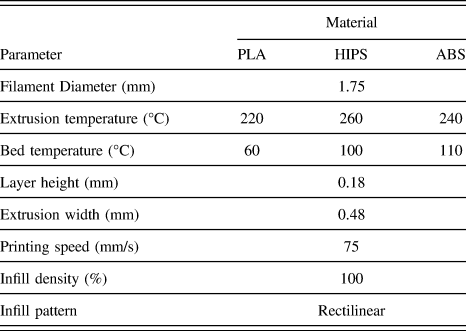
All specimens are fabricated by the fused filament fabrication method using a commercial 3D printer (Creator Pro 3D printer, Flashforge Corporation, Zhejiang, China). PLA and ABS filaments were supplied with the 3D printer and HIPS was obtained from LeapFrog 3D Printers (Alphen aan den Rijn, The Netherlands). Commercial software (Simplify3D, Cincinnati, Ohio) is used to define the FFF process parameters. The default parameters used in this study for the 3D printing process is presented in Table I. The filament diameter represents the diameter of the feedstock which is fed through a pinch roller mechanism where the material is melted at a specified temperature (extrusion temperature) and pushed through a nozzle. The melt is deposited on the build surface at a constant temperature (bed temperature) with a constant bead width and thickness. The bed temperature is taken equal to the glass transition temperature (T g) of the corresponding thermoplastic material. It should be noted that the bead width is the result of the nozzle diameter and the layer/bead thickness is the result of the proximity of the nozzle to the bed or previously deposited layer. Printing speed represents the speed at which each bead is deposited. The infill density is controlled by controlling the spacing between adjacent beads. Simplify3D software provides various infill patterns like rectilinear, honeycomb, grid, etc. Here the rectilinear pattern is chosen as the default setting where the bead is deposited at a constant angle within the layer. To ensure good adhesion to the bed, all samples are printed with a single layer of raft and brim. The raft is printed at a lower speed (15 mm/s) with low infill density (40%) which can be easily removed from the final structure (Supplementary Material Fig. S1). Brim is a single layer solid outline surrounding the structure. In this study, the brim consists of 5 solid outlines.
Default 3D printing process parameters.

B. Material characterization
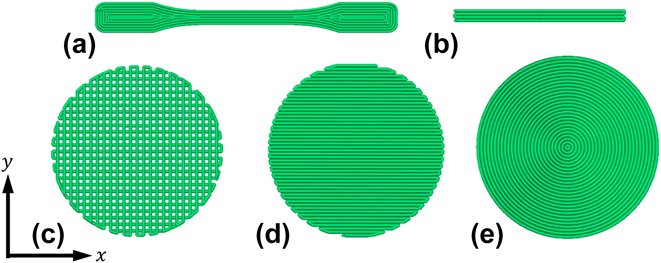
The thermal properties of various thermoplastic filaments were evaluated using a NETZSCH high temperature differential scanning calorimeter (NETZSCH Group, Selb, Germany). The tests were performed over 20–200 °C at a heating rate of 10 °C/min in a nitrogen atmosphere. An Instron UTM (Norwood, Massachusetts) with 5 kN load cell fitted with a temperature-controlled chamber is used to evaluate the mechanical properties of various samples. Tensile tests were performed on samples printed at different printing speeds at room temperature at a cross head speed of 5 mm/min. The samples printed at the lowest printing speed (5 mm/s) were used to study the effect of temperature on the mechanical performance. The samples were evaluated at different elevated temperatures, namely, T g − 20, T g, and T g + 20 °C. It should be noted that the samples printed at 5 mm/s have significantly lower shrinkage strain compared to those of other printing speeds. Furthermore, to achieve thermal equilibrium, the samples were kept at the test temperature for 30 min prior to tensile testing. The samples are prepared according ASTM D638 Type IV. The dog-bone samples are fabricated with 0° bead orientation along the gauge length as shown in Fig. 1(a). At least three samples were tested for each case to ensure repeatability.
Schematic of the sample configurations used in this study—Top view. (a) Dog-bone (ASTM D638 Type IV) and (b) beam. Circular discs with different print orientations, namely, (c) [0°/90°] (d) [0°], and (e) concentric. All angles are with respect to the x-direction measured in counter clockwise direction.

C. Shape transformation studies
To study the effect of printing speed on the shrinkage, strain single layer strips of 5 mm width and 50 mm length are printed. The strips are placed in a thermal chamber set at a temperature of T g + 20 °C for 15 min after which the samples are removed from the chamber, cooled to room temperature, and their change in length is measured. Dog-bone samples with different printing speeds were evaluated under completely constrained conditions to study their stress recovery behavior. The samples were heated from room temperature (22 °C) to T g + 20 °C and the force is recorded as a function of temperature.
To study the shape transformation, two basic geometries are considered as the initial as-printed shape. A beam of 2 mm thickness, 5 mm width, and 50 mm length is considered to study the 1D to 2D transformation of the printed thermoplastics. A circular disc of 50 mm diameter and 1 mm thick is considered for the 2D to 3D transformation. The beam is used to study the effect of printing speed, bed temperature, and beam thickness on the shape transformation. In the case of beams, the printing direction is along the length of the beam for all cases. The circular disc is used to study the effect of anisotropy, printing speed, and the infill density on the shape transformation. The sample configurations used in this study are presented in Fig. 1. Samples prepared using same printing parameters exhibited highly reproducible shape transformations. To ensure repeatability, at least three samples were tested for each case.
III. MODEL DESCRIPTION
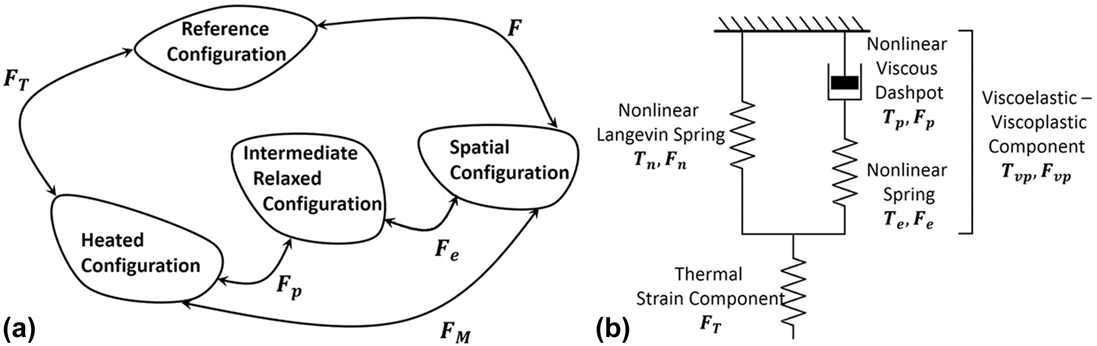
The internal strain storage and release mechanism along the printing direction is analyzed using a thermo-viscoelastic-viscoplastic model following Nguyen et al.Reference Nguyen, Qi, Castro and Long29 Here, the constitutive model is briefly presented. Detailed discussions and the one dimensional version of the constitutive model can be found elsewhere.Reference Abishera, Velmurugan and Gopal30–Reference Abishera, Velmurugan and Nagendra Gopal32 The quantities used in the model are as follows (Fig. 2).

(a) Decomposition of F and FM. (b) One dimensional representation of the constitutive model.

Figure 2(a) shows the kinematic description of the constitutive model. The total deformation gradient (F) is decomposed into thermal (FT) and mechanical (FM) parts. The mechanical part of the deformation gradient is further decomposed into plastic deformation gradient (Fp) and elastic deformation gradient (Fe). The above quantities are related constitutively as follows;
(i) Structural relaxation
The structural relaxation is defined through the fictive temperature (T f) which evolves according to the following equation:
 $${{{\rm{d}}{T_{\rm{f}}}} \over {{\rm{d}}t}} = - {1 \over {{\tau _{\rm{s}}}}}\left( {{T_{\rm{f}}} - T} \right)\quad ,$$
Here, τs is the structural relaxation time defined as,
 $${\tau _{\rm{s}}} = \tau _{\rm{s}}^{\rm{o}}\exp \left[ { - {C_1}{{{C_2}\left( {T - {T_{\rm{f}}}} \right) + T\left( {{T_{\rm{f}}} - {T_{\rm{g}}}} \right)} \over {T\left( {{C_2} + {T_{\rm{f}}} - {T_{\rm{g}}}} \right)}}} \right]\quad ,$$
where C 1 and C 2 are WLF constants and  $\tau _{\rm{s}}^{\rm{o}}$ is the relaxation time at T g.
(ii) Thermal deformation
Under isotropic assumptions, for a given temperature change from T 0 to T, J T can be evaluated using the following equationsReference Liu, Gall, Dunn, Greenberg and Diani33:
 $${J_{\rm{T}}}\left( T \right) = 1 + a\left( {T - {T_0}} \right) + b\left( {{T^2} - T_{\rm{0}}^2} \right)\;{\rm{and}}\;\alpha = {{{\rm{d}}{J_{\rm{T}}}\left( T \right)} \over {{\rm{d}}T}}\quad ,$$
where α is the volumetric coefficient of thermal expansion (CTE) and a and b are the curve fitting parameters.
(iii) Equations for stress
A one-dimensional analogy of the model is shown in Fig. 2(b). The Cauchy stress response (T) is decomposed as follows:
 $${\bf{T}} = {{\bf{T}}_{\rm{n}}} + {{\bf{T}}_{{\rm{vp}}}}\quad ,$$
where Tn and Tvp represent the material behavior above and below T g. The constitutive equation for the stress response is given asReference Arruda and Boyce34
 $${{\bf{T}}_{\rm{n}}} = {1 \over {{J_{\rm{n}}}}}{\mu _{\rm{r}}}{{{\lambda _{\rm{L}}}} \over {{\lambda _{{\rm{chain}}}}}}{{\cal L}^{ - 1}}\left( {{{{\lambda _{{\rm{chain}}}}} \over {{\lambda _{\rm{L}}}}}} \right){{\bar{\bf{B}'}} + \kappa \left( {J - 1} \right){\bf{I}}\quad ,$$
where μr is the shear modulus above T g, λL is the locking stretch, and κ represents the bulk modulus. With
 $${\lambda _{{\rm{chain}}}} = {\left( {{{{\rm{trace}}\left( {{{\bar{\bf{B}'}}}} \right)} \over 3}} \right)^{1/2}},\;{{\bar{\bf{B}'}}} = {{\bar{\bf{B}}}} - {{{\rm{trace}}\left( {{{\bar{\bf{B}}}}} \right)} \over 3}{\bf{I}}\;{\rm{and}}\;{\cal L}\left( \beta \right) = \coth \left( \beta \right) - {1 \over \beta }\quad ,$$
where
 $${J_{\rm{n}}} = \det \left( {{{\bf{F}}_{\rm{n}}}} \right),\;{{\bar{\bf{B}}}} = {{{\bar{\bf{F}}}}_{\rm{n}}}{{\bar{\bf{F}}}}_{\rm{n}}^{\rm{T}}\;{\rm{and}}\;{{{\bar{\bf{F}}}}_{\rm{n}}} = J_{\rm{n}}^{ - 1/3}{{\bf{F}}_{\rm{n}}}\quad .$$
The constitutive equation for Tvp is expressed through the fourth order isotropic elastic tensor (Le) and Lame’s constants (G and λ) asReference Li and Xu35
 $${{\bf{T}}_{{\rm{vp}}}} = {{\bf{T}}_{\rm{p}}} = {{\bf{T}}_{\rm{e}}} = {1 \over {{J_{\rm{e}}}}}{{\bf{L}}^{\rm{e}}}\left( {{\rm{ln}}{{\bf{V}}_{\rm{e}}}} \right)\quad .$$
(iv) Flow rule
Dp is constitutively related to the plastic shear stretch rate  ${\dot{\gamma }_{\rm{p}}}$ as
 $${{\bf{D}}_{\rm{p}}} = {\dot{\gamma }_{\rm{p}}}{{\bf{n}}_{\rm{p}}}\quad ,$$
where np is the plastic flow direction given by
 $${{\bf{n}}_{\rm{p}}} = {{{\bf{T}}_{\rm{p}}^\prime } \over {\sqrt {{\bf{T}}_{\rm{p}}^\prime \cdot {\bf{T}}_{\rm{p}}^\prime } }}\quad ,$$
where  ${\bf{T}}_{\rm{p}}^\prime$ is the deviatoric part of the nonequilibrium stress. The Eyring’s dashpot model written in terms of WLF kinematics incorporating the structural relaxation through T f is written as
 $${\dot{\gamma }_{\rm{p}}} = {s \over {{\eta _{\rm{g}}}}}{T \over Q}\exp \left[ { - {C_1}{{{C_2}\left( {T - {T_{\rm{f}}}} \right) + T\left( {{T_{\rm{f}}} - {T_{\rm{g}}}} \right)} \over {T\left( {{C_2} + {T_{\rm{f}}} - {T_{\rm{g}}}} \right)}}} \right]\left\{ {\sinh \left( {{Q \over T}{{\bar{\tau }} \over s}} \right) - 1} \right\}\quad .$$
Here, Q is an activation parameter, ηg is the shear viscosity at T g, and  $\bar{\tau }$ is the equivalent shear stress (similar to Von-Mises stress) which is defined as
 $$\bar{\tau } = {{\left| {\left| {{\bf{T}}_{\rm{P}}^\prime } \right|} \right|} \over {\sqrt 2 }}\quad ,$$
s represents the athermal yield strength, with an evolution equation given as follows,Reference Boyce, Weber and Parks36
 $$\dot{s} = h\left( {1 - {s \over {{s_{\rm{s}}}}}} \right){\dot{\gamma }_{\rm{p}}},\;s\left( {t = 0} \right) = {s_0},\;{s_{\rm{s}}} \lt {s_{\rm{o}}}\quad ,$$
where h and s s are the flow softening modulus and the saturation value of the shear strength, respectively.
IV. RESULTS AND DISCUSSION
A. Thermal properties
The glass transition temperature (T g) is the temperature at which the 3D-printed thermoplastics are thermally actuated resulting in unique shape transformations; hence, it is an important parameter in designing smart structures.Reference Hashmi, Prasad, Abishera, Bhargaw and Naik37,Reference Abishera, Velmurugan and Gopal38 When heated above T g, the polymer undergoes a transition from a hard, glassy state to a soft, rubbery state. This enables the release of internal strains stored during the FFF process, resulting in a shape transformation. PLA exhibited a semicrystalline behavior with a glass transition temperature of 60 °C and melting peak at 158 °C. HIPS showed a complete amorphous behavior with a glass transition temperature of 100 °C. ABS exhibited a predominantly amorphous behavior with a glass transition temperature of 110 °C and a melting like peak around 135 °C. These results are consistent with standard behavior of the studied materials. From the DSC results, T g is chosen as the default temperature for the build surface and T g + 20 °C is chosen as the actuation temperature for shape transformations. (See Supplementary Material Fig. S2 for DSC second-heating curves of different filaments.)
B. Effect of printing speed on the shrinkage strain of a single layer
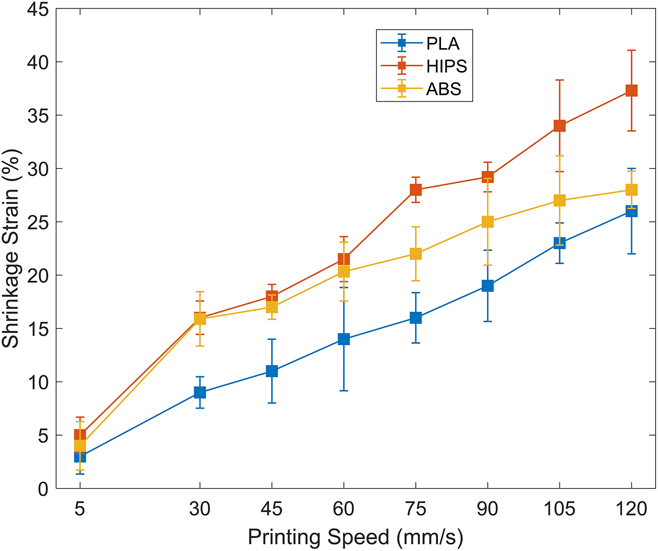
Single layer strips of different thermoplastics are printed at various speeds to study the influence of printing speed on the shrinkage strain. The strips are placed in a thermal chamber at a temperature of T g + 20 °C for 15 min, cooled to room temperature, and the change in length is measured. Figure 3 presents the results of shrinkage strain as a function of printing speed from 5 to 120 mm/s. Higher printing speeds result in a poor print quality. It can be observed that there is an almost linear increase in shrinkage strain with the printing speed for all three thermoplastics. During FFF, the molten polymer is extruded and deposited at a constant rate resulting in a constant internal stress/strain induced in the deposited material along the printing direction. This internal strain is held constant by the build surface, while the material cools below its glass transition temperature. When the strip is removed from the build surface below T g, the internal strain is stored in the material due to the reduced polymer chain mobility in the glassy state. This internal strain is directly related to the rate at which the material is deposited, i.e., with the increase in the printing speed, there is an increase in the internal strain. When the strip is heated to a rubbery state (above T g), the material regains its polymer chain mobility and the internal strains/stresses are released resulting in shrinkage in the print direction. This heat induced shrinkage due to the internal strains/stresses stored during the FFF process is the driving force of the shape transformation. Among the thermoplastics studied, HIPS showed higher shrinkage strains followed by ABS and PLA. The highest average shrinkage strains for PLA, HIPS, and ABS were 26, 37.3, and 28%, respectively, for strips printed at 120 mm/s. Strips with 5 mm/s printing speed showed the lowest strains of less than 5%.
Effect of printing speed on the shrinkage strain of a single layer of different 3D-printed thermoplastics.

C. Mechanism
The internal strain storage and release mechanism can be explained as follows:
Step 1: During the FFF process, the material is melted at a temperature much higher than the glass transition temperature and deposited on the build surface due to which the material undergoes large deformations along the print direction. This deformation is directly dependent on the printing speed.
Step 2: This deformation is held constant by the build surface or adjacent layers, while the material cools below the glass transition temperature.
Step 3: The material is then removed from the build surface wherein the deformation is stored below the glass transition due to the decreased polymer chain mobility at glassy state. Little or no instantaneous recovery is observed.
Step 4: Finally, when the material is heated above the glass transition temperature, the stored strain is released due to the increased chain mobility at rubbery state.
The above mechanism is constitutively modeled and analyzed for a simple one-dimensional structure to qualitatively understand the strain storage and release in 3D-printed thermoplastics. The shrinkage strain given in Fig. 3 is considered as the strain induced at respective printing speed and the subsequent steps are simulated. The material parameters used for different materials are experimentally obtained and are summarized in Table II (see Supplementary Material Sec. S1 for detailed parameter determination).
Model parameters used in this study.

D. Mechanical properties
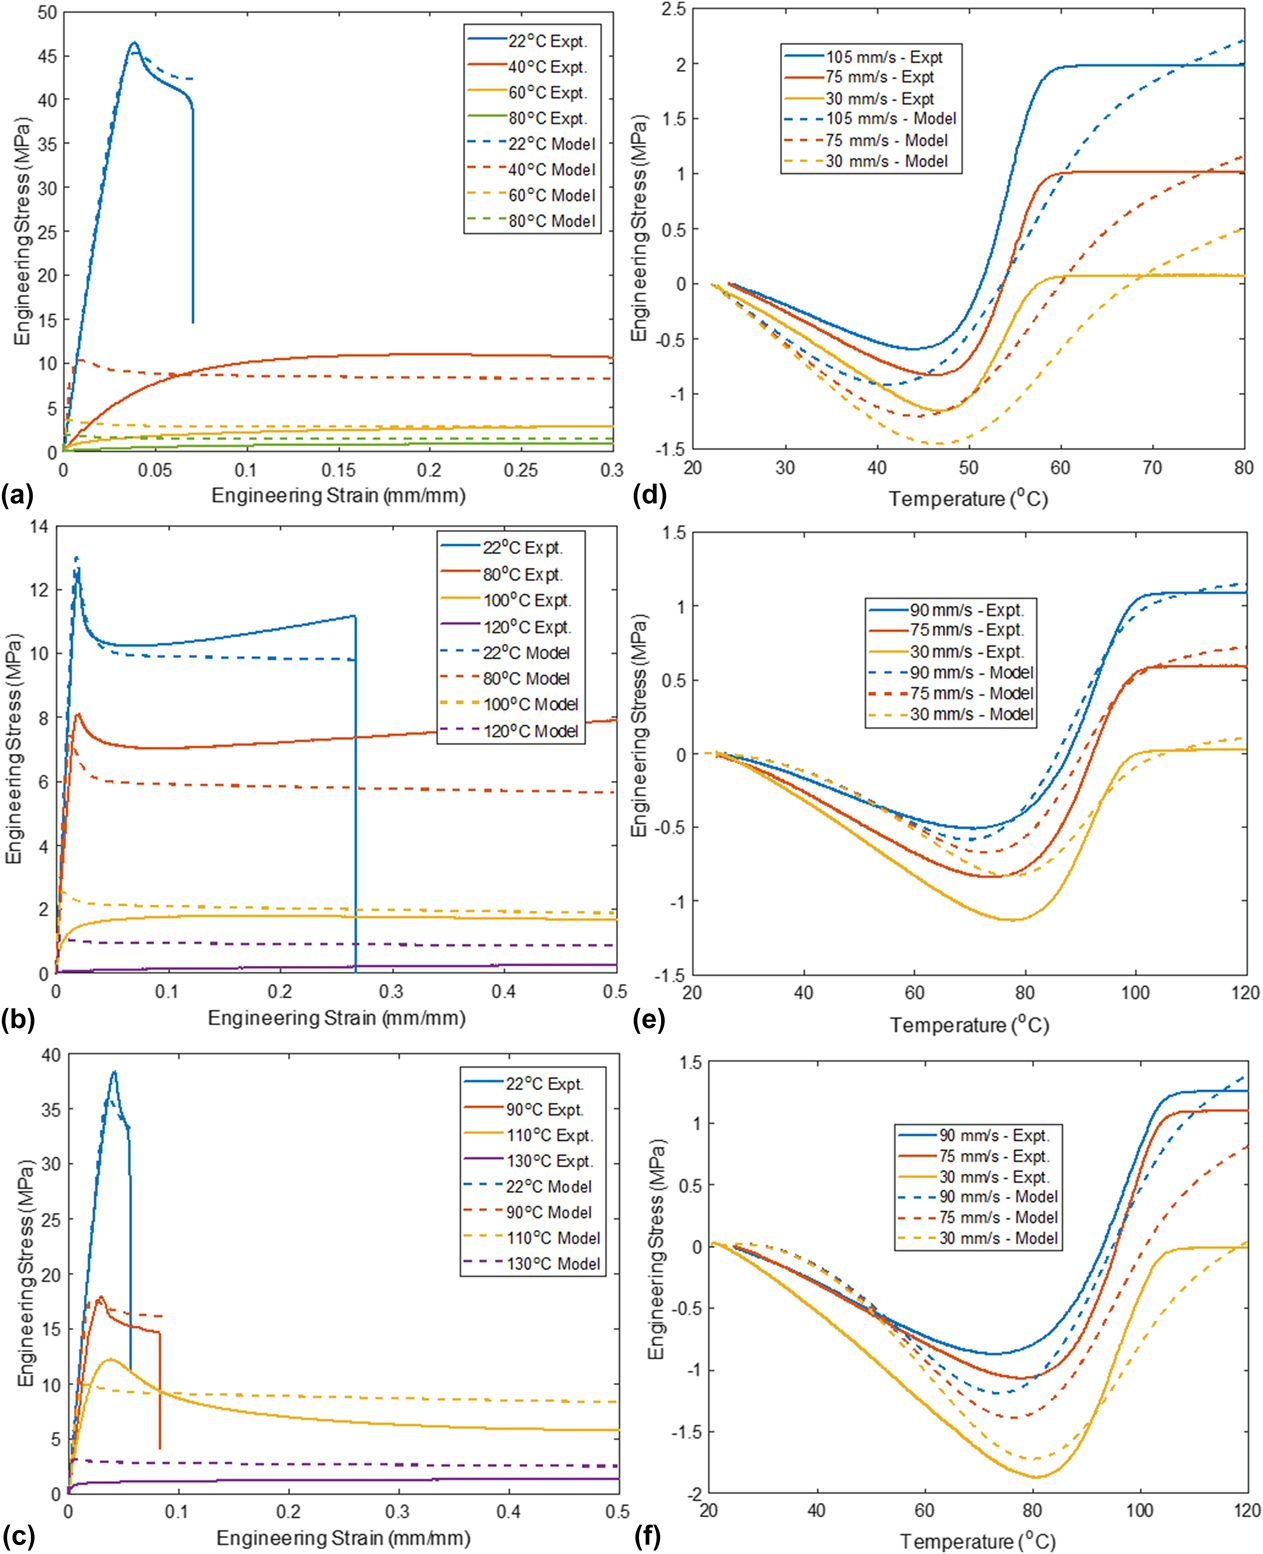
Figures 4(a)–4(c) present the comparison between experimental and predicted mechanical response for different thermoplastics at room temperature, T g − 20 °C, T g and T g + 20 °C (see Supplementary Material Fig. S3 for full experimental stress strain curves). The samples are printed with the process parameters given in Table I with the lowest printing speed of 5 mm/s and annealed at the test temperature for 30 min prior to tensile testing. Even at a temperature of T g − 20 °C, all three polymers showed a significant reduction in modulus and strength and an increase in the failure strain. With the increase in temperature, there was a further reduction in tensile modulus and strength and an increase failure strain. All the samples had failure strains >500% when tested at a temperature of T g + 20 °C (see Supplementary Material Table. S1). The model was able to qualitatively capture the change in mechanical response with the change in temperature with sufficient accuracy for all cases. The results can be further improved using temperature-dependent parameters (i.e., G(T), λ(T), etc.)Reference Srivastava, Chester and Anand39 and/or by employing multiple relaxation mechanisms (i.e.,  ${\bf{F}}_{\rm{M}}^i = {\bf{F}}_{\rm{e}}^i{\bf{F}}_{\rm{p}}^i$). Here, considering three different materials, the material parameters are taken to be constant and only one relaxation mechanism is used for computational simplicity.
Effect of temperature on the tensile performance of PLA (a), HIPS (b) and ABS (c). Effect of printing speed on the recovery stress of PLA (d), HIPS (e) and ABS (f).

It was observed that there was little effect on the mechanical properties with the increase in printing speed (see Supplementary Material Fig. S4). A considerable decrease in stiffness, strength, and failure strain can be observed in samples printed at high printing speeds (105 and 120 mm/s). This can be explained as follows: with high printing speeds, the material deposited becomes sparse resulting in increased voids and decreased adhesion with adjacent beads leading to a decrease in mechanical performance. This result is consistent with previous studies.Reference Chacón, Caminero, García-Plaza and Núñez40,Reference Ning, Cong, Hu and Wang41 The effect of this decrease in mechanical properties can also be observed in the stress recovery process discussed in subsequent sections. Though there is a decrease in mechanical properties, there is a considerable increase in shape transformation response at higher printing speeds.
E. Effect of printing speed on the recovery stress
The recovery stress signifies the ability of the 3D-printed thermoplastics to do work during the shape transformation process. Figures 4(d)–4(f) present the comparison between experimental and predicted evolution of stress under completely constrained conditions as a function of temperature for different 3D-printed thermoplastics. All curves show two distinct regions before and after the glass transition region. Before T g, a compressive force is generated due to the thermal expansion of the constrained sample and above T g, the sample exerts a tensile force on the grips due to the release of the stored internal stress.
With the increase in the printing speed, there is an increase in recovery stress which reaches a maximum value and decreases with a further increase in the printing speed (see Supplementary Material Fig. S5). The increase in the recovery stress can be attributed to the increase in the internal stresses stored with the increase in printing speed. The decrease at higher speeds can be attributed to the similar reason of the mechanical properties. At higher printing speeds, the material deposited becomes sparse resulting in a decrease in the recovery stress. At lower speeds, little or no recovery stress is generated with zero recovery stress for samples printed at 5 mm/s. For instance, the recovery stress for ABS increases up to a printing speed of 90 mm/s and shows a reduction in the stress recovered for higher speeds. As with the mechanical properties, PLA shows a large recovery stress of 2 MPa for 105 mm/s, followed by ABS with a recovery stress of 1.72 MPa for 90 mm/s and HIPS with 0.95 MPa for 90 mm/s.
The model captured the recovery stress behavior satisfactorily. To reproduce the recovery stress response, the material is assumed to be deformed at temperature ≫T g to strains corresponding to different printing speeds as given in Fig. 3. The deformation is kept constant and the material is cooled to below glass transition temperature. At low temperature, the material is unloaded and subsequently heated above T g at constant strain to obtain the recovery stress as a function of time. To obtain the recovery curves, all four steps are simulated for different printing speeds and for various materials. For all materials, the model was able to capture the qualitative stress recovery behavior, namely, the compressive stress due to thermal expansion and the positive stress due to the release of internal strains above the glass transition temperature.
It should be noted that along with the storage and release of internal strains, the shape transformation is also influenced by the print direction (anisotropy) and the thermal gradient across the layers due to the re-heating and cooling of adjacent layers. These factors require additional extensions to the above model so as to capture the complete shape transformation phenomenon in 3D-printed thermoplastics. In the following sections, the influence of anisotropy and thermal gradient on shape transformations is experimentally demonstrated and the mechanisms are explained.
F. 1D to 2D shape transformations
This section aims to demonstrate and quantify the 1D to 2D shape transformation of 3D-printed PLA, HIPS, and ABS by employing a simple beam structure. The influence of the FFF process parameters are also investigated.
1. Effect of printing speed
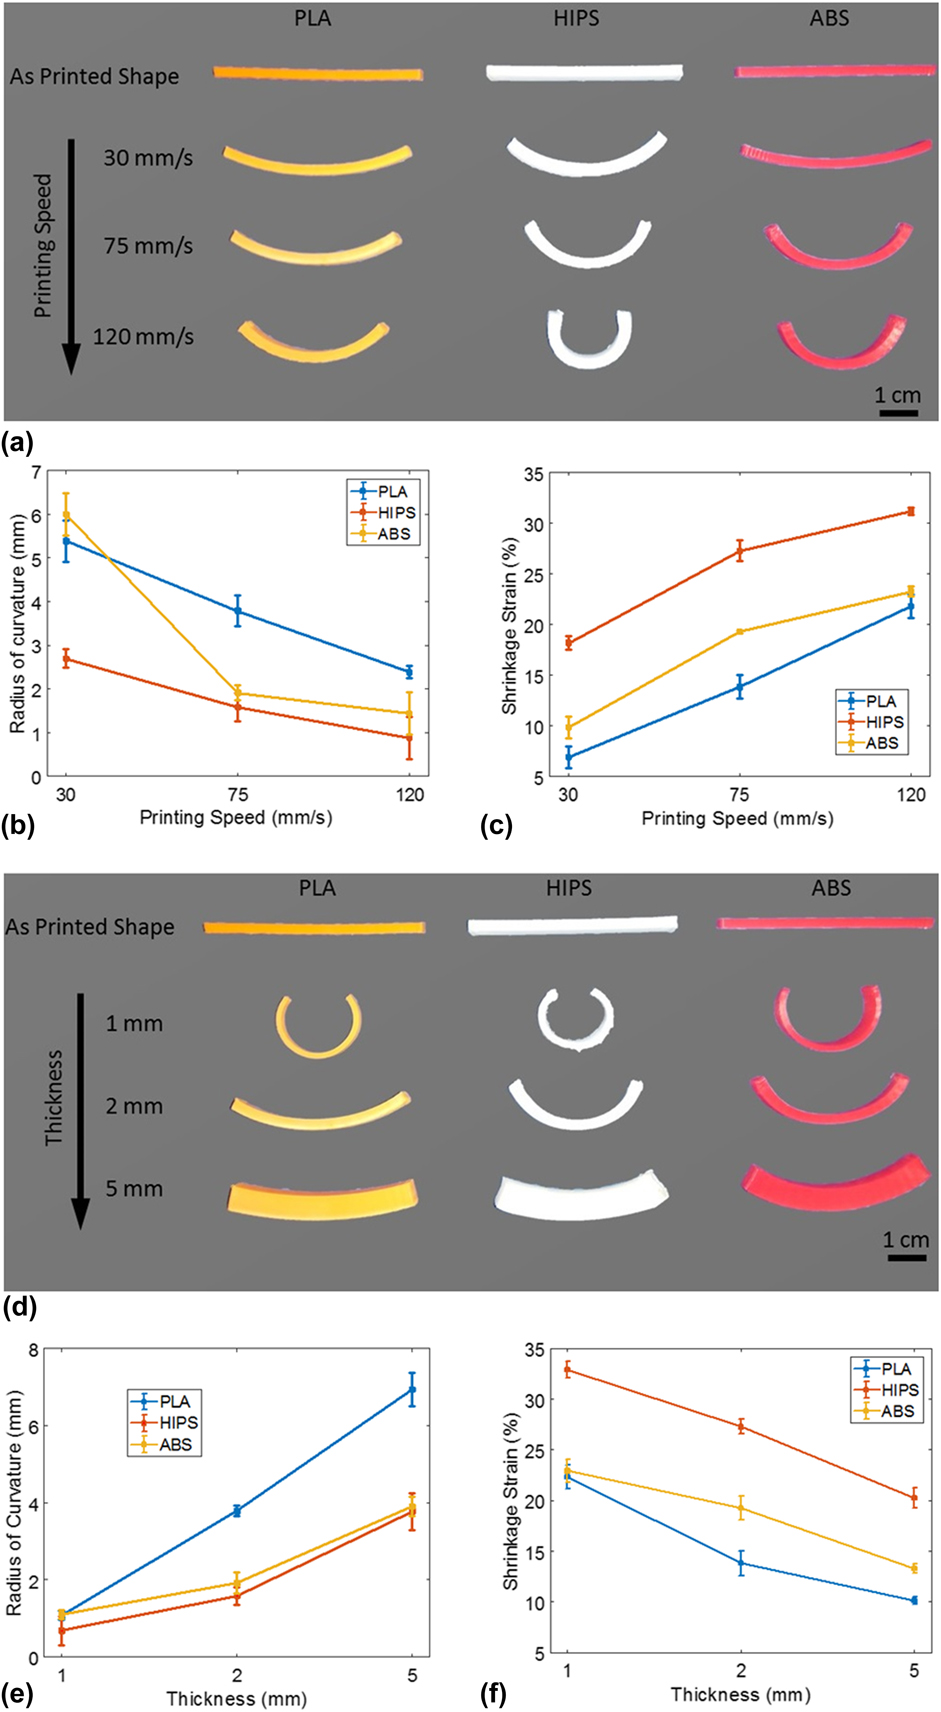
To study the effect of printing speed on the shape transformation, beam structures are fabricated by the FFF method for three different speeds, namely, 30, 75, and 120 mm/s with a thickness of 2 mm. Default values are used for other process parameters. After the printing process, the build surface along with the samples are cooled to room temperature and detached from the build surface. The samples are then heated in a thermal chamber to T g + 20 °C and maintained at the same temperature for 15 min and allowed to cool back to room temperature. Figure 5(a) shows the optical images of various samples printed at different speeds undergoing shape transformation. The following points are observed qualitatively for all the samples; (i) a decrease in beam length with the increase in printing speed due to the release of internal stress/strain resulting in shrinkage of the material along the print direction, (ii) exhibit a self-bending action which is enhanced with the increase in printing speed, and (iii) though all layers are printed at the same speed, the bottom layer (first printed layer) is always on the convex side of the beam.
Optical images (a and d) and quantitative analysis (b, c, e, and f) showing the effect of printing speed and beam thickness on the 1D to 2D shape transformations of different thermoplastics.

The self-bending action can be explained as follows: during the layer-by-layer deposition of the FFF process, each layer experiences a different thermomechanical history. For instance, the top most layer is deposited at molten state and cooled to room temperature without any reheating effect thereby storing the internal stress/strains induced during the extrusion process, whereas the bottom layers deposited at molten state are cooled to a lower temperature and get reheated when the subsequent layer is deposited. This heating and reheating could have considerably affected the internal stress/strains causing a relaxation effect resulting in lower shrinkage strains at bottom layers. This layer-by-layer mismatch in the internal strain stored, upon heating above T g, results in a self-bending shape transformation. Bead–bead interface and layer–layer interface exhibit significantly different properties compared to individual beads. This mismatch in material properties might also play a significant role in the self-bending action.
Figures 5(b) and 5(c) present quantitative results of the shrinkage and self-bending action of 3D-printed thermoplastic beams. At least three samples were tested and their mid-plane radius of curvature and mid-plane shrinkage strains are plotted as a function of printing speed. It is observed from Fig. 5(b) that the radius of curvature (R) reduces and the curvature (1/R) increase with the increase in printing speed. All the samples show highly reproducible self-bending action where they transform from a straight beam into curved beam. From Fig. 5(c), it can be observed that the mid-plane shrinkage strain increases with the increase in printing speed similar to that of the results obtained in single layer experiments. It should be noted that the shrinkage strain varied almost linearly across the thickness with minimum and maximum strains measured in bottom and top layers, respectively. However, due to the constraints offered by adjacent layers all strains measured were lower than that of the strains measured in single layer experiments for the same printing speed. For instance, the mid-plane strain for HIPS is about 32% for a printing speed of 120 mm/s, whereas for a single layer, it was found to be 37.3%.
2. Effect of thickness
To study the effect of beam thickness on the shape transformation, beam structures are fabricated by the FFF method for three different thicknesses, namely, 1, 2, and 5 mm with a printing speed of 75 mm/s. Default values are used for other process parameters. The samples are cooled to room temperature and detached from the build surface. The samples are then heated in a thermal chamber to and maintained at T g + 20 °C for 15 min and cooled back to room temperature. Figure 5(d) shows the optical images of various samples printed with different thicknesses undergoing shape transformation. The following points are observed qualitatively for all samples: (i) a decrease in beam length, (ii) exhibit a self-bending action which is decreased by the increase in thickness, and (iii) the bottom layer (first printed layer) is always on the convex side of the beam.
The quantitative results of the shrinkage and self-bending action of 3D-printed beams of different polymers as a function of the beam thickness are presented in Figs. 5(e) and 5(f). At least three samples were tested and the results are presented. It is observed from Fig. 5(e) that the radius of curvature (R) increases and the curvature (1/R) reduces with the increase in the sample thickness. All the samples show highly reproducible results. From Fig. 5(f), it can be observed that the mid-plane shrinkage strain decreases with the increase in sample thickness. This decrease in shrinkage can be explained as follows: increase in beam thickness results in further addition of layers which offer additional constraints on neighboring layers resulting in a decrease in shrinkage strain as compared to that of single layer.
G. 2D to 3D transformations
This section aims to demonstrate 2D to 3D shape transformation of 3D-printed PLA, HIPS, and ABS using a simple circular disc. The influence of FFF process parameters are also studied.
1. Effect of anisotropy
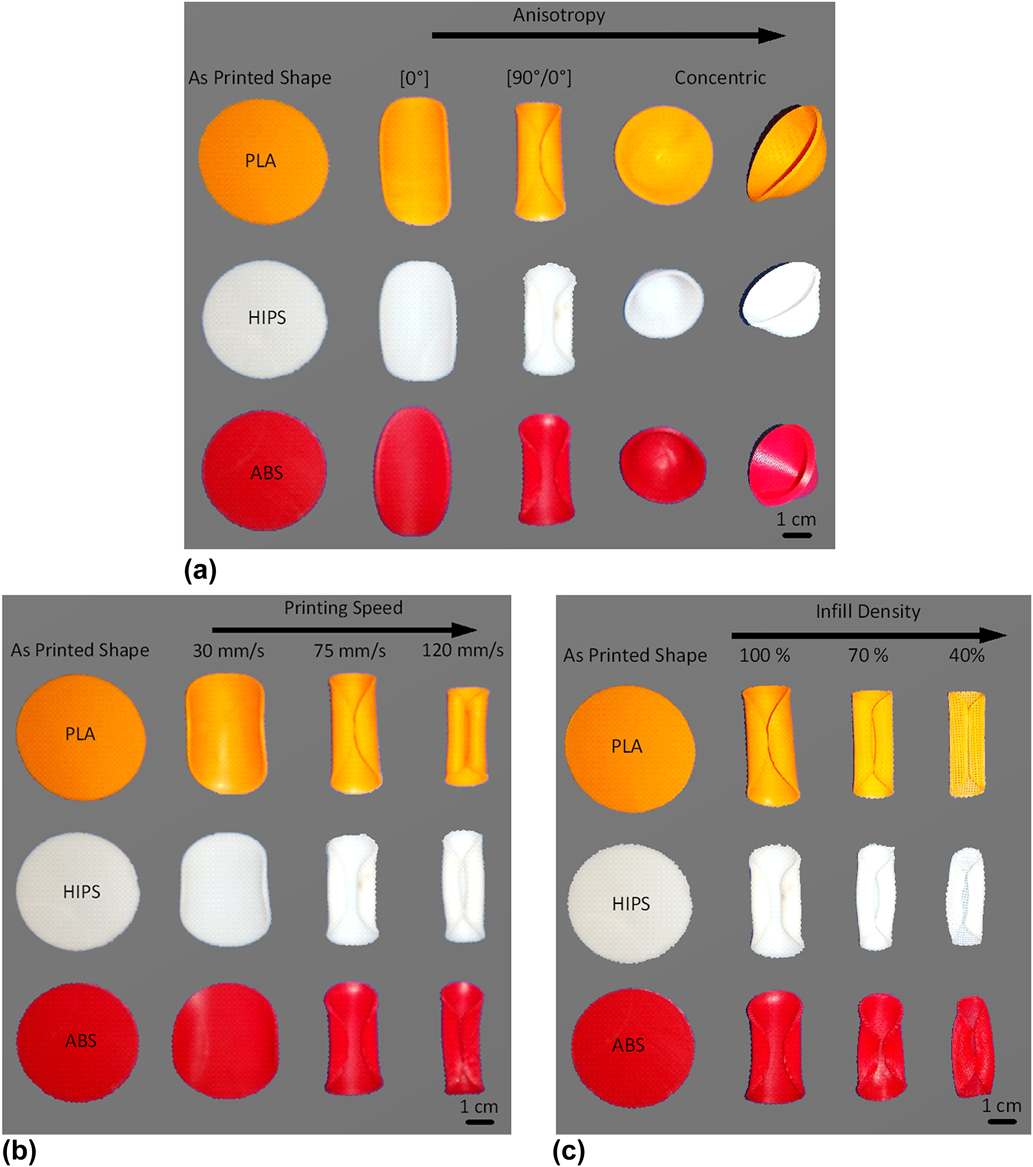
To study the effect of in-plane anisotropy on the shape transformation, circular discs are fabricated by the FFF method for three different print orientations, namely, [90°/0°], [0°], and concentric, as shown in Fig. 1 with a printing speed of 75 mm/s. Default values are used for all other process parameters. The samples are about 1 mm in thickness and have 6 layers. In the case of [90°/0°] print orientation, the bottom three layers are printed at an angle of 90° and the top three layers are printed at an angle of 0°, respectively, to the x-direction. The samples are cooled to room temperature and detached from the build surface. The samples are then heated in a thermal chamber to and maintained at T g + 20 °C for 15 min and cooled back to room temperature. Figure 6(a) shows the optical images of various samples printed with different orientations undergoing shape transformation. The following are observed qualitatively for samples with [0°] print orientation: (i) a decrease in dimension and a self-bending action is observed along the print direction. (ii) The bottom layer is always at the convex side similar to that of the shape transformation of the beam structure. (iii) A significant increase in size perpendicular to the print direction is observed indicating Poisson’s effect.
2D to 3D shape transformations of different thermoplastics. (a) Effect of anisotropy (b) effect of printing speed, and (c) effect of infill density.

For samples with [90°/0°]: (i) the self-bending action is dominated by the print direction of the top layers, i.e., along x-direction. Significantly lower bending is realized along y-direction influenced by the print-direction of the bottom layers. (ii) The curvature of bending is higher than that of unidirectionally printed discs. This can be explained as follows: in unidirectionally printed discs, all layers tend to shrink in the same direction and the bending action is due to the variation in the shrinkage strain across the thickness. Whereas in the case of samples with [90°/0°] orientation, the top layers tend to shrink in the x-direction and the bottom layers tend to expand along the x-direction due to the Poisson’s effect resulting in an enhanced bending curvature. (iii) Dimensional changes are lower when compared to unidirectionally printed discs. This can be explained as follows: the shrinkage of the top layers printed along the x-direction are constrained by the closely packed (100% infill density) bottom layers printed along the y-direction. Similarly the bottom layers are constrained by the top layers resulting in a reduced dimensional change.
Concentrically printed samples upon heating above T g transformed into a conical shell. The shape transformation in concentrically printed discs is the result of each concentric ring shrinking diametrically and the bending action induced by the mismatch in internal strains stored across the layers. The mean outer diameter of conical shells were measured to be 3.9, 3.17, and 3.52 mm, respectively, for PLA, HIPS, and ABS. The respective heights were measured to be 1.6, 2.4, and 2.1 mm.
2. Effect of printing speed and infill density
Figure 6(b) presents the effect of printing speed on the shape transformation behavior of circular discs with [90°/0°] print orientation and 100% infill density. It can be observed that an increase in the printing speed results in an enhanced bending action dominated along the print direction of the top layers. Figure 6(c) shows the effect of infill density on the shape transformation behavior of circular discs with [90°/0°] print orientation printed at a speed of 75 mm/s. There is a significant dimensional change with the decrease in infill density. This can be explained as follows: with a decrease in infill density, there is an increase in distance between two deposited beads. Hence, the top layers are able to shrink with reduced constraints as compared to that of discs with 100% infill density.
H. Applications
In this section, the results obtained in the above sections are applied to demonstrate various shape transformations using PLA. It should be noted that all the following shape transformations can be realized using HIPS and ABS as well.
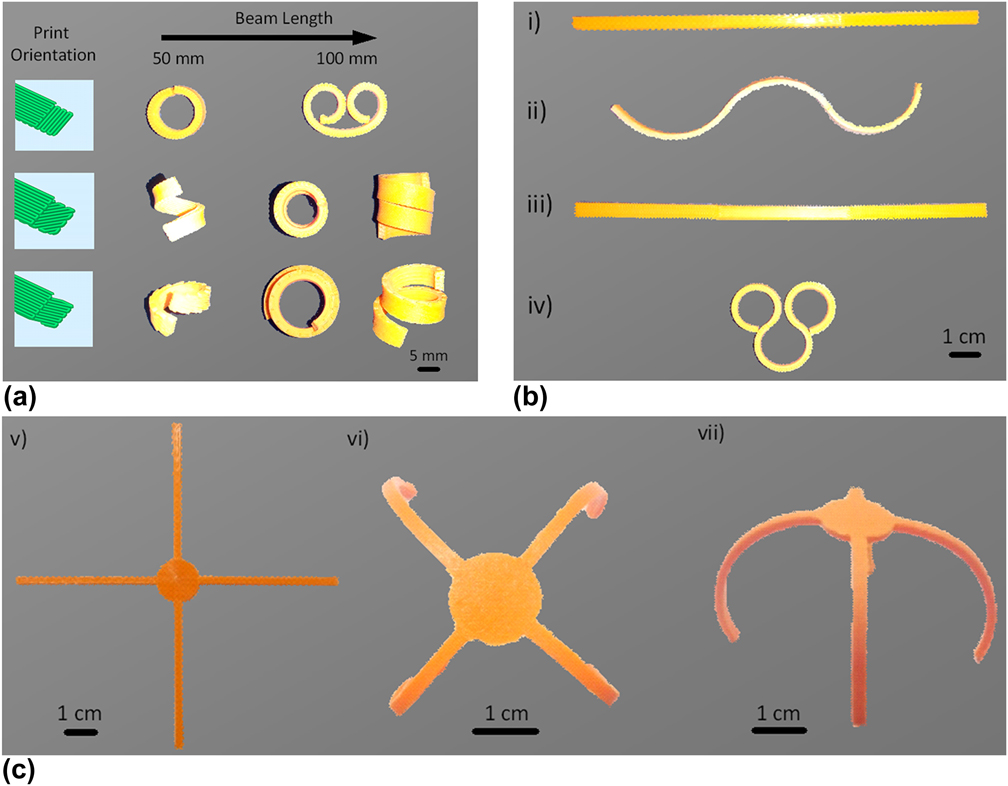
Figure 7(a) shows shape transformation demonstrations of beams with varying print orientation and length. Beams of 2 mm × 5 mm cross section and lengths of 50 mm and 100 mm are printed at three different orientations, namely, [90°/0°], [45°/0°], and [15°/0°] with respect to the x-direction. The beams are made up of 12 layers and in all cases, the top six layers are printed at 0° orientation at a printing speed of 120 mm/s. The bottom layers are printed at different angles relative to the top layers with a constant printing speed of 5 mm/s. The bottom layers act as semipassive layers dictating the direction of the shape transformation. Subsequently, by alternatively inverting the print parameters across the length of the beam, a sinusoidal shape transformation can be realized. In Fig. 7(b), two approaches are used to realize different bending directions at alternate sections of the beam. A beam of 2 mm × 5 mm cross section and length 150 mm is considered. The beam is differentiated into 3 segments with 50 mm each. In the first approach, the speed across the thickness is varied alternatively in each segment, i.e., in the first segment, the top layers are printed at a high speed of 120 mm/s and the bottom layers are printed at 5 mm/s and vice versa in the second layer and so on. In the second approach, the print orientation across the thickness is varied alternatively in each segment. The first, second, and third segments are printed with [90°/0°], [0°/90°], and [90°/0°] orientation, respectively.
(a) Shape transformation behavior of 3D printed beams with different print orientation and length. (b) Sinusoidal shape transformation of beams. (i) to (ii) by varying the printing speed and (iii) to (iv) by varying the print orientation. (c) Demonstration of a morphing structure (v) as-printed 2D configuration. (vi) and (vii) 2D to 3D transformation.

Figure 7(c) demonstrates the application of the shape transformation processes in 3D-printed thermoplastics. To obtain the final shape, an initial configuration is designed and specific process parameters are assigned to different sections of the 2D shape. In the initial 2D configuration, the center portion is printed concentrically at the lowest speed of 5 mm/s to maintain a constant shape throughout the shape transformation process. The arms are printed at a high speed of 120 mm/s to achieve maximum shape transformation. The horizontal arms are printed along the x-direction and the vertical arms are printed along the y-direction. The overall thickness of the 2D configuration is kept at 1 mm to realize large curvature.
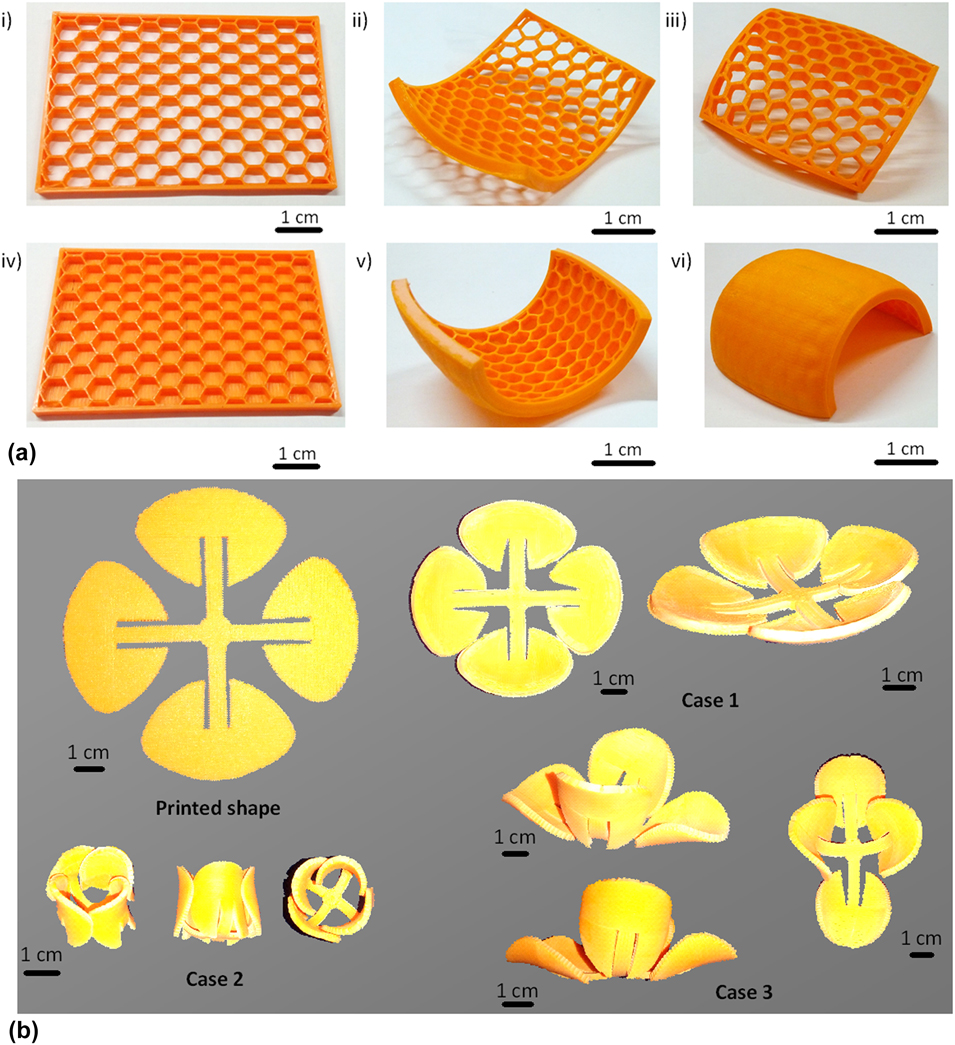
A major drawback in layer-by-layer deposition of the FFF process is the requirement of the supporting material and a poor surface finish while fabricating curved structures. The poor surface finish is the result of the stair-step effect on the curved surface.Reference Jin, Du, He and Fu42 Several attempts have been made to overcome this effect including elaborate process planningReference Jin, Du, He and Fu42 and use of an additional extruder head to follow the curved topology of the component.Reference Allen and Trask43 Here a simple method is demonstrated to fabricate curved structures by employing the results obtained above where a 3D-printed flat component is transformed into a curved structure upon heating above the glass transition temperature. Figure 8(a) shows the transformation of flat honeycomb structures fabricated with PLA into curved configuration when heated above the glass transition temperature. The flat structures are printed at a constant printing speed of 120 mm/s, cooled to room temperature, and detached from the build surface. The samples are then heated to and maintained at 80 °C for 15 min to obtain the final curved configuration. An enhanced self-bending is achieved by adding 2 solid layers at the bottom of the honey-comb structure [Fig. 8(a) v, vi].
(a) Demonstration of a simplified approach to manufacture curved structures using PLA. As-printed 2D configuration (i) and (ii). Transformed curved structures after exposing to 80° and cooling (iii–vi). (b) Demonstration of different cases of 2D to 3D shape transformations of a flat flower like structure by varying the process parameters.

3D-printed structures with same initial dimensions can be programmed in a controlled manner by varying the process parameters with which the structure is created. This is demonstrated by using a flat flower-like structure as shown in Fig. 8(b). The 2D structure has three distinct regions, the central portion connecting the four arms which are in turn attached with a petal each. Different unique shape transformations can be realized by controlling the process parameters of each of these regions. In all cases, the top and bottom petals are printed at 0° orientation and the left and right petals are printed at 90° orientation. In case 1, the horizontal arms are printed at 0° orientation and the vertical arms are printed at 90° orientation and the central portion is printed concentrically. All regions are printed at a medium speed of 30 mm/s to realize a partial closure of the flower-like structure. In case 2, the horizontal arms are printed at [90°/0°] orientation and the vertical arms are printed at [0°/90°] orientation and the central portion is printed concentrically. All regions are printed at a speed of 75 mm/s. A complete closure of the flower-like structure is realized. It should be noted that by concentrically printing the central portion, a uniform self-folding behavior of all the arms can be obtained. Subsequently in case 3, a nonuniform self-folding behavior is achieved by printing the central portion at 0° orientation resulting in an enhanced self-folding along the horizontal arms. The horizontal arms are printed at 0° orientation and the vertical arms are printed at 90° orientation with a printing speed of 75 mm/s. As previously discussed, 3D printing the transformed shapes directly will result in a poor surface finish and a requirement of additional supporting material resulting in more time-, material-, and energy-consumption. Thereby making 4D printing, an attractive alternative for manufacturing curved or overhanging structures.
V. CONCLUSION
In this paper, thermally actuated shape transformation behavior of commonly used thermoplastic materials manufactured by the FFF was experimentally studied. 1D to 2D and 2D to 3D shape transformations were investigated under various FFF processing conditions and their underlying mechanisms are discussed in detail. The strain storage and release mechanism responsible for the shape transformation is constitutively modeled and analyzed using a thermo-viscoelastic-viscoplastic model. All three thermoplastic materials, namely PLA, HIPS, and ABS exhibited excellent shape transformation behavior. The results indicate that the process parameters like printing speed, thickness, and anisotropy play major role in the shape transformation. It is demonstrated that by optimizing the process parameters, unique and controllable shape transformations can be achieved. The results are then applied to demonstrate the application of this study for morphing structures and/or as a simplified process to fabricate curved structures.
Supplementary Material
To view supplementary material for this article, please visit https://doi.org/10.1557/jmr.2018.397.