I. INTRODUCTION
For many years, graphite has remained in the center of scientists’ attention in various research directions. Bright prospects opened up with the synthesis of graphite intercalation compounds (GIC). The results of fundamental studies in this field formed the basis for the development of materials possessing new exploitation properties.
GICs with strong acids (H2SO4, HNO3) are of great practical importance as the precursors of synthesizing a whole number of carbon materials, namely, expandable graphite (EXP), exfoliated graphite (EG), and graphite foil (GF). Traditional production technique of these materials consists of several steps: intercalation of strong acids into graphite, further hydrolysis for synthesizing EXP, production of EG via thermal shocking of EXP, and pressing EG without binder to obtain GF. Recently, preparation of EG by another method—ultrasound irradiation—was reported.Reference Li, Li and Li1
EXP foams, when heated, increase its volume hundreds of times; therefore, it is used in fire protection materials.Reference Weng, Hand and Ke2 EG is mainly applied to prepare GF. EG’s unique properties, such as low bulk density and high specific surface area, make it possible to use EG as a highly effective sorbent.Reference Toyoda and Inagaki3 Flexible GF is widely used to produce different types of sealing materials,Reference Jones and Seth4 shields for electromagnetic interference,Reference Chung5 heating elements,Reference Chugh and Chung6 battery anodes, and current collectors.Reference Yazici, Krassowski and Prakash7 Although all these materials have excellent properties, their application at high temperature is restricted to vacuum or to an inert atmosphere. In connection with this, an important problem is the increase in thermal stability of carbon materials mentioned above. Recently, the addition of some oxidation inhibitors, such as SiC,Reference Gao, Song, Liu and Zhang8 ZrO2,Reference Parashar, Raman and Bahi9 and BN,Reference Tsou and Kowbel10 into the bulk carbon materials by coating technique was investigated, and modification by boric compounds was found to be one of the most effective solutions in reducing oxidation loss. B4C-mixed C–C composites were reported to have excellent oxidation resistance.Reference Sogabe, Matsuda, Kuroda, Hirohata, Hino and Yamashina11 But, it is difficult to achieve a uniform boric compound distribution by coating technique; therefore, oxidation protection was not sustained.
An alternative method which gives reliable oxidation protection involves placing boron-containing compounds into the carbon material pores, where oxidation probably starts. The great interest represents researchReference Lee and Radovic12 in which elemental boron and phosphorus compounds were doped into an activated carbon cloth and a carbon felt. According to authors, high thermal stability has been reached due to two factors: (i) formed C–P–O or C–O–P bonds that block active sites and (ii) substitutional B that reduces the electron density in the graphene layer. Application of only boron compound apparently can also lead to the same results. Recently, excellent resistance to air oxidation was achieved by impregnation of boric oxide into carbon materials.Reference Sogabe, Okada, Kuroda and Inagaki13 Boric oxide is known to possess high boiling temperature 1680 °C and not to react with carbon even at white heat temperature. But the main disadvantages of this technique are hard conditions of the processes (1200 °C and 15 MPa).
An important problem is to obtain expandable carbon material with high thermal stability in relatively mild conditions. We have attempted to insert boric oxide into EG through boric acid during the GIC synthesis in H2SO4–H3BO3 solutions. Sulfuric acid is known to be easily intercalated into graphite in the presence of oxidizing agent, but boric acid does not form binary GIC. Solubility of H3BO3 in H2SO4 is sufficiently high. In this connection, the mixture of these two acids was chosen. GIC can be prepared by two methods: chemical (in the presence of strong oxidants) and electrochemical (via anodic oxidation of graphite in solution). The electrochemical approach appears more attractive both for practical applications and for fundamental studies because it provides more information, requires no additional oxidants, and offers the possibility of tuning synthesis conditions. Therefore, electrochemical synthesis of GIC was used.
In this work, electrochemical intercalation in graphite–H2SO4–H3BO3 system has been investigated. Boric acid was shown not to be co-intercalated into graphite matrix with sulfuric acid, but it is distributed on the surface of graphite. The main attention was paid to thermal stability of EXP and GF synthesized in this system.
II. EXPERIMENTAL
A. Synthesis
Highly oriented pyrolytic graphite (HOPG, 1° grain-boundary angle, 99.9 wt% carbon content) and flake graphite (d i = 3.35 Å, particle size of 0.3–0.4 mm, ashes content less than 0.2 wt%) were used as host materials. Solutions of sulfuric acid (content: 96 wt%, d = 1.84 g/cm3, chemically pure) and boric acid (chemically pure) were used as the initial electrolytes. These solutions were prepared by mixing the mentioned acids in the appropriate ratios and heating them up to 80 °C to solve boric acid (solubility of H3BO3 in H2SO4 is 33 g in 100 g correspondingly).
The synthesis of GICs was carried out by electrochemical oxidation of 0.1 g of HOPG or 2 g of flake graphite in a three-electrode cell under galvanostatic conditions at a current of I = 10 mA in the H2SO4:H3BO3 solutions with mass ratios 1:0, 12:1, 6:1, and 3:1. Graphite served as the anode and a platinum plate was used as the counter electrode. The saturated mercury sulfate electrode (Hg/Hg2SO4), 0.615 mV versus the standard hydrogen electrode, serves as the reference electrode. GICs synthesized from HOPG were used to define the composition of GICs for clarifying whether boric acid intercalates into graphite matrix or not. Flake graphite was applied to obtain of EXP and GF.
Samples of GIC obtained from HOPG and flake graphite are designed with prefixes p- and f- correspondingly. For example, p-GIC(3:1) means GIC synthesized from HOPG in mixed solution H2SO4–H3BO3 with mass ratio 3:1.
The samples of f-GIC were hydrolyzed by water twice and were dried up at 60 °C to constant weight with formation of EXP. EG was obtained after thermal shocking of EXP at 900 °C. GF with density 1.0 g/cm3 was received by pressing of EG without binder.
B. Characterization and measurements
The synthesized samples were studied by means of x-ray diffraction (XRD), thermal analysis [thermogravimetric (TG) and differential scanning calorimeter (DSC)], low-temperature nitrogen adsorption, scanning electron microscopy (SEM), elemental analysis, and mechanical test.
The phase composition of GICs was determined by XRD on an ARL X’TRA diffractometer (Cu-Kα radiation, λ = 1.5418 Å, 35 kV anodic voltage, and 25 mA current; THERMO Fisher Scientific, Pittsburgh, PA) in the angular range of 2θ = 20–60° at a continuous scan rate of 2°/min.
Thermal analysis (TG + DSC) was carried out by a Netzsch STA Jupiter 449 C (NETZSCH Thermal Analysis, Selb, Germany) in flowing air (40 ml/min). The sample was placed in a platinum crucible and heated at a rate of 10 °C/min.
Elemental analysis was carried out using laser mass spectrometer. Sample under pulsed laser light with power 108–1010 V/cm2 was quantitatively turned into “low-temperature” plasma. High positive potential pushed out the cations, which then formed an ion beam by electrostatic analyzer. The components of the ionic beam were determined in mass spectrometer. Instrument’s error is approximately 5%.
Morphology of EXP and EG was characterized by (SEM) performed at 20 kV accelerating voltage on a JEM-5510.
Specific surface area of EG was determined by BET technique. Measurements were conducted using Qsurf Surface Area Analyzer 9600 (THERMO Fisher Scientific, Pittsburgh, PA).
Mechanical test of GF was probed using a universal tensile machine Hounsfield H100KS (Redhill, UK). Right-angled GF bands (150 × 25 mm2) were fastened between two clamps (distance between them was 10 mm). Samples were further stretched out at a rate of 7 mm/min until they broke.
III. RESULTS AND DISCUSSION
A. Graphite intercalation compound
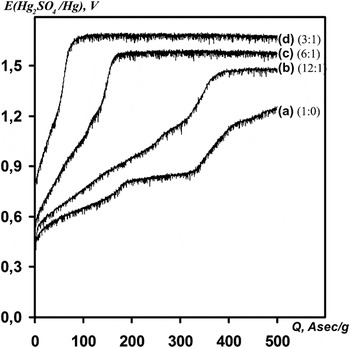
Charge-curves E(Q) showing dependence of sample potential on electricity consumption Q (Q = I × t/m, where I = 10 mA, t—time of oxidation, m—mass of graphite) are presented in Fig. 1. The curve form obviously depends on the content of sulfuric acid. Increasing H3BO3 concentration in solution provokes decrease in time attainment of plateau (as well as electricity consumption) and growth in formation potential of GIC. Such a trend of charge-curves with decreasing active intercalate content was also mentioned in Ref. Reference Sorokina, Leshin and Avdeev14 devoted to the electrochemical intercalation of the system graphite–H2SO4–H3PO4.
Charge-curves of highly oriented pyrolytic graphite in H2SO4–H3BO3 mixed electrolytes with various mass ratios of acids: (a) 1:0, (b) 12:1, (c) 6:1, and (d) 3:1.

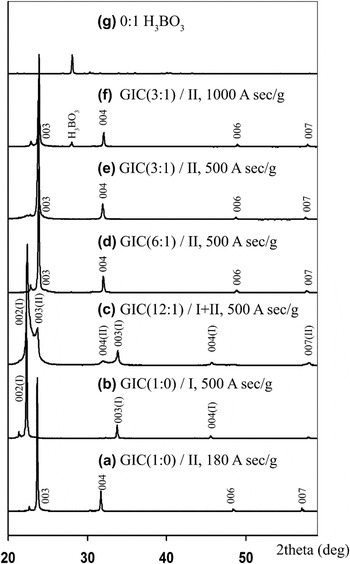
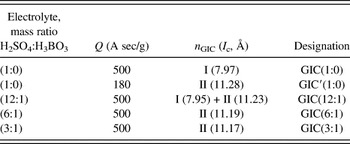
The XRD patterns of synthesized GICs are shown in Table I. According to XRD patterns, GIC I stage forms in solution 1:0 with Q = 500 A sec/g (b). Decreasing of electricity consumption to 180 A sec/g results in GIC II stage (a). Mixture of GIC I and II stages is formed in solution with minimal content of H3BO3 (12:1) (c), while in other mixed electrolytes formation of pure GICs II stage is observed (d)–(f). Increase in electricity consumption to 1000 A sec/g in solutions 6:1 and 3:1 does not make it possible to obtain GIC I stage (Fig. 2). In solution H2SO4–H3BO3 (3:1) potential reaches 1.7 V, but GIC I stage is not formed. It is interesting to note that in XRD pattern of GIC synthesized in solution H2SO4–H3BO3 (3:1) the most intensive reflection of crystal boric acid at 2θ = 28.1o is observed. The supposition of H3BO3 insertion to a graphite matrix on this basis of XRD data is impossible because it shows boric acid as an individual compound but not its state in the GIC structure. In other XRD patterns, the reflection concerning boric acid is not observed, which is apparently connected with the reduction of boric acid concentration both in electrolyte and in the sample. It is also necessary to note that interplanar space in GICs of the same stages synthesized in sulfuric acid and in mixtures is very close.
X-ray diffraction patterns of p-graphite intercalation compounds (GICs), obtained in mixed solutions H2SO4–H3BO3, with different mass ratios: (a) 1:0, Q = 180 A sec/g, (b) 1:0, Q = 500 A sec/g, (c) 12:1, Q = 500 A sec/g, (d) 6:1, Q = 500 A sec/g, (e) 3:1, Q = 500 A sec/g, (f) 3:1, Q = 1000 A sec/g, and (g) 0:1.

Phase composition of graphite intercalation compounds.

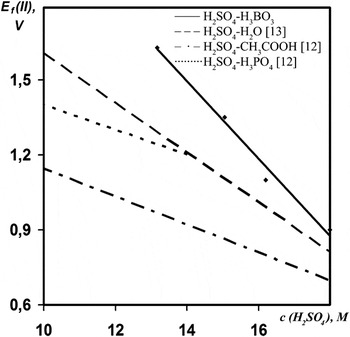
It is known that the concentration correction of GIC II formation potential in solutions H2SO4–H3PO4 and H2SO4–CH3COOH is equal to −50 and −56 mV/M, respectively.Reference Sorokina, Leshin and Avdeev14 The similar correction for a water solution of sulfuric acid is equal to −104 mV/M.Reference Kang, Zhang and Leng15 It is known that phosphoric and acetic acids co-intercalate into graphite with sulfuric acid to form ternary GIC, and water does not intercalate. In the case of mixed solutions H2SO4–H3BO3, this concentration correction dramatically decreases reaching a value of −154 mV/M (Fig. 3). It testifies to a thermodynamic interdiction of boric acid co-intercalation into graphite matrix with H2SO4.
Dependence of potential formation of GIC II stage E f(II) on the concentration of H2SO4.

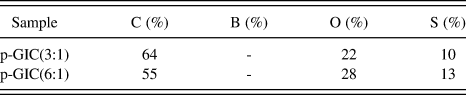
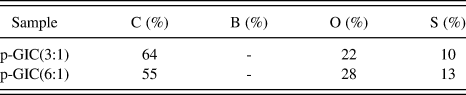
To determine whether boric acid intercalates into graphite or not, GICs obtained in HOPG–H2SO4–H3BO3 system with mass ratios of acids 6:1 and 3:1 were used. To eliminate absorption effect (absorption of boric acid on the surface of graphite), all sides of the sample were cut. Contents of basic elements are presented in Table II. The presence of boron was not observed in GIC. Thus, boric acid does not intercalate into graphite matrix and does not form ternary GIC with sulfuric acid. But, further it will be shown that boric acid is distributed on the surface.
Content of elements.
B. Expandable graphite
EXP and further materials (EG and GF) were synthesized from flake graphite, for the following reasons: 10 g of EXP is needed to receive and to investigate EG and GF and production of such amount is possible only by use of natural flake graphite.
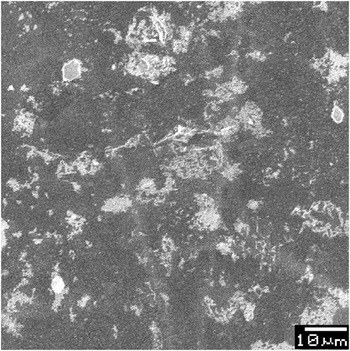
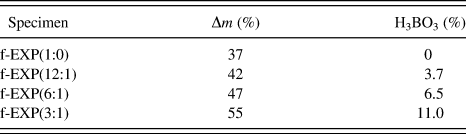
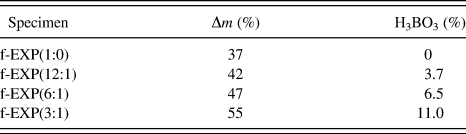
The overweight was determined according to the formula Δm = (m EXP − m g)/m g × 100%, where m EXP is the weight of EXP and m g is the weight of original graphite. The overweight of EXP synthesized by graphite polarization in sulfuric acid is equal to 37 wt%. However, the presence of boric acid in initial electrolyte raises the overweight (Table III). Elemental analysis shows that the modified samples (the samples which contain H3BO3 will be called modified samples) contain from 3.7 to 11.0 wt% of boric acid apparently absorbed on a graphite surface. Indeed, on SEM image of EXP(6:1) (Fig. 4), one can notice a white raid of boric acid which is lacking in classical EXP. Consequently, absorbed boric acid gives the most intensive reflection at 2θ = 28.1o observed in XRD pattern of p-GIC(3:1).
Scanning electron microscopy (SEM) image of EXP(6:1).

Overweight of expandable graphite (EXP) Δm and boric acid content.
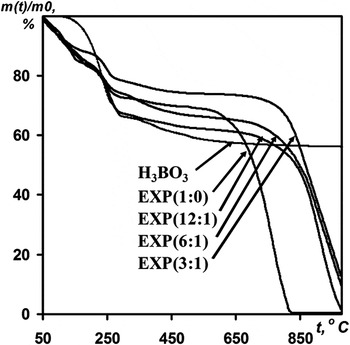
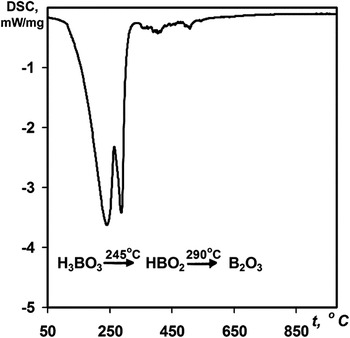
EXP behavior when it is heated was tested by TG analysis. TG curves of EXP are presented in Fig. 5. In each curve, three sections could be distinguished with pronounced segments falling down: (i) 100–140 °C, weight loss in this range is probably connected with evaporation of water in open defects; (ii) 200–300 °C, removing residual water and sulfuric acid from intercrystalline fields (exfoliation happens at this stage). According to DSC analysis of H3BO3, decomposition of boric acid to boric oxide also takes place in this section by two stages (Fig. 6); (iii) burning of sample with great weight loss and evaporation of heat. The plateau between second and third sections obviously specifies temperature stability of the material. The longer this plateau lasts, the more stable the material is. The presence of boric acid in modified specimens notably prolongs this plateau in comparison with EXP(1:0). As one can see in TG curves, temperature stability of modified EXP(12:1) is ∼200 °C higher. It is interesting to note that EXP(6:1) and EXP(3:1) have almost the same stability as EXP(12:1). Thus, modification by solution H2SO4–H3BO3 with mass ratio 12:1 is sufficient for significant improvement of EXP’s thermal stability.
Thermogravimetric (TG) curves of expandable graphites in air.

Differential scanning calorimetry curve of boric acid in air.

C. Exfoliated graphite and graphite foil
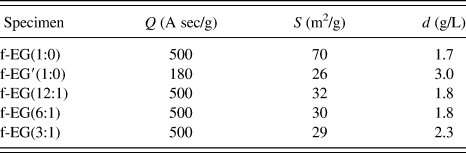
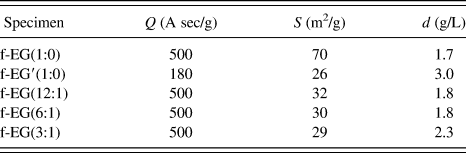
The bulk density and specific surface area are the basic characteristics of EG. These characteristics, which depend to a large extent on defect of EXP, define a complex of EG’s properties and materials on its basis. High value of electricity consumption may cause defects in graphite matrix. For this reason, the EG samples synthesized from GIC with 500 A sec/g electricity consumption have almost the equal values of bulk density, though they were received in electrolytes with different concentration of acids (Table IV).
Bulk density, d, and specific surface area, S, of exfoliated graphite (EG).
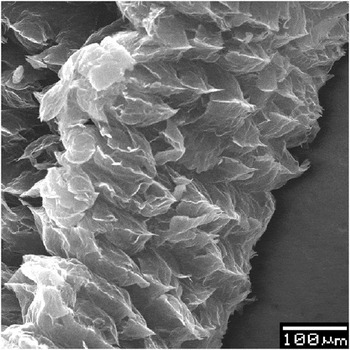
The micrograph of EG(3:1) is given in Fig. 7. It is seen that the morphology of modified EG(3:1) samples is worm-like and the pore shape is approximately ellipsoidal. Worm-like particles and low values of modified samples are necessary to obtain GF by pressing without binder.
SEM image EG(3:1).

Specific surface area of EG(1:0) with 500 A sec/g electricity consumption is about 70 m2/g. The same value for modified samples of EG with the same electricity consumption is twice lower (Table IV), which is probably a consequence of pores blocking by boric oxide, formed from boric acid decomposition at temperature of thermal shocking. We suppose that burning starts in pores. For this reason, blocking pores provoke an oxidation protection of modified samples.
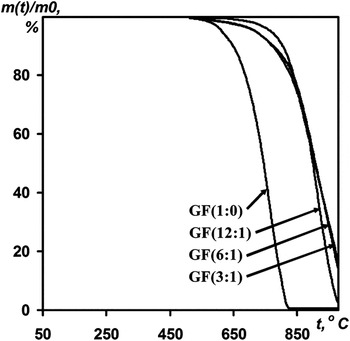
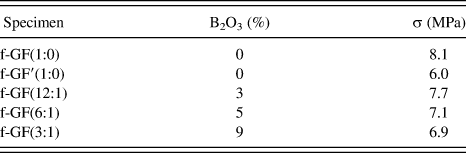
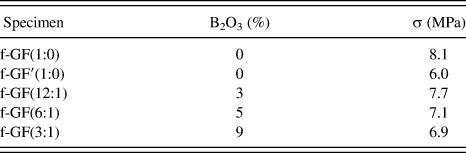
Elemental analysis shows that the modified samples of GF contain from 3 to 9 wt% of boric oxide. This amount of antioxidant is shown to be sufficient to improve mechanical characteristics and thermal stability of GF. Mechanical characteristics of GF depend on many factors, but the main one is stage number of GIC. By comparing tensile strength values of GF(6:1) and GF′(1:0) (both of them are made of GIC II stage), one can see that this characteristic was improved to ∼15% by the insertion of boric oxide (Table V). Probably, insertion of boric oxide reduces the size of pores that act as crock-initiating flaw. In addition, boric oxide makes the GF more resistant to temperature (Fig. 8).
TG curves of graphite foils in air.

Tensile strength, σ, of graphite foil (GF).
IV. CONCLUSION
GICs in system graphite–H2SO4–H3BO3 were synthesized by electrochemical method. Physical–chemical analysis testifies that boric acid does not co-intercalate into graphite matrix with sulfuric acid. However, boric acid is shown to distribute on the surface of graphite. According to the data of TG analysis, the samples of EXP and GF modified by H3BO3 possess higher thermal stability by ∼200 °C. Reduction of EG’s specific surface indicates the blocking of pores. It probably provokes an oxidation protection of modified samples. GF on the basis of the modified EG possesses higher thermal stability and tensile strength in comparison with a classical GF.