

I. INTRODUCTION
Stimuli-responsive systems are generally characterized via particular interaction between two molecules through external stimuli. Reference Dong, Luo, Yan, Zheng, Ding, Yu, Ma, Zhao and Huang1 The stimuli contain CO2, Reference Yan, Wang, Yin and Yuan2 redox, Reference Nakahata, Takashima, Yamaguchi and Harada3 light, Reference Yan, Hu, Zhou, Ju, Yin and Yuan4 gas, Reference Kumar, Tong, Dory, Lepage and Zhao5 temperature, Reference Moughton and O'Reilly6 pH, Reference Rodriguez-Hernandez and Lecommandoux7 and so on. They have initiated a high degree of enthusiasm for research in recent years because of their promising application in biomedicine, nano therapeutics, gene transportation, and drug materials. Reference Yan, Wang, Zheng and Huang8,Reference Mura, Nicolas and Couvreur9 Different stimuli are identified by different techniques. Among these stimuli responsive systems, electrochemical stimulus plays a crucial role in this field due to its mild operating conditions, convenient operation, and simple instrumentation. Reference Sun, Wang, Yu, Chen, Huang and Tong10 As a novel technology of stimuli, electrochemical stimulus can contribute to the structural alterations of the systems by inducing electron transfer reactions. Reference Ahn, Kasi, Kim, Sharma and Zhou11,Reference Shankar, Ghosh and Spontak12 Moreover, electrochemical stimulus is clean and can be identified without adding any extra redox reagents or solutions, which makes it promising to be applied in biological and drug fields, because the accumulation of added substances may have a negative effect on the viability of cells or the release of the drug. Reference Peng, Feng, Huo and Yuan13
In the field of redox-responsive supramolecular systems, β-cyclodextrin (β-CD), crown ethers Reference Schneider and Yatsimirsky14 and cyclophane Reference Seward, Hopkins, Sauerer, Tam and Diederich15 are excellent host molecules, while ferrocene (Fc), cobaltocenium, Reference Wang, Mendoza and Kaifer16 and viologen Reference Chan-Thaw, Villa, Prati and Thomas17 are excellent guest molecules. Fc, one of the most widely used redox species that can be oxidized into ferrocenium (Fc+) by chemicals or electrochemistry, has a unique structure and can bind with β-CD. Generally, homopolymer chains between β-CD and Fc are formed by noncovalent connections based on supramolecular interactions (e.g., H-bonding, metal–ligand bonds, p–p stacking, and host–guest interactions) located at specific sites. Reference Whittell, Hager, Schubert and Manners18,Reference Matsue, Evans, Osa and Kobayashi19 So far, supramolecular materials based on β-CD derivatives and Fc derivatives have been extensively researched for drug delivery and drug release in living systems. Reference Jones and Leroux20,Reference Torchilin21 For instance, Huang et al. Reference Yan, Xu, Chi, Chen, Dong, Ding, Yu and Huang22–Reference Kumpfer and Rowan24 have successfully prepared self-healing supramolecular materials responding to pH, light, and temperature. Yan et al. Reference Yan, Yuan, Cai, Xin, Kang and Yin25 reported two end-decorated homopolymers, poly(styrene)-β-cyclodextrin (PS-β-CD), and poly(ethylene oxide)-ferrocene (PEO-Fc), that they can orthogonally self-assemble into a supramolecular diblock copolymer (PS-β-CD/PEO-Fc) in aqueous solutions based on the terminal host–guest interactions. Liu et al. Reference Liu, Rui, Gao and Zhang26 designed well-defined redox-responsive Fc-containing amphiphilic block copolymers PEG-b-PMAEFc, which were synthesized by atom transfer radical polymerization and can be used as promising drug delivery systems with controllable drug release. Although the researches of Fc-based supramolecular structures have been tremendous improvements, we still confronted with many severe challenges. For now, researches mainly focused on the investigation of two homopolymer based on β-CD derivatives and Fc derivatives and developing supramolecular materials through host–guest connections. Reference Liu and Chuo27–Reference Schmidt, Hetzer, Ritter and Barner-Kowollik29 However, to the best of our knowledge, little attention has been paid to introducing β-CD derivatives and Fc derivatives into the main chain based on linear polymers to form novel supramolecular materials.
Herein, we report on a novel dual-decorated Fc–PAA–β-CD linear supramolecular material. β-CD–CH2–NH2 and Fc–COO–CH2–C≡CH connected onto a main chain of poly(acrylic acid) (PAA) has been designed and synthesized (Scheme 1). By host–guest interactions between β-CD and Fc, this polymer can further selfassemble in aqueous solution to form supramolecular micelles (Scheme 2). The Fc–PAA–β-CD was characterized by 1H Nuclear Magnetic Resonance (1H NMR) and Fourier transform infrared (FT-IR). By electrochemical control, the reversible assembly–disassembly transition of the micelles was identified.
The synthetic process of Fc–PAA–b-CD. (Note: The b-CD conjugation is distributed randomly over ferrocene and nonferrocene containing units).

Diagram of synthesis of the Fc–PAA–β-CD and a schematic of the voltage-responsive controlled assembly and disassembly of the Fc–PAA–β-CD micelles.
II. EXPERIMENTAL SECTION
A. Materials
Ferrocene formic acid, propiolic alcohol, N,N-dicyclohexylcarbodiimide (DCC), N,N-dimethylaminopyridine (DMAP) and N,N,N,N,N-pentamethyldiethylenetriamine (PMDETA), Methyl DL-2-bromopropionate (2-MBP) were purchased from Aladdin Chemistry Co. Ltd. CuBr (95%, Aladdin) was purified by stirring overnight in acetic acid. t-butyl acrylate (t-BA) was fractionated from CaH2 at 45 mbar, stirred over CaH2, degassed and distilled in high vacuum. Diisopropylamine (Aladdin, 99.5%) was dried over KOH for several days followed by distilling from CaH2 under N2 atmosphere. Tetrahydrofuran (THF) and acetone were dried over CaH2 for several days and distilled from sodium and benzophenone under N2 atmosphere. Dichloromethane (CH2Cl2), methanol, HCl, MgSO4, hexanes, N,N-dimethylformamide (DMF), diethyl ether, sodium azide, triethylamine (Et3N), trifluoroacetic acid (CF3COOH) were obtained from Shanghai Sinopharm Chemical Reagent Co. Ltd. n-butyllithium (n-BuLi), α-bromoisobutyryl bromide (TCI, 98%), Benzotriazol-1-yl-oxytripyrrolidinophosphonium hexafluorophosphate (PyBOP) were also purchased from Aladdin Chemistry Co. Ltd. Other reagents were used without further purification. β-CD–CH2–NH2 was synthesized according to the previous literature. Reference Wei, Li, Chen and Jiang30
1. Synthesis of Fc–COO–CH2–C≡CH
Ferrocene formic acid (1.0 mmol), propiolic alcohol (3 mmol), DCC (5 mmol), and DMAP (5 mmol) were mixed with CH2Cl2 (15 mL) and DMF (5 mL) with stirring under N2 at room temperature in the dark for 5 h. The reaction mixture was placed in a freezer to precipitate in methanol. The reaction mixture was poured into 1.2 M HCl, extracted by CH2Cl2, washed with water and dried over MgSO4. After that, the solvent was removed in vacuum. The reaction mixture was purified on silica using hexanes: diethyl ether (40:60) to obtain the pure product. FI-IR (film): ν (cm−1): 3271, 3094 (Ar-H), 2934 (–CH2), 2119 (C≡C), 1716 (C=O). 1H NMR (CDCl3): δ (ppm): 4.80–4.77 (s, 2H, C5 H 4), 4.36 (s, 1H, CH), 4.18 (s, 5H, C5 H 5).
2. Synthesis of 2-MBP–PtBA
A mixture of 3 mL acetone, 80 mmol t-BA, and 0.8 mmol PMDETA, deoxygenated by purified nitrogen, was added to 0.8 mmol CuBr taken into a 25 mL Schlenk flask sealed with a rubber septum. After complex formation, evident from the change in the appearance of solution from colorless to clear and light green, 1.6 mm of 2-MBP was added using a syringe, and the flask was degassed by three cycles of freeze-pump-thaw into an oil bath thermostated at 60 °C. The monomer was polymerized for 6 h. After cooling the reaction mixture to room temperature, 50 mL acetone was added, and the polymer solution was treated with neutral alumina to remove the copper salts. Acetone was removed by evaporation, and the polymer was further purified by dissolving in diethyl ether and precipitating in methanol/water mixture (1:1 v/v) at 0 °C. The resulting polymers were collected by filtration and dried at 60 °C in vacuum. M n = 5900, M w/M n = 1.14. FI-IR (film): ν (cm−1): 2981 (–CH2–), 2930 (–CH–), 1729 (C=O), 1144, 1036 (C–O–O), 842 (–CH3). 1H NMR (CDCl3): δ (ppm): 3.65 (s, 3H, OCH 3), 2.99 (t, 1H, CH–Br), 2.26 (br, 1H, –CH2–CH), 1.85 (br, 2H, –CH 2–CH), 1.44 (br, 2H, –CH 2–CH), 1.25 (d, 3H, CH 3CH).
3. Synthesis of 2-MBP–PtBA–Br
In a sealed 250 mL three-neck flask, dried THF (20 mL) and diisopropylamine (2.8 mL, 20.0 mmol) were added. Then, the solution was cooled to −78 °C and n-BuLi (11.2 mL, 17.9 mmol) was added slowly. After 1 h, the mixture was treated with PtBA (1.7553 g) in 100 mL dried THF under −78 °C. The reaction lasted for 7 h. Next, α-bromoisobutyryl bromide (2.5 mL, 20.2 mmol) was introduced. After 4 h, the reaction was terminated by water. The organic phase was washed with water and brine, and dried over MgSO4 overnight. After filtration, the solution was concentrated, and dissolved by diethyl ether and precipitated into methanol/water mixture (1:1 v/v) at 0 °C. The resulting polymers were collected by filtration and dried at 60 °C in vacuum. M n = 7800, M w/M n = 1.23. FI-IR (film): ν (cm−1): 2981 (–CH2–), 2925 (–CH–), 1730 (C=O), 1266, 1149, 1036 (C–O–C), 914 (C–Br). 1H NMR (CDCl3): δ (ppm): 4.10 (t, 3H, –CH–Br), 3.58 (s, 3H, –OCH 3), 2.15 (s, 6H, C(CH 3)2Br), 1.87 (br, 2H, –CH2–CH), 1.36 (br, 2H, –CH 2–CH), 1.18 (d, 3H, CH 3CH).
4. Synthesis of 2-MBP–PtBA–N3
A DMF (20 mL) solution of 2-MBP–PtBA–Br (2.5 g) and sodium azide (0.325 g) was stirred at 60 °C for 8 h and allowed cooling to room temperature. The reaction mixture was filtered to remove any inorganic salt. DMF was removed by vacuum distillation and the products were further purified by dissolving in diethyl ether and precipitation in methanol/water mixture (1:1 v/v) at 0 °C. The resulting polymers were collected by filtration and dried at 60 °C in vacuum. M n = 7300, M w/M n = 1.26. FI-IR (film): ν (cm−1): 2981 (–CH2–), 2934 (–CH–), 2128 (N=N=N), 1730 (C=O), 1262, 1149, 1031 (C–O–C), 914 (C–Br). 1H NMR (CDCl3): δ (ppm): 3.65 (s, 3H, –OCH 3), 2.24 (s, 6H, C(CH 3)2N3), 1.85 (br, 2H, –CH2–CH), 1.43 (br, 2H, –CH 2–CH), 1.23 (d, 3H, CH 3CH).
5. Synthesis of 2-MBP–PtBA–Fc
Inside a 25 mL Schlenk flask, CuBr (0.8 mmol) was added to a DMF solution of 2-MBP–PtBA–N3 (0.5 g), Fc–COO–CH2–C≡CH (1.2 g), and PMDETA (0.8 mmol). The flask was degassed by three cycles of freeze-pump-thaw followed by immersing into an oil bath thermostated at 65 °C. The reaction mixture was stirred at room temperature for 24 h and quenched by exposure to air. Then DMF was removed by vacuum distillation at 60 °C. The polymer solution was treated with neutral alumina to remove the copper salt. The product was further purified by dissolution in diethyl ether and precipitation in methanol/water mixture (1:1 v/v) at 0 °C. The resulting polymers were collected by filtration and dried at 60 °C in vacuum. M n = 10,700, M w/M n = 1.34. FI-IR (film): ν (cm−1): 2981 (–CH2–), 2934 (–CH–), 1729 (C=O), 1630 (C=C), 1578 (N=N), 1257, 1149, 1031 (C–O–C). 1H NMR (CDCl3): δ (ppm): 5.30 (s, 1H, C=CH), 4.74 (s, 2H, C5 H 4), 4.31 (s, 5H, C5 H 5), 4.06 (t, 3H, –CH–Br), 3.58 (s, 3H, –OCH 3), 2.18 (s, 6H, C(CH 3)2), 1.85 (br, 2H, –CH2–CH), 1.43 (br, 2H, –CH 2–CH), 1.23 (d, 3H, CH 3CH).
6. Synthesis of Fc–PAA–β-CD
The 2-MBP–PtBA–Fc was dissolved in CH2Cl2 and then a 5-fold molar excess of CF3COOH (with respect to the amount of the t-butyl group in the brush) was added. The reaction mixture was stirred at room temperature for 24 h. Finally, the solvent and CF3COOH were removed by rotating evaporation followed by freeze-drying. The residual of CF3COOH was removed by vacuum drying at 40 °C overnight. Then Fc–PAA (0.5 g) was dissolved in 20 mL DMF. PyBOP (0.42 mmol) and Et3N (0.43 mmol) were added to this solution. After stirring for 2 h, β–CD–CH2–NH2 (0.35 mmol) was added, and the solution was stirred for another 12 h at room temperature. Then DMF was removed by vacuum distillation at 60 °C. The polymer products were further purified by dissolved in diethyl ether and precipitation in acetone at 0 °C. The resulting polymers were collected by filtration and dried at 60 °C in vacuum. M n = 21,800, M w/M n = 1.29. FI-IR (film): ν (cm−1): 3393 (OH), 1734 (C=O), 1665 (C=C), 1577 (N=N), 1158, 1066 (C–O–C). 1H NMR (D2O): δ (ppm): 5.04 (s, 2H, C5 H 4), 4.70 (D2O), 3.70 (s, 3H, –OCH 3), 3.09 (t, 3H, NH), 2.90 (t, 1H, CH–Br).
B. Characterization of the synthesized polymers by 1H NMR, FT-IR spectroscopy and gel permeation chromatography (GPC)
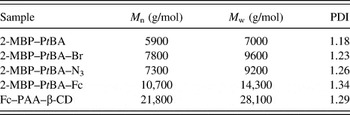
1H NMR spectra were recorded with a JEOL JNM-ECA 400 NMR spectrometer (JEOL, Tokyo, Japan), using CDCl3 or D2O as the solvent. FT-IR spectra were recorded on an AVATAR 360 ESP FT-IR spectrometer (Natus Medical Inc., Pleasanton, California). The FT-IR spectra of dried powdered sample were run in the form of KBr pellets on a Bruker Tensor 27 Spectrophotometer (Bruker, Karlsruhe, Germany) in the frequency range of 4000–400 cm−1. Molecular weight and molecular weight distributions were determined using a Waters-Breeze GPC instrument (Waters Corp., Milford, Massachusetts) (Table 1). The method is as follows: The oven temperature was kept at 35 °C with the eluent of THF at a flow rate of 1.0 mL/min. A series of low polydispersity polystyrene (PS) standards were used for GPC calibration.
Molecular weight and Polydispersity Index (PDI) determined by GPC.

C. Characterization of the assembly by ultraviolet–visible (UV–Vis) absorption and fluorescence spectroscopy
UV–Vis spectra were measured on a SHIMADZU UV 2100 spectrophotometer (Shimazdu Corp., Kyoto, Japan), and fluorescence spectra were measured with a Hitachi F-7000 spectrofluorometer (Hitachi Ltd., Tokyo, Japan). The critical assembly concentration (CAC) of the Fc–PAA–β-CD assembly was characterized by fluorescence spectroscopy. The preparation of the sample solution for the fluorescence characterization was as follows: a diethyl ether solution of pyrene (2 mM) and 0.1 mL quantities of the solution were added into numbered sample tubes. After the solvent was removed at ambient temperature, to each tube was added 10 mL of the sample solution of different concentration. The ratio of the fluorescence emission intensity at 381.0 and 373.0 nm (I 3/I 1) was measured as a function of the concentration to determine the CAC.
D. Characterization of the assembly by dynamic light scattering (DLS) and transmission electron microscopy (TEM)
DLS was measured using a commercial spectrometer (ALV/DLS/SLS-5022F; ALV/Laser Vertriebsgesellschaft mbH, Hessen, Germany) equipped with a multi-tau digital time correlator (ALV5000; ALV/Laser Vertriebsgesellschaft mbH, Hessen, Germany) and a 22 mW He–Ne laser (λ0 = 632 nm) as the light source. The sample was held at 25 °C by a temperature controlled sample holder and allowed to equilibrate for 60 s prior to analysis. Each size measurement was determined from 10 times, 10 s each. Each sample was analyzed in triplicate to calculate an average and standard deviation. All DLS data were collected and analyzed using Malvern Zetasizer 6.12 software. TEM analyses of the supramolecular were performed on a Philips H-600 EX transmission emission microscope (FEI Company, Hillsboro, Oregon) operated at a 120 kV accelerating voltage. The samples were prepared by the following process: the sample solution of a certain concentration was dropped on the surface of copper grids. When the solvent was removed, the same process was repeated 3–4 times. Afterward, copper grids were dried in a vacuum at ambient temperature overnight.
E. Cyclic voltammetry (CV) characterization and voltage responsive experiments
The electrical properties of the guest molecules under different conditions were characterized by CV on a Shanghai Chenhua electrochemical workstation with the conventional three-electrode system of Platinum sheet (working), platinum sheet (counter), and Hg/Hg2Cl2 (saturated KCl) electrodes (reference). All the electrochemical investigation was carried out at ambient temperature. The voltage-responsive experiments were conducted by the insertion of the three electrodes into the assembly solution, using +1.0 V or −1.0 V as the voltage stimuli. 0.2 M NaBr was used as the supporting electrolyte and the scanning rate was 100 mV/s.
III. RESULTS AND DISCUSSION
A. Synthesis and characterization of Fc–COO–CH2–C≡CH
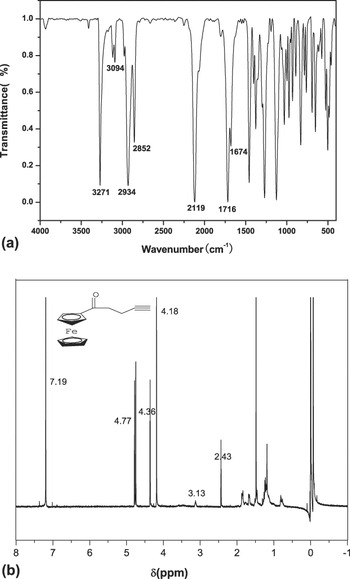
The structure of Fc–COO–CH2–C≡CH was characterized by FT-IR and 1H NMR. In Fig. 1(a), 3271 and 3094 cm−1 are the stretching vibration peaks of C–H of the benzene ring. The absorption peak at 2119 cm−1 is the stretching vibration peaks of –C≡CH, considering as the evidence for successful synthesis of Fc–COO–CH2–C≡CH. In Fig. 1(b), the peaks of 4.77, 4.36, and 4.18 ppm are attributed to the protons of Fc. The peak at δ = 3.18 ppm corresponds to the protons of the methylene group in Fc–COO–CH2–C≡CH. The peak of at δ = 2.66 ppm is attributed to the protons of –C≡CH.
(a) FT-IR spectrum of Fc–COO–CH2–C≡CH and (b) 1H NMR spectrum of Fc–COO–CH2–C≡CH.

B. Synthesis and characterization of β-CD–CH2–NH2
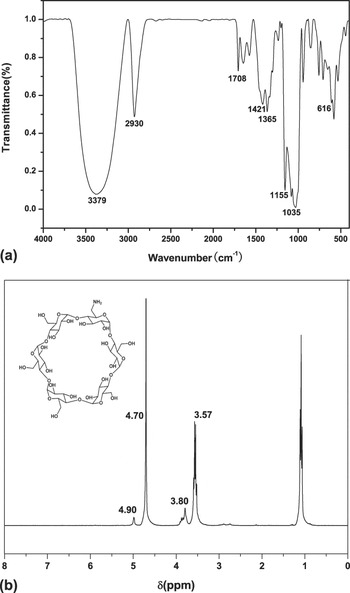
The structure of β-CD–CH2–NH2 was characterized by FT-IR and 1H NMR. In Fig. 2(a), the two peaks in 3450 cm−1 (N–H) and 3350 cm−1 (O–H) are overlapped in 3379 cm−1. It implies that β-CD–CH2–NH2 has been successfully prepared. 1035 cm−1 is the stretching vibration peaks of C–O bond in CD hydroxyl, 1155 cm−1 is the stretching vibration peaks of C–O–C bond in CD molecules. In Fig. 2(b), the peak of at δ = 4.90 ppm is attributed to the protons of O–H. The peak of at 3.80 ppm is attributed to the protons of β-CD. The peak of at 3.57 ppm is attributed to the protons of –NH2, indicating that the successful linkage between β-CD and –NH2.
(a) FT-IR spectrum of β-CD–CH2–NH2 and (b) 1H NMR spectrum of β-CD–CH2–NH2.

C. Synthesis and characterization of Fc–PAA–β-CD
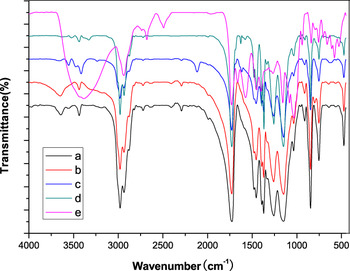
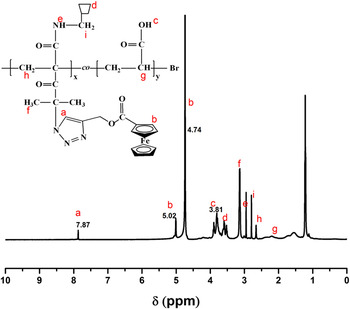
The structure of Fc–PAA–β-CD was characterized by FT-IR and 1H NMR. In Fig. 3, it can be found that 3380 cm−1 is the stretching vibration absorption in the spectrum of Fc–PAA–β-CD, which implies that successful reaction between β-CD–CH2–NH2 and Fc–PAA. The absorption bands at 1734 cm−1 (C=O) and 1665 cm−1 (C=C) implied the successful reaction between PAA and Fc. Considering the fact that the product has good solubility in D2O, D2O was chosen as the solvent to measure the 1H NMR spectrum of Fc–PAA–β-CD. In Fig. 4, the peak of at δ =7.87 ppm is attributed to the protons of C=C, the peak of at 4.21, 4.74, and 5.02 ppm are attributed to the protons of Fc, indicating that Fc has been decorated on the supramolecular polymer. The peaks in the range of 3.61–3.81 and 3.80–4.01 ppm are attributed to the characteristic peaks of β-CD. Finally, it could be concluded from the figures that the supramolecular polymer of Fc–PAA–β-CD has been synthesized. The amount of functionalization in the polymer is x = 13.6, y = 37.4.
FT-IR spectra of (a) 2-MBP–PtBA, (b) 2-MBP–PtBA–Br, (c) 2-MBP–PtBA–N3, (d) 2-MBP–PtBA–Fc, and (e) Fc–PAA–β-CD.

1H NMR spectrum of Fc–PAA–β-CD.

D. Characterization of the micellar solution
The Fc–PAA–β-CD could undergo the self-assembly process to form a supramolecular gel structure by in aqueous solution. Firstly, pyrene was used as fluorescence probe to measure the CAC of the micellar solution, analyzing the hydrodynamic diameter (D H) of the micelles by DLS. Meanwhile, the appearance of the self-assembly of the micelles was characterized by TEM.
1. Analysis of the fluorescence spectroscopy
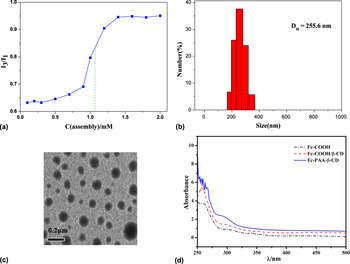
The fluorescence spectroscopy was used to characterize the CAC. Firstly, the ratio of the fluorescence emission intensities at 384.0 and 373.0 nm (I 3/I 1) was measured, and its dependence on concentration was shown in Fig. 5(a). The middle point of the spectrum shows that the CAC of the Fc–PAA–β-CD supramolecular solution is approximately 1.15 mg/mL.
(a) CAC, (b) DLS, (c) TEM characterization of Fc–PAA–β-CD assembly, and (d) UV–Vis absorption spectra of Fc–COOH, Fc–COOH/β-CD and Fc–PAA–β-CD.

2. Analysis of DLS and TEM
After the measurement of the CAC, DLS was utilized to characterize the size and size distribution of the Fc–PAA–β-CD supramolecular micelles. Fc–PAA–β-CD (20 mg) was dissolved in a 10 mL deionized water to get a concentration of 2 mg/mL. Then the solution was ultrasonically treated, stirred, and left standing at room temperature. From Fig. 5(b), we can calculate that the hydrodynamic diameter (D H) of the micelles is about 255.6 nm. Additionally, the appearance of the assembly was characterized by TEM. It can be seen from Fig. 5(c) that Fc–PAA–β-CD supramolecular assembly is in the form of micelles, and the size distribution is from 210 to 230 nm, which is also consistent with the DLS measurement.
E. Characterization of the host–guest interactions
UV–Vis absorption spectra and CV were performed to characterize the host–guest interactions.
1. Analysis of UV–Vis absorption spectra
Initially, the absorption spectra of Fc–COOH (2 mg/mL), Fc–COOH/β-CD (2 mg/mL), and Fc–PAA–β-CD (2 mg/mL) were measured in ultrapure water at room temperature, respectively. In Fig. 5(d), single Fc–COOH displayed a characteristic Fc absorption at 307 nm in the UV–Vis spectra. Increasing the amount of the β-CD host in the Fc-COOH solution resulted in Fc–COOH/β-CD absorption at 302 nm in the UV–Vis spectra, implying the formation of inclusion complexes between β-CD and Fc–COOH. Furthermore, it also shows the formation of inclusion complexes, while Fc–PAA–β-CD displays a Fc absorption at 294 nm compared with β-CD/Fc–COOH. Reference Zuo, Luo, Ding, Zheng, Cheng and Peng31 These results demonstrated that supramolecular polymer was formed inclusion complexes of Fc–PAA–β-CD through their Fc–CD complementary pairs.
2. Analysis of CV
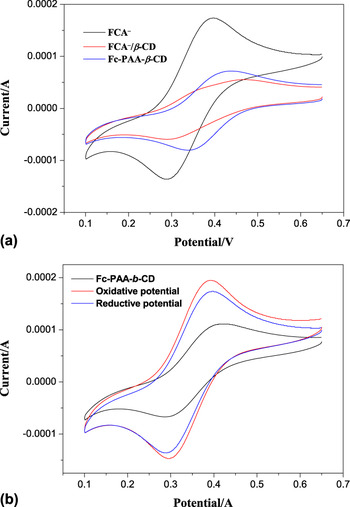
CV is often applied in characterizing the host–guest interactions between Fc and β-CD. Generally, Fc is more difficult to oxidize after the binding of β-CD, which causes the half-wave potential (E 1/2) in the CV shifting to a more positive value. On the contrary, if the host–guest interactions decrease or disappear, the peak potential will become more negative. We took Fc–COOH (FcA) as a model guest molecule to study its interactions with β-CD in the supporting electrolyte of 0.2 M NaBr. The CV result is shown in Fig. 6(a), from which we can see that the CV curves of FcA− (2 mg/mL) retain their reversible shapes, but the peaks shift to a more positive potential. The peak potential of FcA− is 0.357 V, while the peak potentials are 0.367 and 0.415 V in the presence of FcA−/β-CD (2 mg/mL) and Fc–PAA–β-CD (2 mg/mL), respectively. This result fully implies the formation of inclusion complexation between Fc and β-CD in FcA−/β-CD and Fc–PAA–β-CD.
(a) CV curves of Fc–COOH, Fc–COOH/β-CD, and Fc–PAA–β-CD CV curves of Fc–COOH, Fc–COOH/β-CD, and Fc–PAA–β-CD and (b) CV curves of the inclusion complexation between Fc and β-CD in the Fc–PAA–β-CD under no stimulus, oxidative potential, and reductive potential.

F. Characterization of voltage-responsiveness of assembly
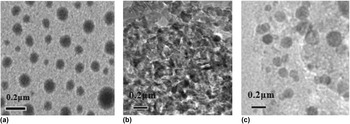
Relative CV analysis was carried out to further elucidate the reversibility and TEM traced all of the morphological changes in response to the redox potential. When characterizing the voltage-responsive ability of the reversibility, Fc–PAA–β-CD was also firstly used to form the aqueous solution. As expected, in Fig. 6(b), the redox curves demonstrate that the micelles undergo an electrochemically controlled assembly–disassembly process. With no external electric field, Fc–PAA–β-CD polymer exhibited a typical redox cycle: the half-wave potential (E 1/2) was +0.403 V and the peak current (i p) was 1.7 mA. As shown in Fig. 7(a), the supramolecular polymer can self-assemble into typical spherical micelles. When an oxidative potential (+1.0 V) was applied to the polymers solution for 3 h, the half-wave potential (E 1/2) was +0.382 V and the peak current (i p) was 1.1 mA. Fc changes to an Fc+ moiety, which results in a remarkable decrease of half-wave potential, indicating a dissociated process between Fc and β-CD. As shown in Fig. 7(b), the spheres micelles were disrupted and they could not retain their shapes. In the presence of an opposite voltage (−1.0 V) for reducing the Fc+ moiety, the half-wave potential (E 1/2) was 0.398 V and the peak current (i p) was 1.6 mA. As shown in Fig. 7(c), the spheres micelles could be restored. That is to say, the dissociative monomers are able to repolymerize under reductive control. By applying an alternating potential, it is proven that redox-responsive supramolecular polymer assembly and disassembly are reversible.
TEM images of the voltage-responsive assembly and disassembly of Fc–PAA–β-CD: (a) no stimulus, (b) +1.0 V stimulus for 3 h, and (c) −1.0 V stimulus for 2 h.

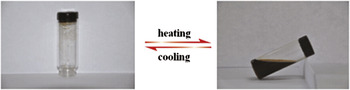
As self-healing properties can be achieved using supramolecular materials that consist of host and guest polymers, we investigated the effect of the temperature on the phase transition of the Fc–PAA–β-CD hydrogel. Fc–PAA–β-CD was dissolved in a 2% (w/v) wt deionized water solution to a concentration of 10 mg/mL. Then the solution was ultrasonically treated, stirred, and left standing at room temperature to allow the formation of the supramolecular gels (Fig. 8). Upon heating to 60 °C, the supramolecular gel can be converted into a solution, since the high temperature leading the Fc and β-CD complex to dissociation. Upon cooling to 20 °C, nearly transparent supramolecular gels formed again. This supramolecular material not only has the property of redox response but also can self-healing at room temperature. Reference Tian, Chen and Allcock32
Illustration of redox-responsive supramolecular polymer gel–sol transitions.

IV. CONCLUSIONS
We have developed a novel supramolecular polymer with host and guest molecules. The structure of Fc–PAA–β-CD was characterized by 1H NMR, FT-IR absorption spectra. UV–Vis absorption and CV were utilized to characterize the interactions between the host and guest polymers. Furthermore, the CAC of micellar solution of Fc–PAA–β-CD was measured by pyrene fluorescence probes. DLS and TEM were used to characterize the size and behavior of these micelles. Due to electrochemical control, the supramolecular polymer can self-assemble into a micellar structure and exhibit the voltage-triggered reversible self-degradable and self-repairable behavior. Because of the host–guest interaction between Fc and β-CD, the redox-responsive gel–sol transitions are completely reversible, reflecting the dynamic nature of this supramolecular polymeric material. All of the above properties suggest that they have potential applications as electrochemical and smart material.