INTRODUCTION
In a recent questionnaire study (Gatehouse & Noble, 2004) elderly hearing-impaired adults reported difficulties in attentionally-demanding listening situations. The extent of these difficulties was significantly correlated with their self-reported handicap, even after accounting for the sensory effects of hearing loss. Assessing the nature of their auditory attention difficulties is problematic. Routine audiological examinations present sounds at predictable times and locations, and therefore do not evaluate attentional skills. Clinical tests of attention are typically visual, for example, the Attention Network Test (ANT) (Fan et al., 2002), or contain subtests which are arbitrarily presented in the visual or auditory modality, for example, the Test of Everyday Attention (TEA) (Robertson et al., 1996). A reliable test of auditory attention skills would also be beneficial in the assessment of auditory processing disorder (APD). Patients with APD have normal peripheral hearing but experience difficulty with situations such as listening in background noise and processing degraded speech (Jerger & Musiek, 2000). Efforts are currently being aimed at identifying reliable diagnostic tests and criteria (Cowan et al., 2005), and would be aided by the ability to assess the influence of auditory attention skills (Jerger & Musiek, 2000). Rehabilitation for attentional problems has been shown to be more effective when directed at the specific attentional skill that is impaired (Sturm et al., 1997). Therefore assessment of more than one type of attention can be particularly useful in tailoring rehabilitation programs to individual needs.
In this study, we compared performance on visual and auditory versions of the ANT. The ANT was selected because it separately evaluates three attentional skills within a single test, which takes only 30 minutes to administer. It has been used successfully with clinical groups (Posner et al., 2002; Wang et al., 2005) and adapted for use with children (Mezzacappa, 2004; Rueda et al., 2004). If the behavioral measures obtained from the visual and auditory versions produce similar and correlated results, tests of visual attention might be appropriate for evaluating auditory attention skills. This would circumvent the problem of presenting hearing-impaired adults with an auditory test, and would also exploit the fact that tests of visual attention, such as the ANT and subtests of the TEA, are well established. A formal test of this possibility seems timely.
The ANT uses a cueing task (Posner, 1980) to assess alerting and spatial orienting, and a flanker task (Eriksen & Eriksen, 1974) to assess executive control. All three attentional skills are well established, and have been investigated in their own right using both visual and auditory tasks. For example, levels of alertness can be modulated by both visual and auditory cues (Fernandez-Duque & Posner, 1997; Posner, 1978), and spatial orienting has been investigated extensively using cueing tasks in both visual (Nobre et al., 2000; Rosen et al., 1999) and auditory (McDonald & Ward, 1999; Spence & Driver, 1994) modalities. A number of different methodologies are commonly used to investigate executive control, including flanker, Stroop, and spatial conflict tasks. While these tasks are nearly always presented in the visual modality (Fan et al., 2003; MacLeod, 1991), tests do exist in the auditory modality (Green & Barber, 1983; McClain, 1983), and produce similar behavioral results to the visual tests.
The original ANT study (Fan et al., 2002) tested forty healthy volunteers. Subjects were on average 47 ms faster to respond to the target following a warning cue (alerting), and gained an additional benefit of 51 ms from a warning cue that also cued target location (spatial orienting). Responses were 84 ms slower to incongruent target stimuli compared with congruent stimuli (executive control). The executive control measure was not only of the highest magnitude, but also had the best test-retest reliability, with a correlation of .77. The alerting and spatial orienting measures were also correlated across sessions, although less reliably (correlations of .52 and .61, respectively). Importantly, Fan et al. (2002) reported no significant correlations between the three measures of attention, indicating that the attention networks are likely to be independent of each other.
Additional evidence for the independence of the attentional networks comes from neuroimaging and neurochemical studies, which suggest that each type of attention is associated with specific cortical regions and neurotransmitters. Studies of sustained attention (increased arousal over a long time period) have identified a right fronto-parietal network (Pardo et al., 1991), and a role for the thalamus (Kinomura et al., 1996). Differences in phasic alertness following warning cues indicate an additional role for left-hemisphere frontal and parietal sites (Sturm & Willmes, 2001). These patterns of activation appear unchanged when participants perform such tasks in the auditory or somatosensory modalities (Pardo et al., 1991; Sturm & Willmes, 2001). Neurochemical studies have shown that sustained attention and increased arousal following warning cues are influenced by changes to levels of norepinephrine (Marrocco & Davidson, 1998). Orienting visual attention to a spatial location is associated with a fronto-parietal network of activation that includes the superior parietal lobes and frontal eye fields (Kanwisher & Wojciulik, 2000; Kastner et al., 1999). Some studies, particularly those based on patients with localized lesions (Vallar, 1998), indicate a right-hemisphere bias associated with visual spatial orienting deficits. A recent fMRI study of auditory orienting (Mayer et al., 2006), revealed a similar fronto-parietal network of activation to that found in visual studies, but without the bias towards the right hemisphere. Neurochemical studies associate selective attention with the cholinergic system (Marrocco & Davidson, 1998). Executive control is typically assessed using conflict-resolution tasks such as the Stroop task, and is most consistently associated with activation in the anterior cingulate cortex and dorsolateral prefrontal cortex (Badre & Wagner, 2004). There is some suggestion that dopamine may play a role in executive control (Posner & Fan, in press).
To directly compare activation associated with each of the networks, Fan et al. (2005) used event-related fMRI while subjects performed the ANT. Each type of attention was associated with activation across a range of sites, but with only limited overlap between the networks. A conjunction analysis showed common activation in the thalamus and left fusiform gyrus during alerting and executive control, but no areas were commonly activated by alerting and orienting, or by orienting and executive control. Behavioral results from this study confirm the robustness and independence of the measures, finding uncorrelated effects of 60, 31, and 102 ms for the alerting, orienting, and executive control measures, respectively.
The reliability of the visual ANT measures, and their behavioral and anatomical independence, indicate that alerting, spatial orienting, and executive control are fundamental attentional domains. It should therefore be expected that behavioral correlates of these domains will not vary markedly across presentation modalities. To test this hypothesis, we created a close auditory analogue of the visual ANT, and tested both versions on the same group of subjects. The following outcomes are predicted:
- Behavioral measures of alerting, spatial orienting, and executive control will be unaffected by presentation modality. The auditory and visual ANTs will elicit reaction-time (RT) measures that are of a similar magnitude, and correlated across tasks.
- The independence of the attentional networks will also be unaffected by presentation modality. Within each task there will be no significant correlations between the RT measures of alerting, spatial orienting, and executive control.
METHOD
The ANT derives separate measures of each attentional skill by comparing performance across different trial types (illustrated in Figure 1). Different cueing conditions provide measures of alerting (no cue–double cue) and spatial orienting (center cue–spatial cue), while different target conditions provide a measure of executive control (incongruent targets–neutral targets).

Illustration of the procedure, cue conditions, and target conditions in the visual and auditory attention network tests (ANTs).
Research Participants
Participants were recruited through poster advertisements placed in the University of Nottingham. Forty (19 male, mean age 23.7 years) native-English speaking healthy volunteers participated. All had normal or corrected-to-normal vision, and normal or near-normal hearing [thresholds below 25 decibels hearing level (dB HL) at frequencies between 250 and 8000 hertz (Hz), inclusive]. Two further participants were excluded for having thresholds greater than 25 dB HL. Participants gave informed consent prior to the study and were paid at a rate of £5 per hour.
Apparatus and Stimuli
Testing was conducted in a sound-attenuating chamber. Visual stimuli were presented on a 15-inch flat-screen monitor, viewed from a distance of 65 cm. Auditory stimuli were presented via Sennheisser HD-480II headphones, in the range 70–80 dB(A).
The visual ANT methodology (Figure 1) followed that of Fan et al. (2002). Each trial began with a fixation cross at the center of the screen for a short, variable period of time (between 2400 and 3600 ms). A cue then appeared in the form of a briefly presented (100 ms) asterisk, followed by a 400 ms pause during which the fixation cross was again visible. The target stimulus was then presented, either above or below the fixation cross. The subject's task was to indicate with a button press whether the central arrow in the target array was pointing to the left or to the right. Performance with different cue types provided measures of subjects' ability to increase their alertness and to orient their attention in space. There were four cue types: no cue; a single central cue; a double cue (an asterisk at both possible target locations); and a spatial cue (presented at one of the possible stimulus locations). The spatial cue accurately predicted the target location (100% valid). Performance with different target stimuli provided a measure of subjects' ability to overcome conflict. The target arrow could be flanked by arrows pointing in the opposite direction (incongruent), the same direction (congruent), or by straight lines (neutral). A single arrow subtended 0.55° of visual angle, the spaces between the items subtended 0.06° of visual angle, and the entire stimulus (target arrow plus four flankers) subtended a total of 3.08° of visual angle. Each stimulus appeared 1.06° above or below the fixation cross.
The auditory task (also illustrated in Figure 1) followed a similar protocol, but the task was to determine whether the target word was spoken on a high or low pitch (ignoring the word meaning). A 500-Hz fixation tone was used in place of the fixation cross and was presented diotically (identical signals to both ears). Since there are no timing or amplitude differences, diotic stimuli are perceived at the center of the head (Blauert & Lindeman, 1986). Auditory cues were 50-ms bursts of speech-shaped noise, cosine gated for 10 ms at the onset and offset. Diotically-presented cues were perceived in the center of the head (center cues). Monaurally-presented cues were heard at the left or right ear (spatial cues). A double cue was created by presenting statistically independent noise bursts to the two ears. Such uncorrelated noise is typically perceived as separate sounds at the two ears (Blauert & Lindeman, 1986). Conflict was generated through an auditory Stroop task. A female talker was recorded saying the words ‘high’, ‘day’, and ‘low’ on a high or low pitch. The stimuli were then digitized at a sampling rate of 44,100 16-bit samples per second. Three examples of each word were selected from a larger corpus to have approximately equal duration and intensity. High-pitched words had an average fundamental frequency (f0) of 290 Hz; low-pitched words had an average f0 of 178 Hz. Responses were made via two adjacent buttons on a response box. The box was turned through 90° between tasks so that in the visual task subjects pressed left and right buttons to respond left and right, respectively, and in the auditory task subjects pressed top and bottom buttons to respond high and low, respectively.
Procedure
Participants were presented with two blocks of the visual ANT and two blocks of the auditory ANT, using an ABBA counterbalance. Each block contained 144 trials. Prior to each block, subjects were given a 24-trial practice session with feedback. Subjects were instructed to respond as quickly and as accurately as possible. Each experimental block lasted approximately eight minutes.
RESULTS
Reaction times (RTs) from correct trials were trimmed to exclude outlying responses. We set the lower cut-off at 100 ms to exclude anticipatory responses, and the upper cut-off at 2000 ms to exclude unusually slow responses. Trimming resulted in the removal of 1.1% of responses. Since RT distributions are skewed we calculated median values from the remaining RTs. Means and standard deviations of these median values are listed in Table 1.
Mean reaction times (ms) for different trial types in the visual and auditory attention network tests (ANTs)

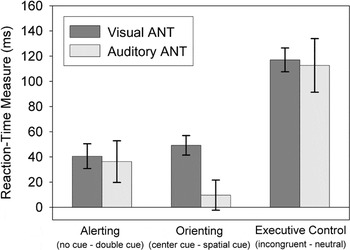
Alerting, spatial-orienting, and executive-control effects were analyzed using paired t tests. Significant alerting benefits (no cue–double cue) were found in both the visual [t(39) = 8.4, p < .001] and the auditory [t(39) = 4.4, p < .001] modalities. Spatial-orienting benefits (center cue–spatial cue) were found in the visual modality [t(39) = 12.8, p < .001], but not the auditory modality [t(39) = 1.6, p = .11]. Executive control costs (incongruent–neutral) were large and significant in both visual [t(39) = 25.0, p < .001] and auditory [t(39) = 10.7, p < .001] modalities. Figure 2 shows the size and variability of these effects and reveals that measures of all three attention networks were more variable in the auditory task than the visual task. Error rates were low: 2.4% in the visual ANT and 4.8% in the auditory ANT. Overall, subjects made more errors on the auditory task than the visual task [t(39) = 3.9, p < .001], and responded more slowly [t(39) = 6.7, p < .001], suggesting a difference in the difficulty level of the two tasks.

Reaction time measures of alerting, spatial orienting, and executive control from the visual and auditory attention network tests (ANTs). Error bars show 95% confidence intervals.
Paired t tests and Pearson correlation analyses were conducted to directly compare alerting, orienting, and executive control RT measures obtained from the visual and auditory tasks. Alerting benefits from the two tasks were not significantly different [t(39) = −0.5, p = .64], but were also not significantly correlated (r = .09, p = .60). Spatial-orienting benefits were obtained in the visual task but not the auditory task, and this was reflected in a significant difference between the measures obtained by the two tasks [t(39) = −5.7, p < .001]. Visual and auditory measures of spatial orienting were not significantly correlated (r = .05, p = .76). Measures of executive control were of a similar magnitude [t(39) = −0.4, p = .66] and significantly correlated (r = .33, p < .05) across tasks.
Reliability and Independence of the Networks
Participants performed two 144-trial blocks of each ANT. While this is not an ideal number of trials on which to evaluate test reliability, it nonetheless provides some indication of internal consistency. RT measures of executive control were significantly correlated across testing blocks for both the visual (r = .44, p < .01) and auditory (r = .34, p < .05) ANTs. The correlation between spatial-orienting measures from the two visual blocks approached significance (r = .29, p = .07), but there was no comparable relationship between auditory measures (r = −.11, p = .52). Measures of alerting did not correlate across blocks for either the visual (r = .17, p = .30) or auditory (r = .12, p = .45) tasks.
Within each ANT there were no significant correlations between RT measures of alerting, spatial orienting, and executive control (p > .05), supporting the notion that the networks are independent. A two-way repeated measures analysis of variance (ANOVA) (with Greenhouse-Geisser correction for lack of sphericity) revealed a significant interaction between cue and target conditions in the visual ANT [F(6,234) = 10.6, p < .001], but not the auditory ANT [F(6,234) = 1.0, p = .46]. The interaction in the visual ANT appears to be primarily due to a larger alerting effect with congruent stimuli than with incongruent or neutral stimuli, but also reflects greater executive-control costs following a double cue than following a spatial cue.
DISCUSSION
The same group of subjects participated in matched visual and auditory attention network tests in order to investigate two hypotheses: that behavioral measures of alerting, spatial orienting, and executive control would be independent in both visual and auditory tests; and that these measures would be unaffected by presentation modality.
Independence of the Networks
There were no significant correlations between RT measures of alerting, spatial orienting, and executive control in either the visual or auditory ANT. However, as with the original ANT study (Fan et al., 2002), there was a significant interaction between cue and stimulus conditions in the visual ANT. Interdependence between the networks was also found in a larger-scale ANT study (Fossella et al., 2002), and in a study using a slightly amended version of the ANT (Callejas et al., 2004). However, Fan et al. (2005) commented that “it would be surprising if the networks did not communicate and thus influence each other with task demands” (p. 472), implying that some interaction between behavioral measures does not necessarily invalidate the claim of separate attentional networks. A corresponding interaction was not found in the auditory ANT, but it should be noted that auditory measures of all three attention networks were more variable than in the visual task.
Influence of Presentation Modality
The visual ANT produced significant effects of alerting, spatial orienting, and executive control, similar to those found in the original ANT study (Fan et al., 2002). Overall reaction times were longer in the auditory ANT (656 ms, compared with 553 ms in the visual ANT), suggesting that the auditory task was more difficult. This was also reflected in the error rates, which were 2.4% on the visual ANT, and 4.8% on the auditory ANT. In addition, auditory measures of the three networks were more variable than the corresponding measures from the visual ANT. Despite these differences, RT measures of executive control were of a similar magnitude and significantly correlated between visual and auditory tasks (although the correlations were relatively low and so only account for a proportion of the variance). Since the auditory measure was more variable than the visual measure, and also had worse internal consistency, the use of visual tests for obtaining reliable measures of executive control appears to be justified. Auditory and visual measures of alerting were also of a similar magnitude, but were not significantly correlated. Since alerting had poor internal consistency within-modality, it is perhaps unsurprising that the measures were not correlated across modalities. The neuroimaging literature (Pardo et al., 1991; Sturm & Willmes, 2001) reveals similar patterns of cortical activation during sustained attention and phasic alertness tasks performed in different sensory modalities. This finding, in combination with the similar behavioral measures obtained in this study, indicates that alerting may be a general attentional resource which is unaffected by task modality. If this conjecture is supported by further studies of alerting across modalities, established tests of visual attention might prove the most reliable tool for evaluating the efficiency of the general alerting network.
The most striking difference between the visual and auditory ANTs was the failure of the auditory ANT to elicit spatial-orienting benefits. Auditory spatial cues did not improve pitch judgments for stimuli presented at the cued location. This modality-specific effect may relate to differences in the way that spatial information is coded and processed in vision and audition. Spatial location plays a critical role in visual processing. Not only is visual information coded and represented spatiotopically, but variations in acuity across the retinae encourage overt orienting (eye movements) to regions of interest. In contrast, the main organizing principle of the auditory system is frequency. The spatial location of auditory sources must be calculated from acoustic cues such as interaural time and level differences, and spectral cues introduced by the head and pinnae. There is also less benefit to be gained from overtly orienting to the sound source. While target location does influence localization accuracy (Makous & Middlebrooks, 1990), it does not affect listeners' ability to identify targets (Mondor & Zatorre, 1995). These differences in the primacy of spatial information in the auditory and visual modalities are also evident in conceptions of unilateral neglect. While neglect is typically viewed as a disorder of visuospatial processing, patients with neglect have difficulty making judgments about the relationship between sequential auditory objects, even when both objects are presented from the same spatial location (Cusack et al., 2000).
While visual studies reliably elicit spatial-cue benefits, auditory spatial orienting is sensitive to both task demands and cueing protocols, and is most consistently found when the task contains a spatial component. Much of the variability in results from auditory cueing studies is accounted for by the spatial relevance hypothesis (McDonald & Ward, 1999). Previous researchers (e.g., Rhodes, 1987) had proposed that spatial orienting benefits would only be obtained in auditory cueing studies when listeners were required to encode the task stimuli spatially, such as during a localization task. McDonald and Ward extended this hypothesis by suggesting that listeners will also encode task stimuli spatially when they are presented with cues that are informative about target location, even with a nonspatial task such as a frequency discrimination. The spatial relevance hypothesis is largely supported by the literature. Spatial-cue benefits are reliably obtained when listeners perform spatial discrimination tasks (Bédard et al., 1993; McDonald & Ward, 1999; Quinlan & Bailey, 1995; Spence & Driver, 1994). However, when listeners perform nonspatial discrimination tasks, spatial-cue benefits are obtained only when cues are informative about target location; not when the target is equally likely to occur at the cued and uncued locations (McDonald & Ward, 1999; Spence & Driver, 1994). Detection tasks appear to constitute a special type of nonspatial task. Reaction times on detection tasks are substantially shorter than those on discrimination tasks, suggesting that listeners might be responding based on an early, nonspatial representation of the stimulus (Spence & Driver, 1994). Even detection-task studies that present informative spatial cues produce particularly inconsistent results. Some find spatial-orienting benefits (Bédard et al., 1993; Buchtel et al., 1996; Quinlan & Bailey, 1995), while others do not (Buchtel & Butter, 1988; Hugdahl & Nordby, 1994; Spence & Driver, 1994).
The sensitivity of auditory spatial orienting to task demands indicates fundamental differences in the operation of spatial attention across modalities. Although these differences could be accounted for by separate attentional resources for each perceptual modality, it seems more likely that the differences reflect an interaction between a supramodal orienting resource and modality-specific perceptual processing. According to this view, tests of visual spatial orienting may be appropriate for evaluating a supramodal orienting resource, but the results of such tests would not necessarily be informative about auditory spatial orienting.
How then can we obtain a reliable measure of auditory orienting? One approach is to enhance the spatial component of the task in order to obtain a more robust measure of auditory spatial orienting. The auditory ANT required subjects to perform a nonspatial task (pitch discrimination). However, the spatial cues accurately predicted target location, and should therefore have been sufficient to elicit spatial-orienting benefits. Since no such benefits were present, it appears that informative cues are not sufficient to engage auditory spatial attention under all experimental protocols. Whether this reflects specific issues associated with our experimental design or a more general lack of robustness cannot be determined from the small number of studies that have presented informative spatial cues with nonspatial tasks. However, some methodological issues merit further consideration. The stimulus onset asynchrony (SOA) was set to 650 ms. Because the time course of auditory orienting is not firmly established, this SOA may not have been optimal for detecting orienting benefits. In addition, the auditory ANT tested spatial-orienting benefits against a neutral-cue baseline. Studies that have successfully elicited auditory spatial-orienting benefits with nonspatial tasks and informative cues (McDonald & Ward, 1999; Spence & Driver, 1994) have used an invalid-cue baseline rather than a neutral-cue baseline. These studies therefore measured not only benefits from orienting to the correct location, but also costs from orienting to the wrong location. Presenting sounds in free-field (from speakers) rather than over headphones may also influence performance. Spatial-orienting benefits have been found with headphone presentation (Bédard et al., 1993; Sach et al., 2000), but the mechanisms by which attention is directed to internal and external sound sources may differ.
An alternative approach to investigating auditory orienting is to provide cues to nonspatial features of the auditory signal. Given that space is critical to visual processing, assessment of spatial orienting is meaningful in a test of visual attention. However, a more appropriate analogue for the auditory system might be orienting to pitch or frequency. Cues to target frequency have been shown to facilitate performance on a discrimination task (Mondor & Bregman, 1994). Similarly, listeners find it easier to segregate concurrently-presented vowel sounds when they have different fundamental frequencies (pitches) than when they have different perceived locations (Summerfield & Akeroyd, 1998).
Further investigation of auditory orienting is difficult within the constraints of the ANT methodology. Because the ANT derives measures of alerting, orienting, and executive control within a single test, experimental control over each individual measure is limited. It therefore seems necessary to further assess each network individually before attempting to create a combined auditory test that is suitable for clinical use. A final consideration is how applicable the results of the current study are to clinical groups. The participants in this study were healthy young adults (age range 16 to 42), but auditory processing disorder is primarily investigated in children (Jerger & Musiek, 2000), and self-reports of auditory attention difficulties have come from elderly, hearing-impaired adults (Gatehouse & Noble, 2004). Whether the visual and auditory tests are equally sensitive to attentional deficits has yet to be determined.
CONCLUSION
Matched visual and auditory attention network tests revealed similar and correlated measures of executive control, suggesting that executive control might be a domain-general process that is unaffected by test modality. Measures of alerting were also similar across the two tests, but were not significantly correlated. Strikingly, while spatial-orienting benefits were reliably obtained in the visual test, no such benefits were detected by the auditory test. This result may reflect an interaction between a supramodal orienting resource and modality-specific sensory processing.
ACKNOWLEDGMENTS
This work was supported by the Medical Research Council (MRC), including an MRC research studentship awarded to KLR.