1 Introduction
Mazatec is an Otomanguean language of the Popolocan branch. This study investigates the acoustics of the phonation type contrasts in the San Felipe Jalapa de Díaz (henceforth Jalapa) dialect, which according to a 2005 census is spoken by approximately 24,200 people in Mexico, in North Oaxaca and Veracruz states (Gordon Reference Gordon2005). Jalapa Mazatec has a five-vowel system with length and nasalization contrasts. In addition, there are three tone levels (low, mid, and high) and three phonation type contrasts (breathy, modal, and laryngealized). The laryngealized phonation has in the past been referred to as ‘creaky’ (Kirk, Ladefoged & Ladefoged Reference Kirk, Ladefoged, Ladefoged, Mattina and Montler1993), but Blankenship (Reference Blankenship2002) preferred the term ‘laryngealized’, because laryngealized phonation is often used for phonation with stiffer vocal folds than modal voice but that does not involve actual creak (Ladefoged Reference Ladefoged, Bless and Abbs1983, Gerfen & Baker Reference Gerfen and Baker2005). In keeping with her work, we will also use this term. All three tones and phonation types are independent of one another and may occur on all five vowels. A thorough description of Jalapa Mazatec phonetics is available in Silverman et al. (Reference Silverman, Blankenship, Kirk and Ladefoged1995).
In their survey of phonation types in the world's languages, Gordon & Ladefoged (Reference Gordon and Ladefoged2001) cite few languages with phonation type contrasts on vowels (Gujarati, !Xóõ, Kedang, Hmong, Mpi, Bruu, Yi, Haoni, Jingpho, Wa), and only four with three contrasting categories: Jalapa Mazatec, San Lucas Quiaviní Zapotec, Burmese, and Chong. However, at least some dialects of Hmong belong here too, and other varieties of Chong that combine three phonation types to contrast four registers (Huffman Reference Huffman, Ratanakul, Thomas and Premsrirat1985, Thongkum Reference Thongkum and Fujimura1988, Silverman Reference Silverman1996, DiCanio Reference DiCanio2009). A language with three phonation contrasts not included in Gordon & Ladefoged (Reference Gordon and Ladefoged2001) is Ekoka !Xung (König & Heine Reference König and Heine2001). Languages with more than three contrastive phonation types are of course very rare, and none are mentioned by Gordon & Ladefoged (Reference Gordon and Ladefoged2001), but they include languages with four phonation type contrasts such as Bor Dinka (Edmondson & Esling Reference Edmondson and Esling2006), and Ju|’hoansi (Miller Reference Miller2007). Finally, !Xóõ (Traill Reference Traill1985) has been described as having five phonation type contrasts: breathy, modal, glottalized, pharyngealized, and strident.
Jalapa Mazatec is rare in contrasting three phonation types and three tones independently. Most languages (and even other Mazatec dialects) with phonation type and tone contrasts have constraints on which phonation and tone combinations are legal. These languages are categorized by Silverman (Reference Silverman1997) as being ‘laryngeally simplex’, in contrast to the ‘laryngeally complex’ languages that do indeed fully cross-classify phonation type and tone. The Otomanguean and Nilotic (e.g. Dinka, Andersen Reference Andersen1993) language families are unusual in that they include languages that distinguish several phonation types and tones independently on vowels. The independent tone and phonation type contrasts in Jalapa Mazatec make the language particularly suited for investigating how phonation type contrasts may vary by tone, speaker sex, and time. Previous studies of Mazatec have ignored or controlled tone contrasts to focus on the phonation type contrasts, with the exception of Silverman (Reference Silverman, Local, Ogden and Temple2003), which focused on the perception of Mazatec tones in modal vs. breathy vowels.
Like previous studies (Blankenship Reference Blankenship1997, Silverman Reference Silverman1997), we will consider timing and sex effects on phonation in Mazatec. The present study is thus novel in trying to account for influences of sex, tone, and time on phonation type contrasts. We find notable differences in how contrasts are made across these three variables, lending further support to the notion that phonetic cues to phonation are both numerous and context-varying.
1.1 Measures of phonation
Traditionally, phonation type contrasts have been distinguished using acoustic measures, though more recently there have been studies of physiological aspects of phonation production. One of the most popular models of phonation type contrasts is the continuum of glottal stricture (Ladefoged Reference Ladefoged1971, Gordon & Ladefoged Reference Gordon and Ladefoged2001). This model only refers to the average aperture between the vocal folds in accounting for the major differences across voice qualities. Modal voice is characterized by an average opening that allows complete closure during glottal periods (e.g. Titze Reference Titze, Fujimura and Hirano1995); breathy voice is characterized by a greater average opening, typically with only incomplete closure of the vocal folds during glottal periods; creaky or laryngealized voice is characterized by a smaller average opening, typically with a very small maximum opening during glottal periods. The major reasons for the popularity of this model are first, its simplicity; second, that breathy, modal, and creaky phonation types can usually be ordered along the various acoustic measures of voice (an argument made explicitly by Blankenship Reference Blankenship2002); and third, that a direct relation has been found between measures related to average glottal opening and the acoustics, as will be described below.
However, clearly the activity of the vocal folds can vary in more ways than represented by glottal stricture, e.g. Laver (Reference Laver1980), Hanson (Reference Hanson1995), Hanson et al. (Reference Hanson, Stevens, Kuo, Chen and Slifka2001), and other literature reviewed by Baken & Orlikoff (Reference Baken and Orlikoff2000). And even more strikingly, direct observation of the laryngopharynx has shown that languages may use articulators other than the vocal folds to distinguish phonation types. For example, Edmondson & Esling (Reference Edmondson and Esling2006) claim that six different ‘valves’ comprising different articulators are used in the production of voice quality: glottal vocal fold adduction, ventricular incursion, upward and forward sphincteric compression of the arytenoids, epiglotto-pharyngeal constriction, larynx raising, and pharynx narrowing. To the extent that these (or other) articulations underlie phonation type contrasts, the uni-dimensional glottal stricture model is insufficient. However, this plethora of physiological dimensions of voice quality variation makes it all the more intriguing that the standard acoustic measures tend to define continua of phonation type contrasts.
Because in this study we collected no articulatory data, our analysis of the phonation types in Mazatec can only be based on the acoustic measures of the recorded sound files. The most widely used acoustic measure of phonation is H1-H2, i.e. the difference between the amplitudes of the first harmonic (the fundamental) and the second harmonic in the spectrum. H1-H2 was introduced by Bickley (Reference Bickley1982), following earlier work showing that H1 was important in the perception of breathiness, e.g. Fischer-Jørgensen (Reference Fischer-Jørgensen1967). H1-H2 has been shown to correlate with Open Quotient (OQ) (Holmberg et al. Reference Holmberg, Hillman, Perkell, Guiod and Goldman1995) or, alternatively, with Contact Quotient derived from electroglottography (DiCanio Reference DiCanio2009, Kuang Reference Kuang2011). Other work suggests that H1-H2 also correlates with the skew of the glottal pulse (Henrich, d'Alessandro & Doval Reference Henrich, d'Alessandro and Doval2001), and thus the relation between H1-H2 and OQ can be weak (Kreiman et al. Reference Kreiman, Iseli, Neubauer, Shue, Gerratt and Alwan2008). Despite the continuing debate as to its articulatory correlates, H1-H2 has been found to distinguish among contrastive phonation types in many studies. For example, in a cross-linguistic sample of breathy versus modal phonation, Esposito (Reference Esposito2006, Reference Esposito2010a) found that H1-H2 distinguished these phonation types in eight out of the 10 languages or dialects. Moreover, Hanson (Reference Hanson1997) showed that H1-H2 is not well-correlated with other acoustic measures in English, and Kreiman, Gerratt & Antoñanzas-Barroso (Reference Kreiman, Gerratt and Antoñanzas-Barroso2007) found that H1-H2 accounted for the most variance in English voices out of 19 different spectral measures.
Other acoustic measures are thought to reflect other aspects of phonation. The strength of higher frequencies in the spectrum is thought to be related to the closing velocity of the vocal folds, to the presence of a posterior glottal opening, and to the simultaneity of ligamental closure (Stevens Reference Stevens1977, Hanson et al. Reference Hanson, Stevens, Kuo, Chen and Slifka2001), among other possible influences. Higher frequency energy is usually measured as the amplitude of H1 relative to the amplitudes of F1 (A1), F2 (A2), and F3 (A3), as H1-A1, H1-A2, and H1-A3. These formant amplitude measures also reflect the bandwidths of the corresponding formants, and Hanson et al. (Reference Hanson, Stevens, Kuo, Chen and Slifka2001) interpret H1-A1 in particular as reflecting the effect of a posterior glottal opening.
Esposito (Reference Esposito2006, Reference Esposito2010a) found that H1-A3 and H1-H2 were both fairly good at distinguishing the phonation types within languages, while Blankenship (Reference Blankenship2002) found that H1-A2 better distinguished breathy from modal phonation in Chong than H1-H2 (and similarly DiCanio (Reference DiCanio2009) for H1-A3).
Moreover, non-modal phonations, especially breathy voice, have been quantified by the presence of noise. Cepstral Peak Prominence (CPP) is thought to reflect the harmonics-to-noise ratio (Hillenbrand, Cleveland & Erickson Reference Hillenbrand, Cleveland and Erickson1994). It is similar to the harmonics-to-noise ratio measure of de Krom (Reference de Krom1993), but differs in how the ‘prominence’ of the cepstral peak is calculated, i.e. it is taken as the difference in amplitude of the cepstral peak and a regression line used to normalize for window size and overall energy. A more prominent cepstral peak indicates stronger harmonics above the floor of the spectrum. This in turn can result from greater periodicity in the speech signal (thus, little jitter or shimmer). CPP has specifically been used in studies on phonation to distinguish breathy from non-breathy voice qualities, for both production and perception (Blankenship Reference Blankenship2002; Esposito Reference Esposito2006, Reference Esposito2010a). Esposito (Reference Esposito2006, Reference Esposito2010a) found that CPP was the best of the eight measures she considered at distinguishing modal from breathy phonation types. Recent studies have applied this or similar noise measures (e.g. harmonics-to-noise ratio, jitter, and shimmer measures) to differentiate a variety of phonation types such as breathy, glottalized, and epiglottalized voices, e.g. Andruski & Ratliff (Reference Andruski and Ratliff2000) and Andruski (Reference Andruski2006) on Mong; Blankenship (Reference Blankenship2002) on Mazatec, Chong, and Mpi; Wayland & Jongman (Reference Wayland and Jongman2003) on Khmer; Avelino (Reference Avelino2010) on Yalálag Zapotec; and Miller-Ockhuizen (Reference Miller-Ockhuizen2003) and Miller (Reference Miller2007) on Ju|’hoansi.
Specifically with respect to Mazatec, Blankenship (Reference Blankenship2002) found that all three measures she tested, H1-H2, H1-A2, and CPP, were equally effective in distinguishing breathy from modal phonation types, while CPP was less effective for laryngealized vs. modal. Esposito (Reference Esposito and Khan2010a), characterizing the stimuli she used in a cross-language perception experiment, found that four measures, CPP, H1*-H2*, H1*-A1*, and H1*-A2* (where the asterisks indicate that these measures were corrected for vowel formants), each distinguished Mazatec breathy and modal phonation types. Furthermore, however, her Linear Discriminant Analysis showed that H1*-A2* accounted for 53% of the variance in the Mazatec items, and thus was the most important measure of the contrast; H1*-A1* accounted for a further 20% and H1*-H2* another 14%.
1.2 Previous work on sex, time, and tone effects on phonation
It is well-known that, on average, American women tend to have breathier voices than men (Klatt & Klatt Reference Klatt and Klatt1990, Hanson & Chuang Reference Hanson and Chuang1999), though the opposite was found to be true for Ju|’hoansi by Miller-Ockhuizen (Reference Miller-Ockhuizen2003) and for Yi by Kuang (Reference Kuang2011). Beyond such overall differences, differences in the acoustics of men and women in contrasting phonation types have been found in the work by Esposito on Santa Ana del Valle Zapotec (SADV; Esposito Reference Esposito2004, Reference Esposito2005, Reference Esposito2010b). She found that in this language, the three phonation types (breathy, modal, and creaky) were distinguished by H1-H2 for women and H1-A3 for men. These differences were further bolstered by electroglottographic data showing the same pattern with articulatory correlates of H1-H2 and H1-A3, namely contact quotient and a measure of closing/opening symmetry, respectively. While her study used data from only five speakers (three men and two women), her findings suggest that phonation type contrasts may be produced differently by men and women. In contrast, it appears from the figures in Blankenship (Reference Blankenship1997: figures 70–73) that Mazatec women made larger distinctions among the phonation types on all three measures (CPP, H1-H2, H1-A2) than the men did, though perhaps largest on CPP. As Blankenship reports, women produced breathier breathy phonation than men did, but this appears to have been part of a larger pattern of enhanced contrasts in women's speech.
The timecourse of phonation has been shown to differ across phonation types and languages as well (see review in Section 4 of Gordon & Ladefoged Reference Gordon and Ladefoged2001). Silverman (Reference Silverman1997) provides a typological overview of various languages, including Mazatec, with phonation type and tone contrasts that cross-classify (laryngeally complex languages). His findings indicate that many laryngeally complex languages sequence their phonation and tone, which Silverman claims is to ensure better recoverability of both contrasts. He also reports that in some laryngeally complex languages such as Mpi and Tamang, no sequencing occurs. However, in these languages he claims that the non-modal phonation is less robust, allowing for information about phonation and tone to be encoded simultaneously.
Phonation type contrasts have been found to be most pronounced at the start of a vowel in Mazatec (Blankenship Reference Blankenship1997). In Mazatec (see Miller-Ockhuizen Reference Miller-Ockhuizen2003 for similar findings in Ju|’hoansi), it has also been found that phrase-final vowels tend to end breathy, regardless of their phonation, and this makes all the phonation types less distinct at the ends of phrase-final vowels (Blankenship Reference Blankenship2002). Thus, we expect our results for Mazatec to be similar to those of Blankenship (Reference Blankenship2002) for the same language and speakers, but they do not necessarily indicate a typological tendency toward phrase-final breathiness or maximal phonation contrast vowel-initially. For example, while Edmondson (Reference Edmondson1997) showed that Chong breathy phonation is stronger (in terms of glottal airflow) at the beginning of the vowel, DiCanio (Reference DiCanio2009) found that in Takhian Thong Chong, the breathy-tense and tense registers have much greater vocal fold contact at the ends of vowels than at the beginnings, and Esposito (Reference Esposito2004) found that Zapotec creaky vowels only deviate from modal ones at the ends of vowels.
There are several ways in which tone and phonation might interact, and each aspect has its own literature. First, phonation categories can differ in F0. Generally, non-modal phonation is associated with pitch lowering effects (Gordon & Ladefoged Reference Gordon and Ladefoged2001), though laryngealized phonation can be associated with higher pitch, presumably due to glottal tension. This is especially well-documented with respect to the tonogenetic effects of consonants on adjacent vowels (Hombert, Ohala & Ewan Reference Hombert, Ohala and Ewan1979, Kingston Reference Kingston, Hargus and Rice2005). Second, and conversely, different F0s can differ in their voice quality. Some studies (Holmberg, Hillman & Perkell Reference Holmberg, Hillman and Perkell1989, Epstein Reference Epstein2002) have not found a strong correlation between pitch and glottal parameters or LF measures (Fant, Liljencrants & Lin Reference Fant, Liljencrants and Lin1985), but others (Iseli, Shue & Alwan Reference Iseli, Shue and Alwan2007, Keating & Shue Reference Keating and Shue2009) found that (corrected) H1-H2 increases with increasing F0 when F0 is below 175 Hz. That is, men with higher-pitched voices also had breathier voices. We will not address this possibility in the present study. However, third, and relatedly, tone categories can differ in voice quality. In languages with tonal contrasts, certain tones are often accompanied by non-modal phonation, as in the Mandarin dipping Tone 3, which has audible creak (Davison Reference Davison1991, Belotel-Grenié & Grenié Reference Belotel-Grenié and Grenié2004), and similarly in Cantonese (Lam & Yu Reference Lam and Yu2010). Finally, and perhaps relatedly, phonation categories can be constrained to occur only with certain tone categories. For example, in Southern Yi (Kuang Reference Kuang2011), the phonation contrast does not occur with a high tone, whereas the opposite pattern occurs in Northern Yi. In the laryngeally-simplex language SADV Zapotec (Esposito Reference Esposito and Khan2010b), non-modal phonation types occur only with falling tone, and only modal phonation occurs with high and rising tones. And, when the Zapotec falling tone is spoken at a higher pitch, as when under focus, then the breathy versus laryngealized phonation contrast is nearly neutralized to modal-like. In cases like this, it is unclear whether phonation accompanies tone or vice versa. This last kind of interaction does not arise in Mazatec, at least not strongly, where tone and phonation are orthogonal contrasts. However, it is possible that phonation type contrasts are more vs. less robust when combined with the various tones of the language; in particular, the Mazatec contrast might be more difficult to maintain with a high tone. Therefore, from both phonetic and typological studies, there is evidence that non-modal phonation in Mazatec is likely to vary by sex, tone and time.
2 Language materials
2.1 Recordings
The sample words come from two field recordings from San Felipe Jalapa de Díaz, Oaxaca. The first recording was made by Paul Kirk in December 1982. Words without a carrier sentence were spoken by four male speakers. The second recording was made by Paul Kirk and Peter Ladefoged in April 1993. Using a different wordlist, words without a carrier sentence were spoken by six male speakers and six female speakers. Two of the male speakers participated in both recordings. Thus, 14 speakers in total were included in this study. Most of the males were bilingual in Mazatec and Spanish, while the females were mostly monolingual (Blankenship Reference Blankenship2002). The four speakers from the 1984 recording are the speakers studied in Kirk, Ladefoged & Ladefoged (Reference Kirk, Ladefoged and Ladefoged1984), whereas the twelve speakers from the 1993 recording were used in subsequent studies of Jalapa Mazatec (e.g. Silverman et al. Reference Silverman, Blankenship, Kirk and Ladefoged1995, Blankenship Reference Blankenship2002, Esposito Reference Esposito and Khan2010a). Both recordings, originally analog, were digitized at a sampling rate of 44.1 KHz, 16-bit amplitude resolution, and are available online at the UCLA Phonetics Lab Archive website.
2.2 Sample words
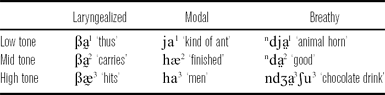
In keeping with Blankenship (Reference Blankenship2002), the sample words chosen for this study all had non-nasalized vowels, and most target vowels were word-final, except for the two words with breathy vowels with a high tone, which were only found on non-word-final syllables. But unlike in the previous study, the target words could have any of three level tones and any of the three phonation types. Only mid and low vowels [a], [æ], and [o] were chosen, due to their greater proportion in the wordlist and the fact that a high F1 is unlikely to influence H2. Only level tones were chosen in this study, though Jalapa Mazatec has contour tones as well (Kirk Reference Kirk1966). Table 1 gives a sample of the Mazatec words chosen (and the rest are listed in the Appendix).
Examples of larger set of Mazatec words used in this study. Tone 1 is low, 2 is mid, and 3 is high.

Tokens with audible background noise were discarded. Because two different recordings were used, not all tokens are the same for all 14 speakers. A total of 80 words were sampled across all speakers. Of these, roughly 20% were breathy, 40% were creaky, and 40% were modal. In a few cases, multiple tokens of a word were analyzed, for a total of 424 tokens of the 80 words. This is in contrast to Blankenship (Reference Blankenship2002), who used only nine words from 12 speakers, for a total of 108 tokens, and Esposito (Reference Esposito and Khan2010a), who used 16 words (eight breathy, eight modal) from each of three speakers, for a total of 48. All the phonation-tone permutations had speakers of both sexes and from both recordings, except, as already noted, the breathy high-tone tokens, which were uttered only by men (these words were only present in the 1982 recording).
Except for Section 3.1 and 4.4, where we discuss the specific effects of aspirated onsets on a following vowel's phonation, all words with aspirated stops preceding the target vowel were excluded in the analyses. This was done to reduce the effect of neighboring sounds on a vowel's phonation.
2.3 Obtaining acoustic measurements
The vowel portion of each word was labeled in Praat (Boersma & Weenink Reference Boersma and Weenink2008). The vowel onset was set at the first glottal pulse following the onset, and the vowel end was set at the last glottal pulse. The selected portion was labeled for vowel, phonation, and tone using a Praat labeling script. VoiceSauce (Shue, Keating & Vicenik Reference Shue, Keating and Vicenik2009), a MATLAB-implemented application, was then run on the labeled audio files, providing the following measurements over time: the first, second and fourth harmonics (H1, H2, H4), the difference between the first and second harmonics (H1-H2) and the second and fourth harmonics (H2-H4), the difference between the first harmonic and the first, second and third formants (H1-A1, H1-A2, H1-A3), energy, Cepstral Peak Prominence (CPP), F0, as well as the first four formants and their bandwidths. Corrected versions of the harmonics and formant amplitudes were also obtained automatically in VoiceSauce, which uses the correction algorithm of Iseli et al. (Reference Iseli, Shue and Alwan2007). Our analysis included only the corrected difference measures, which, here as elsewhere in the literature, will be written with asterisks (e.g. H1*-H2*). Formant values were calculated using the Snack Sound Toolkit (Sjölander Reference Sjölander2004), while F0 was calculated using the STRAIGHT algorithm (Kawahara, de Cheveigné & Patterson Reference Kawahara, de Cheveigné and Patterson1998). For each input .wav file, VoiceSauce produced a MATLAB file with values every millisecond for all the measures mentioned above, over the vowel portion delimited by the Praat textgrid. VoiceSauce then averaged the results by thirds of the vowels’ duration and output these values in a text file.
3 Results
3.1 Significant measures of phonation
Using the results of the acoustic analysis, a Linear Discriminant Analysis (LDA) was conducted to determine which measures are most important for distinguishing phonation types in the 424 tokens. All the acoustic measures listed in Section 2.3 were included in the discriminant analysis. The values for these measures were taken over the first third of the vowel's duration, because it has been shown (and will be corroborated below) that the phonation contrast in Mazatec is manifested early in the vowel (Silverman Reference Silverman1997, Blankenship Reference Blankenship2002). The measures were input in a stepwise manner.
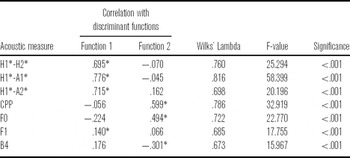
The results of the LDA are shown in Table 2. Two discriminant functions were computed in the discriminant analysis because the phonation contrast has three categories (breathy, modal, or laryngealized). Each acoustic measure was assigned to one of the functions, depending on which function it correlates more highly with. Asterisks in the correlation columns of Table 2 indicate to which discriminant function a particular acoustic measure was assigned. Seven of the 16 measures were significant in the analysis: H1*-H2*, H1*-A1*, H1*-A2*, CPP, F0, F1, and B4, and the correlations of these measures with the discriminant functions are shown in Table 2.
Statistical results of the Linear Discriminant Analysis for the significant measures. The larger absolute correlation between each variable and either function is indicated with an asterisk.

The results of the LDA indicate that the harmonic measures H1*-H2*, H1*-A1*, H1*-A2*, as well as F1, correlate significantly with Function 1, whereas F0, CPP, and B4 correlate significantly with Function 2. The most important predictors of Function 1 are (in order) H1*-A1*, H1*-A2*, and H1*-H2*. The most important predictors of Function 2 are (in order) CPP, F0, and B4. The following analysis will therefore focus specifically on these seven measures.
3.2 Timecourse during vowels
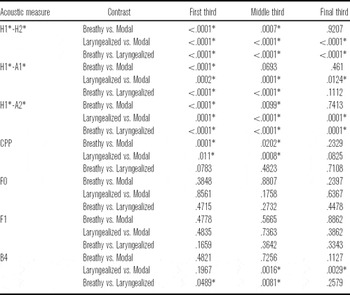
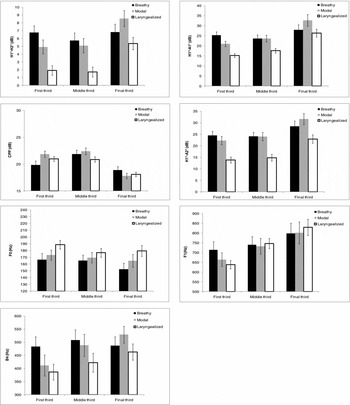
Blankenship (Reference Blankenship2002) found that the effects of phonation type on a variety of acoustic measures are strongest in about the first one-third to one-half of the vowels, are weaker later in the vowel, and are generally lost by the ends of vowels. In our study, we divided the vowels into one-third intervals and then compared the phonation types by linear mixed-effects models on the measures that were significant in the LDA, with the acoustic measure as a dependent variable and random intercepts for speaker and word. The linear mixed-effects model was chosen as the method of analysis because it allows for missing data. In this study, there were no breathy-high tokens uttered by women, yet the linear mixed-effects could still determine the effects of sex for the three phonation types, as will be shown in Section 3.4. Unlike LDA which pools all the measures together, the linear mixed-effects models here are designed to look at each acoustic measure individually, and they control for variability across speaker and item. Figure 1 shows the seven measures that were significant in the LDA by vowel-thirds, and Table 3 gives the significance of each comparison between modal and non-modal phonation types, which were calculated using linear mixed-effects models with phonation type as a fixed effect and speaker and word as random effects. The mixed-effects modeling was run in R (R Development Core Team 2008) using the lme4 function from the languageR package, and the p-values were obtained using the pvals.fnc function from the same package, with 10,000 simulations. This function estimates the p-values of the model's coefficients from the posterior distributions (Baayen, Davidson & Bates Reference Baayen, Davidson and Bates2008).
Pairwise modal vs. non-modal comparisons for the same seven acoustic measures at each vowel third. Asterisks indicate statistical significance at p < .05.

Acoustic measures by vowel thirds (with 95% confidence intervals), showing that differences across phonation types are greatest in the first third.

Similarly to Blankenship, we find that the phonation types are most often distinct in the first two thirds, and least often distinct in the last third. Although the phonation differences by third for F0, F1, and B4 look in Figure 1 as though they are trending towards significance, the results of the linear mixed-effects models indicate that these differences are not significant at p = .05, even in the first third. Therefore, although these measures are correlated to some degree with the discriminant functions found in Section 3.1, the phonation type contrasts are not distinguished from each other according to F0, F1, and B4. For this reason, we will focus the subsequent discussion on the four measures which do show significant differences across phonation types, H1*-H2*, H1*-A1*, H1*-A2*, and CPP. Even though differences are weaker in the final third, the distinction between modal and laryngealized holds throughout the vowel (except for CPP in the final third), whereas breathy and modal are neutralized in the final third on all measures, and in the middle third for H1*-A1*.
Differences between breathy and laryngealized phonation types are significant throughout the entire vowel duration for the spectral measures, whereas for CPP no significant differences were found. During the first third, breathy vowels had a lower CPP mean than laryngealized vowels, but this difference was not significant, at p = .07.
Because the phonation contrast is strongest in the first third of vowels, the analyses that follow are limited to that time interval. However, it should be borne in mind that this does not mean that contrasts are made only in the first third, but simply that they are clearest there. Linear mixed-effects models were run to determine the main effects and interactions of various predictors like phonation, sex, tone, and aspiration on the four acoustic measures. The significance of main effects and interactions was established by model comparison, where the full linear mixed-effects model was compared to one lacking either a main effect and/or an interaction.
For the four phonation measures (the LDA measures, excluding F0, F1, and B4), a significant main effect of phonation was found (p < .001). From Table 3 we see that both non-modal phonation types differ from modal on the four measures reported there (H1*-H2*/A1*/A2*, CPP). This finding extends those from Blankenship (Reference Blankenship2002), in which breathy vs. modal differed on all three of the parameters she tested (H1-A2/H2, CPP), and laryngealized vs. modal differed more on the harmonic measures and less on CPP. Breathy phonation has the lowest CPP values, as found by Blankenship (Reference Blankenship2002), but in this study CPP for breathy phonation is only moderately lower than for laryngealized phonation. As mentioned above, breathy and laryngealized phonation types are usually well differentiated, even in the final third, for the spectral measures (excluding H1*-A1*) but not for CPP. However, the results for CPP are in keeping with Miller (Reference Miller2007), who found that Harmonics-to-noise ratios can capture the acoustic similarity of non-modal phonation types, rather than their differences. CPP can be low either because of aperiodicity (as in laryngealized phonation) or because of noise (as in breathy phonation).
3.4 Sex differences
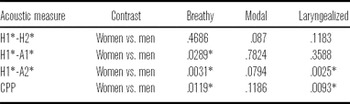
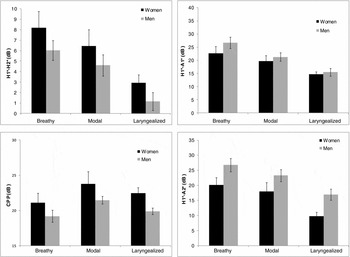
Next we consider whether the two sexes differed significantly in how they used the four measures to distinguish phonation types. Figure 2 shows men vs. women for each phonation, separately for each measure, and Table 4 gives the results of the tests of significance from the linear mixed-effects models. For CPP and H1*-A2*, main effects of sex were found (p < .00357 for the former, and p = .01125 for the latter). The direction of the differences for CPP and H1*-A2* combined may indicate that men are breathier than women. Although lower CPP values could also be a result of laryngealization, the fact that H1*-A2* is higher in men suggests that the lower CPP value is due to breathiness, since laryngealization should also result in lower H1*-A2* values. A similar difference is found for H1*-A1*, although this main effect was not significant. However, for just breathy vs. modal, the difference in H1*-A1* is significant.
Pairwise modal vs. non-modal comparisons for each acoustic measure by sex and phonation during the initial third. Asterisks indicate p < .05.

Acoustic measures for women vs. men compared within phonation types during the initial third. Error bars show the 95% confidence interval around the mean.

Interestingly, the opposite trend is found for H1*-H2*, where men seem to be less breathy than women, although only for modal phonation does this trend approach significance, at p < .09. A similar difference was found by Blankenship (Reference Blankenship1997).
Our main interest here, however, is whether men and women differ in how they implement the three phonation types, especially with respect to the acoustic measures that best differentiate the phonation types overall as described above. Differences in how the sexes implement the phonation types would result in significant sex by phonation interactions, but no such interactions were found. Thus, if men are breathier than women on a given measure, they are consistently breathier across all phonation types. This result perhaps differs from Blankenship (Reference Blankenship1997), whose figures 70–73 suggest that the women's contrasts were generally larger than the men's on all three of her measures, with the exception of breathy vs. modal on H1-H2. However, she presents no statistical analyses on this point.
3.5 Phonation by tone interactions
Jalapa Mazatec is unusual in having independent tones and phonation types, and all nine combinations of them. Nonetheless, at least in part because acoustic measures of voice quality can vary with F0, we hypothesize that the tones, in addition to the phonation categories, will differ along one or more of our voice quality measures. Conversely, we also hypothesize that the phonation type contrasts will be more robust on some tones than on others, perhaps least robust on high tones. Finally, we hypothesize that one or both of the non-modal phonation types will differ from modal with respect to their F0 values, within the limits imposed by their lexical tones.
First, do the tone categories differ in voice quality? Most notably, is there a main effect of tone on any voice measures? For CPP, a main effect of tone was found (p = .002), with the tonal values in the order mid > high > low. Such a non-linear relation of CPP to tonal F0 means that this difference is unlikely to be due to any simple correlation with F0. Instead, it indicates that mid tones, presumably spoken on the most comfortable pitches, have the most harmonic spectra.
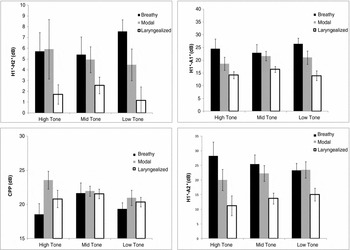
None of the other measures showed a main effect of tone; instead, more complex interaction effects obtain, as can be seen in Figure 3. A significant phonation by tone interaction was found for H1*-A2* (p = .02). H1*-A2* decreases from high to low tones within the breathy category, but increases within modal and laryngealized. Again, such effects cannot be due to simple correlations of voice measures with F0, which, as will be presented below, did differ among the tones in the expected way.
Acoustic measures for phonation types compared within tones during the initial third. Error bars show 95% confidence intervals around the mean.

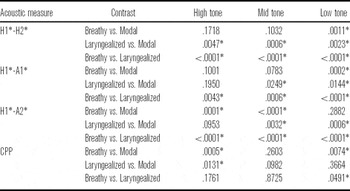
Second, are phonation type contrasts more robust on some tones than on others? Because the tone by phonation interactions go in different directions, sometimes there is contrast enhancement, other times contrast reduction. Thus the phonation by tone interaction for H1*-A2* appears to be a result of breathy vs. modal neutralization on low tones versus contrast enhancement on high tones. The contrasts also appear most robust on high tones when measured by CPP. The individual comparisons, given in Table 5, show that H1*-H2* and H1*-A1* distinguish all three phonation types only on low tones, while CPP works best on high and low tones. H1*-A2* can distinguish all three phonation types only on mid tones. Thus, in terms of how well each measure (taken separately) distinguishes the phonation types within each tone category, it seems that the evidence is mixed and no single tone best supports the phonation type contrasts.
Pairwise modal vs. non-modal comparisons for each acoustic measure by tone within the initial third. An asterisk indicates statistical significance at p < .05.

Alternatively, we can consider the robustness of phonation type contrasts in terms of how many of the individual measures support a contrast, and here we get a different picture. A closer look at the pairwise comparisons in Table 5 reveals that each pair of phonation types is distinguished by at least two of the measures, with the exception of breathy vs. modal on mid tones, where only H1*-A2* shows a significant difference. Phonation types are overall distinguished by the most measures on low tones (three out of four per contrast); the breathy vs. modal contrast is especially less distinct on high and mid tones. Thus, in terms of the set of measures which individually make significant distinctions among the phonation types within each tone category, it seems that the phonation contrast is more robust with low tones.
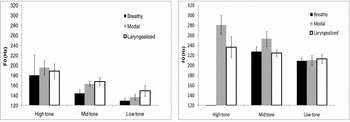
Third, do non-modal phonation types differ in F0 from modal phonation? That is, can F0 alone distinguish phonation types? Figure 1 appears to show such differences, and F0 was a significant measure in the initial Linear Discriminant Analysis, but no main effect of phonation type on F0 was found in the subsequent Linear Mixed Effects analysis. Pairwise comparisons reveal no pitch differences between modal and non-modal phonation for any of the tones. Figure 4 shows that the within-phonation variability is fairly large.
F0 for phonation types compared within tones during the initial third, separated by sex, with men on the left and women on the right. Error bars show 95% confidence intervals around the mean.

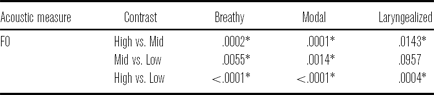
In contrast, a main effect of tone on F0 was found in the expected direction, with high tones having the highest F0, followed by mid tones, and then by low tones. Within each phonation category, this main effect holds true, as shown in Figure 4 (separated by sex). The pairwise tone comparisons for both sexes combined are given in Table 6, and show that the only non-significant difference is between mid and low tones with laryngealization, where p < .10. Recall that these results are for the first third of the vowel's duration. During the middle and final thirds, the difference between laryngealized mid and low tones was found to be statistically significant (p < .0001 during both the middle and final thirds). This suggests that tone contrasts are strongest after the initial third, at least for laryngealized vowels.
Pairwise tonal comparisons for F0 by phonation. An asterisk indicates statistical significance at p < .05.

3.6 Aspirated onsets
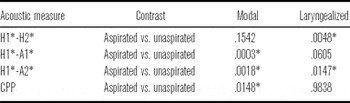
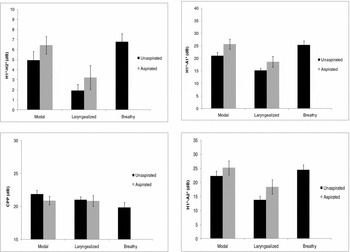
In this study we also expected to find effects of coarticulation from aspirated onsets on the voice quality of following vowels. Such laryngeal coarticulation has been shown in a number of languages, including Swedish, French, German, Italian (e.g. in Gobl & Ní Chasaide Reference Gobl, Chasaide, Hardcastle and Hewlett1999), English (Löfqvist & McGowan Reference Löfqvist and McGowan1992, Garellek Reference Garellek2010), White Hmong (Garellek Reference Garellek2010), Korean (Cho, Jun & Ladefoged Reference Cho, Jun and Ladefoged2002, Garellek Reference Garellek2010), Navajo, Tagalog (Blankenship Reference Blankenship1997), and Ju|’hoansi (Miller-Ockhuizen Reference Miller-Ockhuizen2003, Miller Reference Miller2007). Although these studies differ in the acoustic measures used to quantify the effects of laryngeal coarticulation, vowels tend to be breathier after aspirated consonants. Thus, in our study we hypothesize that H1*-H2*, H1*-A1*, and H1*-A2* should be higher in vowels following aspirated stops, whereas CPP should be lower. As seen in Figure 5, generally modal and laryngealized vowels following an aspirated stop are breathier than those vowels following an unaspirated stop (though without endangering the phonation type contrasts). A main effect of aspirated onset was significant for all measures except for CPP, where the effect was close to being significant at p = .06, and no aspiration by phonation interactions were found. However, the pairwise comparisons in Table 7 reveal that only for H1*-A2* are the differences between the onset categories significant for both modal and laryngealized phonation types, though this is nearly so as well (at p = .06) for H1*-A1* within laryngealized phonation. CPP shows an effect of onset only within modal, while H1*-H2* shows an effect of onset only within laryngealized.
Pairwise modal vs. non-modal comparisons for each measure by aspiration of onsets and phonation of vowel. An asterisk indicates statistical significance at p < .05.

Influence of aspiration in onsets on acoustic measures of following vowel, compared within phonation types. Error bars show 95% confidence intervals around the mean.

There are no comparisons shown for breathy vowels after aspirated vs. unaspirated stops because breathy vowels occur only after unaspirated consonants. After aspirated consonants, the contrast is suspended in favor of what is characterized as modal phonation. However, it can be seen in Figure 5 that the values for breathy vowels after unaspirated stops (last bar on the right in each graph) are about the same as the values for modal vowels after aspirated stops (second bar from the left in each graph).
4 Discussion
4.1 Acoustics of Mazatec phonation type contrasts
Blankenship (Reference Blankenship2002), examining a small sample from the Mazatec corpus, found that the three acoustic measures she tested, H1-H2, H1-A2, and CPP, all distinguished the modal and breathy phonation types, while the first two of these measures distinguished the modal and laryngealized articulations. Esposito (Reference Esposito2006), examining a different small sample of just modal and breathy tokens, but more potential acoustic measures, found that four measures, H1*-H2*, H1*-A1*, H1*-A2*, and CPP, distinguished these two phonation types. She also found that in Linear Discriminant Analysis using all the measures, H1*-A2* accounted for fully 53% of the variance, much more than any other measure.
The much larger sample studied here was also first examined by Linear Discriminant Analysis, to determine which acoustic measures distinguish the phonation categories. While seven tested measures were significant in the LDA, only four of them individually gave significant differences in subsequent mixed effects models, and these were the same four that Esposito (Reference Esposito and Khan2010a) had identified. Thus it seems clear that for this set of recordings, these measures are the most useful in distinguishing the phonation types, but that other measures can weakly contribute to making these distinctions.
A focus of previous work on Mazatec, including Silverman et al. (Reference Silverman, Blankenship, Kirk and Ladefoged1995) and Blankenship (Reference Blankenship2002), was the timecourse of phonation, specifically whether the phonation type contrasts are temporally restricted to some sub-part of each vowel. Silverman et al. (Reference Silverman, Blankenship, Kirk and Ladefoged1995) had proposed that breathy vowels are breathy only during (approximately) their first half. Blankenship tested this proposal quantitatively, and while she found that laryngealized phonation is distinct from modal on H1-H2 only during the first half of vowels, breathy phonation in fact is distinct on H1-H2 for the whole vowel, even during the middle of the vowel, when the breathiness is somewhat reduced. She also found that all the vowels, which were utterance-final, became breathier over time, and that this effect was a reason for the reduced contrasts at the ends of the vowels.
In our data, the phonation type contrasts were strongest in the first third of each vowel; in this portion all modal vs. nonmodal distinctions were significantly different on all four of the reliable acoustic measures. Still, the phonation categories often remain distinct in the middle thirds of vowels, and in the case of modal vs. laryngealized contrasts, even in the last third. Thus our results extend Blankenship's with respect to acoustic measures of phonation, including the temporal extent of phonation, though in our sample the contrasts seem to be even more robust over time.
Neither Blankenship (Reference Blankenship2002) nor Esposito (Reference Esposito2006) included formant frequency measures, but Kirk et al. (Reference Kirk, Ladefoged, Ladefoged, Mattina and Montler1993) had shown, in yet another small sample from the corpus, that F1 values were higher for laryngealized phonation, attributed to larynx raising. In our sample, however, while F1 made a significant contribution to the LDA, again it was not significant on its own in mixed effects models. That is, there is no reliable vocal tract change across a large sample of words including different tones.
In the first third, the three-way phonation contrast can be fully distinguished using either H1*-H2*, H1*-A1*, or H1*-A2*. These measures differentiate the phonation types along a continuum; suggesting that although these phonation types may be produced using multiple articulations, a single continuum of glottal states can adequately represent the phonation contrast in Mazatec.
4.2 Effects of speaker sex
Main effects of speaker sex were found for some, though not all, of the important cues to phonation type contrasts in Mazatec. Surprisingly, these main effects suggested that in some ways the men's voices were generally breathier than the women's voices: men's values for H1*-A2* and to some extent H1*-A1* were overall higher than women's. However, previous observations about gender differences are typically based on differences in values for H1-H2. In our data, H1*-H2* did not differ significantly (in either direction) between the sexes, indicating that on this key measure, men were neither breathier nor creakier. Finally, men's values for CPP were overall lower, meaning that their voices were less modal – less periodic and/or noisier, for example. These variations in how the sexes differ along the different measures underscores that non-modal phonation types can be articulated in different ways, so that potentially men and women phonate in ways that can appear both breathier or creakier, depending on the measure and its articulatory correlate.
Our inspection of the figures in Blankenship (Reference Blankenship1997), which were based on a small subset of the Mazatec corpus, suggested that in her data, there was no overall difference between the sexes. Instead, the women made larger contrasts than the men did. Their breathier phonation was breathier than the men's, but their laryngealized phonation was less breathy than the men's. Such contrast enhancements are not seen in our larger selection from the corpus. Instead, there are overall differences in scale along the voice measures, preserving the phonation type contrasts on each measure, but at different absolute values.
4.3 Effects of tone
Generally, there was no main effect of tone on the acoustic measures included in this study (CPP the only exception, with mid tone the most modal). However, within a given tone, the phonation type contrasts were not equally salient. In the first third, the phonation type contrasts in low tones were only fully distinguished by H1*-H2* and H1*-A1*. In mid tones, only H1*-A2* distinguished all phonation types, and in high tones, no single measure differentiated all the phonation types from one another. It is interesting to note, however, that all pairwise phonation type contrasts were made for each tone by at least one of the acoustic measures in this study, and more measures support contrasts on low tones than on the other tones. This has implications for perceptual studies of phonation, in that while speakers of languages with phonation type contrasts might rely predominantly on a given acoustic measure to perceive such contrasts (Esposito Reference Esposito and Khan2010a, Kreiman, Gerratt & Khan Reference Kreiman, Gerratt and Khan2010), speakers of those languages might use different acoustic measures depending on the pitch or tone. In addition, mid and low tones were not distinct in laryngealized vowels during the first third, but were distinct in subsequent thirds. This suggests that tonal distinctions are more robust towards the end of the vowel, in contrast to the phonation distinctions, which were found to be most salient during the initial third. This finding supports the claim by Silverman (Reference Silverman1997) that tone information may not be recoverable in portions of the vowel with laryngealization. However, we find that tone information in the first third is still salient in breathy phonation.
4.4 Effects of initial consonant
This study also demonstrates that, on common acoustic measures of phonation, aspirated consonants can greatly alter the phonation of following vowels, resulting in suspension of a phonation contrast. This could help explain why, in languages with both these features, aspirated stops cannot be followed by breathy voice, as in Mazatec (Silverman et al. Reference Silverman, Blankenship, Kirk and Ladefoged1995) and Hmong (Fulop & Golston Reference Fulop and Golston2008, Esposito & Khan Reference Esposito2010), by modal voice, as in Gujarati (Esposito & Khan Reference Esposito2010), or by any non-modal phonation, as in Ju|’hoansi (Miller-Ockhuizen Reference Miller-Ockhuizen2003, Miller Reference Miller2007). If laryngealized phonation after aspirated stops is more modal, and modal phonation is more breathy, then breathy phonation after aspirated stops would likely be confused for modal phonation.
Our results indicate that in Mazatec the effect of aspirated stops is found for all the measures investigated. The fact that modal phonation in vowels following aspirated stops and vowels with breathy phonation are acoustically similar suggests that aspiration and breathy voice in Mazatec are produced in a similar manner. In this sense, after aspirated consonants, the modal-breathy contrast can be said to be neutralized in favor of breathy phonation, rather than in favor of modal as the traditional description has it. This finding is relevant for all studies of vowel phonation, in that it shows that the type of consonant can have significant effects on the following vowel.
5 Conclusion
Jalapa Mazatec is unusual in possessing a three-way phonation contrast and a three-way level tone contrast independent of phonation. For this reason, it is particularly suited for studying how a three-way phonation contrast is maintained across variables like speaker sex, tone, and vowel time course. With the aid of the VoiceSauce program for voice analysis, in this study we have examined a larger portion of the extensive recordings of Mazatec made by Kirk and Ladefoged in the 1980s and 1990s, comprising all tokens with low vowels and level tones. The results of our acoustic and statistical analysis support the claim that spectral measures like H1-H2 and mid-range spectral measures like H1-A2 best distinguish each phonation type, though other measures like CPP are important as well. This holds true regardless of tone and speaker sex. In Mazatec, the phonation type contrasts are strongest according to the measures included in the study in the first third of the vowel and then weaken towards the end of the vowel (which is in utterance-final position in this corpus), but even in the latter third of the vowel some distinctions are maintained. This study shows that using multiple measures, the complex and typologically rare orthogonal three-way phonation and tone contrasts do remain acoustically distinct, despite partial neutralizations in any given measure. This emphasizes the value of using multiple acoustic cues to characterize phonation in a given language. On the other hand, the acoustic neutralization between modal vowels after aspirated stops and breathy vowels is well explained, given the lack of a breathy–modal contrast following aspirates in the Mazatec lexicon.
Acknowledgments
This work was supported by NSF grant BCS-0720304 to Patricia Keating and FQRSC grant 128451 to Marc Garellek. We would like to thank Yen-Liang Shue for VoiceSauce, Larina Luu for help with manuscript preparation, and Barbara Blankenship and Paul Kirk for discussion. An earlier version was presented at the Spring 2010 Meeting of the Acoustical Society of America.