





1. Introduction
1.1 Background and research questions
This article explores variation in the accent associated with the mainstream, middle-class variety of English in Scotland, Standard Scottish English, or SSE, for short (cf. Giegerich Reference Giegerich1992; McClure Reference McClure and Burchfield1994; Schützler Reference Schützler2015). SSE is typically viewed as the standard pole in a sociolinguistic continuum often referred to as Scottish English (e.g. McClure Reference McClure and Burchfield1994; Stuart-Smith Reference Stuart-Smith, Kortmann and Upton2008), sometimes as Scots English (McArthur Reference McArthur, Aitken and McArthur1979), and less frequently as Scots (e.g. Smith Reference Smith, Kortmann and Lunkenheimer2012: 21).Footnote 1 Beyond the Scottish English continuum, the relationship between SSE and Standard Southern British English (SSBE) may be of interest. Thus, Aitken (Reference Aitken, Aitken and McArthur1979: 110–111) acknowledges that individual speakers of SSE may use accent features of SSBE, McClure (Reference McClure and Burchfield1994: 91) credits the media with a certain influence, and Schützler (Reference Schützler2015) as well as Schützler, Gut & Fuchs (Reference Schützler, Gut, Fuchs, Beal and Hancil2017) engage with the potential relevance of an SSE-SSBE continuum.
This article takes the latter perspective on SSE and focuses on three vowel variables that could be described as (incipient) splits of single SSE phonemes into corresponding pairs of vowels, whose members are considered tense and lax in SSBE, namely: ⁄a⁄ → [ɑ, æ], ⁄ɔ⁄ → [ɔ, ɒ] and ⁄ʉ⁄ → [ʉ, ʊ].Footnote 2 While IPA labels are used as indicated here, the phenomenon ultimately concerns the extent to which the lexical sets palm/bath vs trap, thought vs lot, and goose vs foot (Wells Reference Wells1982) are relevant in SSE. The three phenomena are interesting for several reasons: their variation is not merely phonetic but may have consequences for SSE phonology; they are potentially influenced by a southern British model of speech and can thus contribute to our understanding of the relationship between SSE and SSBE; and they have been claimed to depend on each other in a systematic, hierarchical way, which – if found to be true – would not only be an intriguing feature of the SSE vowel system but could open up more general, typologically informed debates of systemic change.
Two historical trajectories of change may play a role in the vowels’ tendency (or lack thereof) to be realised as two distinct vowels: (i) the (relatively recent) split of a single Scots category, likely under the influence of SSBE; or, conversely, (ii) the (earlier) incomplete merger of two SSBE categories under the influence of Scots. The second scenario will be discussed briefly in Section 2.2 and in the context of some of the results, but in its general position and wording, this study takes the first perspective. The following three questions guide this research:
-
1. Is there a measurable and robust difference between the vowels of SSE in words that would belong to different tense-lax categories (e.g. the palm/bath sets vs the trap set) in SSBE, and does this difference lie in the expected direction?
-
2. If so, are these splits conditioned by the basic social predictors age and gender, and, if yes, are they conditioned in a similar way?
-
3. Is there evidence of a hierarchical (or implicational) ranking of splits?
These questions will be addressed using acoustic data and focusing entirely on vowel quality. The need for complementary quantitative investigations of vowel length will be outlined in the final section.
Section 2 provides the theoretical background: after a short description of SSE monophthong phonology, the literature on the three potential splits will be reviewed. The outline of data and methodology in Section 3 includes discussions of the corpus of speakers, the retrieval and transformation of acoustic data, as well as the quantitative analysis. Results are presented in Section 4 and discussed in Section 5. Section 6 reflects more generally on the results, takes a critical look back at theory and methodology, and points forward to future research.
1.2 Terminological notes
I use the term split to denote any tendency of one of the three vowels ⁄a, ɔ, ʉ⁄ to be realised as two different qualities that map onto different lexical sets, as in SSBE. Irrespective of the magnitude of the effect, my evaluation is based on the statistical robustness of differences in at least one of the two formant dimensions that are investigated. Thus, against the background of traditional SSE not displaying the contrasts in question, any tendency for them to be visible will be interpreted as a split that speakers have begun to acquire to varying degrees – in other words: an ‘incipient split’. Looking at SSE from the vantage point of SSBE is also possible, in the sense that, despite the general assumption of a power imbalance between Scotland and England, convergence may historically have happened in both directions: from Scots towards SSBE, and from some kind of proto-SSBE towards Scots. A case could therefore be made for speaking not of incipient splits but of incomplete mergers, or perhaps to use both expressions with regard to the vowels under investigation. The present research, however, gives precedence to an underlying SSE phonology that is based on Scots and comes with unpaired vowels, which may then split into pairs.
My convention for bracketing the single categories as ⁄a⁄, ⁄ɔ⁄ and ⁄ʉ⁄, and the split categories as [ɑ]⁄[æ], [ɔ]⁄[ɒ] and [ʉ]⁄[ʊ], reflects the view that three traditional SSE phonemes are involved, but that the status of the pair-internally differentiated categories is less clear and robust, so that, for the time being, differences have to be treated as phonetic variants – variants, however, that behave in a way consistent with the SSBE lexical sets palm/bath/trap, thought/lot and goose/foot, respectively. Furthermore, the six labels for the paired (split) variants were selected not as precise phonetic descriptors but as indicators of the general direction of the split. The relevant information is found in the acoustic parameters that are reported.
1.3 Open data
The data used in this research are published at the Tromsø Repository of Language and Linguistics (TROLLing) as Schützler (Reference Schützler2026) and can be retrieved via the identifier https://doi.org/10.18710/KH6YDI. Annotated R scripts for all stages of the analysis and all figures are published in a repository hosted by the Open Science Framework (OSF), to be found at https://osf.io/hv3tg/ (or https://doi.org/10.17605/OSF.IO/HV3TG) under a CC-By Attribution 4.0 International licence. These materials will occasionally be referred to as ‘the online appendix’.
2. Theoretical background
2.1 The monophthong vowels of Standard Scottish English
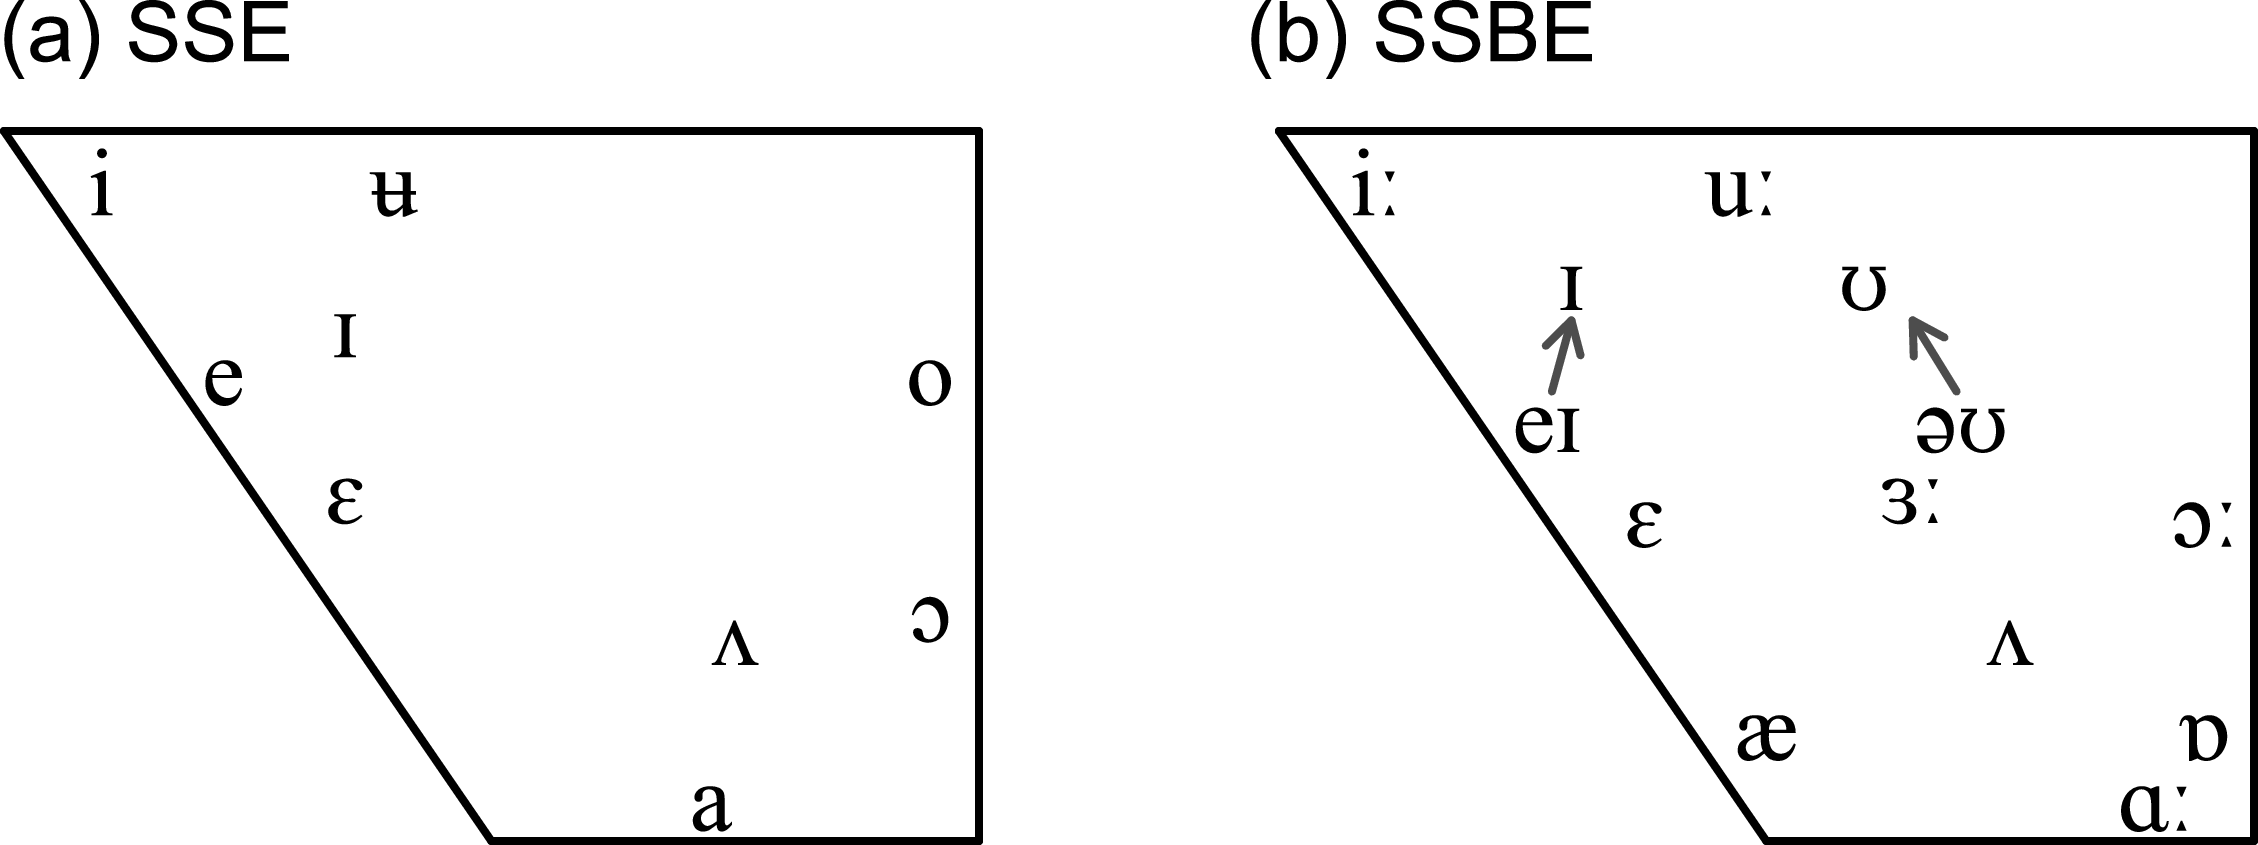
This section provides a short general discussion of SSE vowel phonology, which relies on accounts by Abercrombie (Reference Abercrombie, Aitken and McArthur1979), Wells (Reference Wells1982: 399–405), Giegerich (Reference Giegerich1992: 46–47), McClure (Reference McClure and Burchfield1994: 80–82), Jones (Reference Jones2002: 25–30) and Stuart-Smith (Reference Stuart-Smith, Kortmann and Upton2008: 54–61). The Standard Southern British English (SSBE) inventory shown for comparison in Figure 1b is synthesized from relatively traditional accounts such as Giegerich (Reference Giegerich1992: 51–53), Roach, Setter & Esling (Reference Roach, Setter and Esling2011: vii–viii) and Cruttenden (Reference Cruttenden2014: 96–160), complemented by more recent insights as generated by Ferragne & Pellegrino (Reference Ferragne and Pellegrino2010), for instance. The plots concentrate on stressed monophthongs (and therefore do not contain ⁄ə⁄). Two vowels are traditionally realized as monophthongs in SSE and phonetic diphthongs in SSBE, and are thus rendered as ⁄e, o⁄ and ⁄eɪ, əʊ⁄, respectively. The figure leaves out the ‘true diphthongs’ (Giegerich Reference Giegerich1992: 50) ⁄aɪ⁄, ⁄aʊ⁄ and ⁄ɔɪ⁄, as well as the centring diphthongs ⁄ɪə⁄, ⁄eə⁄ and ⁄ʊə⁄ of SSBE.
There are three main differences between the two inventories. First, SSE vowels do not have phonological length, hence the absence of length diacritics in Figure 1a. Vowel length in Scottish varieties of English is regulated by the Scottish Vowel Length Rule (for short: SVLR; cf. Aitken Reference Aitken, Benskin and Samuels1981; Scobbie, Hewlett & Turk Reference Scobbie, Hewlett, Turk, Foulkes and Docherty1999; Weilinghoff Reference Weilinghoff2026), whereby vowels have neutral length but some of them (e.g. only ⁄i⁄, ⁄ʉ⁄ and ⁄aɪ⁄ in Scobbie et al. Reference Scobbie, Hewlett, Turk, Foulkes and Docherty1999 and Scobbie, Turk & Hewlett Reference Scobbie, Turk and Hewlett2001) will be lengthened in certain environments.Footnote 3
Secondly, the inventory of SSE consists of only n = 9 vowels compared to n = 13 in SSBE. This is because instead of the SSBE pairs ⁄ɑː, æ⁄, ⁄ɔː, ɒ⁄ and ⁄uː, ʊ⁄, there are only the three vowels ⁄a, ɔ, ʉ⁄ in SSE. In traditional varieties of SSE, the vowel ⁄ɜː⁄ – or ⁄ɜ⁄, as it should be rendered according to the SVLR – may also be missing. The vowels in words like bird, earth and nurse may theoretically be kept distinct as ⁄ɪ⁄, ⁄ɛ⁄ and ⁄ʌ⁄ but are in fact regularly merged, partially or completely (cf. Lawson, Scobbie & Stuart-Smith Reference Lawson, Scobbie and Stuart-Smith2013; see also Abercrombie Reference Abercrombie, Aitken and McArthur1979; McClure Reference McClure and Burchfield1994; Li, Gut & Schützler Reference Li, Gut and Schützler2021).
Finally, there are some phonetic differences between SSE and SSBE. For instance, the vowels ⁄e⁄ and ⁄o⁄ are variably realised as monophthongs in SSE and can thus be salient in their phonetic difference to their SSBE realisations, [eɪ] and [əʊ] (cf. Schützler Reference Schützler2015); the vowel ⁄ʉ⁄ is even more front than its (also fronted) counterpart ⁄uː⁄ in SSBE; the vowel ⁄ɪ⁄ can be relatively low and/or retracted; and the vowel ⁄ɛ⁄ may take a slightly closer and more peripheral/front position than in SSBE.
Variation and change under the influence of SSBE have been investigated for a number of features, such as derhoticisation, diphthongisation of face and goat, and the loss of the contrast of ⁄ʍ⁄ and ⁄w⁄ (see, for instance, Schützler Reference Schützler2015; Salvesen Reference Salvesen2016; Brato Reference Brato2016), and it is noteworthy that the potential splits investigated here have not been the object of empirical studies.
Stressed monophthongs and phonetic diphthongs of (a) Standard Scottish English and (b) Standard Southern British English

2.2 Variable vowel pairs and implicational ranking
The literature mainly takes the view that the lack of phonological vowel length due to the SVLR is responsible for the absence of pairs, which McClure explicitly refers to as a ‘loss’ of historical contrasts (1994: 81; cf. Giegerich Reference Giegerich1992: 56). SSE phonology derives from (and, historically, shares many properties with) this kind of Scots phonology that still lacks the respective contrasts – at least in the central dialects, and perhaps more uniformly for ⁄a⁄ and ⁄ʉ⁄ than for ⁄ɔ⁄ (Aitken Reference Aitken and Trudgill1984: 96–97; Millar Reference Millar2018: 36; Reference Millar2023: 86; Grant & Dixon Reference Grant and Dixon1921). The emergence of paired vowels would then be a case of split, en route from a more traditional, Scots-based phonology to a more mixed system that partially converges upon SSBE.
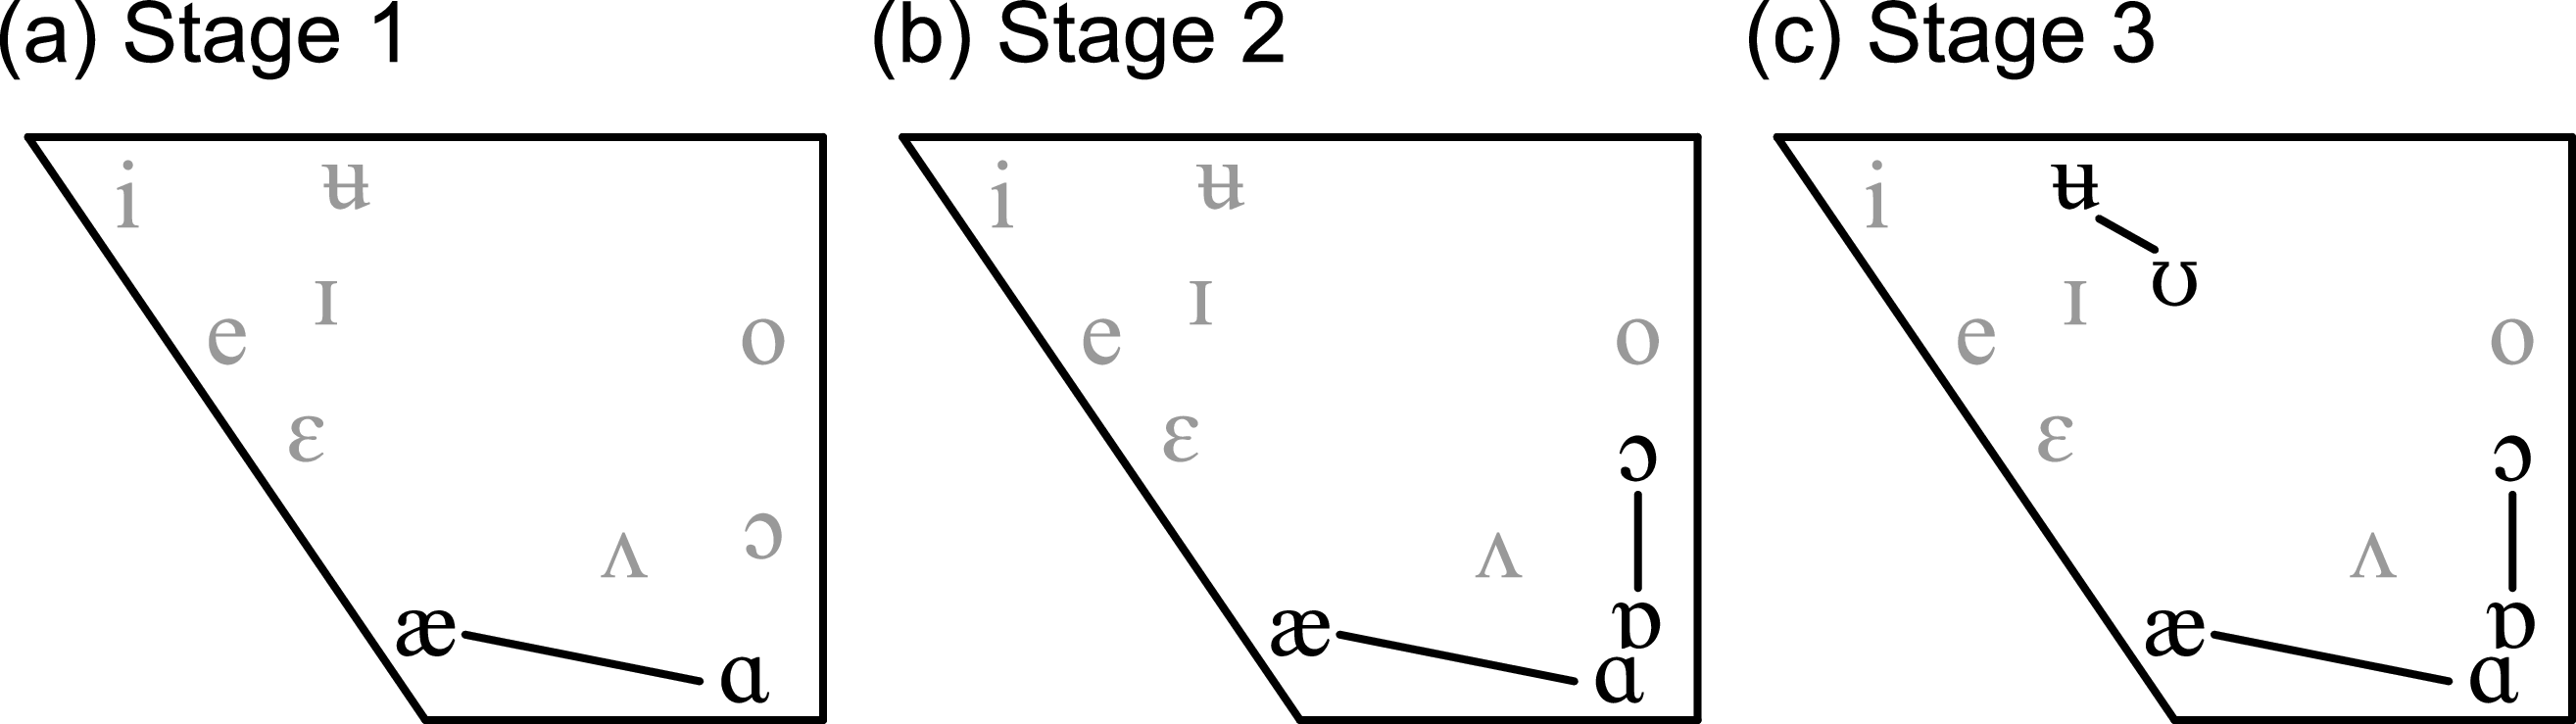
The hierarchical (or implicational) relationship between potentially split vowels is first discussed by Abercrombie (Reference Abercrombie, Aitken and McArthur1979: 75–76), whose account is based on the accents ‘of about five hundred students at Edinburgh University, over the last quarter of a century’ (Abercrombie Reference Abercrombie, Aitken and McArthur1979: 84), i.e. from the mid 1950s to the late 1970s. Abercrombie introduces the splits in the order (1) ⁄a⁄ → [ɑ, æ], (2) ⁄ɔ⁄ → [ɔ, ɒ] and (3) ⁄ʉ⁄ → [ʉ, ʊ]. The second distinction is ‘always accompanied’ by the first one, and the third one – which is described as rare and unstable – presupposes the other two (Abercrombie Reference Abercrombie, Aitken and McArthur1979: 76). Figure 2 shows the three stages in which speakers of SSE can acquire the splits of ⁄a⁄, ⁄ɔ⁄ and ⁄ʉ⁄, if we were to accept the validity of Abercrombie’s sequence.
Progression of splits according to Abercrombie (Reference Abercrombie, Aitken and McArthur1979)

Abercrombie’s (Reference Abercrombie, Aitken and McArthur1979) account echoes through the literature of the following decades, thus in Stuart-Smith (Reference Stuart-Smith, Kortmann and Upton2008: 59–60) and McClure (Reference McClure and Burchfield1994: 81), who says that [ɑ, æ] is ‘not uncommon’, [ɔ, ɒ] is ‘notably rare’ and always requires [ɑ, æ], and [ʉ, ʊ] is ‘very rare’. In Giegerich’s (Reference Giegerich1992: 57) words, the implicational order of distinctions ‘has been claimed’, which suggests a degree of scepticism. In the same spirit, Giegerich states that ‘[i]t is hard to explain why the acquisition of additional contrasts should take place in this order’. Finally, Jones (Reference Jones2002: 25–27) mentions all three non-pairs but only acknowledges the potential split of ⁄a⁄, which is thus once again accepted as the most prominent one. None of these sources offer new evidence.
A complication of the scenarios described thus far lies in the fact that, in the split, the selection of the vowel in some words may be at odds with the lexical set to which they would belong in SSBE. Thus, for instance, words like gather, salmon and value can take the vowel [ɑ], rather than the vowel [æ], [ɔ] can be used (instead of [ɒ]) in words like lorry, squash, and watch, and [ʊ] may appear (instead of [ʉ]) in words like food (Abercrombie Reference Abercrombie, Aitken and McArthur1979: 75–76; see also McClure, Reference McClure and Burchfield1994: 81). In other words, the allocation of items with Scots/SSE ⁄a, ɔ, ʉ⁄ onto the lexical sets palm/bath/trap, thought/lot and goose/foot may in some cases not conform to the SSBE distribution. While Abercrombie argues that this resultant lack of alignment with SSBE makes Anglo-English influence less likely as a responsible factor, it can also be a result of hypercorrection, as discussed by Labov (Reference Labov1994: 312) in the context of the (difficult) ‘restoration’, i.e. the undoing, of mergers. As to differences between individual lexemes, a possibility neither considered in the literature nor explored in this paper is that both a higher lemma frequency and the occurrence of paired sounds in minimal pairs (and thus, we could argue, an increased functional load) may promote a split.
The only empirical study of the phenomena at hand is by Carr & Brulard (Reference Carr and Brulard2006). Their study is based on auditory analysis and considers variable rhoticity (in the lexical sets start and north) as a factor. It uses a rather mixed and small dataset and discusses case studies to establish possible patterns. While the paper as a whole is not easy to integrate into the present research, it provides evidence that concrete lexical items play a major role in the variation, casts some doubt on the hierarchical ranking (at least between ⁄a⁄ and ⁄ɔ⁄) and proposes the notion of a set of allophonic rules, whereby a single SSE phoneme ⁄ɐ⁄ is realised as [æ], [ɐ] or [ɑː], for instance.Footnote 4 One particularly frequent context that might govern this kind of allophony is open syllables, as discussed in Section 3.
The mechanism of variation and change that leads to splits is typically framed in exclusively social terms. Giegerich (Reference Giegerich1992: 57) associates paired vowels with ‘[s]ome SSE speakers, especially middle-class speakers from Edinburgh and Glasgow’. Since the general pattern of pairs corresponds to SSBE phonology, SSE-SSBE contact offers itself as ‘a simple explanation’. Jones (Reference Jones2002: 25) also assumes that convergence on SSBE is the main factor, particularly in formal contexts.Footnote 5 Direct influence from southern British accents is also considered by McClure (Reference McClure and Burchfield1994: 81), but according to him, the qualitative distinction will often be moderate, while quantitative (length) differences may play a larger role, so that the result of a split may still be formally different from an SSBE accent. This is a consideration I will return to in the final section.
In previous work on these vowels, a plausible contact-related mechanism of variation (and change) is invoked, strong claims are made to the effect that the splits are not equally likely and may in fact be systematically ranked, and it is (more rarely) suggested that we might need to look beyond purely qualitative parameters to explore the phenomenon of variably paired vowels. Against the background of these leads, the lack of empirical evidence is striking. Abercrombie’s contribution is based on ‘the analysis of about five hundred Scottish students at Edinburgh University’ from the mid-1950s to the late 1970s (Reference Abercrombie, Aitken and McArthur1979: 84). However, the precise source of Abercrombie’s data is not documented, and it is likely that his statements are based on auditory investigations (possibly complemented by informal observations) of students with relatively anglified, mixed SSE accents. With the exception of Carr & Brulard (Reference Carr and Brulard2006), later publications are mainly textbook chapters that rely on Abercrombie’s work. In other words: very little progress seems to have been made since the late 1970s.
A basic puzzlement we face in the analysis of ⁄a⁄, ⁄ɔ⁄ and ⁄ʉ⁄ is the question as to why their splits should be implicationally ranked. It is surprising that only Giegerich (Reference Giegerich1992: 57) raises this question (implicitly), and that there have been only minor attempts to put the claims to the test. In addition to a basic sociolinguistic investigation, it is this gap that this article aims to fill.
2.3 Theoretical considerations and research questions
As discussed in Section 2.2, several authors correlate urban middle class speakers with a tendency to split the three vowels under investigation, since contact with SSBE and more mixed accents are generally more likely among such speakers. Labov (Reference Labov1994) discusses the cognitive challenges involved in acquiring a split (or restoring/undoing a merger). Even in a contact scenario, the evidence he presents suggests that acquiring a merger from speakers of another accent is more likely than the ‘successful’ (i.e. lexically correctly distributed) acquisition of a split (1994: 336–337). As discussed above, splits of the three targeted vowels that do not (or, not completely) conform to the respective selection of phonemes in SSBE are mentioned by Abercrombie (Reference Abercrombie, Aitken and McArthur1979) and McClure (Reference McClure and Burchfield1994), and these are perhaps symptoms of the difficulties described by Labov. However, Labov (Reference Labov1994: 342) also acknowledges that the right social circumstances may well make it possible for a distinction to be reintroduced (or, I would argue, to be introduced for the first time) into a speech community. In the case at hand, the general difficulty of introducing splits may explain why paired vowels are not considered part of traditional SSE and the accent has remained more Scots in this regard, whereas it is partly anglicised in other aspects, e.g. following an SSBE-oriented selection pattern for phonemes in words like stone (not Sc. stane) or glass (not Sc. gless). On the other hand, contact between SSE and SSBE is as old as the variety of SSE itself, and a slow, incremental pull towards the paired realisations seems plausible. However, it remains far from clear what precise sociolinguistic patterns to expect. While it has variously been doubted that SSBE can serve as a target accent for Scottish speakers – for instance by Wells (Reference Wells1982: 393), McClure (Reference McClure and Burchfield1994: 80) and Johnston (Reference Johnston and Britain2007: 109) – a more positive, or at least flexible, attitude towards southern English accents may prevail particularly in cases of mixed Scottish-English families. The prestige of SSE and SSBE, respectively, will therefore very much depend on individual speakers and their backgrounds, less on abstract notions of identity. In consequence, formulating a general hypothesis regarding the correlation of accent and a social parameter like gender (cf. Labov Reference Labov1990, Reference Labov2001) will be difficult, because we cannot be sure about general accent standards and targets. Changes in society are not easy to translate into firm expectations regarding language variation and change, either. On the one hand, international and global communication has been expanding apace since the late twentieth century, with a concomitant increase in personal and medial SSE-SSBE contact of all kinds. On the other hand, Scottish national identity has arguably also strengthened – consider the 1997 Scottish devolution referendum and subsequent creation of the new Scottish Parliament in 1999, SNP-led governments from 2007 to the present day, the 2014 Scottish independence referendum, and the striking contrast between Scottish and English votes in the EU Referendum of 2016. While, in the long term, contact has become more intense, so, perhaps, has resistance to political assimilation. However, the link between political positions (e.g. regarding devolution/independence) and linguistic behaviour is far from predictable and allows for a high degree of diversity.
The literature review did not identify any language-internal mechanisms that would account for the splits, not to mention a ranked sequence (⁄a⁄→⁄ɔ⁄→⁄ʉ⁄). An argument could be attempted on the basis of Dispersion Theory (Blevins Reference Blevins2004: 11; Liljencrants & Lindblom Reference Liljencrants and Lindblom1972; Lindblom Reference Lindblom, Ohala and Jaeger1986), which models the relationship between the number of items in a bounded (vowel) space and their distribution (i.e. their position and distance relative to each other). This framework, however, is of limited help in the case at hand because any of the three splits would reduce the available space and thus entail some trespassing onto another vowel’s territory, as can be seen in Figure 2 (vis-à-vis Figure 1a). Phonological contexts, on the other hand, may play a more significant role, particularly if they have an effect on vowel duration, which may then correlate with systematic differences in the qualitative targets that are attained. To control for some of this, the relatively frequent context of open syllables is taken into account (and controlled for) in this study.
3. Data and methodology
3.1 Corpus data and selection of speakers
The recordings for this research are taken from the Scottish component of the International Corpus of English (ICE-Scotland; Schützler et al. Reference Schützler, Gut, Fuchs, Beal and Hancil2017).Footnote 6 The rationale of ICE is described in Greenbaum (Reference Greenbaum1988, Reference Greenbaum and Svartvik1992), Nelson, Wallis & Aarts (Reference Nelson, Wallis and Aarts2002) and Kirk & Nelson (Reference Kirk and Nelson2018); the design of the corpus is documented in Nelson et al. (Reference Nelson, Wallis and Aarts2002: 307–308), Schützler (Reference Schützler2023: 227–228), and at https://www.ice-corpora.uzh.ch/en.html.
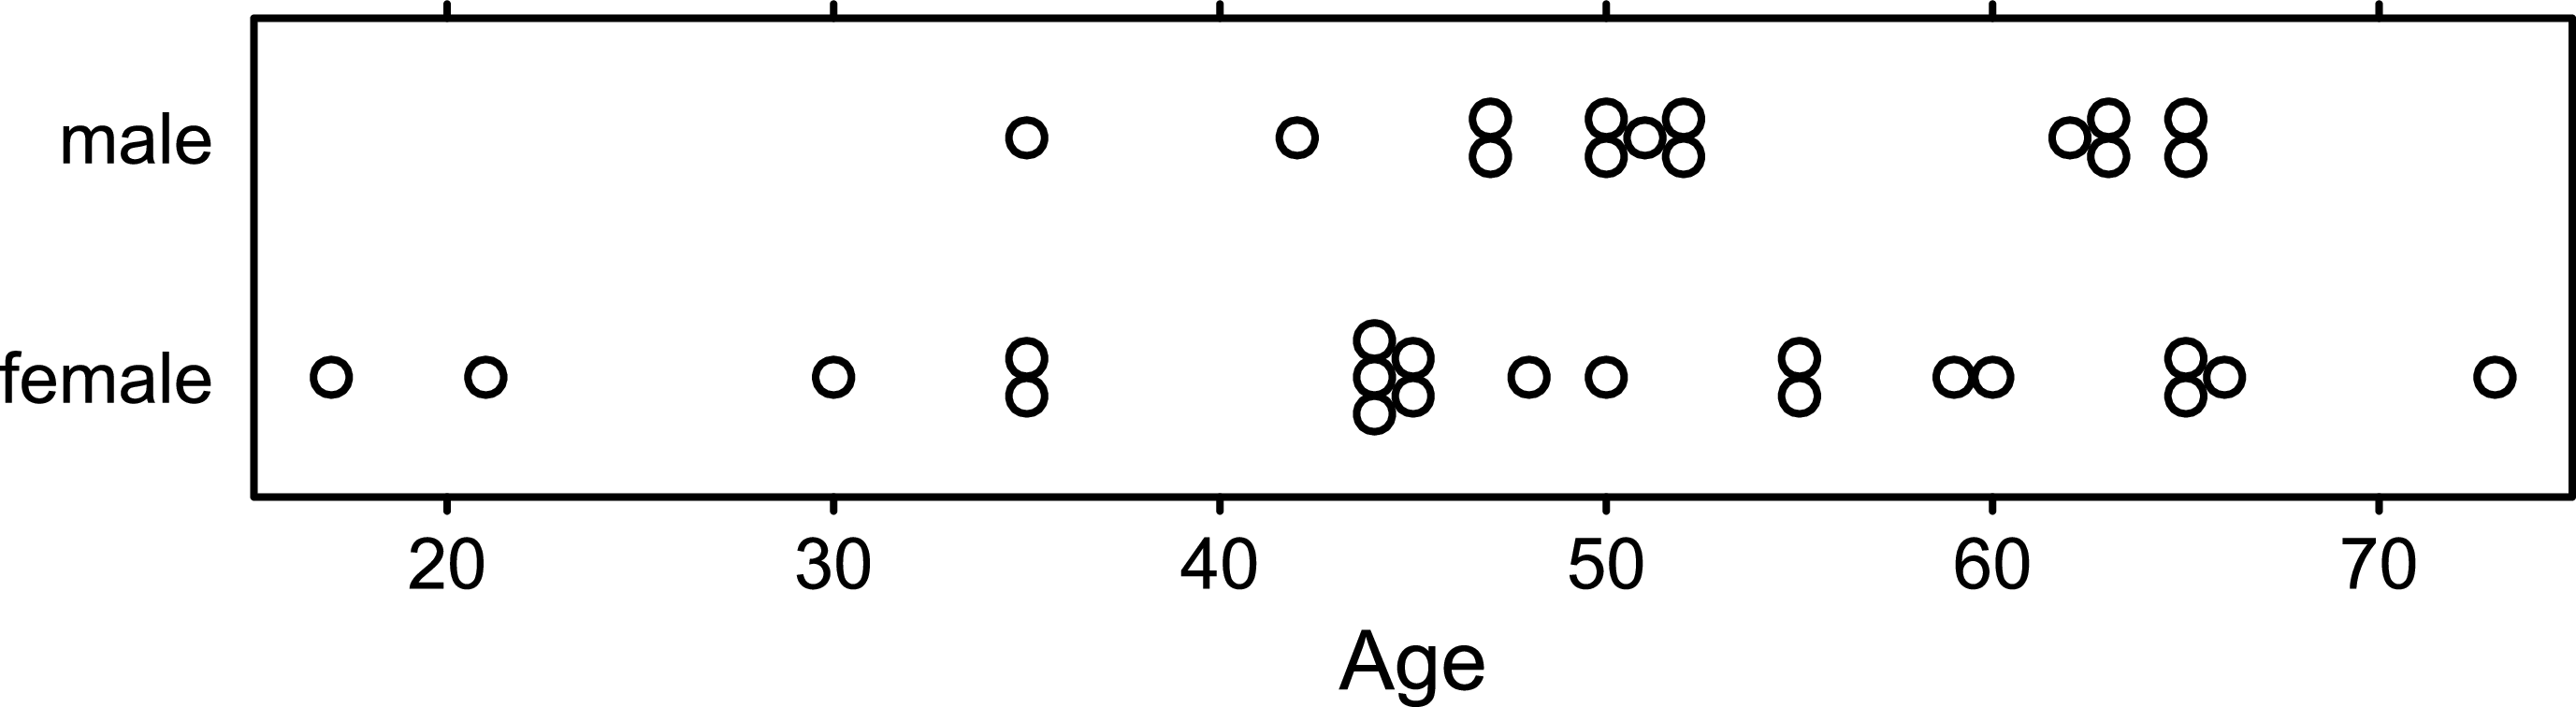
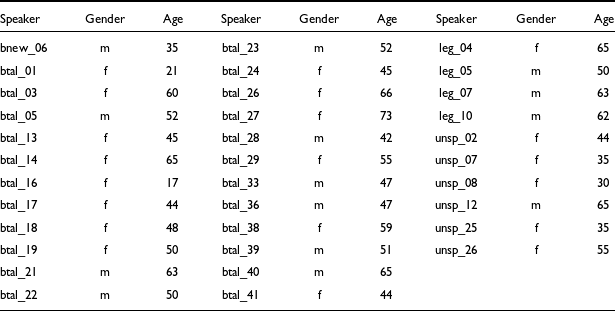
The total number of speakers is n = 34 (cf. Appendix A). Each of them produces text in one of four genres, namely broadcast talks (‘btal’; n = 23 speakers), unscripted speeches (‘unsp’; n = 6), legal presentations (‘leg’; n = 4) and broadcast news (‘bnew’; n = 1). All of these text types are classified as monologues within the spoken section of ICE. The available metadata include speakers’ sex and their age at the time of the recording (see Appendix A). Speaker age as used in this study was calculated for the year 2016, even if recordings were collected from the year 2014 onwards. There were n = 14 male and n = 20 female speakers, with an overall age range of 17–73 years. Figure 3 shows that most speakers are older than 40 years, and that younger speakers are predominantly female.
Age and gender distribution of speakers in the sample (n = 34)

Speakers (and authors) sampled for any component of ICE tend to be of educated middle-class background (cf. Greenbaum Reference Greenbaum and Svartvik1992: 177), and their linguistic behaviour will therefore tend towards standard usage. The four selected genres emphasise this tendency further, due to their fairly public character. Apart from age and gender variation, the selected material will therefore be taken as a representative sample of middle-class SSE usage, and neither class nor style/register will be operationalised as independent variables.
3.2 Retrieval of acoustic vowel measurements and normalisation
Acoustic measurements were extracted with the software Praat (Boersma & Weenink Reference Boersma and Weenink2021). The TextGrids (i.e. time-aligned annotation files) that accompany the audio files from ICE-Scotland were generated via forced alignment with WebMAUS (Schiel Reference Schiel2004) and manually corrected by the compilers. For this study, apart from customising the precise labelling of vowel categories, speakers’ age and gender were also added to the TextGrids. Intervals for formant measurements were set manually at a plausible central section of the vowel with no spurious formants. Only the first six minutes of TextGrids were annotated for vowel targets; files shorter than six minutes were annotated in full.
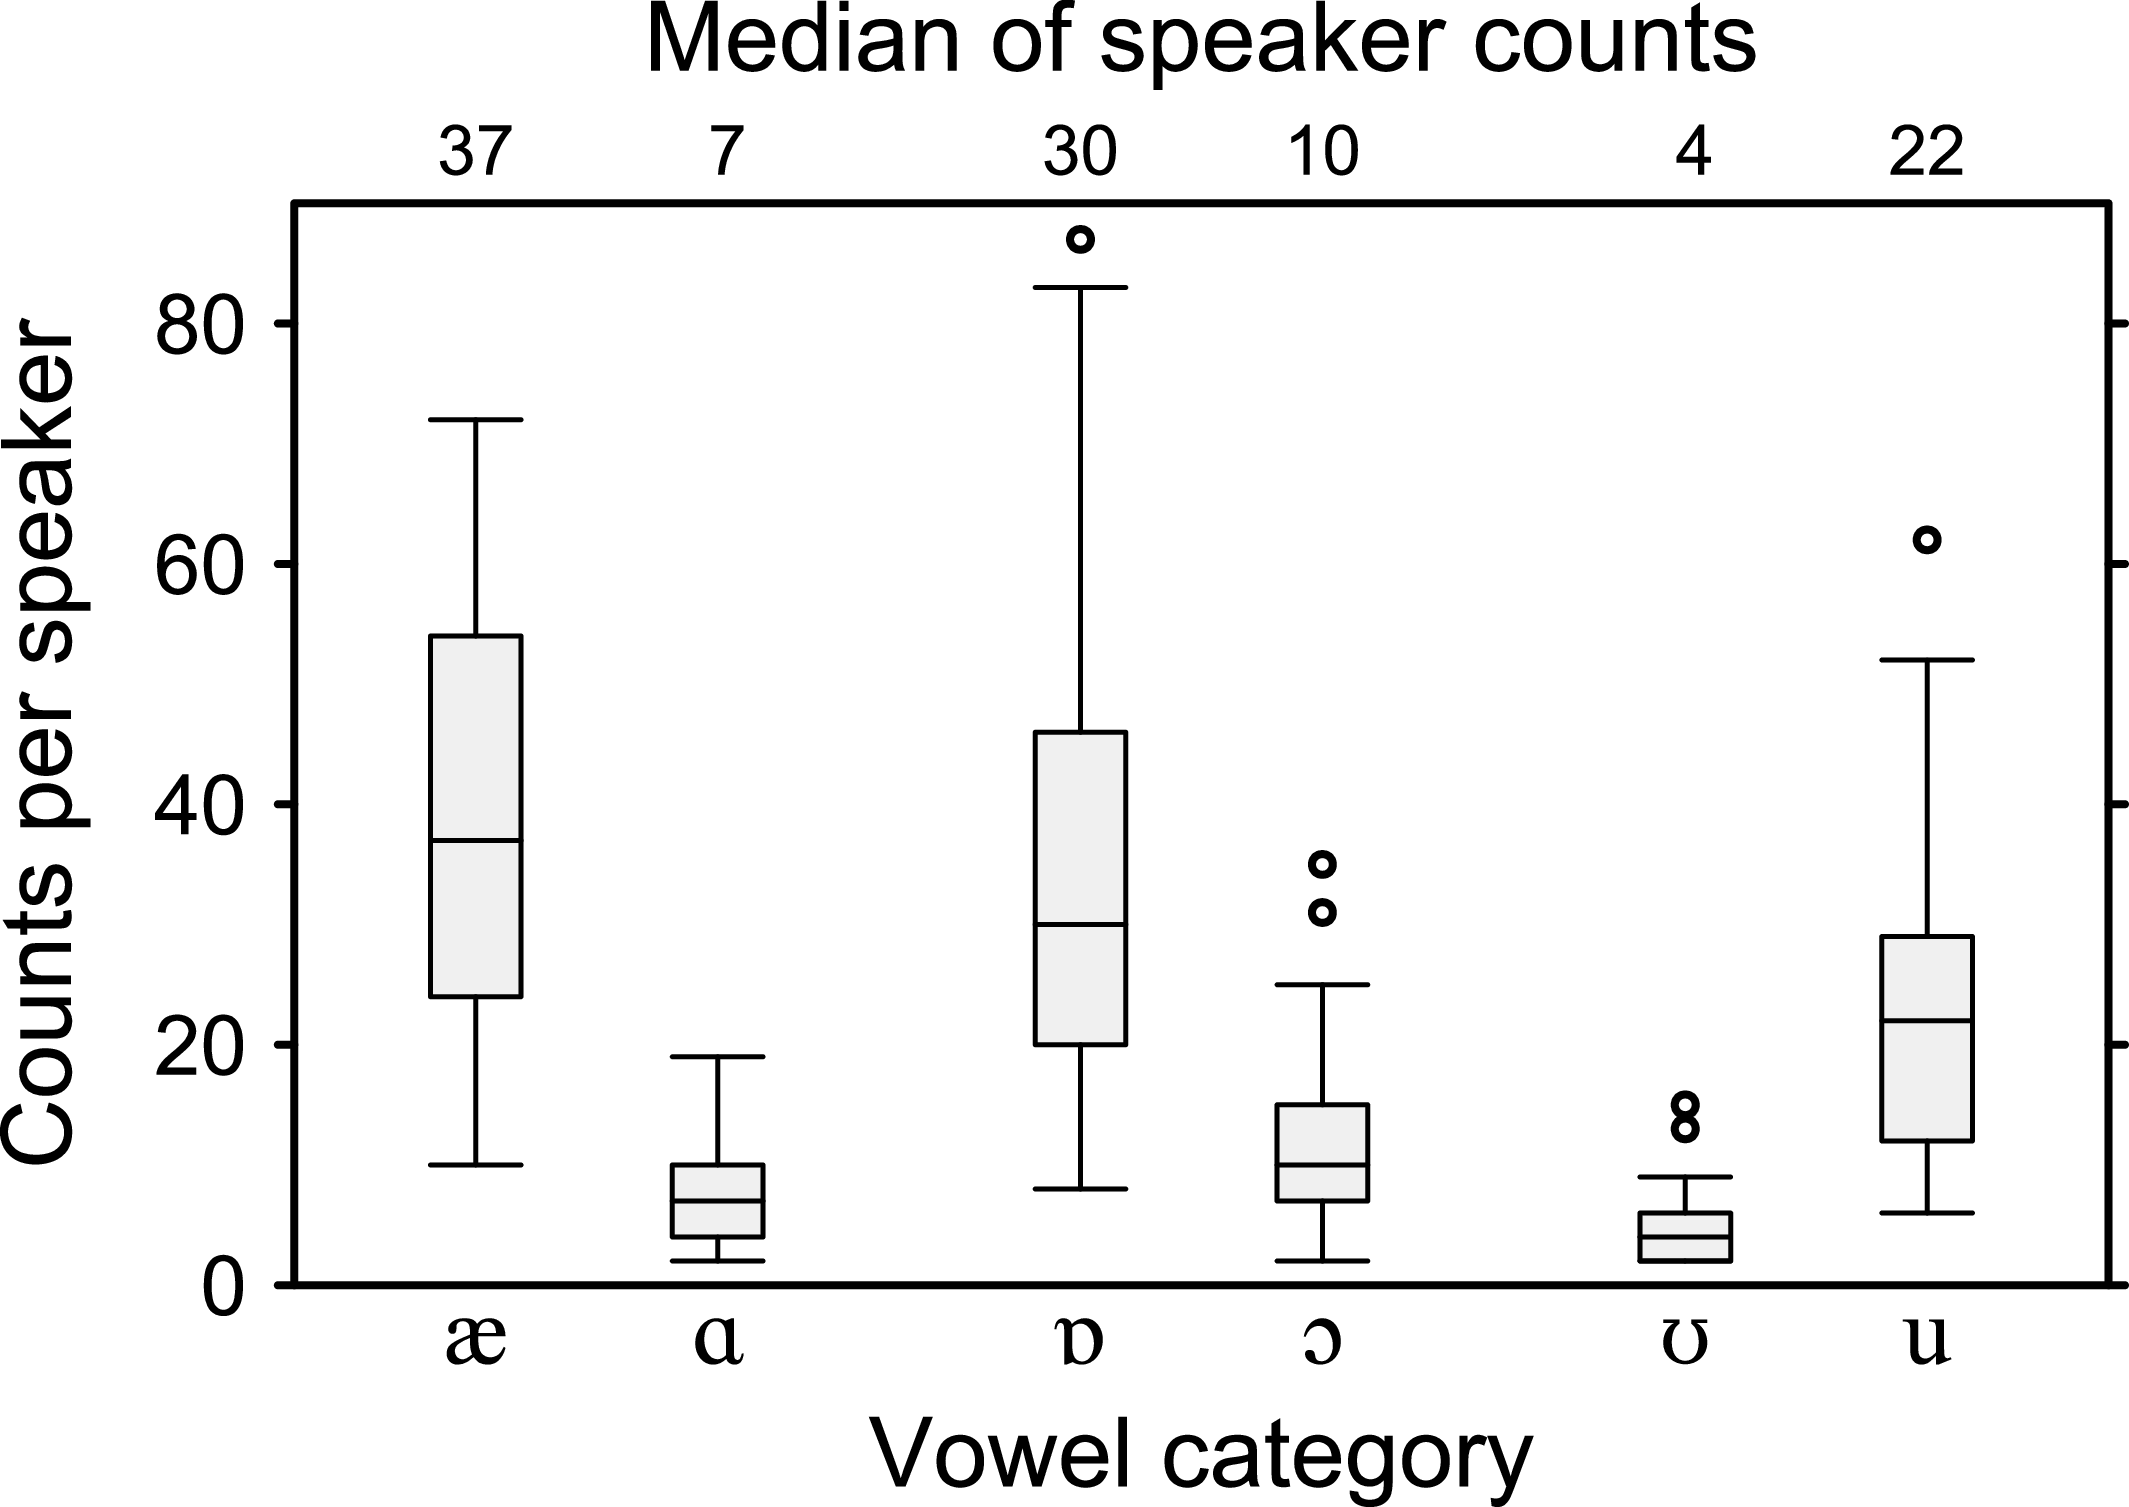
Information was extracted from the combination of TextGrids and audio files with a Praat script that is published in the online appendix, along with an exemplary TextGrid. The following parameters were retrieved: (i) mean F1, i.e. the centre frequency of the first formant, in Hertz (Hz), (ii) mean F2 (in Hz), (iii) speaker gender, (iv) speaker age, (v) word form, and (vi) vowel category. The total number of valid vowel tokens was n = 9,514. Of these, n = 4,138 belong to the six target categories [ɑ, æ, ɔ, ɒ, ʉ, ʊ], to which they were assigned based on their expected SSBE values. The remaining six categories ⁄i, ɪ, e, ɛ, ʌ, o⁄ comprise n = 5,376 tokens (cf. Figure 2c). However, for the normalisation of formant frequencies (see below), the nine traditional SSE monophthong categories ⁄i, ɪ, e, ɛ, a, ʌ, ɔ, o, ʉ⁄ (cf. Figure 1a) were used. Figure 4 shows the distribution of vowel counts per speaker for the six potentially split categories. The median number of tokens per speaker is additionally shown at the upper margin of the figure. Additional information regarding token numbers for all categories is given in Appendix B.
Average token number per speaker by vowel category

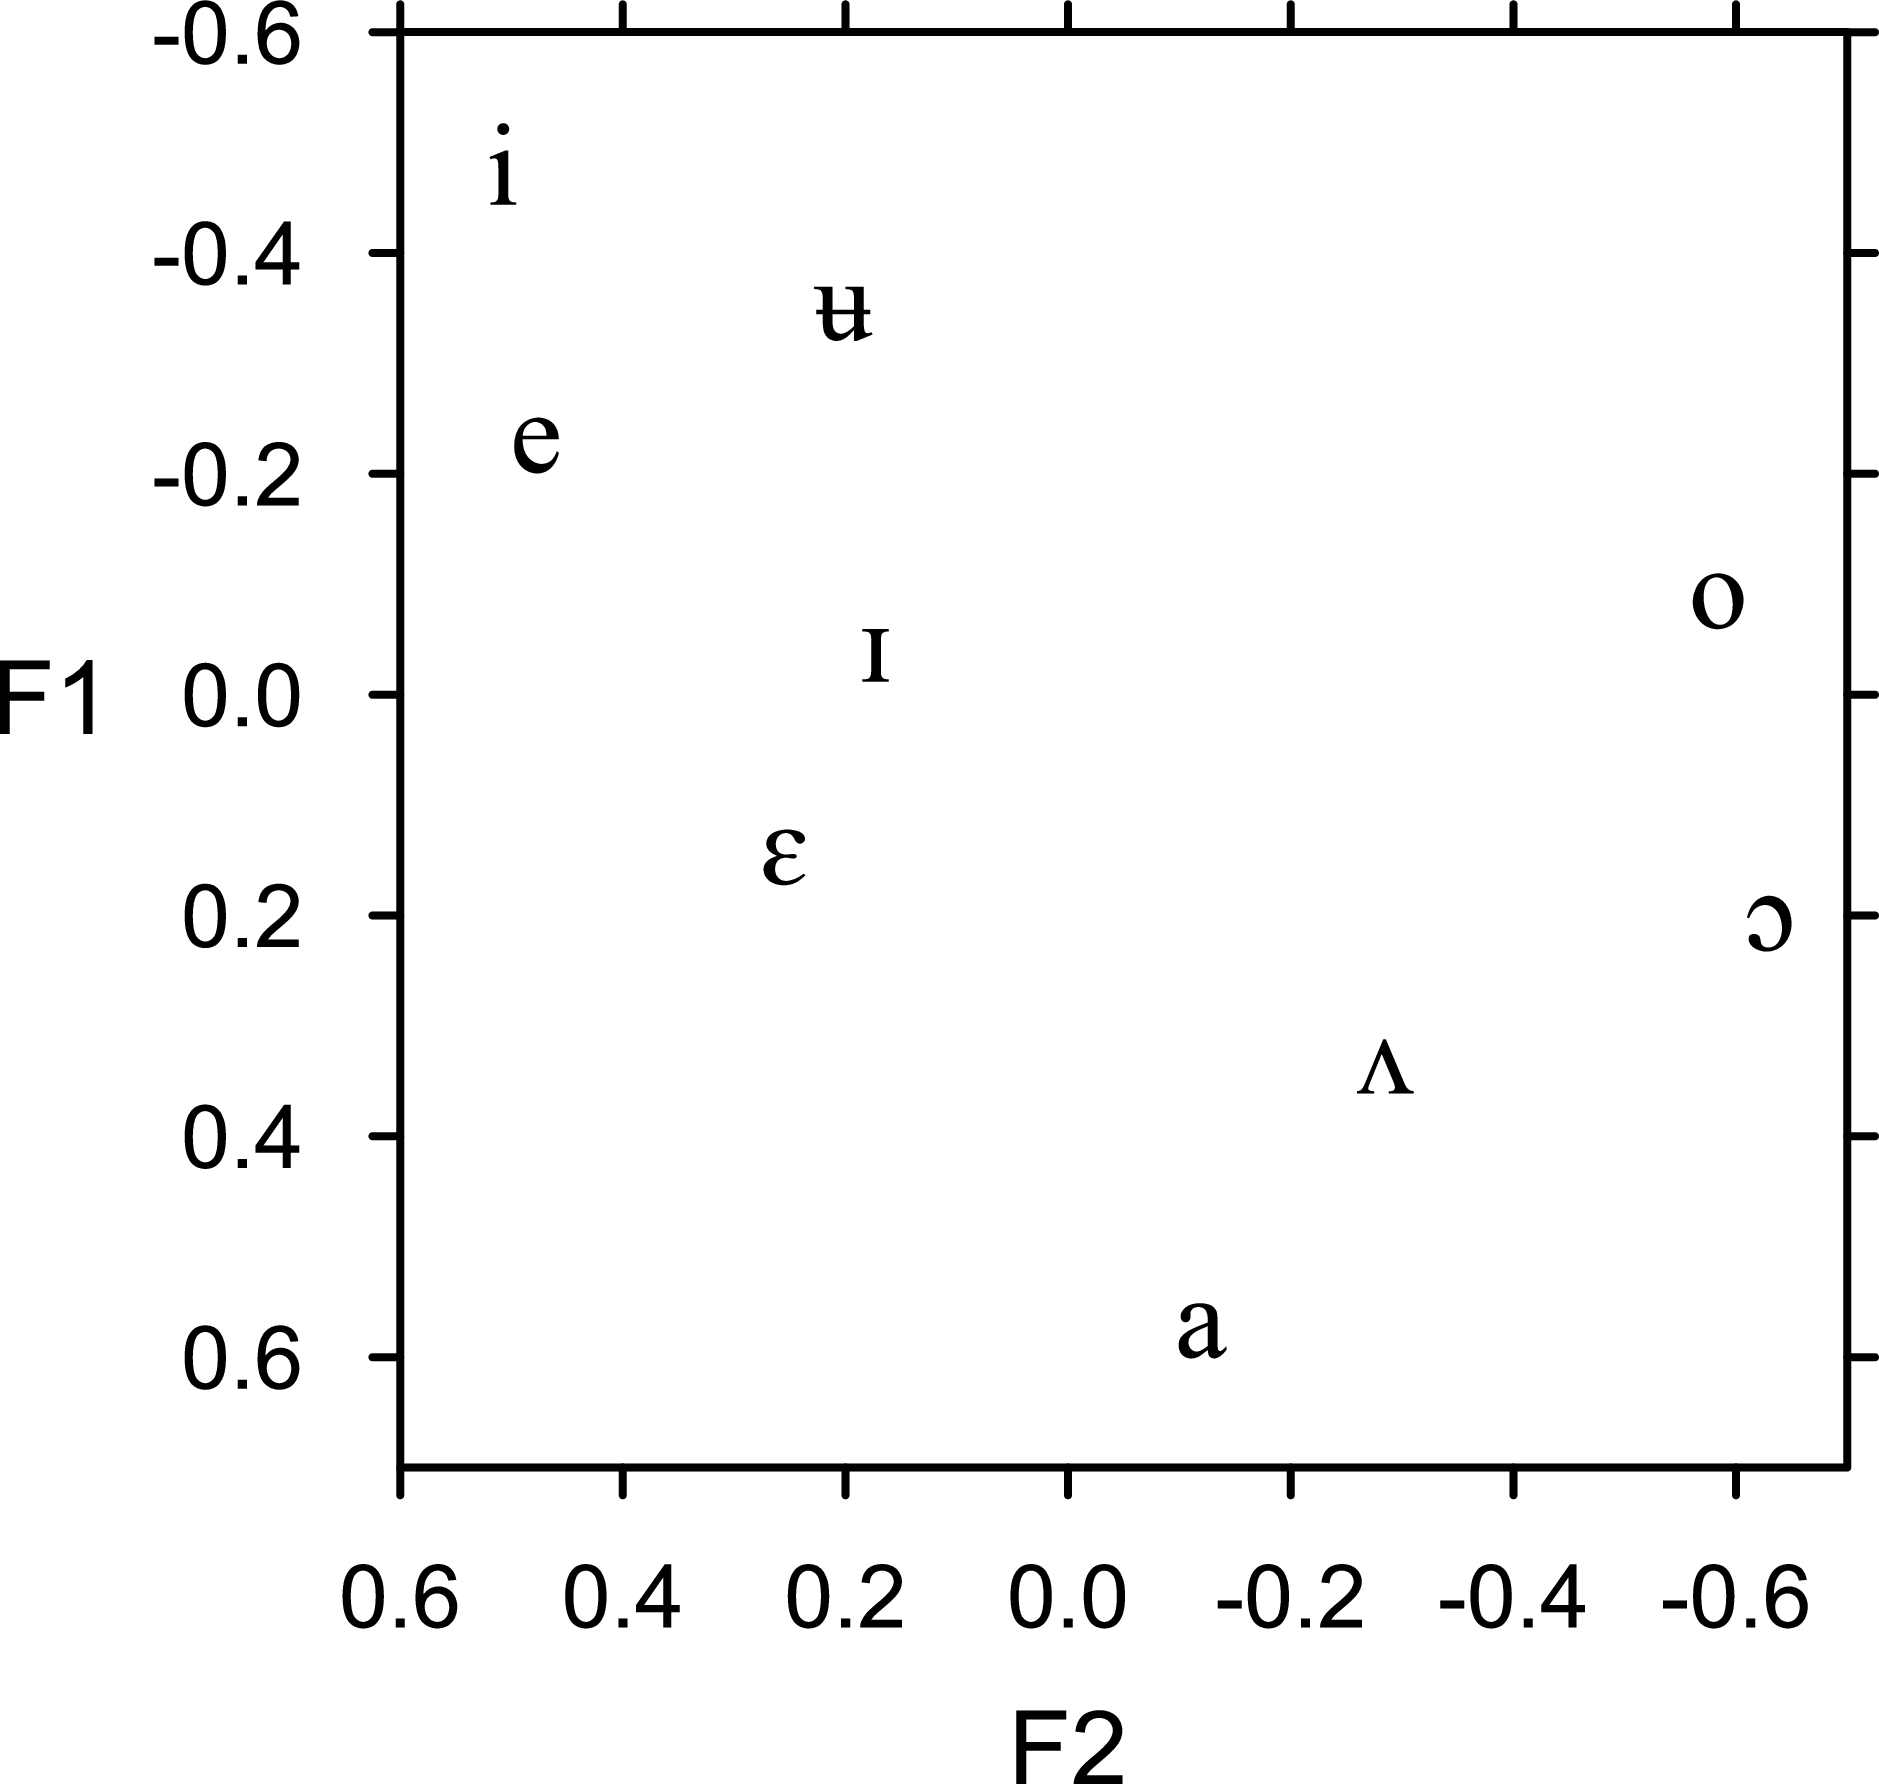
Formant readings were normalised based on the raw tokens for a given speaker, using an adapted version of Lobanov (Reference Lobanov1971), piloted by Sönning & Schützler (Reference Sönning and Schützler2018). Like all subsequent transformations and statistical analyses, this was done with the software R (R Core Team 2021) within the RStudio environment (RStudio Team 2025). First, for any given speaker, the mean centre frequencies of F1 and F2 (in logged Hz) of the n = 9 normaliser vowels were established (see Appendix B for token numbers). Next, the global standard deviation based on a total of n = 18 mean values (nine values each for F1 and F2) was calculated. Formant values of individual datapoints were then centred on mean values of F1 and F2 and divided by the standard deviation, yielding z-scores. Figure 5 shows the average vowel space, with centre frequencies of F1 and F2 averaged across all n = 34 speakers for each vowel.
Vowel positions averaged across all n = 34 speakers, based on the normalised raw data

Word forms extracted along with the acoustic and social information were subsequently merged into a smaller number of lemmas. For instance, the singular and plural forms action and actions as well as problem and problems were assigned to the lemmas action and problem, respectively.Footnote 7
The dataset produced in this way is published as Schützler (Reference Schützler2026; cf. Section 1.3) and forms the basis of the main analyses in this article. However, some variables were transformed prior to statistical analysis, as documented in the online appendix.
3.3 Statistical modelling
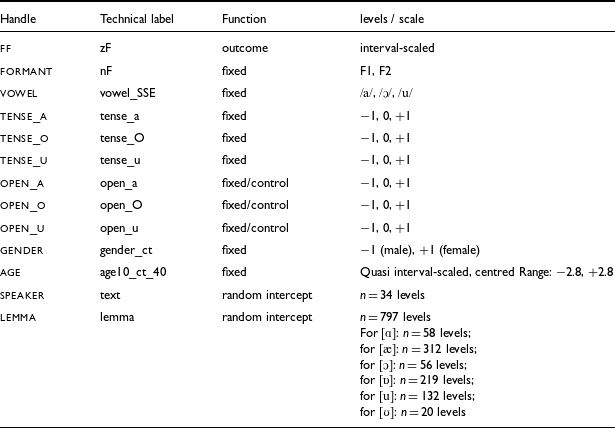
A Bayesian linear mixed-effects regression model fitted with the R package brms (Bürkner Reference Bürkner2020) was used to estimate the positions of all six outcome categories in the two-dimensional acoustic vowel space. The variables used in the model are listed in Table 1. The names of variables as used in the R script (published in the online appendix) are somewhat more technical than the simplified handles that I use in this paper; I also conventionally render those handles in small capitals to indicate that, for instance, I am referring to the predictor gender rather than gender as a concept.
Definition of predictor variables

Table 1 Long description
A table with 16 rows and 4 columns. The columns are labeled Handle, Technical label, Function, and levels / scale. The table lists various predictor variables used in a Bayesian linear mixed-effects regression model. Each row provides the handle, technical label, function, and levels or scale for each variable. For example, the first row lists ff, zF, outcome, and interval-scaled respectively. The table includes variables such as formant, vowel, tense, open, gender, age, speaker, and lemma, each with specific technical labels, functions, and levels or scales.
The outcome variable ff (for ‘formant frequency’) denotes a speaker-intrinsically normalised formant centre frequency (z-score); formant denotes the number of the formant (F1 or F2). Together, the four variables vowel, tense_a, tense_o and tense_u define the precise vowel category: vowel describes the traditional (‘unsplit’) SSE category, while the other three factor-coded variables specify the corresponding tense or lax vowel category in SSBE. The three (equally factor-coded) variables open_a, open_o and open_u were used to control for the phonetic effect that open syllables may have in vowel instances that would correspond to a long/tense category in SSBE. Including these predictors made it possible to estimate formant frequencies for closed syllables throughout.Footnote 8 The variable gender is centred, with a value of −1 denoting a male speaker and a value of +1 denoting a female speaker. In order to avoid extremely small coefficient values, age is centred at 40 years and divided by 10, so that a unit change corresponds to ten years of age. Finally, speaker and lemma are the two group-level variables. The model had the following syntax:
ff ∼ gender * age * formant * (vowel + tense_a + tense_o + tense_u)
+ formant * (open_a + open_o + open_u)
+ (formant * (vowel + tense_a + tense_o + tense_u + open_a + open_o + open_u) |
speaker)
+ (formant | lemma)
Each model was run with 4 chains of n = 2,500 iterations each, including a warmup of n = 500 iterations, so that the total number of posterior samples was n = 4 × (2,500 – 500) = 8,000. For explanations of Bayesian modelling see Kruschke (Reference Kruschke2015), McElreath (Reference McElreath2020), as well as the summaries in Schützler (Reference Schützler2023: 98–105) and Sönning (Reference Sönning2020: 46–50).
Due to the complexity of the model, no priors were specified, and the advantage of using a Bayesian model thus lay in the avoidance of convergence issues and the flexible handling of the output, not in the incorporation of prior information (see Schützler Reference Schützler2023: 101–105). No model comparison and selection was applied, since all theoretically motivated predictors were considered essential (cf. Heinze, Wallisch & Dunkler Reference Heinze, Wallisch and Dunkler2018); I thus adopted the notion of the ‘deductive model’ (Tizón-Couto & Lorenz Reference Tizón-Couto and Lorenz2021).
3.4 Analytical approach post modelling
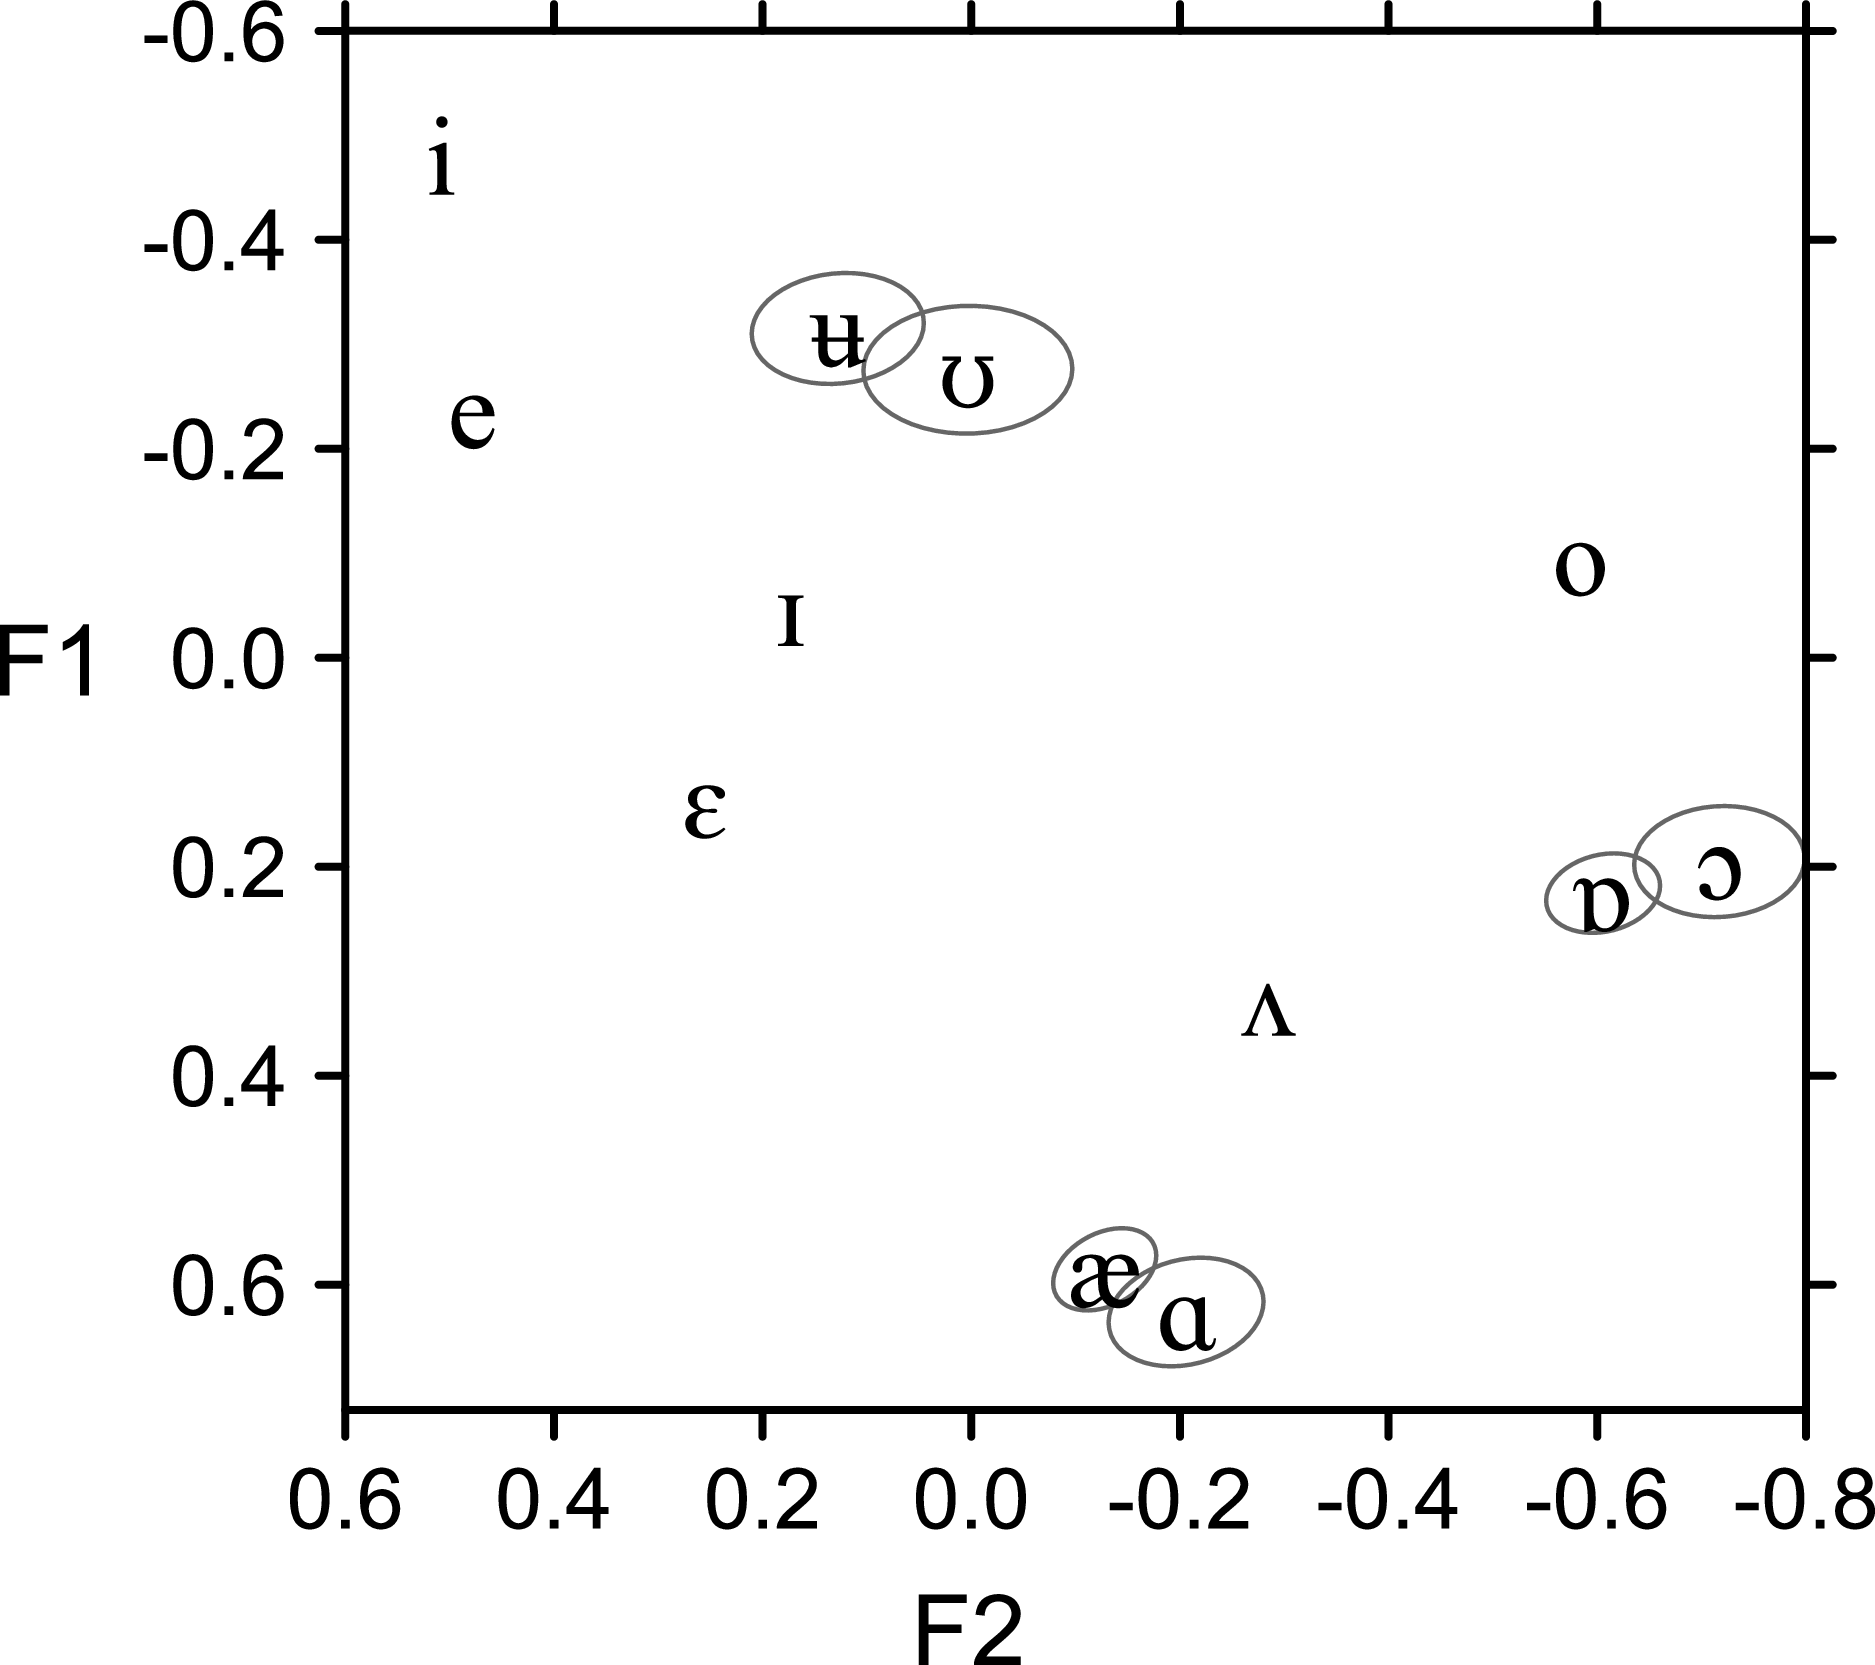
Using the predictor values relevant for a given scenario, n = 8,000 values of F1 and F2 – i.e. the number corresponding to the size of the posterior sample – were calculated for each of the vowel categories of interest. Vowel positions were then plotted as 90% credibility ellipses in Figures 6 & 7. For Figures 8 & 9, the underlying category-specific values of F1 and F2 were used to calculate the overall Euclidean distance (in two-dimensional space) between the notionally tense and lax member of each pair, as well as the formant-specific (one-dimensional) differences between them. In the analyses that employ Euclidean distance, Abercrombie’s categorical framing ‘if a speaker has B, they also must have A’ was translated into the continuous framing ‘in the average speaker, A should be more pronounced than B’.
Average vowel positions from a global perspective (with 90% credibility ellipses)

Average vowel positions by groups: (a) older women, (b) younger women, (c) older men, (d) younger men (with 90% credibility ellipses; note that the reference vowels ⁄i⁄ and ⁄e⁄ are not shown)

4. Results
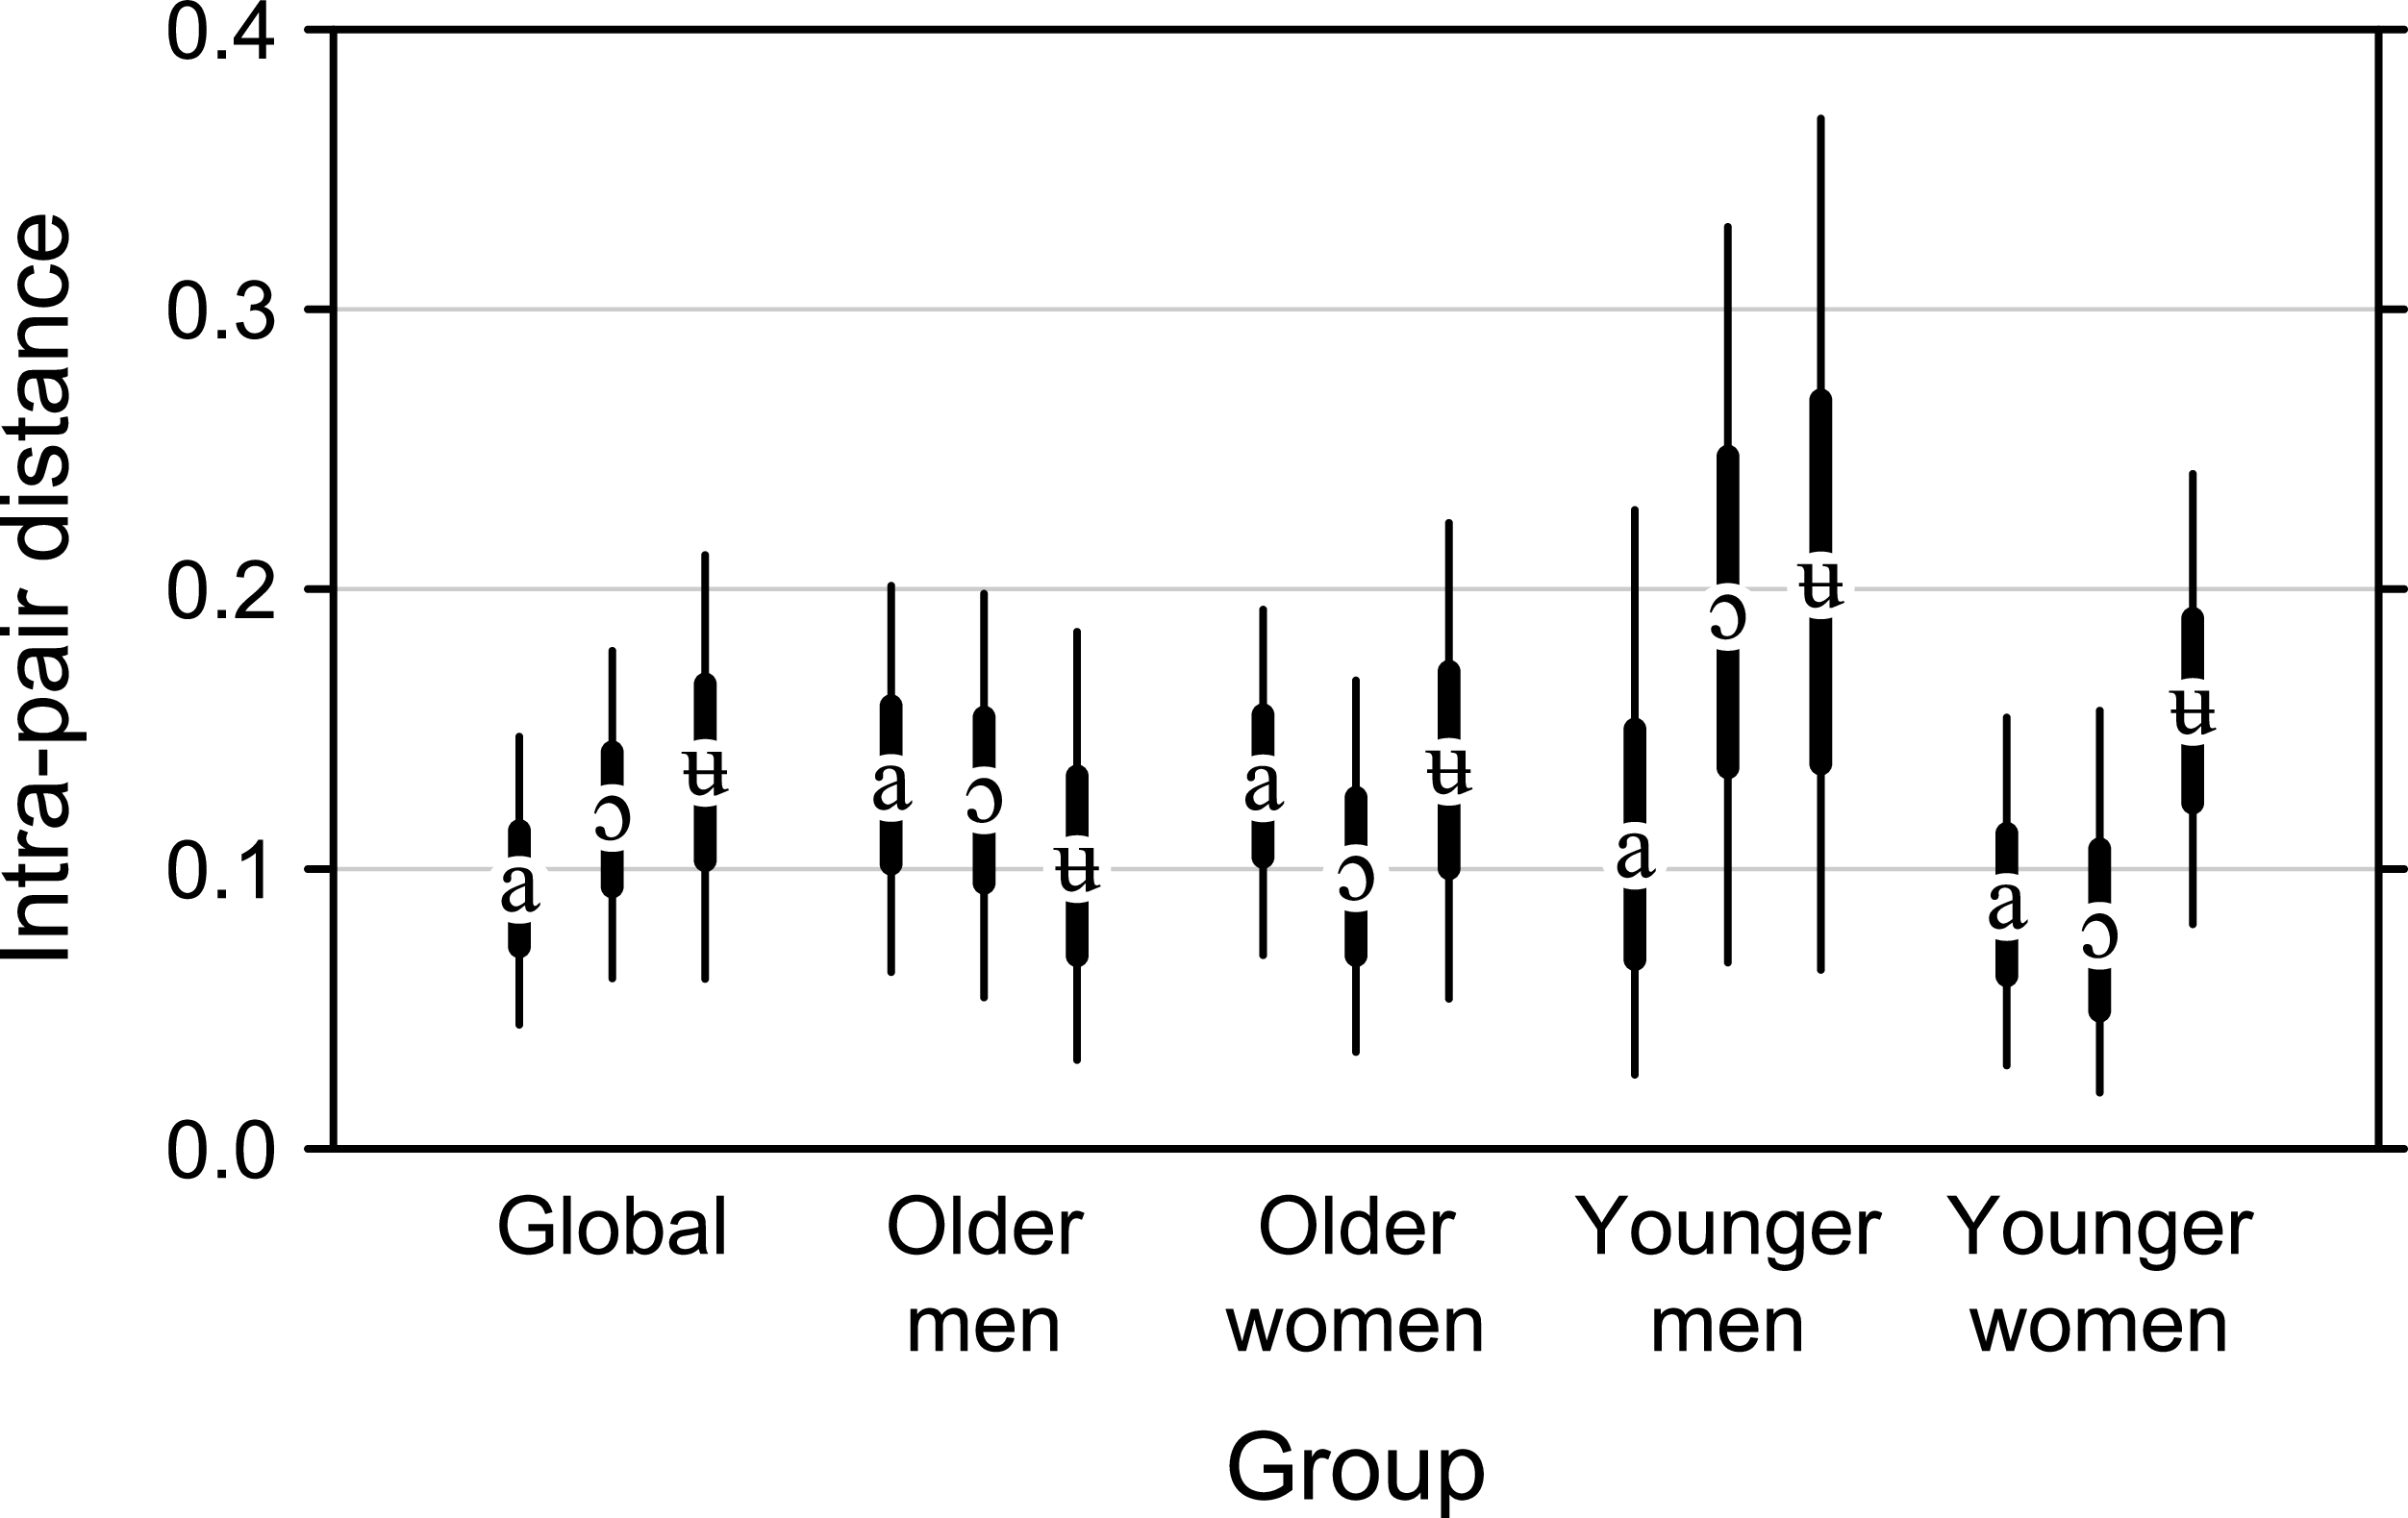
Model output is not reproduced here but the model object published in the online appendix can be queried. Figures 6 & 7 work with credibility ellipses for different subsets of speakers. The insights gained from this visual approach can then be refined using the information in Figures 8 & 9, which focus on intra-pair Euclidean distances and one-dimensional differences in F1 and F2, respectively. The latter two plots also make it possible to assess statistical robustness. When it comes to interpretations that concern the ranking of contrasts (or splits), there is of course a leap from the aggregate (i.e., group-wise) perspective presented in the plots to the assumption that similar patterns would, on average, be found at the speaker level. A truly speaker-specific perspective remains a desideratum for future work.
Figure 6 shows the estimated mean positions of all six target categories with 90% credibility ellipses. The positions of the remaining six vowels shown as reference points (⁄i, e, ɪ, ɛ, ʌ, o⁄) are not statistically modelled but based on the raw data (means of speaker means), and are thus the same as in Figure 5.
A first observation is that pair-internal differences for all three categories are relatively small, with fairly compact and overlapping credibility ellipses, and they are certainly smaller than would be expected in varieties with phonemically defined tense-lax pairs (like SSBE; see Figure 1b). Among the categories plotted here, the shortest Euclidean distance between any two reference vowels is 0.20 between ⁄ɪ⁄ and ⁄ɛ⁄, while – at least in this global perspective – the largest pair-internal distance among the target vowels is 0.13, between [ʉ] and [ʊ].
Despite the modest pair-internal qualitative distance, however, members of pairs are in fact characterised by robust differences particularly in the second formant, as will be discussed in connection with Figure 9 below. A second, preliminary finding is that, in absence of any obvious difference between the magnitudes of the three incipient splits, the ranking described in the literature will probably find little support in these data. Finally, all three splits happen in directions that are broadly consistent with an assumed pull from the direction of SSBE – again see Figure 1b, where the positions of paired tense/lax categories are of course much more distinct.
Figure 7 unfolds the picture into four roughly defined social groups. For better resolution, and in contrast to Figure 6, only four reference vowels are shown, namely ⁄ɪ, ɛ, ʌ, o⁄. Younger men are underrepresented in the sample (see Figure 3), and, accordingly, the uncertainties (i.e. the sizes of ellipses) in this subset are larger.
Distances within pairs by groups (with 50% and 90% credibility intervals)

The directions in which tense and lax members of pairs diverge from each other are in agreement between social groups and with the global picture shown in Figure 6. Compared to older speakers, there is very little differentiation in ⁄a⁄ among younger speakers of either gender, while incipient split of ⁄ʉ⁄ seems to be somewhat more pronounced. Younger men stand out in their stronger differentiation of ⁄ɔ⁄ into two categories. Some overlap of the pair-internal credible spaces of subcategories is always retained (minimally, in the case of older women’s use of ⁄a⁄), and, in sum, the patterns do not suggest that incipient splits are very strongly or systematically conditioned by sociolinguistic factors. The mixed picture that emerges is evident in the conflicting apparent-time trends. With regard to the category ⁄a⁄, younger speakers of both genders hold on to the traditional single category more strongly than older speakers, and a similar pattern is visible in younger women’s treatment of the vowel category ⁄ɔ⁄ vis-à-vis older women’s realisations. An inverse apparent-time trend in the direction of somewhat more developed splits can be observed in the remaining cases: ⁄ɔ⁄ in men, and ⁄ʉ⁄ in both genders. From the perspective of vowel splits, these apparent-time patterns raise the question if some patterns are perhaps better accounted for if we assume that the single-phoneme status of certain vowels has never been fully robust. For instance, rather than assuming that younger speakers are holding on to traditional realisations of ⁄a⁄, it could be argued that what we observe is the closing of the gap between variant realisations that may always have been characteristic of the SSE category. This intriguing question would need to be addressed using properly diachronic data and cannot be pursued any further in this study.
Figure 8 focuses on intra-pair Euclidean distances. Differences within pairs are not large, and rankings of incipient splits are highly diverse. With the exception of older men, ⁄ʉ⁄ tends to display the most pronounced split. Even if this is not by a large margin, it nevertheless consolidates the impression that Abercrombie’s ranking finds no support in these data. The differences between age groups described above are less obvious in this arrangement, but it is still possible to see the decreasing differentiation in ⁄a⁄ (both genders) and ⁄ɔ⁄ (women), as well as the increasing differentiation in ⁄ɔ⁄ (men) and ⁄ʉ⁄ (both genders). Note that Euclidean distance will always take a positive value and does not indicate the direction of a difference. In the vast majority of cases, a simplistic Euclidean distance measure will still be very informative, but it may lack precision when comparing categories with a lot of shared vowel space.
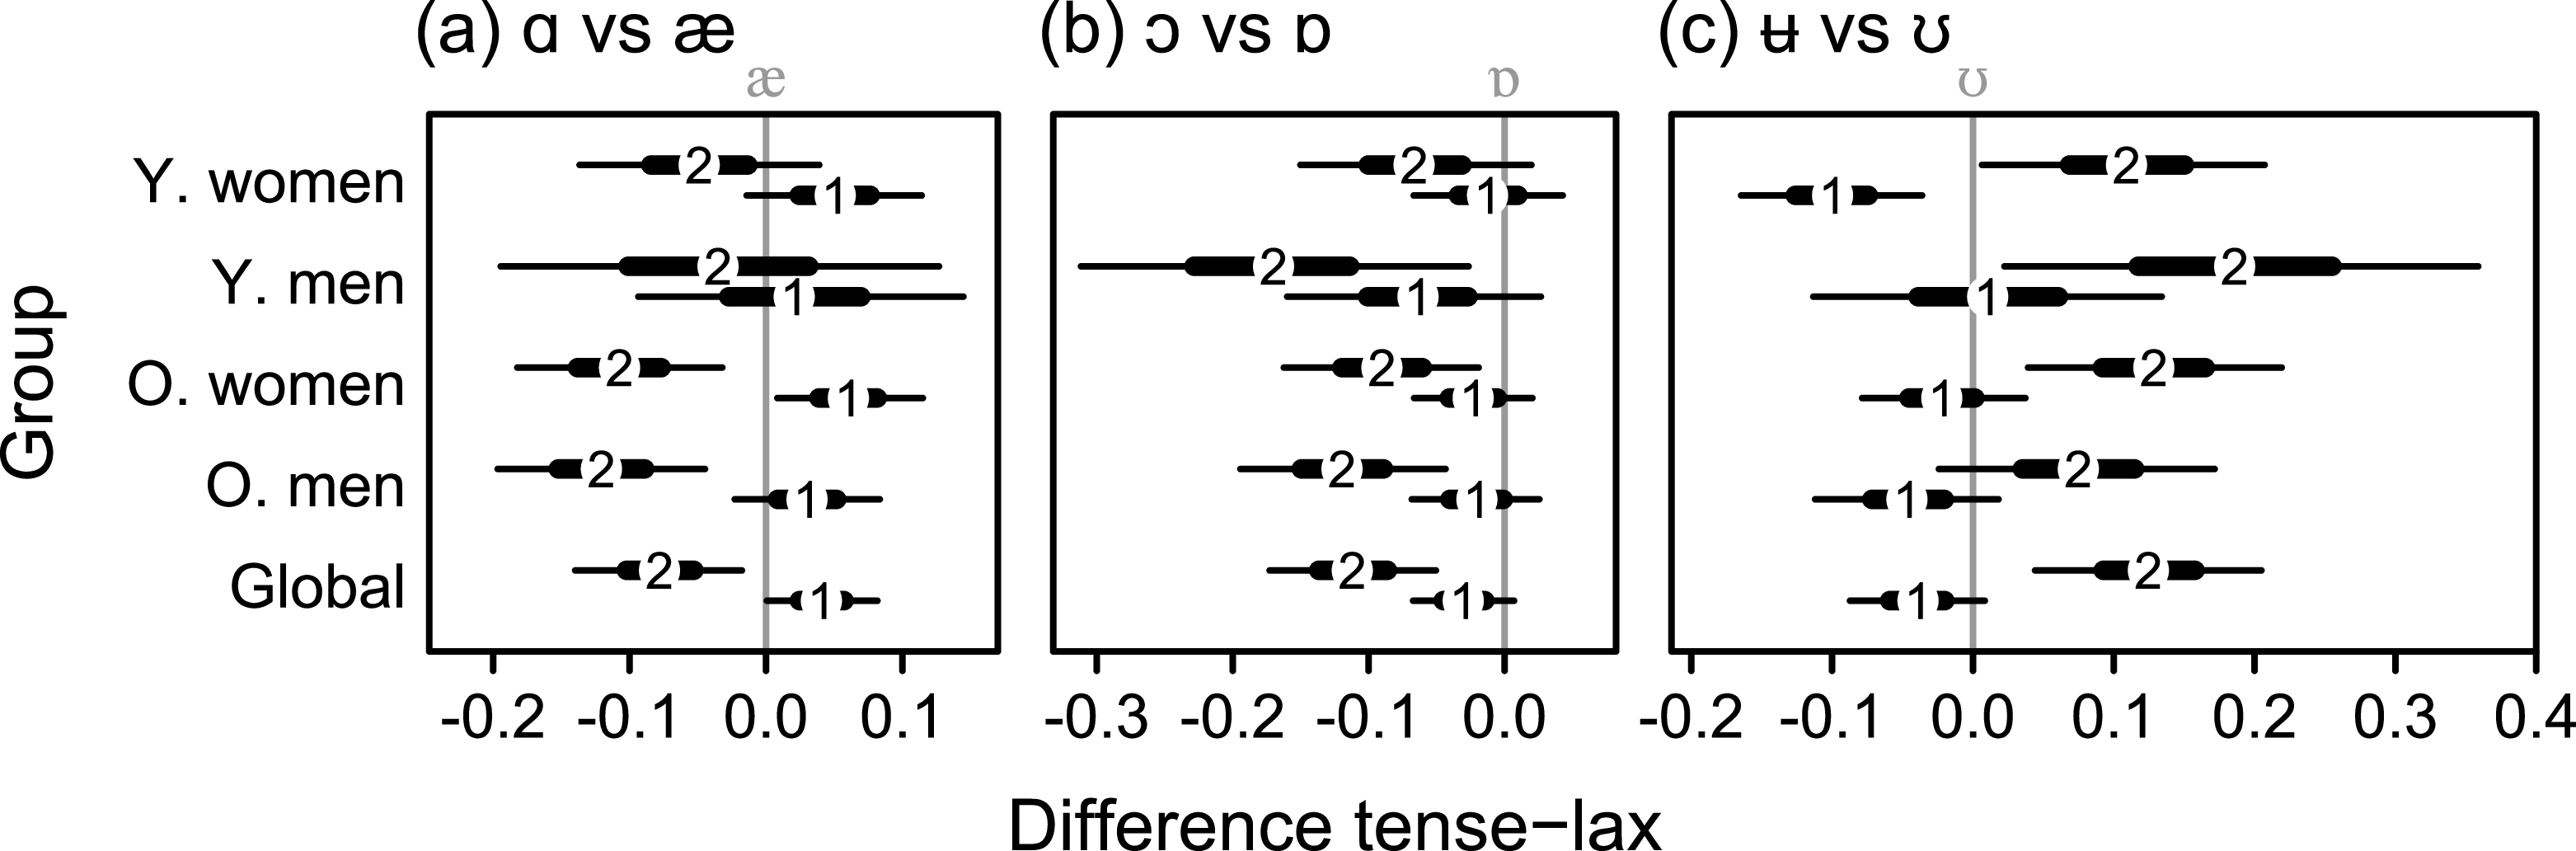
Figure 9 provides an assessment of the behaviour of individual formants. It shows the estimated difference between the assumed tense and lax categories by vowel category (⁄a, ɔ, ʉ⁄), broadly defined social group, and formant (F1, F2). Positions to the left of the grey reference line in each panel indicate that the respective formant value is lower for the notionally tense category than for the lax category. We can claim an incipient split with some confidence if, for a given vowel and social subset, at least one of the two formant differences is robustly different from zero.
Older speakers differentiate two qualities of ⁄a⁄ by means of F2, while there is no clear evidence of this split for younger speakers. The prominent role of F2 is unsurprising, since the SSBE categories ⁄ɑ⁄ and ⁄æ⁄ differ mostly in this dimension. Within the SSE category ⁄ɔ⁄, only younger women lack a clear split. For the other three groups, the differentiation of tense and lax counterparts is achieved by lower values of F2 in the tense category, which translates into a position that is somewhat further back. Finally, regarding ⁄ʉ⁄, women of both ages as well as younger men have a robust (if still modest) split, carried by F2 throughout (with the tense category further front) and additionally by F1 for younger women.
Apart from gaining more precise insights into the behaviour of the two formants, the perspective taken in Figure 9 confirms earlier impressions. There is no evidence of the ranking attested in the literature. SSE ⁄ʉ⁄ and ⁄ɔ⁄ show a statistically robust split – i.e. a reliable difference between assumed tense and lax categories in at least one formant dimension – in three of the four idealised social groups, while ⁄a⁄ shows such a difference in only two groups. In addition, the groups in question vary across vowel categories. These results also provide an important counterpoint to the discussion of Figure 8 above, since here it is not the absolute Euclidean distance that is of interest but the robustness of tense-lax differences in formant centre frequencies.
F1 and F2 displacement of tense category relative to lax category, by group and vowel (with 50% and 90% credibility intervals)

Figure 9 Long description
Three bar graphs compare the differences in vowel positions between tense and lax categories across different groups. Each graph represents a different vowel comparison: (a) a vs æ, (b) o vs ɔ, and (c) u vs ʊ. The x-axis represents the difference between tense and lax vowels, while the y-axis lists the groups: Y. women, Y. men, O. women, O. men, and Global. Each group has two bars labeled 1 and 2, with credibility intervals shown as horizontal lines. In graph (a), the differences range from -0.2 to 0.1. In graph (b), the differences range from -0.3 to 0.1. In graph (c), the differences range from -0.2 to 0.4. The graphs show varying degrees of displacement for each vowel comparison across the different groups.
5. Discussion
This article has tried to ascertain (i) if the three SSE vowel categories ⁄a⁄, ⁄ɔ⁄ and ⁄ʉ⁄ show symptoms of an incipient split into two categories each, organised along similar lines as in SSBE, (ii) if the degree of split correlates with the basic social predictors of age and gender, and (iii) if there is any evidence of the implicational ranking of the three splits, whereby a split of ⁄a⁄ is a prerequisite for a split of ⁄ɔ⁄, which, in turn, is a prerequisite for a split of ⁄ʉ⁄. With certain caveats in place, the first two questions can be answered in a cautious affirmative; in answer to the third question, no evidence of an implicational ranking was found.
Compared to vowel charts of SSBE, the (acoustic) differences between the hypothesized tense-lax target categories in this study are small. If we nevertheless refer to them as ‘incipient splits’, it is because the statistical assessment of the differences between them in terms of F1 or F2 (and sometimes both) supports this. In other words: there are small but robust acoustic differences between the members of each pair. The notion of a contact-induced split is further substantiated by the finding that the relative positions of the two categories in each pair broadly agree with the assumption of underlying SSBE target qualities. Since they are relatively small, pair-internal differences could potentially be due to systematic phonotactic differences between lax and tense contexts: if a certain word-internal phonological environment correlates strongly with either the lax or the tense category, this could pull the respective vowel quality in a certain direction, without any phonological consequences. This potentially confounding factor was partially controlled for by including a predictor variable for open syllables – a context that is not only frequent but also perfectly correlates with the putative tense-lax difference, since it is only available to the SSBE vowels ⁄ɑː⁄, ⁄ɔː⁄ and ⁄uː⁄, but not ⁄æ⁄, ⁄ɒ⁄ and ⁄ʊ⁄. While other contexts with coarticulatory effects may play a role, too, they can be considered less critical as they concern both lax and tense categories and will in addition be much less frequent than open-syllable contexts.
A further qualification of the findings results from the fact that the four basic social categories (older and younger men and women) correspond to splits and non-splits in a relatively unsystematic way: no split is found for younger speakers of either gender regarding the SSE category ⁄a⁄, or for younger women and older men, respectively, regarding the categories ⁄ɔ⁄ and ⁄ʉ⁄. These findings indicate that not all speakers are affected, and that there is no evidence of a general apparent-time trend in the direction of vowel splits. They also cast some doubt on the assumption that the change of these vowels must be unidirectional. In concrete terms: incipient splits (against the background of Scots phonology) are not the only possible explanation, as it is also possible that small, pair-internal differences have always been part of the accent.
Finally, the implicational ranking of splits that keeps surfacing in the literature post Abercrombie (Reference Abercrombie, Aitken and McArthur1979) does not find support in these data. Although the original categorical framing of the hierarchy was translated into a quantitative hierarchy by degree – that is, the assumption that splits of ⁄a⁄ should be larger than splits of ⁄ɔ⁄, which, in turn, should be larger than splits of ⁄ʉ⁄ – the results are clear and we can firmly reject the claimed ranking, at least in qualitative terms.
6. Conclusion and outlook
The two main conclusions from the present research pertain to the existence and degree of splits on the one hand and their ranking on the other.
Regarding the first, it is fair to consider the patterns that were detected as splits if we look at the data from a global perspective, controlling for the basic social predictors used in this study. However, these splits are generally on a very small scale, some of them disappear when more specific social scenarios are inspected, and – despite controlling for open-syllable contexts – some remaining coarticulatory effects cannot be ruled out. In sum, there are measurable qualitative splits, but their sociolinguistic stability and perceptual significance are probably limited. On the other hand, it is reassuring that patterns of this kind were found in speakers that did not display general signs of anglicisation with regard to other accent features.
The second main conclusion from the present study is that, focusing on acoustic vowel quality, Abercrombie’s hierarchy of splits does not find support in the more recent data that were used here. Perhaps a ranking that existed in the late 1970s has disappeared in a diachronic process unobserved by sociophoneticians, but since in the present data there is absolutely no semblance of the pattern originally described, this sems unlikely. The implicational ranking of qualitative splits affecting ⁄a⁄, ⁄ɔ⁄ and ⁄ʉ⁄ should therefore probably be presented with considerably more caution in future accounts of the SSE accent, if it is put forward at all.
It needs to be borne in mind, however, that the analyses and arguments presented above rest entirely on an acoustic analysis of vowel quality and disregard vowel duration. In consequence, claims and conclusions are only valid for incipient qualitative splits. On the one hand, this limiting approach was taken so as not to overburden this contribution with the additional methodological and quantitative apparatus necessary to explore this aspect of vowel variation; on the other hand, descriptions of the SSE vowel system and its potential partial convergence upon the Southern British system (here: via splits) have in the past mainly relied on quality, sometimes with the implication, or so it seems to this author, that qualitative and quantitative pairwise differentiation will be strongly correlated. This need not necessarily be the case, however; McClure (Reference McClure and Burchfield1994: 81), for instance, suggests that quantitative differentiation may actually exceed qualitative differentiation.
Thus, future research on the vowels that featured in this study would have to give vowel duration a central place. If qualitative splits are of relatively minor importance (and must indeed be considered ‘incipient’, at best), a partial convergence on SSBE patterns might be carried mainly by systematic length differentiations. This kind of quantitative split could then be an attractive strategy for Scottish middle-class speakers to anglicise their accents in a uniquely Scottish way that allows them to hold on to salient native qualities. It seems a small step from these informed speculations to the formulation of new working hypotheses that hinge on vowel duration, in addition to quality. Combining qualitative and quantitative differences between the members of putative vowel pairs will have its challenges, both methodologically and in the interpretation and communication of results, since both dimensions of variation must be modelled with an eye to their correlation, at the group level and at the level of the individual speaker. Facing those challenges, however, can open another chapter in the exploration of an important bundle of features relevant in the variation – and, possibly, change – of the vowels of Standard Scottish English.
Acknowledgements
I gratefully acknowledge support from the DFG (German Research Council, grant SCHU 3250/1-1).
Appendix A. Sound files and basic speaker parameters
Table A1 lists the 34 soundfiles from ICE-Scotland that were used in the analysis, along with the main speaker characteristics, gender and age.
File identifiers and speaker characteristics

Table A1 Long description
The table presents data on 34 soundfiles from ICE-Scotland, detailing the main speaker characteristics, including age and gender. It has 34 rows and 5 columns. The columns are labeled ‘Speaker’, ‘Gender’, ‘Age’, ‘Speaker’, ‘Gender’, ‘Age’, ‘Speaker’, ‘Gender’, ‘Age’. Each row lists the speaker identifier, gender, and age for three different speakers. Row 1: bnew_06, m, 35, btal_23, m, 52, leg_04, f, 65. Row 2: btal_01, f, 21, btal_24, f, 45, leg_05, m, 50. Row 3: btal_03, f, 60, btal_26, f, 66, leg_07, m, 63. Row 4: btal_05, m, 52, btal_27, f, 73, leg_10, m, 62. Row 5: btal_13, f, 45, btal_28, m, 42, unsp_02, f, 44. Row 6: btal_14, f, 65, btal_29, f, 55, unsp_07, f, 35. Row 7: btal_16, f, 17, btal_33, m, 47, unsp_08, f, 30. Row 8: btal_17, f, 44, btal_36, m, 47, unsp_12, m, 65. Row 9: btal_18, f, 48, btal_38, f, 59, unsp_25, f, 35. Row 10: btal_19, f, 50, btal_39, m, 51, unsp_26, f, 55. Row 11: btal_21, m, 63, btal_40, m, 65, . Row 12: btal_22, m, 50, btal_41, f, 44, .
Appendix B. Token numbers by vowel
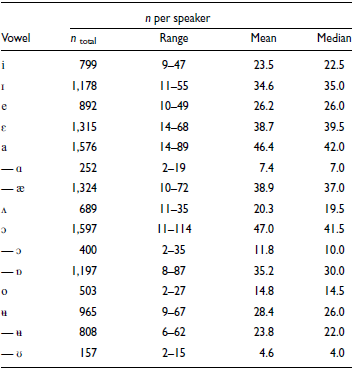
Table A2 shows the distribution of all n = 9,514 vowel tokens across the different categories, as well as information on the number of tokens per speaker. For full details (e.g. precise token numbers produced by individual speakers) the published dataset can be consulted (cf. Section 1.3). The three traditional SSE categories ⁄a⁄, ⁄ɔ⁄ and ⁄ʉ⁄ are additionally unfolded into the corresponding SSBE categories.
Token numbers per speaker by vowel category

Table A2 Long description
The table presents the distribution of vowel tokens across various categories and the number of tokens per speaker. It includes columns for the total number of tokens, range, mean, and median per speaker. The vowels listed are i, r, c, e, a, short a, long a, A, o, short o, long o, u, short u, and long u. Each row provides specific data for these vowels. For example, the vowel i has a total of 799 tokens, with a range of 9-47, a mean of 23.5, and a median of 22.5. The vowel r has a total of 1,178 tokens, with a range of 11-55, a mean of 34.6, and a median of 35.0. The table continues with similar detailed data for each vowel category.


 Open access

