





Mappila Malayalam (MM) is a sociolect of Malayalam, a language belonging to the Dravidian family, that is primarily spoken by the Muslim community in the northern region of Kerala. It developed alongside other varieties of Malayalam and is unique in that, unlike other non-standard varieties, it has a fully developed script popularly known as ‘Arabi-Malayalam’ (a variant form of the Arabic script with special orthographic features to accommodate Malayalam phonemes) and has its own oral and written literature (Shamsuddeen Reference Shamsuddeen1978). The use of the script is now mostly limited to madrasas, and the spoken variety of MM continues to thrive in its contemporary form (Cheerangote Reference Cheerangote2013; Ashraf Reference Ashraf2021). The spoken variety is interesting for sociolinguistic reasons, as it is primarily associated with the Muslim community in the district of Malappuram, a marginalised and socioeconomically disadvantaged community which represents a paradox for a state otherwise known for its high social indices. Although this variety can be further classified into different subgroups based on their geographical/district boundaries, such as the Malappuram dialect, Kozhikode dialect, and Kannur dialect, it is mostly associated with Malappuram (Figure 1) due to that district’s high Muslim population compared to the others in Kerala. According to the census report (Office of the Registrar General & Census Commissioner, India 2011), Malappuram has over 4 million inhabitants, the highest in the state, and 70.24% of them are Muslims. Hence, for this Illustration, the data is collected from the Malappuram district.
Left: Map of present Kerala, with a red star indicating the location where data was collected.
Source: Rajeshodayanchal at ml.wikipedia (https://en.wikipedia.org/wiki/File:Kerala-map-en.png).
Right: Map of Malabar in the pre-independence era.
Source: https://commons.wikimedia.org/wiki/File:Malabar_District_Map.jpg

Figure 1. Long description
Panel A: A map of present-day Kerala with various districts highlighted in different colors. A red star marks the location where data was collected. Key locations include Kasaragod, Kannur, Wayanad, Kozhikode, Malappuram, Palakkad, Thrissur, Ernakulam, Idukki, Kottayam, Alappuzha, Pathanamthitta, Kollam, and Thiruvananthapuram. Panel B: A historical map of the Malabar District from the pre-independence era. Key locations include Cirakkal, Coorg, Mysore, Tellicherry, Mananthavady, Wynad, Nilgiris, Calicut, Ernad, Walluvanad, Palghat, and Cochin.
‘Mappila’, historically, is a community formed because of the propagation of Islam in Kerala during the 8th and 9th centuries by the Arab traders (Malaba District Gazetteer 1908). Although the community enjoyed socio-political power and status between the 11th and 14th centuries during the reign of the Zamorins, it declined with the advent of the Portuguese (Menon Reference Menon1971). The increasing power of the Portuguese in the coastal regions and the declining trade relations of the Arabs in the region forced the Mappila people to migrate to the interior parts of Malabar and to engage in agricultural occupations. This alienated them from mainstream commercial activities but strengthened the identity of Mappilas as a community (Menon Reference Menon1971; Thesni & Punnoose Reference Thesni and Punnoose2025). The historical marginalisation of the community is linked to their socio-economic backwardness compared to the other communities in the state, even in the present day.
The MM variety spoken today reflects multiple opposing factors at play simultaneously: those that favour dialect levelling in some speaker groups, for example, educated female speakers; and those that favour dialect retention or differential use of the dialect’s salient features to signal local and supra-local identities based on the addressee, education, and gender, for example, male speakers who have dropped out of school. Amidst all these ongoing social changes and their unique linguistic features, an Illustration of the phonetic features of the MM variety is relevant and timely.
The data for this Illustration were collected using a picture elicitation task, reading task, and informal interviews with three female speakers aged between 50 and 65 who were born and brought up in Malappuram and have not travelled much or stayed outside their household for more than two weeks continuously. The data were recorded at the speakers’ homes using a ZOOM H1n recorder and an ATR3350xis Audio Technica microphone at a 48-kHz sampling rate and 32-bit depth. The data were collected by the primary author, who is a first-language speaker of the MM variety.
Consonants
MM has 29 consonant phonemes in comparison to the 40 consonants reported in the Namboodiri dialect of Malayalam (Namboodiripad & Garellek Reference Namboodiripad and Garellek2017) and the 39 consonants reported in the ‘dialectally neutral’ variety described in Asher & Kumari (Reference Asher and Kumari1997: XXV) that is biased towards ‘the variety used by educated speakers in central Kerala’. In this paper, we refer to the variety described in Asher & Kumari (Reference Asher and Kumari1997) as Standard Malayalam (hereafter SM).
Out of these 29 consonants, 11 are plosives, 4 are fricatives, 6 are nasals, 5 are liquids, 1 is a flap, and 2 are approximants. The consonant inventory of MM is illustrated in the table below. The details of allophonic variation are discussed in the following sections.


Plosives
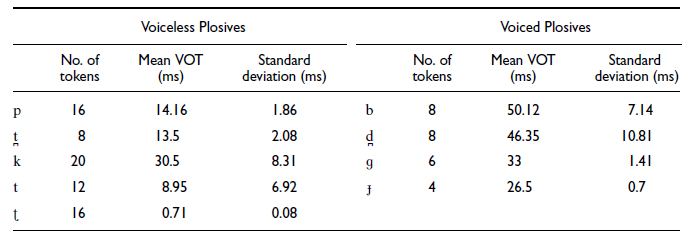
Mappila Malayalam has bilabial, dental, alveolar, retroflex, palatal, and velar plosives. The Voice Onset Time (VOT) of the plosives is given in Table 1 below, which shows a consistent voicing contrast between voiced and voiceless plosives.
Voice Onset Time of the plosives

Table 1. Long description
A table comparing voice onset times of plosives in Mappila Malayalam. The table has two main sections: Voiceless Plosives and Voiced Plosives, each with columns for the number of tokens, mean voice onset time (VOT) in milliseconds, and standard deviation in milliseconds. Voiceless Plosives: Row 1: p, 16 tokens, mean VOT 14.16 ms, standard deviation 1.86 ms. Row 2: t, 8 tokens, mean VOT 13.5 ms, standard deviation 2.08 ms. Row 3: k, 20 tokens, mean VOT 30.5 ms, standard deviation 8.31 ms. Row 4: t, 12 tokens, mean VOT 8.95 ms, standard deviation 6.92 ms. Row 5: t, 16 tokens, mean VOT 0.71 ms, standard deviation 0.08 ms. Voiced Plosives: Row 1: b, 8 tokens, mean VOT 50.12 ms, standard deviation 7.14 ms. Row 2: d, 8 tokens, mean VOT 46.35 ms, standard deviation 10.81 ms. Row 3: g, 6 tokens, mean VOT 33 ms, standard deviation 1.41 ms. Row 4: j, 4 tokens, mean VOT 26.5 ms, standard deviation 0.7 ms.
Mappila Malayalam, unlike other varieties of Malayalam such as Namboodiri Malayalam (Namboodiripad & Garellek Reference Namboodiripad and Garellek2017) or Standard Malayalam (Asher & Kumari Reference Asher and Kumari1997), does not have aspirated plosives. Aspiration is a distinctive feature in Malayalam, a result of loanwords from Sanskrit, and is not a Dravidian feature (Asher & Kumari Reference Asher and Kumari1997). The same loanwords in MM are devoid of aspiration. For example, the word-initial consonants in /falam/ ‘result’, /baɾaɳi/ ‘ceramic pot’, /d̪anam/ ‘wealth’, /kat̪a/ ‘story’. Figure 2 illustrates the spectrogram and waveform of /b/ produced without aspiration in the word /baɾaɳi/, which in SM is produced as /bʰaɾaɳi/.
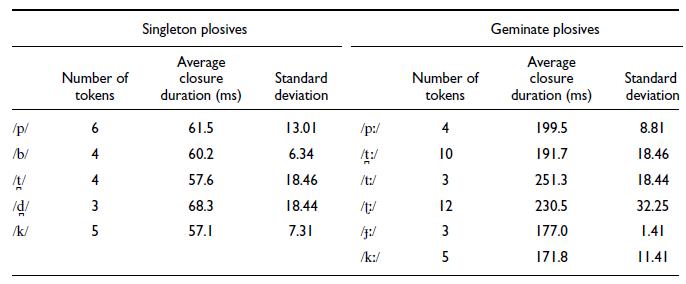
Singleton plosives in the word-medial position are less common than geminates in MM. The plosives /p/, /k/, /ɟ/, /ʈ/, /t̪/ and /t/ occur mostly as geminated in the word medial position. Table 2 presents the average closure durations of singleton and geminate plosives, along with the number of tokens analysed and their standard deviations. Across all places of articulation, geminate plosives show substantially longer closure durations compared to their singleton counterparts. This highlights a clear durational contrast between singleton and geminate plosives.
Average closure durations of singleton and geminated plosives in the MM

Table 2. Long description
A table with two main sections: Singleton plosives and Geminate plosives. Each section lists the number of tokens, average closure duration in milliseconds, and standard deviation for different plosives. Singleton plosives include p, b, t, d, k with respective data. Geminate plosives include p, t, t, d, k with respective data. The table shows that geminate plosives have substantially longer closure durations compared to singleton plosives.
Spectrogram and waveform of /baɾaɳi/ ‘ceramic pot’, illustrating /b/ without aspiration (Frequency range: 0-5000 Hz).

Mappila Malayalam lacks the voiceless palatalised velar plosive, reported to be present in other varieties such as Standard Malayalam (Asher & Kumari Reference Asher and Kumari1997) and Namboodiri Malayalam (Namboodiripad & Garellek Reference Namboodiripad and Garellek2017). For example, in MM, the medial /k/ is characterised by the absence of palatalisation in words such as [iɾəkːə] ‘sit-IMP’ and [kaɭikːaːn] ‘to play’, in contrast to SM forms such as [iɾikʲuː] ‘sit-IMP’, where the medial /k/ is palatalised (Asher & Kumari Reference Asher and Kumari1997). Figure 3 illustrates this absence of palatalisation of /k/ in the word /kaɭikːaːn/ ‘to play’. In the spectrogram, this is reflected in the lack of a raised F2 transition or other fronting effects at the onset of the following vowel. Instead, the F2 transition into /aː/ remains relatively low and gradual, a pattern consistent with a plain (non-palatalised) velar stop.
Spectrogram and waveform of /kaɭikːaːn/ ‘to play’, illustrating the absence of palatalisation of /k/ (Frequency range: 0-5000 Hz).

Similar to other South Asian languages, the voiced retroflex stop /ɖ/ can be realised as flapped intervocalically, as in words like /koɖa/ > [koɽa] ‘umbrella’. However, in nasal-stop clusters, as in [kanɖə] ‘saw’, /ɖ/ is realised as a stop. Similar to other varieties of Malayalam, MM also has the voiceless alveolo-palatal affricate, e.g., /tɕ/ in /tɕeɾa/ ‘coconut scraper’. Figure 4 shows the spectrogram and waveform of /tɕeɾa/ ‘coconut scraper’, illustrating the presence of the voiceless alveolo-palatal affricate /tɕ/.
Spectrogram and waveform of /tɕeɾa/ ‘coconut scraper’, illustrating voiceless alveolo-palatal affricate /tɕ/ (Frequency range: 0-5000 Hz).

Fricatives
Mappila Malayalam has four fricatives in its consonant inventory, including the voiceless labiodental fricative /f/. Notably, words containing /f/ in MM often correspond to words with the voiceless aspirated bilabial plosive /pʰ/ in SM. For example, MM /falam/ ‘result’ corresponds to SM /pʰalam/. Additionally, in MM loanwords, the voiceless bilabial plosive /p/ is therefore sometimes realised as /f/, as seen in [pard̪ah] ∼ [fard̪aː] ‘dress code of a Muslim woman’ (from Persian purdah) and [peːntə] ∼ [feːntə] ‘pant’ (from English pant).
Figure 5 shows the LPC spectra of MM fricatives generated using Praat’s (Boersma & Weenink Reference Boersma and Weenink2024) Burg LPC method. Each spectrum is based on a 40 ms analysis window centred at the midpoint of the fricative. The spectra reveal differing distributions of spectral energy among the fricatives /f/, /s/, /ɕ/, and /h/. In particular, /f/ and /h/ exhibit lower overall spectral energy compared to /s/ and /ɕ/, with /h/ showing the least defined spectral peaks, highlighting their distinct acoustic characteristics.
FFT magnitude spectra of MM fricatives (/f/, /s/, /ɕ/, and /h/) extracted from a 40-ms window centred at the temporal midpoint of each fricative.

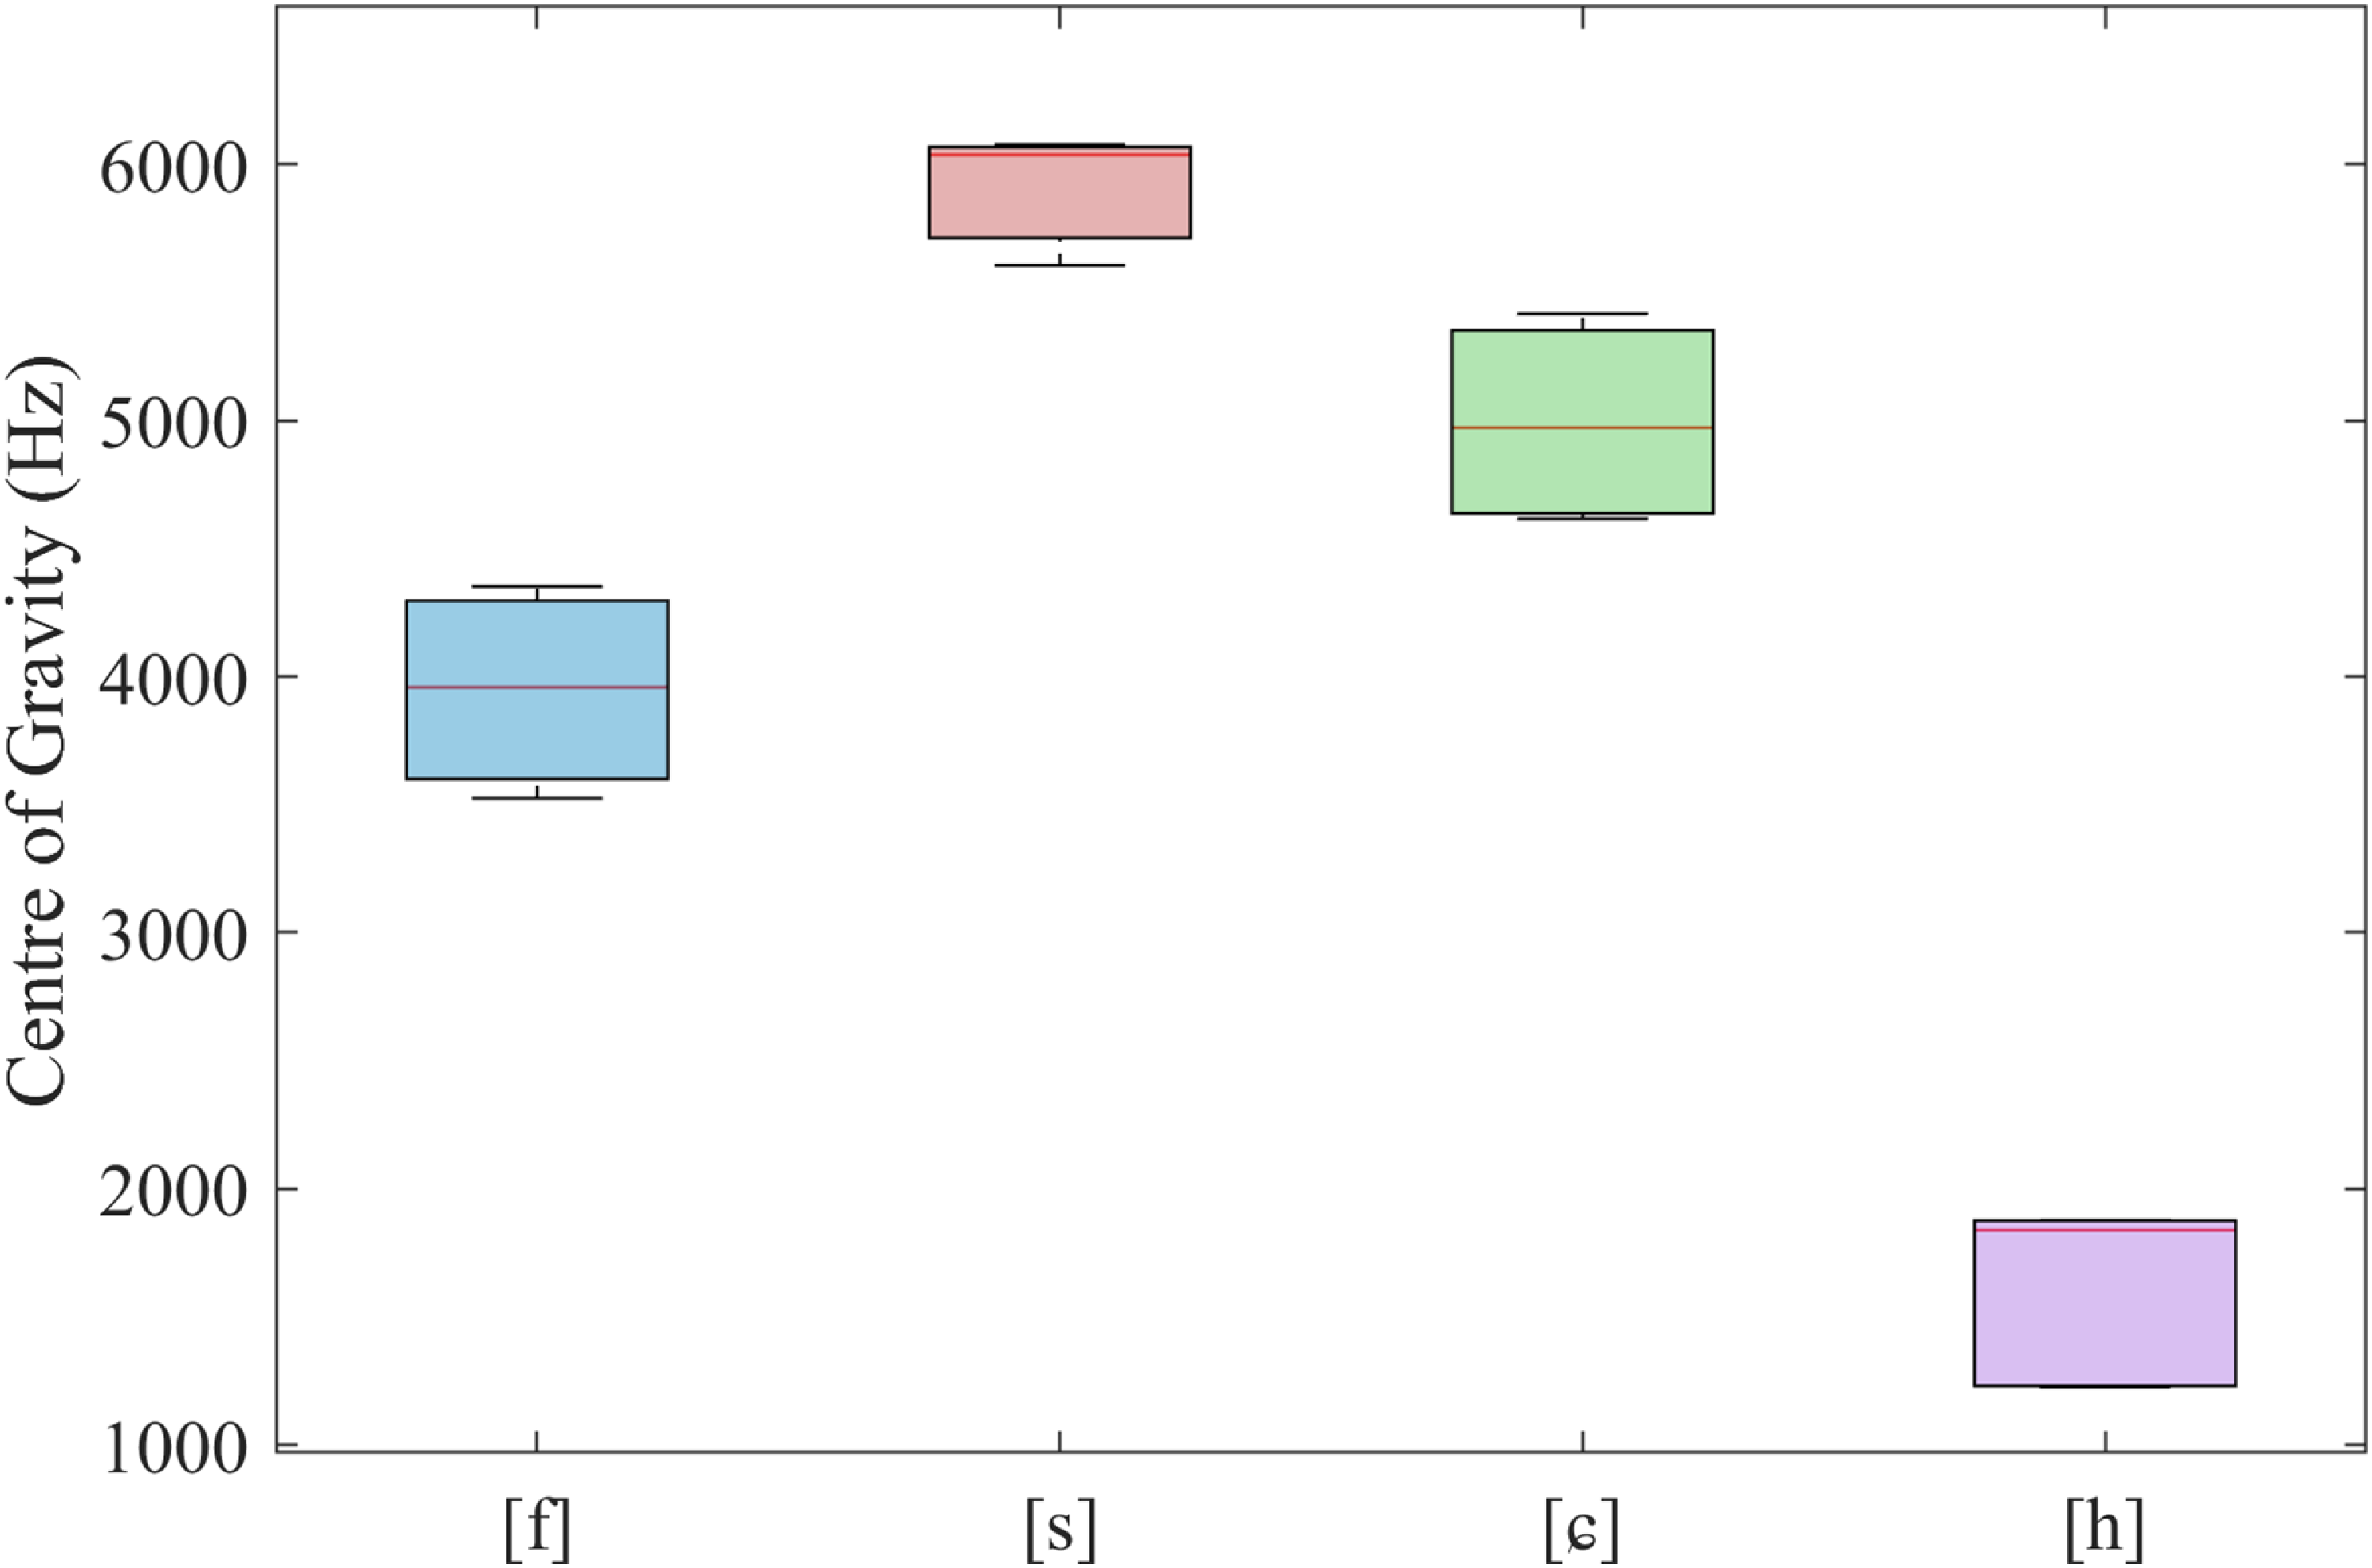
Comparison of fricatives in MM on mean values of CoG (Number of tokens: /ɕ/ = 4, /f/ = 3, /s/ = 4, /h/ = 5).

Figure 6 presents a comparison of the mean Centre of Gravity (CoG) values obtained for each fricative. The CoG was calculated manually in Praat, using a Hann band-pass filter with a frequency range from 500 Hz to 10000 Hz and a smoothing bandwidth of 100 Hz. The CoG values show clear distinctions among the four fricatives. The fricative /s/ consistently has the highest values, ranging from ∼5600 Hz to ∼6077 Hz, indicating its high-frequency spectral energy. This is followed by /ɕ/, which also exhibits relatively high CoG values, ranging from ∼4617 Hz to ∼5417 Hz, though slightly lower than /s/. The fricative /f/ shows CoG values ranging from ∼3525 Hz to ∼4352 Hz. The fricative /h/ has the lowest CoG values, ranging from ∼1226 Hz to ∼1877 Hz, suggesting it is acoustically less intense in the higher frequencies.
In MM, there is no distinction between the voiceless alveolo-palatal fricative /ɕ/ and the voiceless retroflex fricative /ʂ/ found in other varieties of Malayalam. The fricatives in /maɕi/ (SM /maʂi/) ‘ink’, /paɕa/ (SM /paʂa/) ‘glue’ are produced as /ɕ/ in MM (Cheerangote Reference Cheerangote2017). In this study, /ɕ/ in /meːɕa/ ‘table’ and /ɕ/ in /ʋeːɕam/ (SM /ʋeːʂam/) ‘attire’ are found to be produced as /ɕ/ (CoG = 5238 Hz in /meːɕa/ and CoG = 5187 Hz in /ʋeːɕam/). Figure 7 shows the spectrogram and waveform of /ɕ/ in /meːɕa/ ‘table’ and /ɕ/ in /ʋeːɕam/ produced as /ɕ/. However, Asher & Kumari (Reference Asher and Kumari1997) describe the latter as an alveolo-palatal fricative /ɕ/ and report that /ɕ/ and /ʃ/ are in free variation in Standard Malayalam, while Namboodiripad & Garellek (Reference Namboodiripad and Garellek2017) report that in the Namboodiri dialect this fricative is realised as /ɕ/.
Spectrogram and waveform of /ʂ/ as in /ʋeːʂam/ ‘attire’ produced as [ɕ] and /ɕ/ in /meːɕa/ ‘table’ produced as [ɕ] (Frequency range: 0-5000 Hz).

Nasals
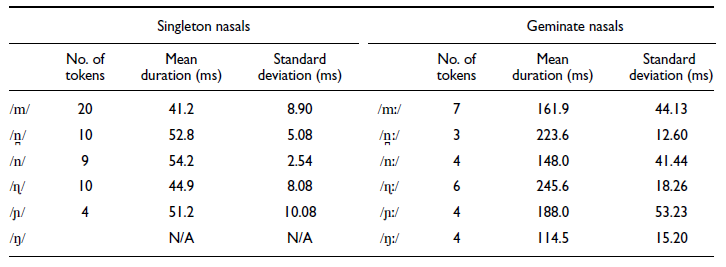
The nasals in Mappila Malayalam contrast at six places of articulation. Five of the nasals have singleton and geminate forms, while the velar nasal is observed to have only the geminate form. The singleton and geminate nasals differ in the duration of constriction. Table 3 presents the mean durations and standard deviations of singleton and geminate nasals in milliseconds, along with the number of tokens analysed for each. Across all nasal types, geminate nasals are significantly longer than their singleton counterparts, showing a clear durational contrast between the two forms.
The mean duration and standard deviation of the nasals

Table 3. Long description
A table comparing the mean duration and standard deviation of singleton and geminate nasals. The table has two main sections: Singleton nasals and Geminate nasals. Each section includes columns for the number of tokens, mean duration in milliseconds, and standard deviation in milliseconds. Row 1: m, 20, 41.2, 8.90, m, 7, 161.9, 44.13. Row 2: n, 10, 52.8, 5.08, n, 3, 223.6, 12.60. Row 3: n, 9, 54.2, 2.54, n, 4, 148.0, 41.44. Row 4: 10, 10, 44.9, 8.08, 10, 6, 245.6, 18.26. Row 5: p, 4, 51.2, 10.08, p, 4, 188.0, 53.23. Row 6: N/A, N/A, N/A, N/A, n, 4, 114.5, 15.20.
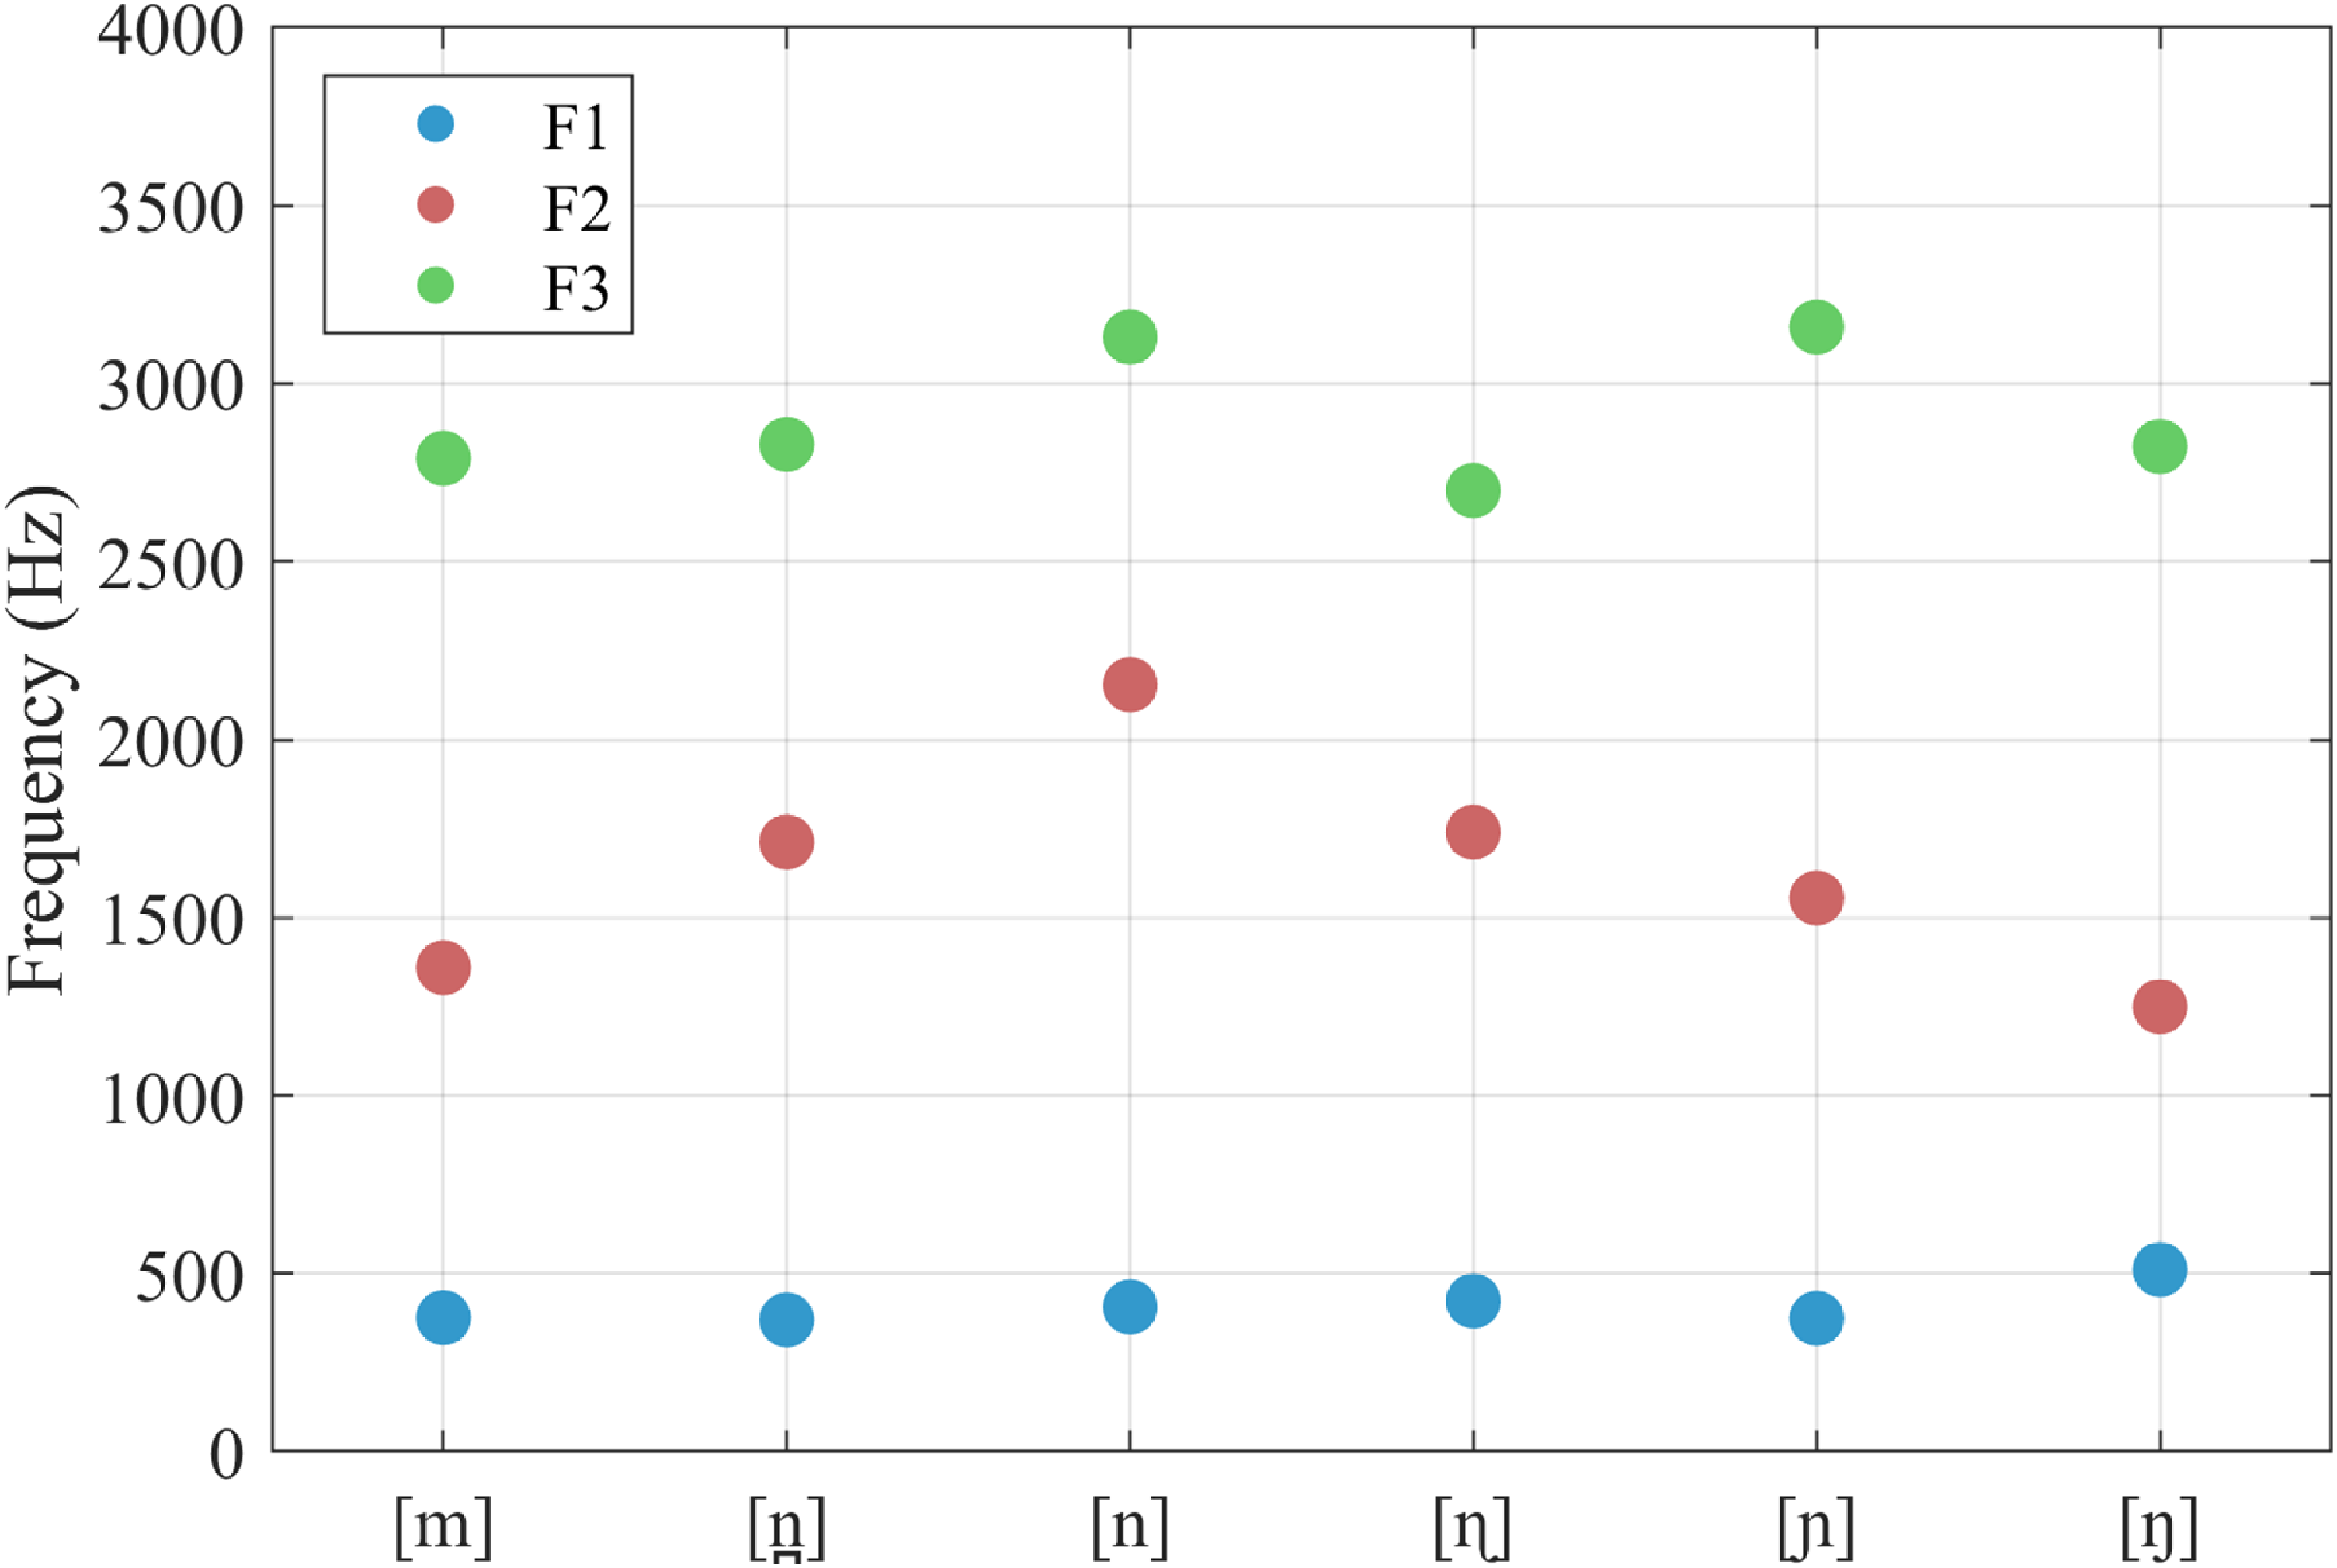
Unlike other varieties of Malayalam, MM does not have the palatalised velar nasal /ŋʲ/ in words like /t̪eːŋːa/ ‘coconut’, /muɾiŋːa/ ‘a leafy vegetable’. In the word initial position of certain lexical items, the voiced dental nasal /n̪/ is used instead of palatal nasal /ɲ/ in MM, for example, [ɲaɾambə] ∼ [n̪aɾambə] ‘vein’, [ɲaːrajtɕːa] ∼ [n̪aːrajtɕːa] ‘sunday’. Figure 8 represents the mean formant frequencies (F1, F2, and F3) of nasals from a single speaker. Formants were measured manually in Praat using the Burg LPC method. A window length of 25 ms was used, and the maximum formant frequency was set to 5500 Hz, suitable for a female speaker. Measurements were taken at the temporal midpoint of each nasal segment to minimise transitional effects. The F1 of the nasals seems to slightly increase as the place of the articulation moves backwards, while the F2 of front nasals is relatively higher than the back nasals, and the retroflexed nasal has the lowest F3.
Comparative formant frequencies (F1, F2, and F3) of nasals in MM (Total tokens 30, five tokens for each nasal sound).

Liquids
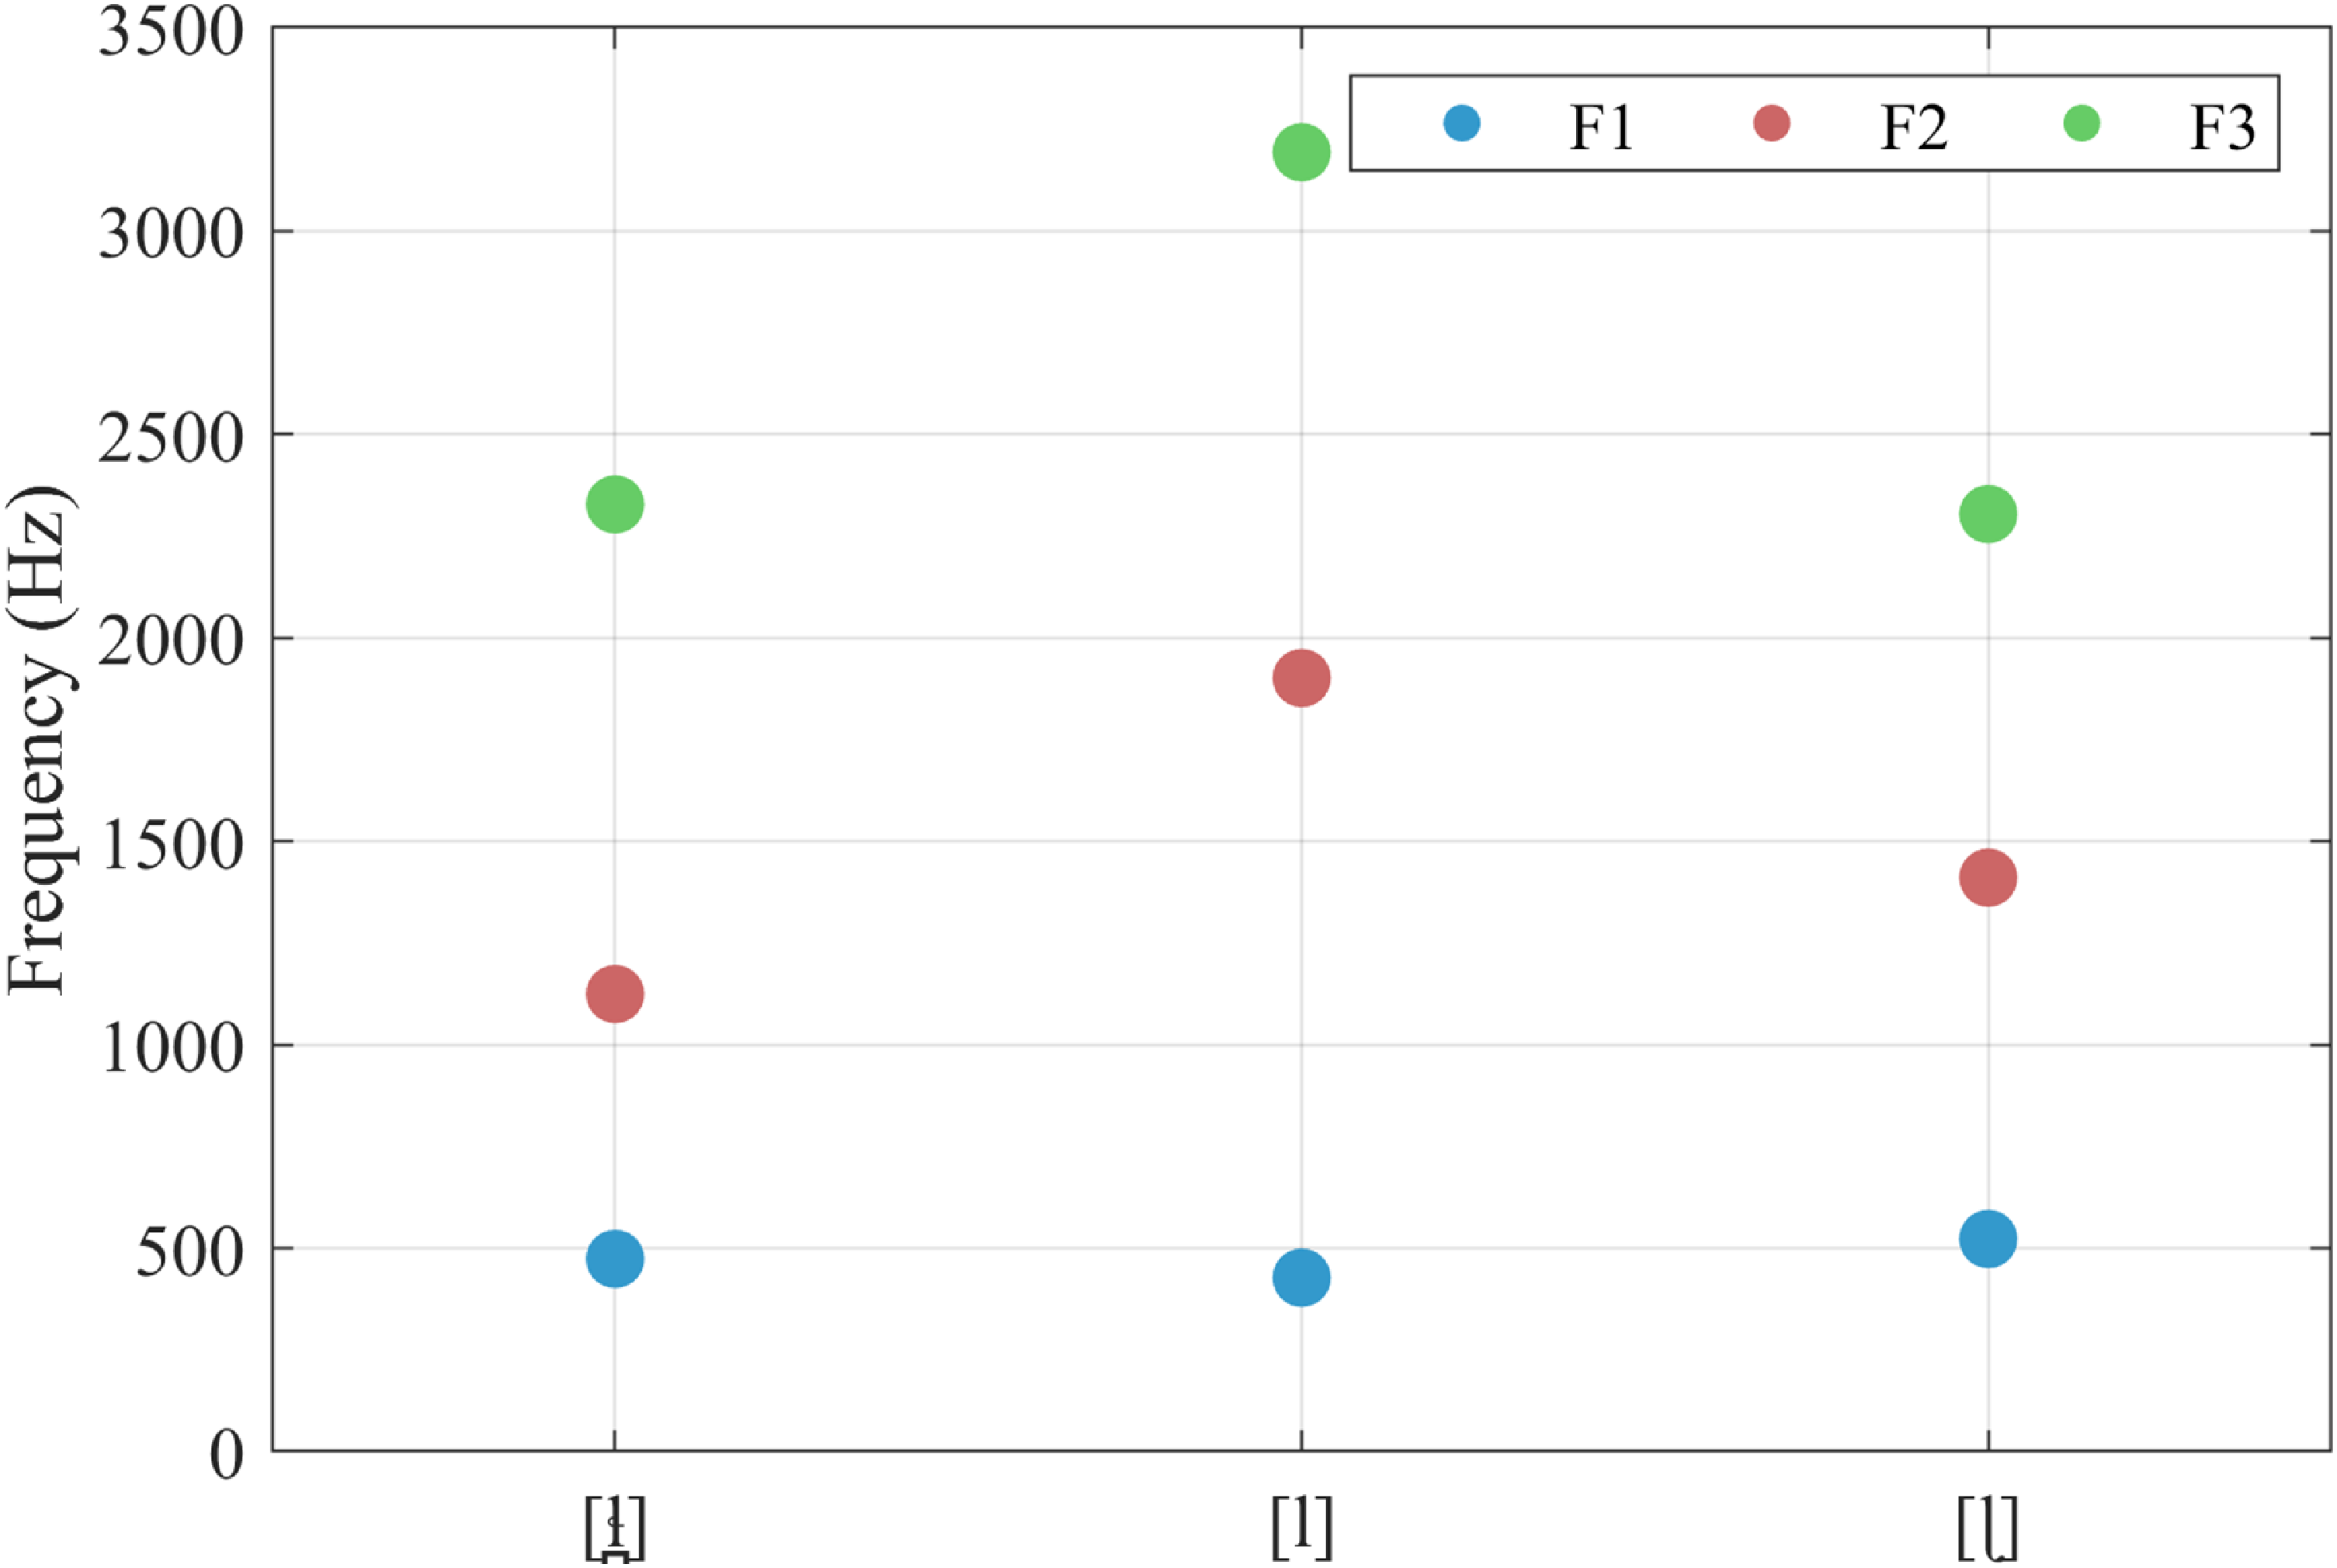
Mappila Malayalam has five liquid consonants: two rhotics, a voiced apico-alveolar tap as in /t̪aɾi/ ‘dust’, and a voiced apico-alveolar trill as in /muri/ ‘wound’; and three laterals, a voiced apico-alveolar lateral as in /ʋala/ ‘net’, a voiced retroflex lateral as in /ʋaɭa/ ‘bangle’, and a velarised denti-alveolar lateral. This third lateral is absent in Standard Malayalam, and it can be attributed to the religion of the community and the influence of Arabic, as /l̪ˠ/ is found in words related to Islam and its religious practices, as in [al̪ˠːaːhu] ‘god’ and [ʋul̪ˠuːə] ‘ablution’. The formant frequencies of laterals produced in an /a_a/ context revealed clear distinctions among alveolar [l], retroflex [ɭ], and velarised dental [l̪ˠ] segments (Figure 9). Similar to Punnoose (Reference Punnoose2011), alveolar [l] displayed the lowest F1 and the highest F2 and F3 formant frequencies, consistent with a relatively fronted and clear articulation. Retroflex [ɭ], in contrast, showed higher F1 and lower F2 and F3 values, reflecting a retracted tongue posture and a larger front cavity. The [l̪ˠ] was patterned similarly to the retroflex lateral, with a raised F1 and lowered F2 and F3, indicating a darker articulation.
F1, F2, and F3 formant frequencies for lateral consonants in MM (Total tokens = 13, seven for /l/, three for /ɭ/, and three for /l̪ˠ/).

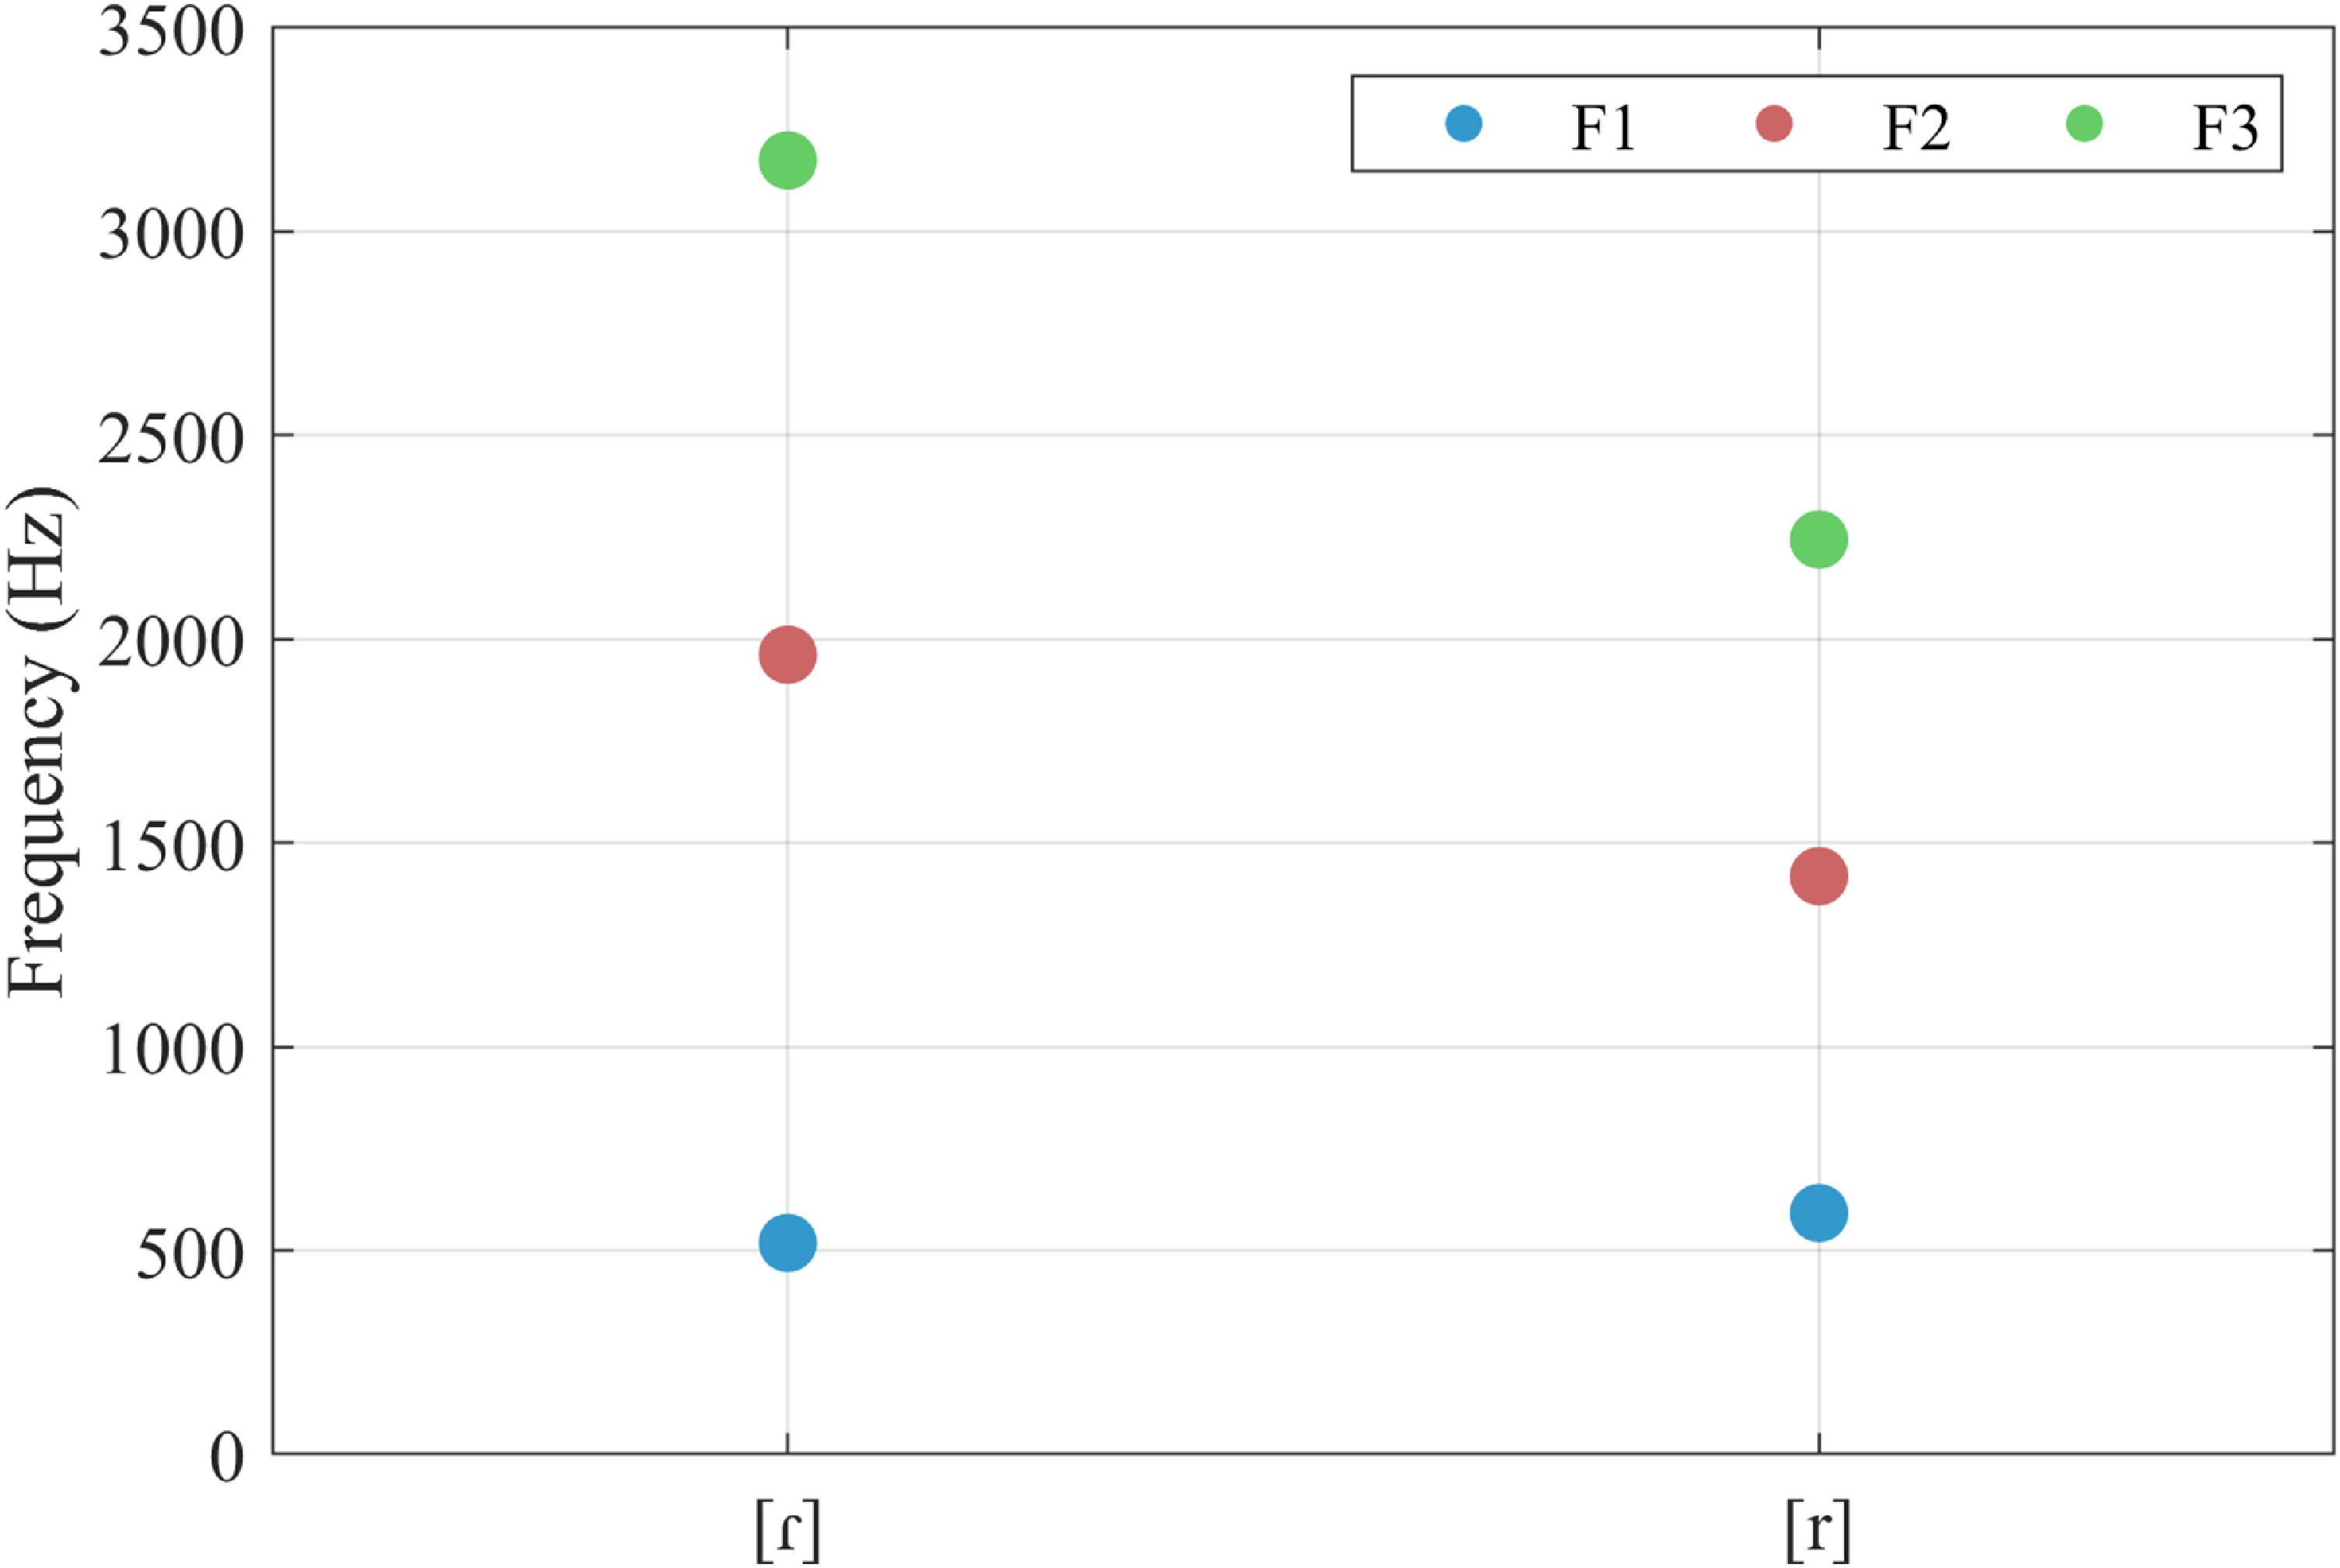
F1, F2, and F3 formant frequencies for rhotic consonants in MM (Total tokens = 12, six tokens for each rhotic sound).

Similarly, the formant frequencies of rhotics produced in an /a_a/ context (Figure 10) show that tap [ɾ] has lower F1 and higher F2 and F3 compared to trill [r], indicating a clearer and more fronted articulation. As argued in Punnoose (Reference Punnoose2011), the lower F1 of taps may suggest a smaller jaw opening and a more forward oral constriction, while the higher F2 reflects a raised tongue body contributing to a clearer resonance quality. The higher F3 further supports a relatively front place of articulation. In contrast, trills exhibited higher F1 along with lower F2 and F3 values, which can be interpreted as resulting from a slightly more open vocal tract and a retracted tongue posture, producing a darker resonance. Figure 11 shows the comparison of spectrograms of [r] and [ɾ] in MM. Also, as observed in Punnoose (Reference Punnoose2011) and Namboodiripad & Garellek (Reference Namboodiripad and Garellek2017), trills in MM are sometimes phonetically realised as taps.
Spectrogram and waveform comparison of the tap in [aɾa] ‘half’ and the trill in [ara] ‘room’ (Frequency range: 0-5000 Hz).

Spectrogram and waveform of /maja/, which corresponds to SM /maɻa/ (Frequency range: 0-5000 Hz).

Similar to Standard Malayalam (Punnoose Reference Punnoose2011), duration is not a significant correlate for distinguishing taps and trills in MM, as it ranges from 12 ms to 30 ms for taps and 15 to 25 ms for trills. However, rhotics in MM are shorter in duration than the corresponding rhotics in Standard Malayalam (Punnoose Reference Punnoose2011).
The so-called ‘fifth liquid’ of SM and other varieties of Malayalam (Punnoose Reference Punnoose2011)—the voiced postalveolar rhotic approximant /ɻ/)—is absent in the data collected. It is, however, variably used by young speakers in the community as a possible outcome of a minority variety assimilating to the dominant one (Thesni & Punnoose Reference Thesni, Punnoose, Skarnitzl and Volín2023). Nevertheless, the use of [j] instead of [ɻ] is one of the salient markers of the variety (Thesni & Punnoose Reference Thesni, Punnoose, Skarnitzl and Volín2023). In MM, the voiced palatal approximant /j/ is used as in /maja/ (SM /maɻa/) ‘rain’ and /pajam/ (SM /paɻam/) ‘banana’. Figure 12 shows the spectrogram and waveform of /maja/. However, Jayaraj (Reference Jayaraj2017) and Thesni & Punnoose (Reference Thesni, Punnoose, Skarnitzl and Volín2023) report evidence of the younger generation using the /ɻ/ variant. Moreover, the geminate /jː/ frequently undergoes fortition and becomes a voiced palatal stop /ɟː/. This is seen in [kajːə] > [kaɟːə] ‘hand’ and [n̪ejːə] > [n̪eɟːə] ‘ghee’. Figure 13 shows the spectrogram and waveform of [kajːə] ‘hand’, produced as [kaɟːə] by the MM speaker.
Spectrogram and waveform of /kajːə/ ‘hand’, produced as [kaɟːə] by MM speaker (the geminated approximant is replaced by geminated plosive, slightly affricated) (Frequency range: 0-5000 Hz).

Approximants
Mappila Malayalam has two approximants: /j/ and /ʋ/. The palatal approximant /j/ is predominantly found in word-initial position, such as in [jaːt̪ra] ‘travel’, and in word-medial position in certain words like [kajarə] ‘rope’. The /j/ also occurs in the word-medial position in MM, often corresponding to /ɻ/ in SM. In MM, /ʋ/ often alternates with /m/ or /b/ depending on the phonetic context. For instance, the SM form /ʋeːɳɖa/ ‘don’t’ can also be realised as [maːɳɖa] in MM. In other cases, /ʋ/ alternates with /b/, especially in fast or informal speech, as seen in [ʋaːpːa] ∼ [baːpːa] ‘father’, [ʋat̪ːakːa] ∼ [bat̪ːakːa] ‘watermelon’, and [ʋimaːnam] ∼ [bimaːnam] ‘aeroplane’. These patterns suggest that /ʋ/ is often realised as [m] when followed by a long vowel and a nasal, but is realised as [b] when followed by a short vowel, regardless of whether a nasal follows.
Vowels


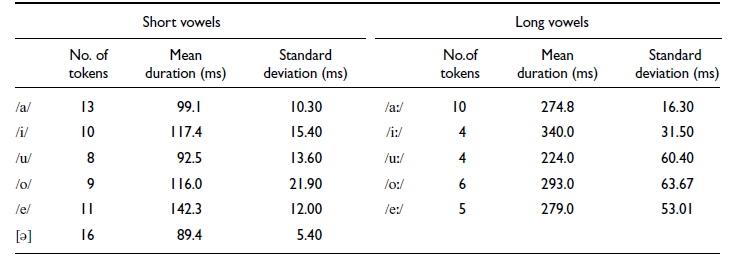
Similar to Standard Malayalam, Mappila Malayalam has five short and five long vowels: close front unrounded /i/, mid front unrounded /e/, open vowel with a neutral lip position /a/, mid back rounded /o/, and close back rounded /u/, as shown in the vowel chart above. Our data show that long vowels occur before both singleton and geminate consonants in MM. However, geminate consonants following long vowels are often voiceless, while singleton consonants following long vowels are typically voiced. The mean duration and the standard deviation of the vowels in MM are given below in Table 4. The vowel [ə] is also included in Table 4, for reasons which will be described below.
The mean duration and standard deviation of the vowels

Table 4. Long description
A table comparing the mean duration and standard deviation of short and long vowels. The table has two main sections: Short vowels and Long vowels. Each section lists the number of tokens, mean duration in milliseconds, and standard deviation in milliseconds for each vowel. Short vowels include a, i, u, o, e, and [] with their respective data. Long vowels include a, i, u, o, and e with their respective data. For example, the short vowel a has 13 tokens, a mean duration of 99.1 ms, and a standard deviation of 10.30 ms, while the long vowel a has 10 tokens, a mean duration of 274.8 ms, and a standard deviation of 16.30 ms.
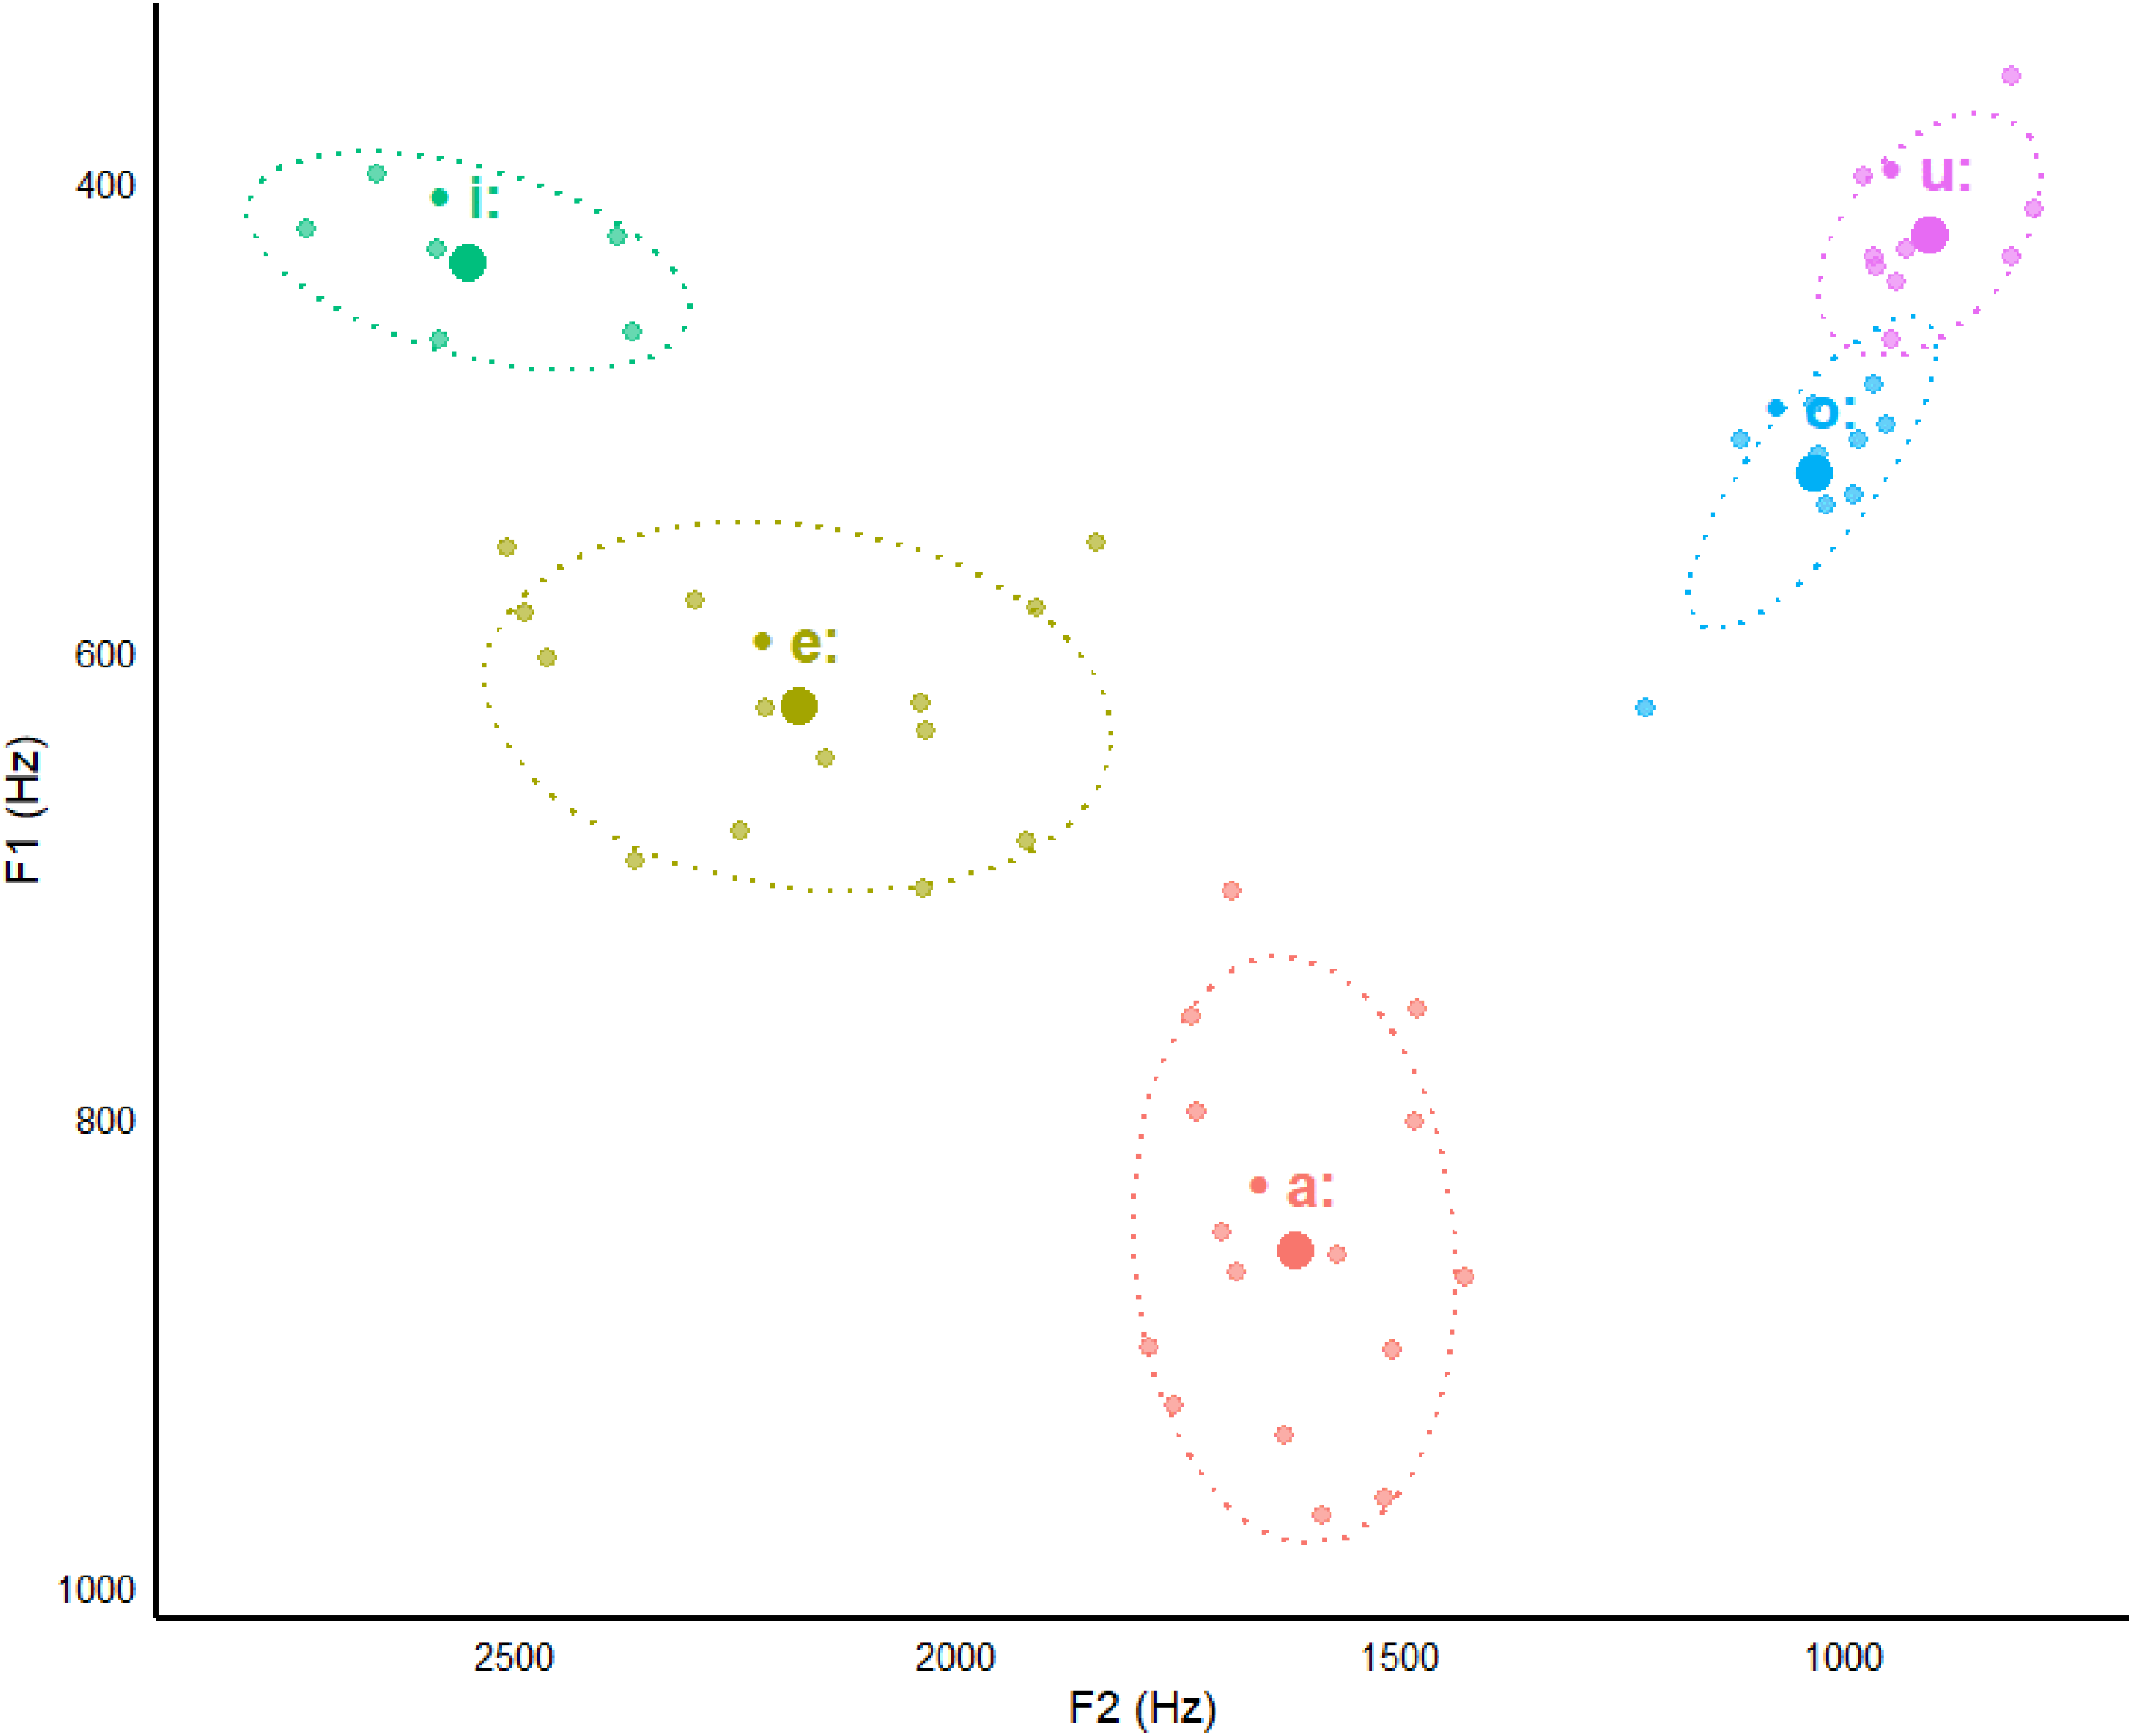
Short vowels in unstressed syllables can be phonetically reduced to [ə] in MM. The formant values of the vowels were extracted manually at the average midpoint of each vowel segment. R (R Core Team 2024) was used to process the data and plot the vowel charts. Figures 14 and 15 show the F1 and F2 values for short and long vowels, respectively. The ellipses represent 95% confidence intervals, illustrating the distributional spread of each vowel category in the vowel space. The mean formant values of long /aː/ (M=856.6, SD=79.98) and /eː/ (M=624.4, SD=50.81) have higher F1 values than their short counterparts /a/ (M=776.0, SD=98.53) and /e/ (M=554.0, SD=76.12), suggesting a lower tongue position, while long /oː/ (M=524.6, SD=41.00) and /uː/ (M=422.7, SD=31.97) show lower F1 values than /o/ (M=612.0, SD=61.23) and /u/ (M=434.2, SD=52.25), indicating a higher articulation. In addition, the F2 values for /oː/ (M=1033.8, SD=85.99) and /uː/ (M=901.4, SD=77.01) suggest they are more back than /o/ (M=1173.7, SD=128.05) and /u/ (M=1041.8, SD=124.49).
Acoustic vowel space of MM showing F1 and F2 values of short vowels.

Acoustic vowel space of MM showing F1 and F2 values of long vowels.

The realisation of /e/ and /eː/ varies from the typical unrounded mid-front vowel quality in some speakers in lexical items such as [keʈːə] ‘to tie’ and [keːʈːə] ‘to hear’. In these instances, the vowels may resemble a centralised or reduced vowel quality, approximating [ø] or [øː], rather than the expected [e] or [eː]. The schwa in MM is often realised as more fronted than the canonical [ə], particularly when it occurs in utterance-final or word-final positions, as observed in the examples given above. This fronted shwa contrasts with the more central realisation observed in forms like [ʋərət̪ːi] ‘cleanliness’.
MM exhibits systematic vowel variation in commonly used words. As illustrated in the examples below, speakers frequently used /e/ or /o/ in contexts where SM has /u/, and /a/ in contexts where SM has /e/. Similar vowel variations have been anecdotally reported and informally observed in other non-standard and spoken varieties of Malayalam as well; however, these patterns have not previously been subjected to formal analysis.

MM does not permit tautosyllabic consonant clusters. In contexts where SM has such clusters (e.g., /pl/ or /pr/), MM shows a medial [i] vowel before the liquid. This could reflect a retention of an older, more conservative form, as argued by Kala (Reference Kala1977) for other Malayalam varieties. In MM, the vowel is also observed to affect the quality of the following liquid, as shown in the examples below. While MM does allow heterosyllabic clusters, such as the nasal-stop sequence in [kaɳɖə] ‘saw’ or the liquid-stop in [sorɡam] ‘heaven’, these do not violate the initial cluster constraint.

Similarly, where SM has word-medial clusters like /pr/, /kr/, /sr/, MM has /a/ appearing before the liquid. This causes gemination of the preceding consonant (mostly plosives) in words of non-Arabic origin, as shown in the examples below.

In MM, schwa insertion occurs in both Sanskrit-origin and Arabic-origin loanwords, as shown below. These Arabic loanwords are not found in the vowel inventory of other Malayalam varieties.
-
a. In Sanskrit-origin loan words, for exampleː

-
b. In Arabic loanwords, for example;

[ə] in MM also occurs in initial position in some English loanwords, as in the word /skuːl/ ‘school’, which becomes [əskuːɭə] and /skruː/ ‘screw’ is often produced as [əskuːrə] in MM. Similar to SM, [ə] also occurs as a non-phonemic inserted vowel (which in Malayalam descriptions is often called an ‘enunciative vowel’) word-finally in the following contexts (Valentine Reference Valentine1976; Cyran Reference Cyran2001).
-
a. It occurs after all plosives, fricatives, /ŋ/, /ɲ/, and /ʋ/, and
-
b. Optionally after /m/, /n/, /ɳ/, /l/, /ɭ/, /r/, /ɾ/ and /j/
Diphthongs

In Mappila Malayalam, diphthongs are formed as combinations of mid/low vowels (/o/, /e/, /a/) and high vowels (/i/, /u/). There are four diphthongs as listed below.

The first three diphthongs, /ai/, /ei/ and /au/ are reported to be present in Standard Malayalam (Asher & Kumari Reference Asher and Kumari1997) and in the Namboodiri dialect of Malayalam (Namboodiripad & Garellek Reference Namboodiripad and Garellek2017), but /ou/ is unique to MM. Here, /ei/ is formed as a result of the deletion of the voiced palatal approximant /j/, which is also there in the orthographic representation (യ). Similarly, /au/ and /ou/ are formed as a result of the deletion of the rhotic approximant /ɻ/ (ഴ).
Stress
The canonical syllable structure of Mappila Malayalam is (C)V(C). The phonology of MM prohibits tautosyllabic consonant clusters in any word position (refer to the discussion on vowels). This could be a consequence of strong Arabic influence on this variety of Malayalam, since Arabic does not permit word-initial consonant clusters. The preference for a (C)V(C) syllabic structure could have interesting consequences for how stress is realised in MM.
There is no agreement in the limited literature on Malayalam prosody whether there is word stress in the language (Mohanan Reference Mohanan1986, and based on this, Asher & Kumari Reference Asher and Kumari1997), or not (Krishnamurti Reference Krishnamurti2003). Nevertheless, most of the limited literature on stress in Malayalam tends to lean towards Mohanan’s (Reference Mohanan1986) position on the matter. He points out that there are no differences between stressed and stressless syllables in terms of amplitude. He further argues that Malayalam has vowel reduction both in terms of changes in vowel quality and reduction in duration, and in extreme cases the vowel gets deleted. According to Mohanan, this process of vowel reduction can be explained by the concept of stress (Mohanan Reference Mohanan1986). The prominence of primary and secondary stress is relative, which in a polysyllabic word depends on its position in the word and the length of the vowel (Mohanan Reference Mohanan1986). The pattern appears to be similar in MM as well. If a word has a short vowel in the first syllable and a long vowel in the second syllable, then the primary stress will be on the second syllable (e.g., [kaˈtɕːoːɖəm] ‘marketing’). If the word does not have a long vowel, then the primary stress is likely to be on the first syllable, and the rest of the vowels in the word could be reduced or deleted in fast speech (e.g., /maɾaɳam/: [ˈmaɾaɳam] ∼ [ˈmaɾnəm] ‘death’, /kaːɾaɳam/: [ˈkaːɾaɳam] ∼ [ˈkaːɾnəm] ‘reason’).
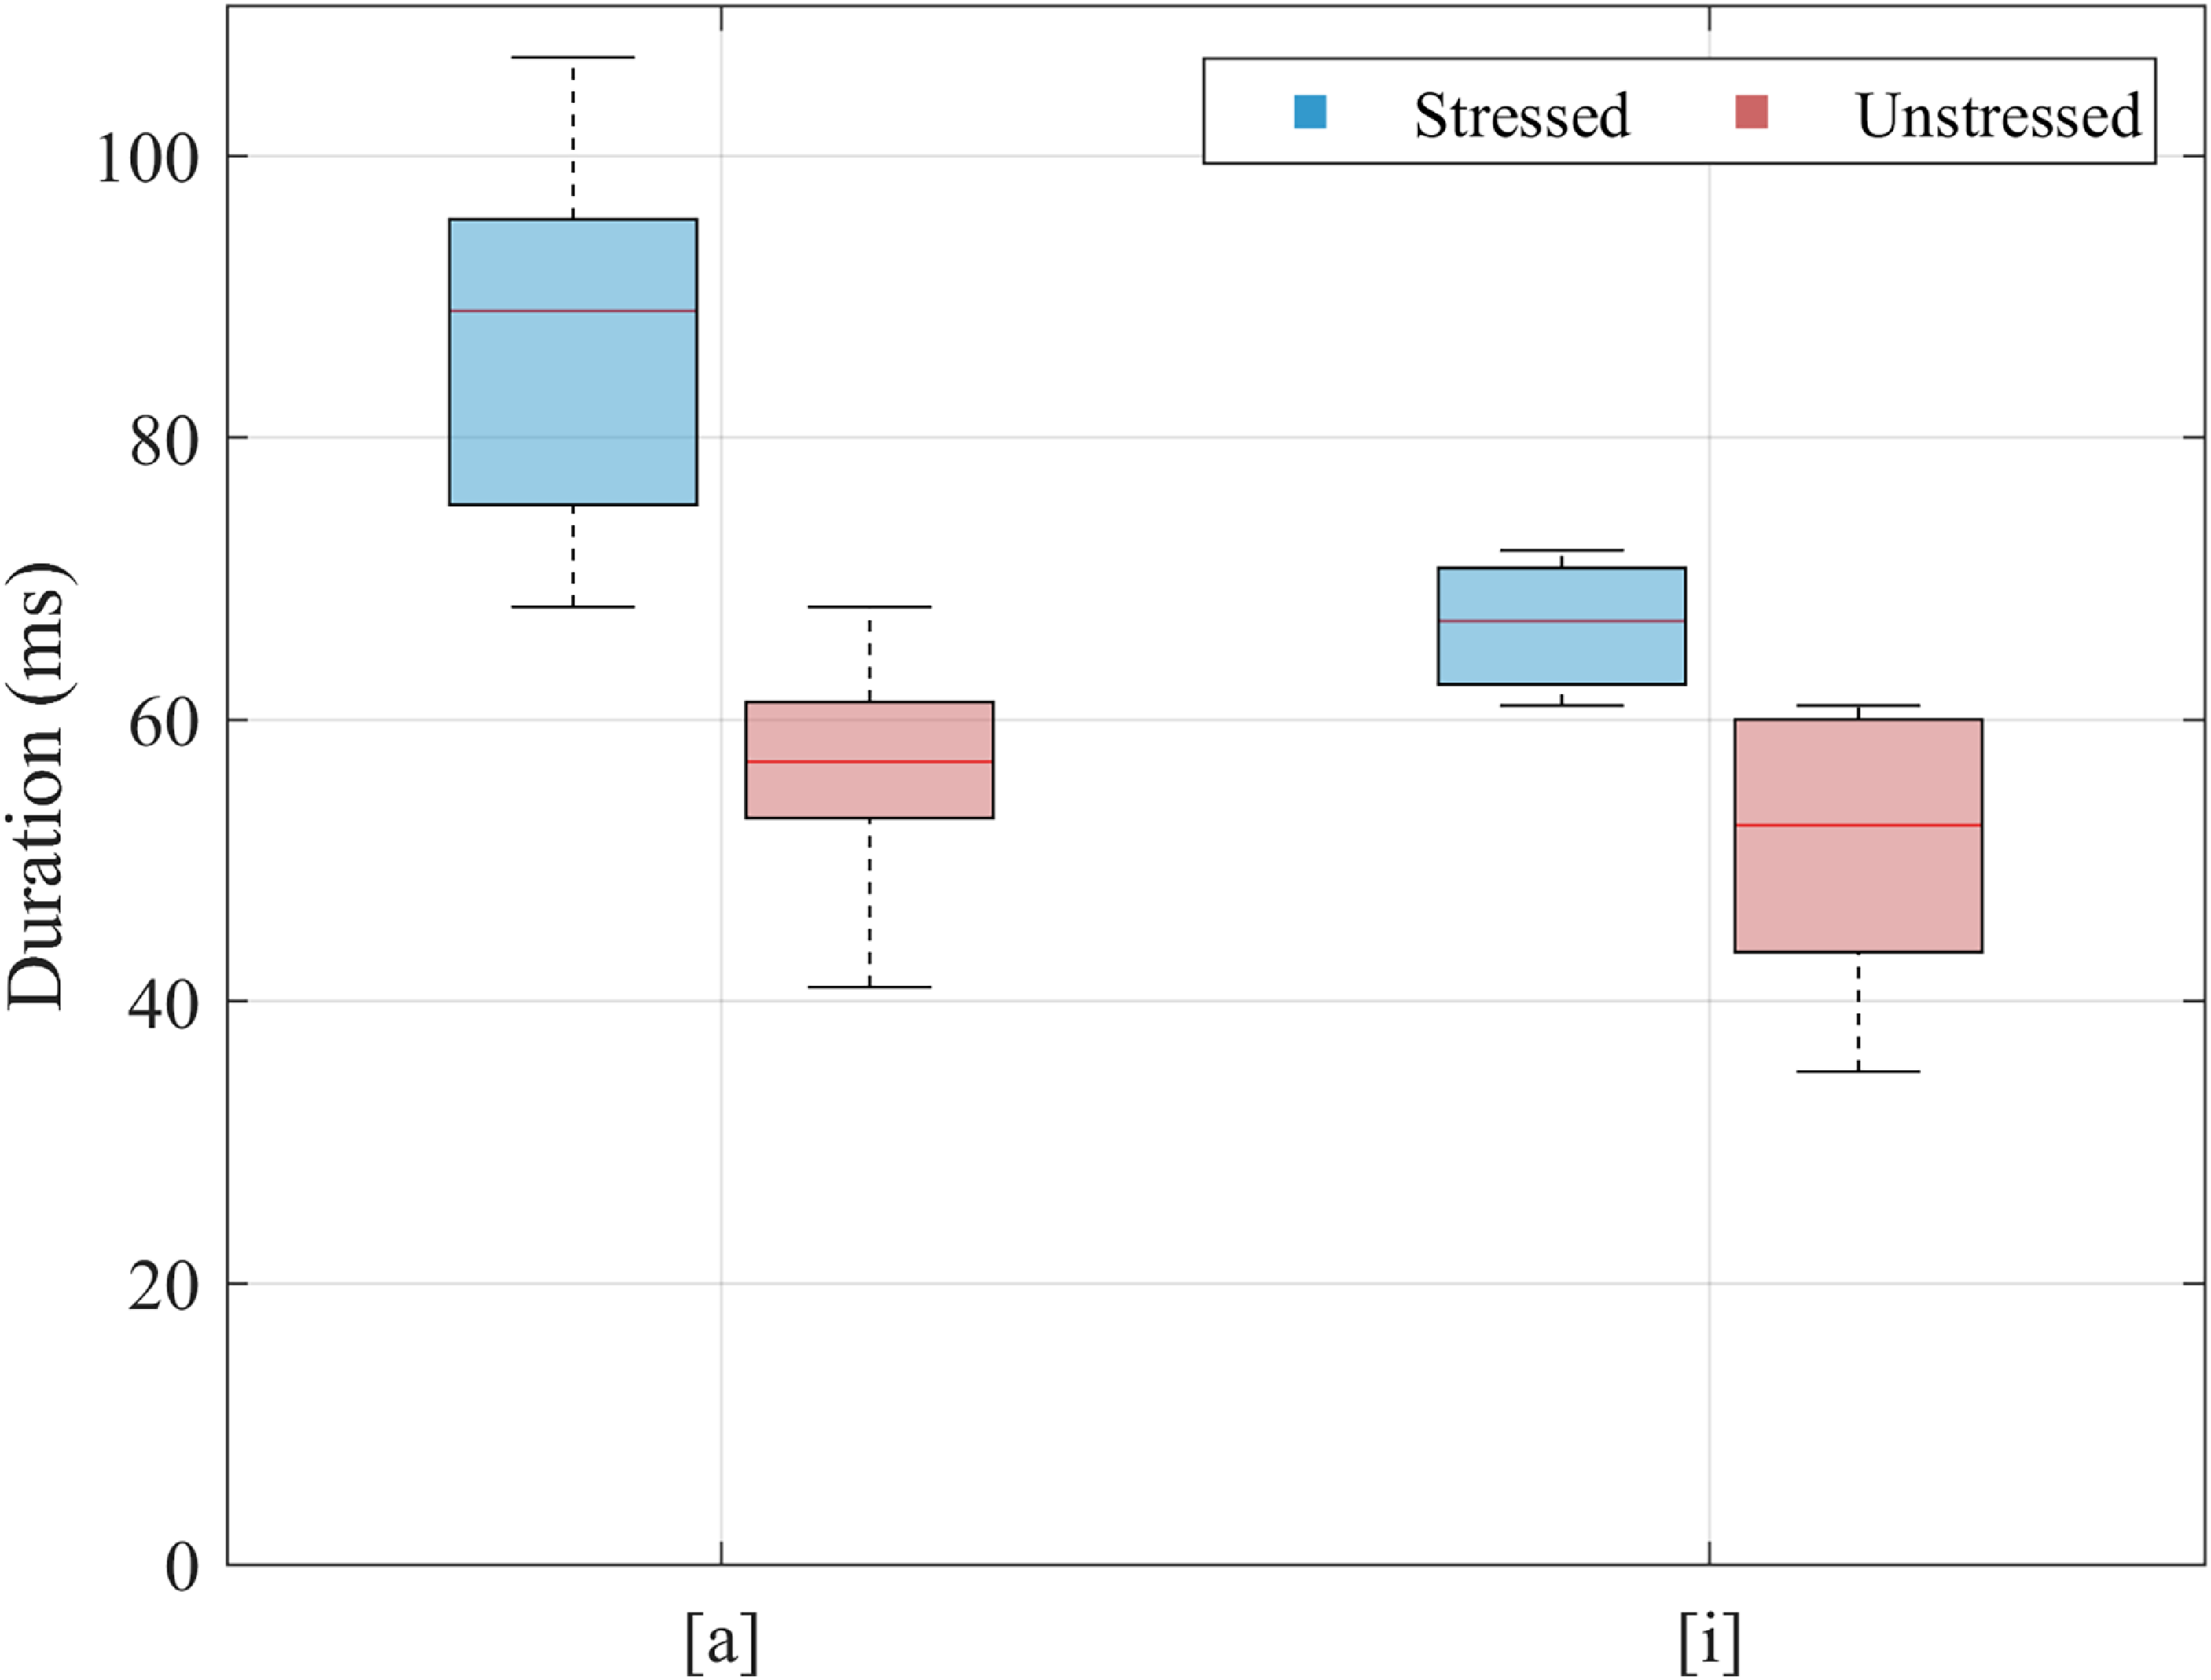
Vowel reduction, both in terms of weakening in vowel quality (mostly via centralisation to [ə]) and reduction in vowel duration, is also observed in MM. The duration of short vowels /a/ and /i/ in stressed and unstressed positions in connected speech (reading passage) is given in Figure 16. In the data set of this study, /u/ and /o/ were observed only in the stressed position, i.e., in the first syllable, and /e/ was observed only in the unstressed position.
Duration of /a/ and /i/ vowels in stressed and unstressed syllables in MM (Number of tokens = 48).

Transcription

Orthographic version (Malayalam)
സൂര്യനും വടക്കൻ കാറ്റും തമ്മില് ഏറ്റവും ശക്തിയാര്ക്കാന്ന് വാദിക്കെയ്നി. ആ സമയത്ത് ഭൂമീല്ഒരു ഉസ്താദ് മേത്ത് പൊതപ്പ് ചുറ്റി നടക്ക്ണ്ടയ്നി. അപ്പൊ സൂര്യൻ പറഞ്: “ഏ. വടക്കൻ കാറ്റേ, ഞമ്മക്ക് ഇപ്പത്തന്നെ കണ്ടെത്താ ആര്ക്കാ ഏറ്റോം കൂട്തൽ ശക്തിള്ളത്ന്ന്. ആ നടക്ക്ണ ആളെ മേത്ത് ചുറ്റിയ പൊതപ്പ് ആർക്കാണോ മാറ്റാങ്കയ്യ, അയാളാണ് ഏറ്റവും ശക്തിമാൻ”. കാറ്റ് അയ്ന് പറ്റണത്ര ശക്തീലൂതി. കാറ്റ്ൻറെ ശക്തി കൂട്യപ്പം, ഉസ്താദ് പൊതപ്പ് ഒന്നുങ്കുടി മുർക്കി ചുറ്റി. കൊറച്ച് കയിഞ്ഞപ്പം കാറ്റിന് ഊതി ഊതി മട്ത്ത്. പിന്നെ സൂര്യന്റെ അവസരയ്നി. വെയിൽന്റെ ചൂട് സഹിക്കാൻ പറ്റാതായപ്പം ഉസ്താദ് പൊതപ്പ് മാറ്റി. അങ്ങനെ സൂര്യൻ ഓന്റെ ശക്തി തെളീച്ച്.
Orthographic version (Arabi-Malayalam)









 Open access



