1 Introduction
Catalan is unusual among Romance languages in that it allows the formation of a large number of consonant clusters across a word boundary. This is so since word-final vowels were deleted for the most part in Old Catalan. The present paper investigates by means of electropalatography (EPG) and acoustical analysis two major issues regarding articulatory adaptation in Catalan clusters composed of heterorganic consonants produced with independent articulatory structures which may overlap in time, i.e. the lips and the tongue as well as the tongue front and the tongue dorsum. Since the articulatory structures for heterorganic consonant sequences are activated independently of each other to a large extent (i.e. the tongue tip and the tongue blade do not intervene in velar stop formation and apical or laminal consonants involve little or no back dorsum activation), the degree to which consonants undergo assimilation in the sequences in question is open to a relatively variable behaviour. This investigation complements previous work on articulatory adaptation in consonant sequences made up of consonants realized with the same or nearby tongue front regions, i.e. tip, blade and predorsum, and thus homorganic or quasi-homorganic, where the two consecutive consonants often affect one another when their primary articulators are activated (Recasens & Pallarès Reference Recasens and Pallarès2001).
A first research goal of the present study (see Section 1.1) is to investigate the extent to which the word-final cluster consonant (C1) assimilates in place of articulation to the following word-initial consonant (C2) in Catalan C1##C2 sequences. (The symbol ## is inserted at the boundary between two consecutive words; see Chomsky & Halle Reference Chomsky and Halle1968, Byrd & Choi Reference Byrd, Choi, Fougeron, Kühnert, D’Imperio and Vallée2010). For that purpose, we will analyze whether place assimilations are obligatory or optional: obligatory assimilations apply systematically, i.e. essentially without exception, while optional assimilations take place more or less often but not all the time, depending on factors such as speaker, speech rate, prosodic condition and lexical item (Heselwood, Howard & Ranjous Reference Heselwood, Howard, Ranjous, Hassan and Heselwood2011, Kochetov & Colantoni Reference Kochetov and Colantoni2011). Another goal of the study is to investigate whether place adaptation operates categorically or gradiently: categorical assimilations occur when the closure or constriction location for C1 adapts fully to that of C2 all throughout, as for example when the outcome [pp] of /tp/ shows the same closure location as [pp] derived from /pp/ and no trace of the /t/ lingual gesture; on the other hand, partial assimilations result in the presence of a C1 gestural residue, as when the alveolar consonant in the cluster /tk/ exhibits an imperfect alveolar closure and/or some contact fronting at the sides of the alveolar and palatal zones (Kühnert & Hoole Reference Kühnert and Hoole2004), as well as perceptually ambiguous acoustic cues which are intermediate between those for the unassimilated and fully assimilated articulatory outcomes (Nolan Reference Nolan, Docherty and Ladd1992, Dilley & Pitt Reference Dilley and Pitt2007).
Descriptive studies on Catalan phonology indicate that stops and nasals articulated with the tongue front, i.e. the dental /t/ and the alveolar /n/, assimilate optionally in place of articulation to a following labial or velar consonant across a word boundary (Recasens Reference Recasens1993, Bonet & Lloret Reference Bonet and Lloret1998, Wheeler Reference Wheeler2005). Dorsals and labials do not undergo regressive place assimilation. Thus, for example, in sequences like set pobres ‘seven poor fellows’ and set cases ‘seven houses’, the clusters /tp/ and /tk/ may stay unassimilated ([tp tk]) in slower speech or undergo assimilation ([pp kk]) at faster speech rates. Likewise, in principle, /nb/ may be realized as [nb] or [mb] (són bons ‘they are good’) and /nk/ as [nk] or [ŋk] (són cars ‘they are expensive’). The present study explores the extent to which place assimilation operates on both C1 = /t/ and C1 = /n/ in C1##C2 sequences with a labial C2 (/p b m/) or a velar C2 (/k ɡ/), and how the degree of intersegmental adaptation is affected by the segmental composition of the cluster as well as by stress condition (i.e. by whether the consonant cluster exhibits higher or lower levels of sentence stress) and word type (i.e. by whether the target consonant belongs to a frequent or function vs. content word).
A second research goal (see Section 1.2) is to analyze the conditions under which regressive manner assimilations apply in Catalan C##C sequences with an oral stop C1 and, in particular, whether, as pointed out by the above descriptive studies, C1 = /p t k/ assimilate optionally in nasality to C2 = /m n/ (the velar nasal does not appear word-initially in Catalan) and C1 = /t/ assimilates optionally in laterality to C2 = /l ʎ/. If so, for example, /pm/ would be realized as [bm mm] (tap maco ‘nice cork’) and /tl/ as [dl ll] (set làmines ‘seven plates’). In conjunction with those manner assimilations and as revealed by the examples given so far, it should be stated that in Catalan word-final obstruents assimilate obligatorily in voicing to a following word-initial consonant and are thus realized as voiced or voiceless depending on whether C2 is voiced or voiceless, respectively. In parallel to the analysis of place assimilations, the effect of sentence stress and word type on manner assimilations will also be investigated.
The present paper also provides tentative production-based explanations for the major place and manner assimilatory patterns occurring in the Catalan database (Sections 1.1 and 1.2). The main claim behind these explanations is that the seed for the misidentification of a given phoneme by another one in assimilatory processes, e.g. of /t/ by /p/ in the realization [pp] of the cluster /tp/, does not seem to lie in the general notion ‘ease of articulation’ but in the specific articulatory and aerodynamic mechanisms involved in the production of the two adjacent consonants in the cluster. It has been claimed that it must be ‘easier’ to produce assimilated than unassimilated consonant sequences since the former involve a reduction of the distance that the articulators must travel from the articulatory target of the first consonant to that of the second consonant (Lindblom Reference Lindblom and Macneilage1981, Reference Lindblom, Hardcastle and Marchal1989). While this is a reasonable working hypothesis, a satisfactory definition of terms such as ‘ease of articulation’ or ‘articulatory effort’ does not seem feasible given the amount of articulatory, prosodic and non-linguistic dimensions involved in segmental assimilatory phenomena. Thus, as pointed out by Ohala (Reference Ohala1990), it could also be claimed that holding the articulators for a long time in the assimilated realization [pp] of /tp/ requires more, not less effort than producing the unassimilated realization [tp], and that the fact that assimilatory processes in CC sequences proceed typically backwards is more efforful than having speakers to replace C2 by C1 by keeping the C1 phonetic characteristics until the end of the cluster.
Within this framework, we will look into whether C1-to-C2 assimilation is most prone to operate when C1 becomes especially reduced and C2 becomes most prominent in terms of articulatory displacement and segmental duration by virtue of the place and manner characteristics for the two consonants and the stress and lexical conditions available. In these circumstances, reduced C1 realizations are implemented through acoustic cues of little salience which may be easily overridden by the more salient cues of the following consonant at the perceptual level since the speaker makes little effort to safeguard their articulation (Ohala Reference Ohala1990, Ohala & Ohala Reference Ohala, Ohala, Huffman and Krakow1993, Jun Reference Jun1995, Byrd Reference Byrd1996). Moreover, production-based explanations will be sought for the role of homorganicity, i.e. the identity between the primary articulator and closure or constriction location for C1 and C2 (Laver Reference Laver, Aronoff and Rees-Miller2003), in facilitating manner assimilations.
1.1 Place assimilation
1.1.1 Nature of assimilation
Production data on English and German C1##C2 sequences composed of the alveolars /t n/ followed by a velar or a labial stop reveal that the frequency of occurrence of regressive place assimilations operates in a highly variable fashion and that their outcome may be complete or partial (English: Barry Reference Barry1985, Reference Barry1992; Wright & Kerswill Reference Wright and Kerswill1989; Nolan Reference Nolan, Docherty and Ladd1992; Hardcastle Reference Hardcastle and Lewis1994; Ellis & Hardcastle Reference Ellis, Hardcastle, Ohala, Hasegawa, Ohala, Granville and Bailey1999, Reference Ellis and Hardcastle2002; Stephenson & Harrington Reference Stephenson and Harrington2002; German: Kühnert Reference Kühnert1993, Kühnert & Hoole Reference Kühnert and Hoole2004, Bergmann Reference Bergmann, Hoole, Bombien, Pouplier, Mooshammer and Kühnert2012). In contrast with the English and German scenario, articulatory data for Italian clusters reveal that /n/ assimilates systematically or very often to a following velar or labial stop independently of factors such as stress position, the C2 voicing status, and whether the two cluster consonants belong to the same or different words (Farnetani & Busà Reference Farnetani and Busà1994, Calamai & Ricci Reference Calamai, Ricci, Recasens, Sánchez Miret and Wireback2010, Celata et al. Reference Celata, Calamai, Ricci and Bertini2013). Spanish behaves like Italian in that /n/ lacks consistently an active tongue tip gesture when appearing before a labial or a velar whether the two consonants are placed word-internally or across a word boundary (Castilian Spanish: Honorof Reference Honorof1999; Argentinian Spanish, as well as Cuban Spanish where /n/ is realized as [ŋ] word-finally: Kochetov & Colantoni Reference Kochetov and Colantoni2011). Instances of a residual C1 gesture involving some alveolar contact turned out to occur only occasionally in those two languages. Japanese but not Australian English shows an analogous behavior to Italian and Spanish (Stephenson & Harrington Reference Stephenson and Harrington2002): when asked to blend the consonants /n/ and /ɡ/ of two separate words, Japanese subjects assimilated /nɡ/ into [ŋɡ] as inferred from the absence of contact fronting and of duration differences between this blended outcome and the realization of the control sequence /ŋɡ/; Australian English speakers, on the other hand, differed among themselves regarding the extent to which /n/ shifted to [ŋ] before /ɡ/, and could produce the assimilated cluster with a longer duration than the control sequence.
It is hard to see why specific dialects and languages favor place assimilations rather than others. One conditioning factor may be the number of C1##C2 combinations allowed by a given language such that the lower their number the higher the probability that regressive place assimilation applies. A related factor may be the presence of phonotactic rules prohibiting heterorganic clusters word-internally as in Japanese, or allowing them as in English where /n/ may stay alveolar before bilabial, labiodental and velar consonants (input, unprepared; infrequent; engage, sunglasses, incapable). Since Catalan exhibits a richer inventory of C1##C2 combinations than Italian, Spanish and Japanese, regressive place assimilations are expected to apply less frequently in the former language than in the three latter ones. On the other hand, if the determinant factor are the lexical phonotactic rules of the language, place assimilations could operate quite systematically in Catalan since this language disallows heterorganic consonant clusters word-internally at least when a nasal C1 is taken into consideration (i.e. [mp] omplir ‘to fill’, [ŋk] encara ‘still’, [ŋk] incapaç ‘incapable’).
In addition to exploring whether regressive place assimilations apply systematically or not and in line with results from previous findings in the literature, the present paper will analyze the extent to which assimilatory processes are categorical or gradient. For this purpose, we will check if assimilated consonant sequences and the corresponding controls, as for example the realization [pp] of /tp/ and /pp/, show the same articulatory characteristics or not. If assimilation is not complete, assimilated /t##C n##C/ clusters ought to leave some articulatory trace of the front lingual C1 gesture. In addition, assimilated realizations of clusters composed of C1 = /t n/ and C2 = /k ɡ/ could exhibit less dorsopalatal contact than the corresponding controls /kk ɡɡ/ since the production of dentals and alveolars involves less tongue dorsum raising towards the hard palate than that of dorsovelars.
1.1.2 Segmental factors
The frequency of application of place assimilation processes will be analyzed as a function of differences in C1 and C2. The trend for place assimilation to operate on clusters with C1 = /t n/ in Catalan appears to be part of a universal pattern according to which regressive place assimilations apply to front lingual consonants rather than to labials and dorsals (Jun Reference Jun, Hayes, Kirchner and Steriade2004, Zimmerer, Reetz & Lahiri Reference Zimmerer, Reetz and Lahiri2009). This pattern is consistent with production data showing that dentals and alveolars undergo gestural overlap (i.e. the activity of the primary articulator for these consonants is superimposed over that for other phonetic segments) more often than labials and velars presumably since the tongue front is a faster and more flexible articulator than the lips and the tongue dorsum (Browman & Goldstein Reference Browman and Goldstein1991a, Byrd Reference Byrd1996). A less salient realization of C1 in these circumstances may account for why the short and rapid burst and vowel transitions for /t/ and /n/ may cease to be properly identified, which may lead to consonant assimilation or deletion.
The extent to which regressive place assimilation applies to /t n/ also depends on the C1 manner requirements. Data from the literature show that only /n/ undergoes regressive place assimilation in Hindi and Malayalam (Jun Reference Jun, Hayes, Kirchner and Steriade2004), and that among languages where both /t/ and /n/ are assimilation targets /n/ assimilates to a labial or velar stop more often than /t/ (German: Jaeger & Hoole Reference Jaeger, Hoole, Trouvain and Barry2007; see, however, Barry Reference Barry1985 for the stop and the nasal exhibiting similar degrees of place assimilation in English). In the light of this typological scenario, the present paper will test whether /n/ assimilates more often than /t/ to following labial or velar consonants in Catalan. Moreover, articulatory data on unassimilated realizations of /t/ and /n/ will be presented in support of a production-based explanation for this expected finding, namely, that the alveolar nasal is more prone to undergo closure reduction and tongue dorsum overlap than /t/ since its production requires a lower intraoral pressure level and the generation of a burst of little prominence (Ladefoged & Maddieson Reference Ladefoged and Maddieson1996). This approach complements the view that syllable-final nasals assimilate to a greater extent than oral stops because they lack a salient burst and exhibit a low intensity nasal murmur and less salient formant transitions (Ohala Reference Ohala1990, Jun Reference Jun, Hayes, Kirchner and Steriade2004).
There is also evidence in the literature in support of the notion that the frequency of occurrence of regressive assimilations depends on the C2 place of articulation. Data from the world's languages show a preference for place assimilations to operate before velars over labials and before consonants of these two places of articulation over dentals and alveolars, which is in line with velars and less so labials involving more extensive and slower gestures than dentals and alveolars; in line with this articulation-based account, it has been argued that C2-dependent differences in regressive assimilation occur because the acoustic VC transitions are more affected the more the C2 gesture overlaps with C1 (Jun Reference Jun, Hayes, Kirchner and Steriade2004). The present study will verify whether this prediction holds for regressive place assimilation in Catalan clusters across a word boundary by looking at the effect of the labials /p b m/ vs. the dorsovelars /k ɡ/ on preceding /t/ and /n/.
The C2 voicing status (i.e. whether C2 is voiceless or voiced) could also play a role in the degree to which /t, n/ assimilate to the following consonant. It has been hypothesized that place assimilations should be triggered by gestural overlap and, therefore, that /t/ and /n/ ought to assimilate to voiceless /p/ and /k/ rather than to their voiced cognates /b/ and /ɡ/ (Browman & Goldstein Reference Browman, Goldstein, Mattingly and Studdert-Kennedy1991b, Son, Kochetov & Pouplier Reference Son, Kochetov, Pouplier, Cole and Hualde2007). Voiceless stops are expected to overlap with C1 to a larger extent than voiced stops since the production of the former involves more prominent articulatory gestures, a higher intraoral pressure level and more salient bursts than the production of the latter (Kohler Reference Kohler1984, Farnetani Reference Farnetani, Hardcastle and Marchal1990). An alternative hypothesis is that regressive place assimilation should not depend so much on gestural overlap as on C1 gestural reduction in duration and magnitude whenever the triggering stop C2 is voiced rather than voiceless (Jun Reference Jun1995). The possibility that regressive assimilation depends strongly on C1 gestural reduction is supported by experimental findings showing that gestural reduction of labial /p/ gives rise to perceptual assimilation before /k/ in Korean (Jun Reference Jun1995), and also that perceptual assimilation is positively related to degree of articulatory reduction in final alveolars in English clusters (Nolan Reference Nolan, Docherty and Ladd1992). The validity of these two options may be explored for Catalan in line with the fact that, as pointed out above, syllable-final obstruents assimilate in voicing to the following syllable-initial consonant (e.g. /tp/ is realized as [tp] and /tb/ as [db] in this language, as in set portes ‘seven doors’ and set barres ‘seven bars’).
1.2 Manner assimilation
Manner assimilations in consonant clusters have not been paid much attention in the phonetics literature. Another research goal of the present investigation is to find out whether homorganicity facilitates the implementation of regressive manner assimilation processes. Regarding the consonant sequences under analysis in this paper, one would expect C1 to assimilate to C2 in the clusters /pm tn tl tʎ/ where the two consonants are homorganic rather than in the sequences /pn tm km kn/ where they are not. This hypothesis appears to be supported by sound changes involving manner assimilation in clusters composed of dental and alveolar consonants exclusively, such as /ld dl ln nl/ > [ll] and /rn nr rl lr/ > [rr] in several Romance languages and dialects (Tuscan [ˈspilla] from Latin SPIN(U)LA, Marchegiano [n ˈnume] ‘It. un lume’, Old Romanesco alla from Latin AL(I)NA; Rohlfs Reference Rohlfs1966: 340, 355), /nr lr/ > [rr ll] in Ponapean and /nl/ > [ll] in Korean (Zsiga Reference Zsiga, van Oostendorp, Ewen, Hume and Rice2011), and also /nl nr ts/ > [ll rr ss] in Arabic (Heselwood et al. Reference Heselwood, Howard, Ranjous, Hassan and Heselwood2011). A more specific prediction is that homorganicity ought to play a more relevant role in assimilations involving laterality in the sequences /tl tʎ/ than in those involving nasality in the clusters /pm tn/, the assumption being that, while the velum and tongue structures may move independently of each other, the formation of tongue openings for the passage of airflow through the sides of the oral cavity ought to be facilitated by C1 and C2 being produced at the same location with the same primary lingual articulator.
In looking for a confirmation of the homorganicity hypothesis, the present study will also investigate whether C1 and C2 are truly homorganic and, if so, how homorganicity is achieved in the clusters /tn tl tʎ/ subjected to regressive manner assimilation. For that purpose, the linguopalatal contact configurations for these three clusters will be compared with those for the single consonants /t l n ʎ/. Since all four consonants /t l n ʎ/ are articulated at a close front location in Catalan, i.e. /t/ is dental, /l n/ are front alveolar and /ʎ/ is alveolar or alveolopalatal, several adaptation mechanisms may hold in this respect. At least two adaptation mechanisms could apply, which have been also found to operate in productions of the similar clusters /nt lt ʎt ɲt ɲn nʎ/ (Recasens Reference Recasens, Goldstein, Whalen and Best2006, Reference Recasens2008): blending and assimilation. Blending occurs when neither of the two adjacent consonants prevails over the other, and may involve the addition of the closure area for the two consonants especially when one of them exhibits considerable tongue contact at closure location (e.g. while /t/ is dental and /ʎ/ is alveolopalatal, closure location for the cluster /tʎ/ may show full tongue contact extending from the teeth to the back of the alveolopalatal zone), or else closure formation at an intermediate location between the C1 and C2 closure sites (e.g. closure location for /tn/ could be more retracted than that for /t/ and more anterior than that for /n/). Place assimilation, on the other hand, involves a complete adaptation in closure location which in the case of the sequences /tn tl tʎ/ under study may be regressive whenever dental C1 becomes alveolar or alveolopalatal or progressive if C2 becomes dental.
The articulatory characteristics of C1 could also affect the implementation of regressive manner assimilation in sequences with /p t k/ followed by the nasals /m n/. In particular, we predict that /k/ ought to be less prone to become nasal than /p t/ since, in comparison to the more anterior labial and dental stops, velar stops may show a higher intraoral pressure level and stricter tongue body requirements which may prevent anticipatory velar lowering associated with the following nasal consonant from occurring (Westbury & Keating Reference Westbury and Keating1986). This issue will be explored by looking at several events which are directly related to those articulatory and aerodynamic characteristics. First, stop voicing in clusters with C2 = /m n/, which should be less for /k/ than for /p t/ in line with differences in back cavity size and degree of compliance of the vocal tract surface walls (Ohala Reference Ohala1997). Secondly, tongue front anticipation in the clusters /pn kn/, which ought to be less for the velar than for the labial since closure formation involves the tongue body for the former stop consonant but not for the latter.
1.3 Non-segmental factors
The paper will also investigate the extent to which place and manner assimilations are conditioned by stress and word frequency. As for the stress factor, data in the literature reveal that preconsonantal word-final /n/ may undergo assimilation more often if unstressed than if stressed presumably in line with differences in articulatory reduction and duration between phonetic segments occurring in the two stress conditions (Argentinian and Cuban Spanish: Kochetov & Colantoni Reference Kochetov and Colantoni2011; German: Bergmann Reference Bergmann, Hoole, Bombien, Pouplier, Mooshammer and Kühnert2012). Word frequency has also been shown to affect the frequency of occurrence of regressive place assimilations in alveolar + labial, velar consonant clusters: consonants assimilate more often in high frequency and function words than in low frequency and content words since they tend to be shorter and more reduced in lexical items of the former class than in those of the latter (Jaeger & Hoole Reference Jaeger, Hoole, Trouvain and Barry2007, Zimmerer et al. Reference Zimmerer, Reetz and Lahiri2009, Bergmann Reference Bergmann, Hoole, Bombien, Pouplier, Mooshammer and Kühnert2012).
Even though the present study does not investigate directly the role of speech rate, we will check whether speakers speaking faster assimilate more often than those speaking more slowly as also reported for alveolar + labial, velar clusters elsewhere (Italian: Calamai & Ricci Reference Calamai, Ricci, Recasens, Sánchez Miret and Wireback2010; English: Wright & Kerswill Reference Wright and Kerswill1989, Barry Reference Barry1992; German: Kühnert Reference Kühnert1993, Kühnert & Hoole Reference Kühnert and Hoole2004), and consistently with the finding that an increase in speaking rate causes greater gestural overlap between C1 and C2 and greater C1 shortening and articulatory reduction (Barry Reference Barry1992, Byrd & Tan Reference Byrd and Tan1996, Jun Reference Jun, Hayes, Kirchner and Steriade2004). Other studies, however, have failed to find an effect of speech rate on the frequency of place assimilations (see Honorof Reference Honorof1999 for Castilian Spanish /nC/ sequences) or on the degree of gestural overlap (Zsiga Reference Zsiga1994).
1.4 Summary
EPG and acoustic data on regressive assimilations will be analyzed for Catalan C1##C2 sequences composed of /t n/ followed by labials and velars (place assimilation), and of /p t k/ followed by nasals and of /t/ followed by laterals (manner assimilation). The predicted behavior is that the frequency of occurrence of place assimilations should vary with C1 in the progression /n/ > /t/ presumably because the nasal is more prone to undergo articulatory reduction and to overlap with C2 than the stop, and with C2 in the progression velars > labials since dorsal consonants are more prone to overlap with C1 than labials. The study will also explore whether place assimilatory processes are triggered by gestural overlap or by gestural reduction depending on whether they operate most frequently before voiceless or voiced stops, respectively. Instances of a residual C1 gesture will be identified by comparing the articulatory characteristics for assimilated clusters with those for the corresponding control sequences. Regressive manner assimilations, on the other hand, are predicted to occur preferably in homorganic consonant sequences and, most especially, in clusters with C1 = /t/ followed by a lateral, and in clusters with a non-dorsal C1 and C2 = /n/ for the same reasons that cause non-dorsal consonants rather than dorsal ones to undergo regressive voicing and gestural overlap. Place and manner assimilations are also expected to be favored by stress, lexical and speech rate conditions contributing to segmental reduction.
2 Method
2.1 Sentence list and recording procedure
Several C1##C2 combinations, where C1 occurs word-finally and C2 word-initially, were selected for the study of the regressive place and manner assimilation processes (see (a) and (b) below and sentences 1–51 in the appendix). Throughout the paper, word-final stops will be transcribed with the phonetic symbol for the voiceless cognate since obstruents devoice word-finally in Catalan and their underlying voicing status is of no concern to the present investigation. It should be noticed that the cluster /tm/ appears twice under (a) and (b) since it may adapt to C2 both in place and manner.
-
(a) Place assimilation
/t/ + /p b m k ɡ/
/n/ + /p b m k ɡ/
-
(b) Manner assimilation
/t/ + /m n l ʎ/
/p k/ + /m n/
In order to investigate the role of sentence stress and word type in the assimilation processes of interest, clusters were analyzed in the three stress/word conditions, listed here in (c), (d) and (e):
-
(c) SECST (‘secondary sentence stress, content word’). In sentences 1–17 of the appendix, C2 receives secondary sentence stress and C1 belongs to the lexically stressed syllable of a content word, as for /tp/ in un debat pobre i deslluït ‘a poor and dull debate’.
-
(d) PRST (‘primary sentence stress, content word’). In sentences 18–34, C2 receives primary sentence stress and C1 belongs to the lexically stressed syllable of a content word, as for /tp/ in the sentence aquell fou un debat pobre ‘that was a poor debate’.
-
(e) FREQ (‘primary sentence stress, frequent or function word’). In sentences 35–51, C2 receives primary sentence stress and C1 belongs to a frequent or function monosyllable, as for /tp/ in the sentence agafaren els set pals ‘they grasped the seven sticks’.
As shown in the appendix, clusters were embedded in seven to nine-syllable long sentences. Main sentence stress falls on the 7th or 8th syllable (which happens to be the last syllable bearing lexical stress), and secondary stress either on the 4th sentence syllable (SECST condition) or on the 2nd, 3rd or 4th syllables (PRST and FREQ conditions). The two vowels flanking the clusters are (mid) low and occasionally back rounded (only in the case of seven sentences with the frequent words sóc and un) so that variations in dorsopalatal contact degree occurring during C1 should be assigned not to the preceding contextual vowel but to C2 almost exclusively. The content words appearing in the sentence list are fairly common in Catalan except perhaps for catxap and gal which are not as frequent as the remaining lexical items though they happened to be well known by the subjects who read the sentence list. The frequent and function words appearing in the sentences 35–51 are set ‘seven’, sóc ‘(I) am’, un ‘a’ and cap ‘no one’.
In order to find out whether a trace of the C1 articulatory gesture was left in assimilated clusters, their articulatory realization was compared to that of consonant sequences which were identical underlyingly to the assimilated outcomes of the consonant combinations appearing under (a) and (b) above. These ‘control’ sequences (CTRL) appear in sentences 52–68 of the appendix, and are composed of either a long consonant (as for /pp/, sentence 52) or a two-consonant cluster (as for /mn/, sentence 62). Comparisons were carried out using the clusters conforming to the PRST condition in sentences 18–34 since these were the only consonant sequences occurring in the same prosodic and lexical conditions as the controls. The control sequences for the clusters /tp tb tm tn tl tʎ tk tɡ pm pn km kn np nb nm nk nɡ/ were, respectively, /pp pb mm nn ll ʎʎ kk kɡ mm mn/, [ŋm ŋn], /mp mb mm/, [ŋk ŋɡ] (clusters starting with a velar nasal are given in phonetic transcription since [ŋ] has no phonemic status in Catalan). Thus, for example, the control sequence for the cluster /tp/ in sentence 18 is the sequence /pp/ in sentence 52 since /tp/ may assimilate into [pp]. In order to obtain information about the articulatory characteristics of dental stops, recordings were also made of /tt/ and /td/ (sequences 54 and 55 in the appendix).
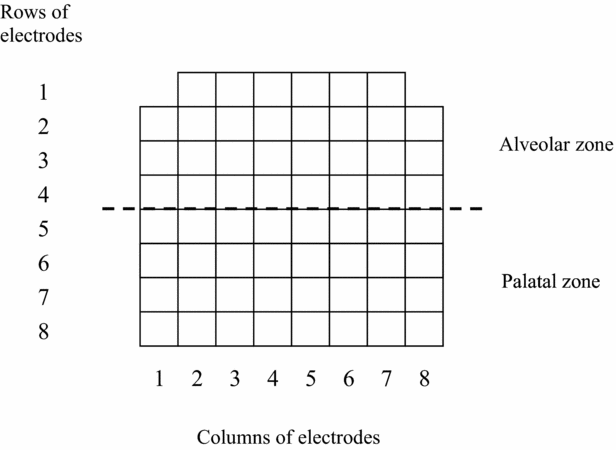
Three Eastern Catalan speakers (DR, the first paper author, JP and JC) read all 68 sentences in random order ten times each at their normal speech rate with the artificial palate in place. All three subjects use Catalan in their everyday life, and teach this language at the university or at the high school level. They recorded EPG and acoustic data simultaneously using the WinEPG system of Articulate Instruments. Linguopalatal contact configurations were gathered every 10 ms using about 1.5 mm thick wedge-shaped artificial palates equipped with 62 electrodes. Figure 1 shows the placement of the eight rows and eight columns of electrodes, and of the alveolar and palatal zones, on the surface of the artificial palate. In order to reduce the interference of the artificial palates with the speakers’ speech, subjects were asked to wear them for an acclimatization period of about two hours before the recordings (Hardcastle et al. Reference Hardcastle, Jones, Knight, Trudgeon and Calder1989). The recorded material was judged to be acceptable regarding intelligibility and naturalness. The acoustic signal was acquired at 22050 Hz with the Computerized Speech Lab (CSL) analysis system of Kay Pentax, and downsampled to 11025 Hz for segmentation and analysis in order to improve estimation of the lower formant structure. Seven out of the ten recorded sentence tokens were selected for analysis; tokens 2 through 8 were chosen, thus excluding token 1 in order to avoid problems derived from the lack of familiarity with the sentence list at the beginning of the reading task. EPG data for these seven tokens were converted into CSL format for simultaneous visual inspection of the waveform, spectrographic displays and linguopalatal contact patterns. The overall number of tokens analyzed was 1428 (68 sequences × 7 tokens × 3 speakers), and the maximal number of cases which could undergo assimilation was 630 for place (10 consonant clusters × 3 stress/word type conditions × 7 tokens × 3 speakers) and 504 for manner (8 consonant clusters × 3 stress/word type conditions × 7 tokens × 3 speakers).
Projection of the artificial palate showing the location of the rows and columns of electrodes over the alveolar and palatal zones.

2.2 Identification of assimilatory patterns
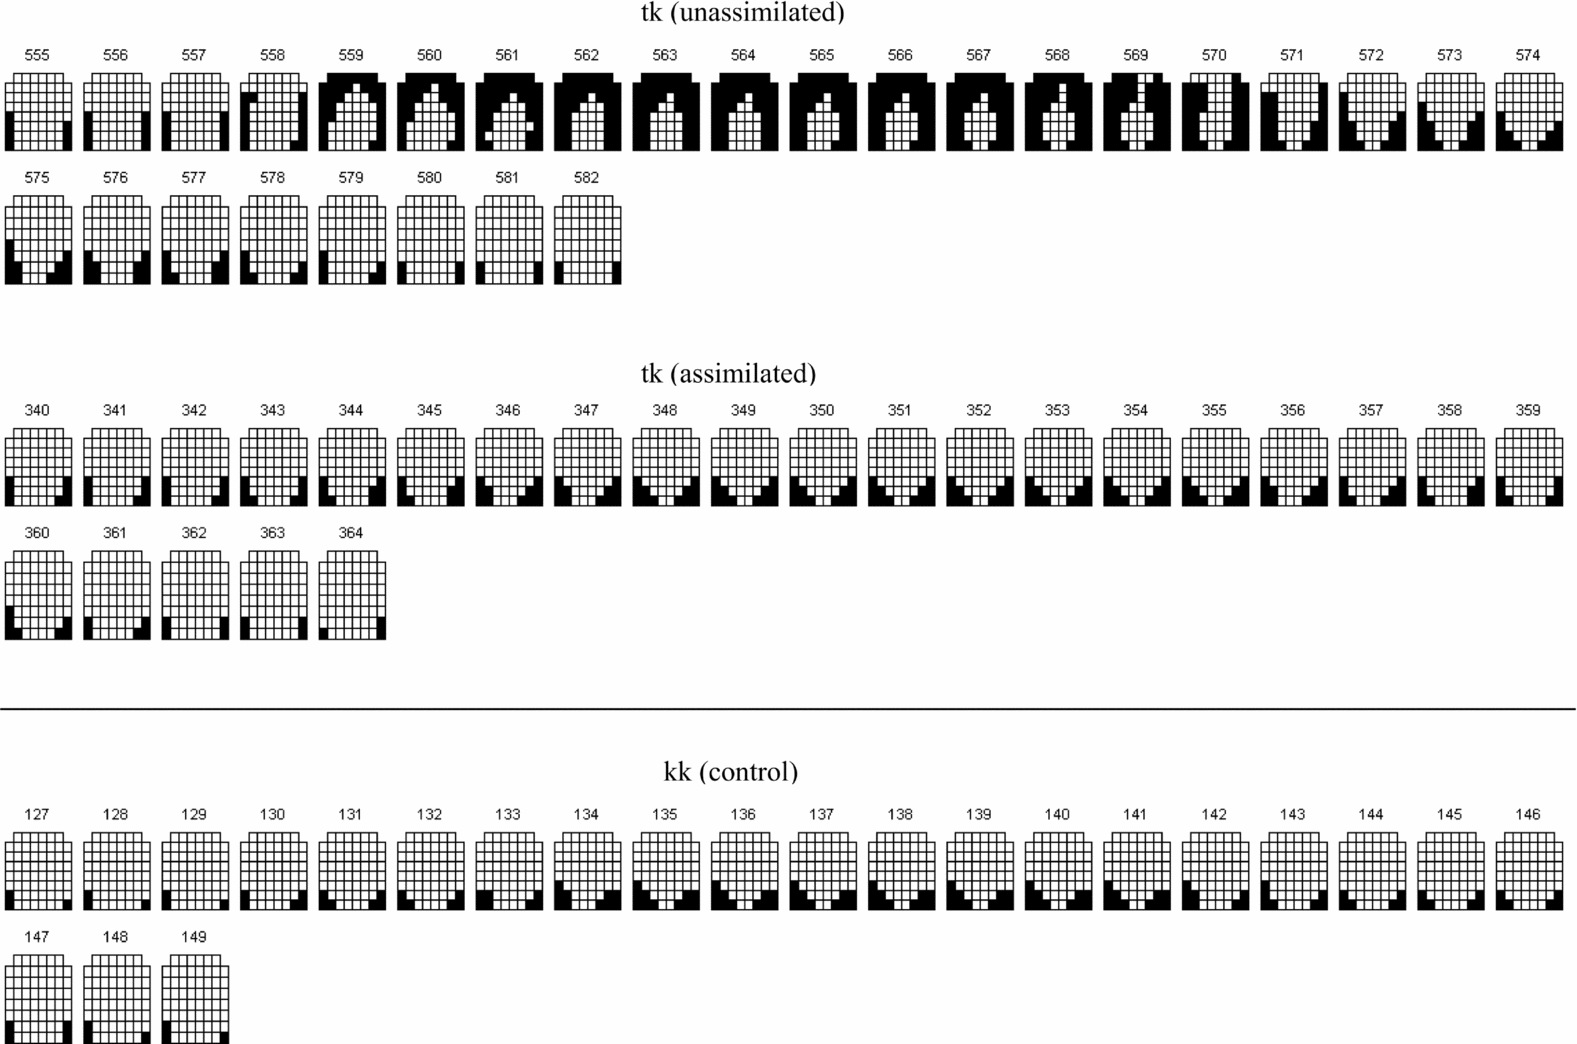
In order to investigate the frequency of occurrence of complete and partial assimilations, EPG printouts representing all linguopalatal contact patterns were made of all cluster tokens. A comparison between successive EPG contact patterns for each token of the /t n/ + /p b m k ɡ/ sequences and the corresponding controls was carried out in order to ascertain whether C1 underwent place asimilation or not, or else showed a gestural residue. Complete place assimilation was taken to occur whenever there was no tongue contact at the four rows of the alveolar zone, and no place assimilation if tokens exhibited full electrode activation at one or more alveolar rows of electrodes and thus an alveolar closure. In Figure 2, the top contact patterns correspond to one token of unassimilated /tk/ showing a dentoalveolar closure at the frontmost rows of the artificial palate during the /t/ closure period; the middle patterns correspond to one token of assimilated /tk/ which, in parallel to the token for the control sequence /kk/ displayed at the bottom of the figure, exhibit no dentoalveolar contact and a back palate constriction indicating the presence of a dorsovelar closure. Instances of a residual C1 gesture were considered to take place whenever there was some electrode activation at the central alveolar zone and/or some lateral contact extending from the palatal zone into the alveolar zone as determined on the EPG contact patterns. In an attempt to render this criterion more precise, traces of C1 were also taken to occur in those assimilated tokens of clusters with a velar C2 (PRST condition only; see Section 2.1) showing less front contact at the four back rows of the palatal zone than the corresponding control sequences (see also Nolan Reference Nolan, Docherty and Ladd1992).
Frame-by-frame linguopalatal configurations for one token of unassimilated /tk/, assimilated /tk/ and the control sequence /kk/ according to speaker DR.

Regressive manner assimilations were identified through inspection of the spectrographic displays for the relevant C1##C2 clusters since EPG does not allow identifying articulatory changes in nasality (it does not provide information about velar lowering) and laterality (lateral openings are not always visible and may occur behind the hard palate). The clusters /p t k/ + /m n/ and /t/ + /l ʎ/ were considered to undergo manner assimilation if, analogously to the corresponding control sequences, they exhibited continuous nasal or lateral formant structure all throughout the consonant cluster rather than just some anticipatory nasalization or lateralization during a portion of C1. Cases of partial C1 nasalization or lateralization were not included in the assimilation counts since it is not always easy to determine from spectrographic displays where nasality or laterality begins after a short oral closure period devoid of formants. Figure 3 shows an example of the assimilated realization [ll] of /tl/ (top) showing formant structure for the alveolar lateral throughout the cluster; data for one token of the control geminate lateral /ll/ produced by the same speaker (DR) is appended below for comparison.
Wide-band spectrographic representations for the realization [ll] of the cluster /tl/ (in the phrase soldat laic ‘secular soldier’, top graph) and the control sequence /ll/ (in the phase rival laic ‘secular rival’, bottom graph) according to speaker DR. The onset and offset of the lateral consonant are indicated by an arrow.

2.3 Segmentation
Once sequences were characterized as assimilated or non-assimilated, regular clusters and their controls were subject to segmentation. Segmental boundaries were established based on the EPG signal in the case of dental, alveolar and alveolopalatal consonants involving linguopalatal contact at the front palate. Thus, the following articulatory criteria were used for identifying the segmental boundaries of the phonetic realizations [t l n ʎ]: the onset and offset of [t n] were taken to occur at the first and last EPG frames showing a full alveolar closure; as for [l] and [ʎ], consonant onset was identified at the temporal frame showing at least one on-electrode at the two ([l]) or four ([ʎ]) central alveolar columns, and consonant offset at the release of one or more electrodes placed at those same columns.
Segmentation for consonants showing no visible tongue-to-palate contact was based on the acoustic signal. Indeed, the edges of bilabial and velar stop and nasal realizations were identified spectrographically at the onset and offset of an acoustic period showing no formants or nasal formants, respectively; other acoustic characteristics such as the presence of a C1 stop burst in sequences like /km/ were also taken into consideration for segmentation purposes. Stop bursts were not considered to be part of the stop in accordance with the characterization of stops as involving primarily a complete vocal tract closure (see e.g. Lehiste Reference Lehiste1970 regarding the identification of stop duration with closure duration). Failure to use articulatory criteria for the segmentation of labial and velar consonants was due to the fact that labials are produced at the lips and show practically no EPG contact, while closure for velars occurred behind the backmost row of the artificial palate for speakers DR and JP; even for speaker JC, who articulated velar stops with a full closure at row 8, closure onset and offset for these consonants took place behind this row and therefore could not be easily determined on the EPG contact patterns. The boundary between C1 and C2 was also identified on spectrographic displays whenever the EPG record showed no articulatory transition between the front lingual closure for the two consecutive consonants in the sequences [tn tl tʎ]. In this particular case the boundary in question was set at about the onset of the C2 murmur ([tn]), or of a period of lateral formant structure which could coincide with the presence of lateral openings on the EPG record ([tl tʎ]). The segmental boundary between C1 and C2 was also determined acoustically in those tokens of the clusters /pn kn/ where C1 was realized as an oral stop and the alveolar closure for /n/ started before the nasal murmur.
2.4 Data analysis
The frequency of occurrence of assimilatory processes was expressed in token percentages exhibiting assimilation or no assimilation. As for place assimilations, two values were assigned to realizations of /t n/ before labials and velars: 1 to instances of assimilation; 0 to instances of no assimilation. Cases of partial assimilation or C1 gestural residue (only 4 out of 630 tokens; see Section 3.1.1 below) were considered as non-assimilated and thus assigned a 0 value. Regarding manner assimilations, the values 1 and 0 were also assigned to those cluster tokens showing assimilation and no assimilation, respectively. Assimilation percentages were tested statistically with a Generalized Linear Model (GLM) for binomial distribution. Place and manner assimilation data were analyzed in separate tests with ‘C1’, ‘C2’, ‘stress/word condition’ and ‘speaker’ as fixed variables. Factor levels were /t n/ (C1) and /p b m k ɡ/ (C2) for the place of assimilation test, /p t k/ (C1) and /m n l ʎ / (C2) for the manner of articulation test, and SECST, PRST, FREQ (‘stress/word condition’) for the two tests. All statistical factors were coded using a deviation coding. The statistical model included all four main effects and the ‘C1’ × ‘C2’ interaction (other variable interactions could not be estimated since certain combinations of experimental conditions were not available or had too few tokens).
In order to find out whether speaker-dependent differences in the frequency of occurrence of place and manner assimilations were conditioned by speech rate, a measure of speech rate expressed as global segment duration was obtained for each speaker by dividing sentence duration by the total number of phonetic segments occurring in the sentence (Pfitzinger Reference Pfitzinger1996). This operation was carried out for eight sentences selected at random, i.e. sentences 18, 24, 30, 33, 52, 56, 63 and 65 in the appendix. In order to find out whether differences in speech rate among speakers were significant, a GLM test with repeated measures was run on the resulting global segment durations for all eight sequence tokens with ‘speaker’ and ‘sequence’ as fixed variables. The model included main effects and the ‘speaker’ × ‘sequence’ interaction.
In addition, several articulatory analyses (see (a)–(c) below) were carried out in order to investigate the effect of production constraints on consonant assimilation which will be described in detail in Sections 3.1.2 and 3.2.2. These analyses are based for the most part on data obtained by means of the contact index method of EPG data reduction (see Fontdevila, Pallarès & Recasens Reference Fontdevila, Pallarès and Recasens1994 for details). Three quotients of electrode activation (Q) were calculated for all cluster tokens by averaging the number of ‘on’ electrodes at a given articulatory zone over the total number of electrodes at that zone: Qa as an estimate of overall alveolar contact at the 30 electrodes of the alveolar zone; Qp (palatal zone, 32 electrodes); Qt (entire palate, 62 electrodes). Two localized measures of contact placement were also computed for all tokens of each consonant sequence: the contact anteriority index at the alveolar zone or CAa which increases as alveolar contact becomes more anterior, and the contact posteriority index at the palatal zone or CPp which increases as dorsopalatal contact becomes more posterior. Qa and CAa were typically used for the analysis of (dento)alveolar articulations, and Qp and CPp for the analysis of velar articulations. Linguopalatal contact and segmental duration data were submitted to the following statistical analyses:
-
(a) In order to find out whether differences in degree of assimilation between C1 = /t/ and C1 = /n/ were related to differences in tongue-to-palate contact, a statistical test using a Generalized Linear Mixed Model (GLMM) with repeated measures was run on the Qa, Qp and Qt values for all tokens of /tt/ and /nn/ at cluster midpoint and of unassimilated /tp/ at C1 midpoint. The fixed factors were ‘sequence’ (levels ‘tt’, ‘tp’, ‘nn’) and ‘speaker’, and the model included the two main effects and the ‘sequence’ × ‘speaker’ interaction. Data for /tp/ were included since the labial stop is supposed not to interfere with the primary front lingual articulator for the dental stop; no C1 data for /np/ could be processed since the alveolar nasal usually assimilated in place to C2 and also because, when no assimilation occurred, the alveolar nasal showed a very similar realization to the control sequence /nn/. Data for /tp/ correspond to the PRST condition only since this is the condition where controls occur.
-
(b) Whether complete assimilation applies or not was determined by running a GLMM test with repeated measures on the Qp and CPp values for assimilated /tk tg nk nɡ/ (PRST condition) and for the corresponding controls /kk ɡɡ/, [ŋk ŋɡ] gathered at the midpoint of the consonant sequence. Main effects and factor interactions were obtained for the independent variables ‘sequence group’ (with the two levels ‘assimilated’ and ‘controls’), ‘C1’ (‘stop’, ‘nasal’), C2’ (‘voiceless’, ‘voiced’) and ‘speaker’. Since there were no available data for assimilated /tk/ for speaker DR and for assimilated /nk/ for speaker JP, values for the control sequences /kk/ (for DR) and [ŋk] (for JP) were excluded from statistical analysis. In view of the similarity in the statistical outcomes for Qp and CPp, only results for the former index will be presented in the ‘Results’ section (see Section 3 below).
-
(c) Possible articulatory differences during C1 as a function of the C2 voicing status were elicited by means of two GLMM tests with repeated mesures performed on the Qa, Qp, Qt and C1 duration values for unassimilated /tk tɡ nk nɡ/ and on those for unassimilated /tp tb np nb/ gathered at C1 midpoint. Main effects and factor interactions were obtained for the independent variables ‘C1’ (levels ‘t’, ‘n’), ‘C2’ (‘voiceless’, ‘voiced’), ‘stress/word condition’ (SECST, PRST, FREQ) and ‘speaker’. Since there were no data available for /tɡ/ for speaker JP, contact index and duration values for /tk/ for this speaker were not included in the statistical test.
All statistical tests were carried out with version 9.2 of the SAS statistical package. Tukey's post-hoc comparisons were performed on pairs of three or more levels of an independent variable yielding a main effect. In all statistical tests, the significance level was established at p < .05.
A representative set of EPG contact configurations for the sequences identified in Section 1.2 were displayed and analyzed in order to ascertain whether manner assimilation is influenced by the homorganic relationship between the two consonants in the cluster. Moreover, in order to investigate the possibility that regressive nasality applies on /p t/ rather than on /k/, the following measures were taken: voicing percentages over closure duration for all three stops before /m n/ as determined from the voicing bar on spectrographic displays; tongue front anticipation for /n/ during the preceding stop consonant as inferred from the Qa index temporal values.
3 Results
3.1 Place assimilations
3.1.1 Frequency of occurrence and degree of assimilation
Place assimilations occurred in 338 out of 630 possible tokens (53.7%). Comparisons seeking to uncover the presence of a C1 gestural residue in place assimilation scenarios show that only four out of 630 tokens exhibited no central alveolar closure at the same time as lateral contact extending into the alveolar zone (i.e. one token of /tp/ and /tb/ for speaker JP and two tokens of /tɡ/ for speaker DR). This finding is indicative that the three Catalan speakers subjected to analysis showed either complete assimilation or no assimilation. Another finding supported this conclusion. No trace of C1 in assimilated sequences appeared to be present judging also from the fact that differences in Qp (and thus in dorsopalatal contact) between assimilated /tk tɡ nk nɡ/ and the corresponding control sequences /kk ɡɡ/, [ŋk ŋɡ] turned out to be non-significant. The test yielded a significant ‘C1’ effect meaning that clusters with a stop C1 had more contact than those with a nasal C1 (F(1,3) = 27.74, p < .05), but no significant ‘sequence group’ effect or ‘C1’ × ‘sequence group’ interaction.
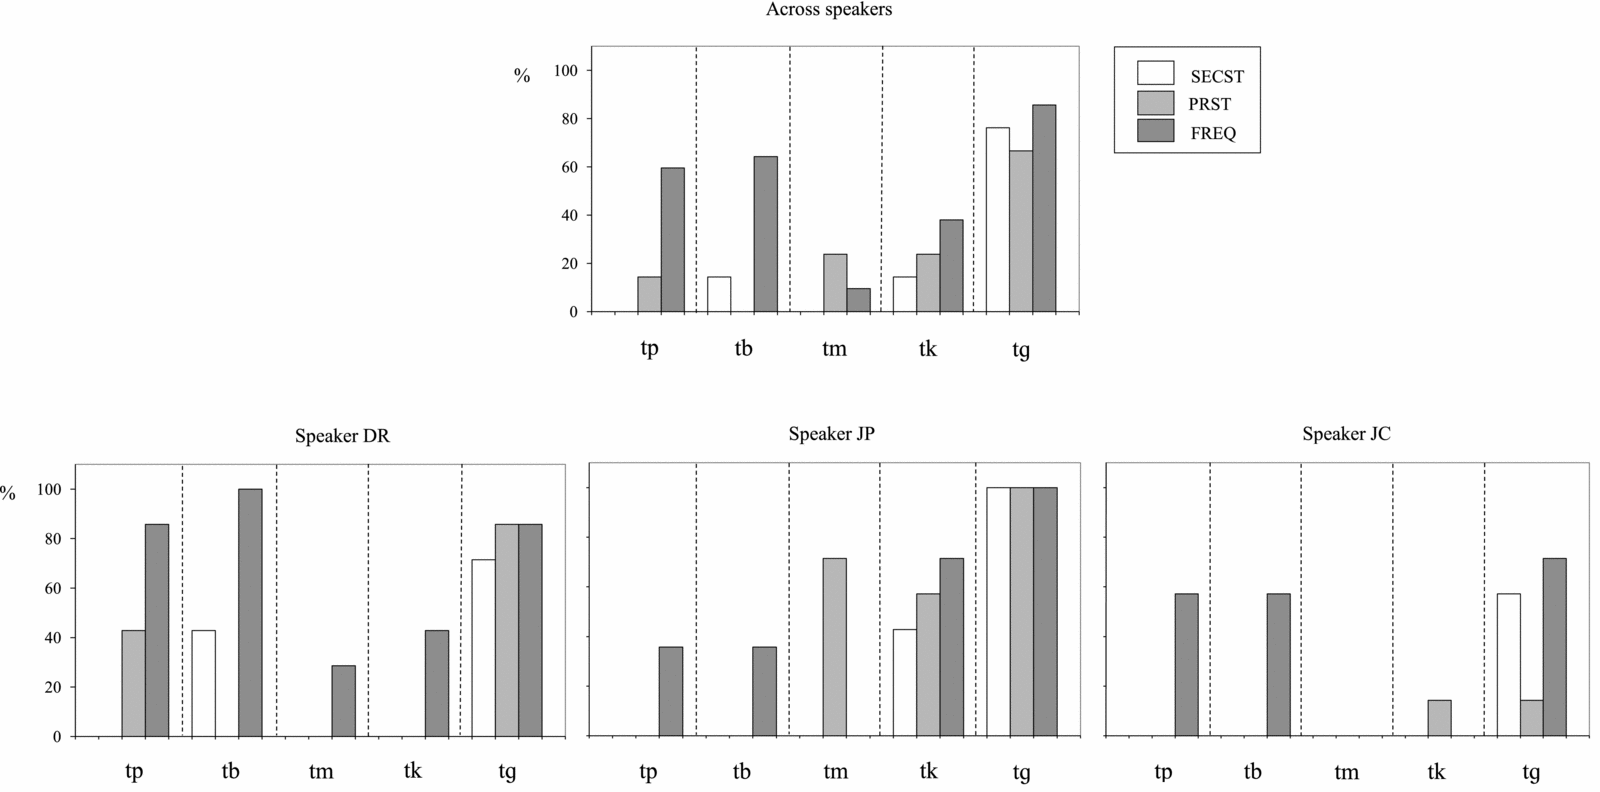
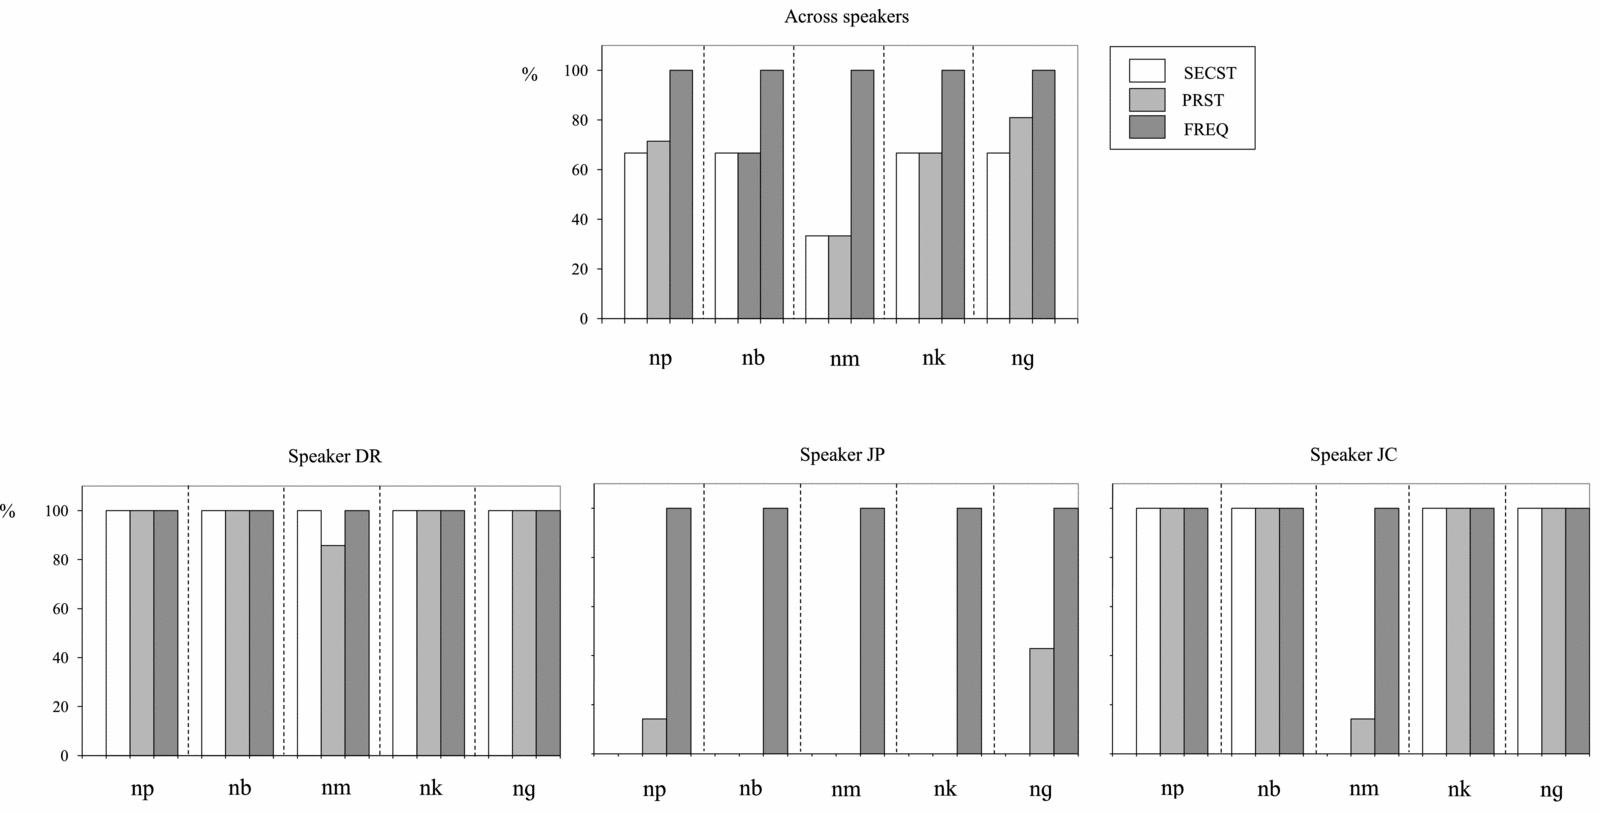
The frequency of occurrence of place assimilations was found to be influenced by the segmental composition of the cluster, stress/word condition and speaker. Figures 4 and 5 plot the frequency of occurrence of regressive place assimilations for /t/ and /n/ as a function of C2 and stress/word condition across speakers (top) and separately for the three individual speakers (bottom). As shown by the top graph of the two figures, the number of assimilations was more than twice for the nasal than for the stop, i.e. mean percentages were 73.3% for /n/ and 32.7% for /t/ (F(1,76) = 110.12, p < .001). There were also a main effect of C2 (F(4,76) = 16.28, p < .001) and a significant C1 × C2 interaction (F(4,76) = 6.25, p < .001): as for clusters with C1 = /t/, assimilations occurred far more often before /ɡ/ than before /p b m k/ (p < .001), and less frequently before /m/ than before /p b k/ (p < .05) and /ɡ/ (p < .001); regarding the clusters with C1 = /n/, place assimilations took place equally often before all oral stops, and less often before /m/ than before /p b k/ (p < .01) and /ɡ/ (p < .001). In sum, /n/ assimilates about twice as much as /t/, and the frequency of ocurrence of place assimilations increases with /ɡ/ for sequences with C1 = /t/ and decreases with C2 = /m/ in clusters with both C1 = /t/ and C1 = /n/.
Percentages of place assimilation for clusters with C1 = /t/ plotted as a function of cluster and stress/word condition. (Top) Data across speakers. (Bottom) Data for the three individual speakers.

Percentages of place assimilation for clusters with C1 = /n/ plotted as a function of cluster and stress/word condition. (Top) Data across speakers. (Bottom) Data for the three individual speakers.

Differences in stress/word condition also reached statistical significance (F(2,76) = 39.03, p < .001) with assimilations applying significantly more often in the FREQ condition than in the SECST and PRST conditions (p < .001). There was also a main ‘speaker’ effect (F(2,76) = 28.14, p < .001) which was related to differences in frequency of assimilation for DR (145/210 = 69%) > JC (111/210 = 52.8%) > JP (82/210 = 39%) and reached significance in the case of all pairwise comparisons (p < .001) (see Figures 4 and 5, bottom graphs). The global measure of speech rate suggests that speaker DR could show more asimilations than the other two speakers because he spoke faster. Thus, while speaker-dependent differences in the speech rate measure achieved significance (F(2,144) = 301.27, p < .001), post-hoc tests showed that those differences were associated with a significantly shorter segment duration for DR (63.50 ms, sd = 3.36) than for JP (78.61 ms, sd = 3.1) and JC (77.36 ms, sd = 3.62). The test also yielded a significant effect of ‘sequence’ (p < .001) and a significant ‘sequence’ × ‘speaker’ interaction (p < .01) meaning that some clusters contributed more to the speaker-dependent difference than others.
3.1.2 Phonetic motivation
The phonetic motivation for two segmental effects on regressive place assimilation reported above was explored, namely, a preference for place assimilations to operate (a) in /nC/ over /tC/ sequences, and (b) before voiced /ɡ/ than before voiceless /k/.
-
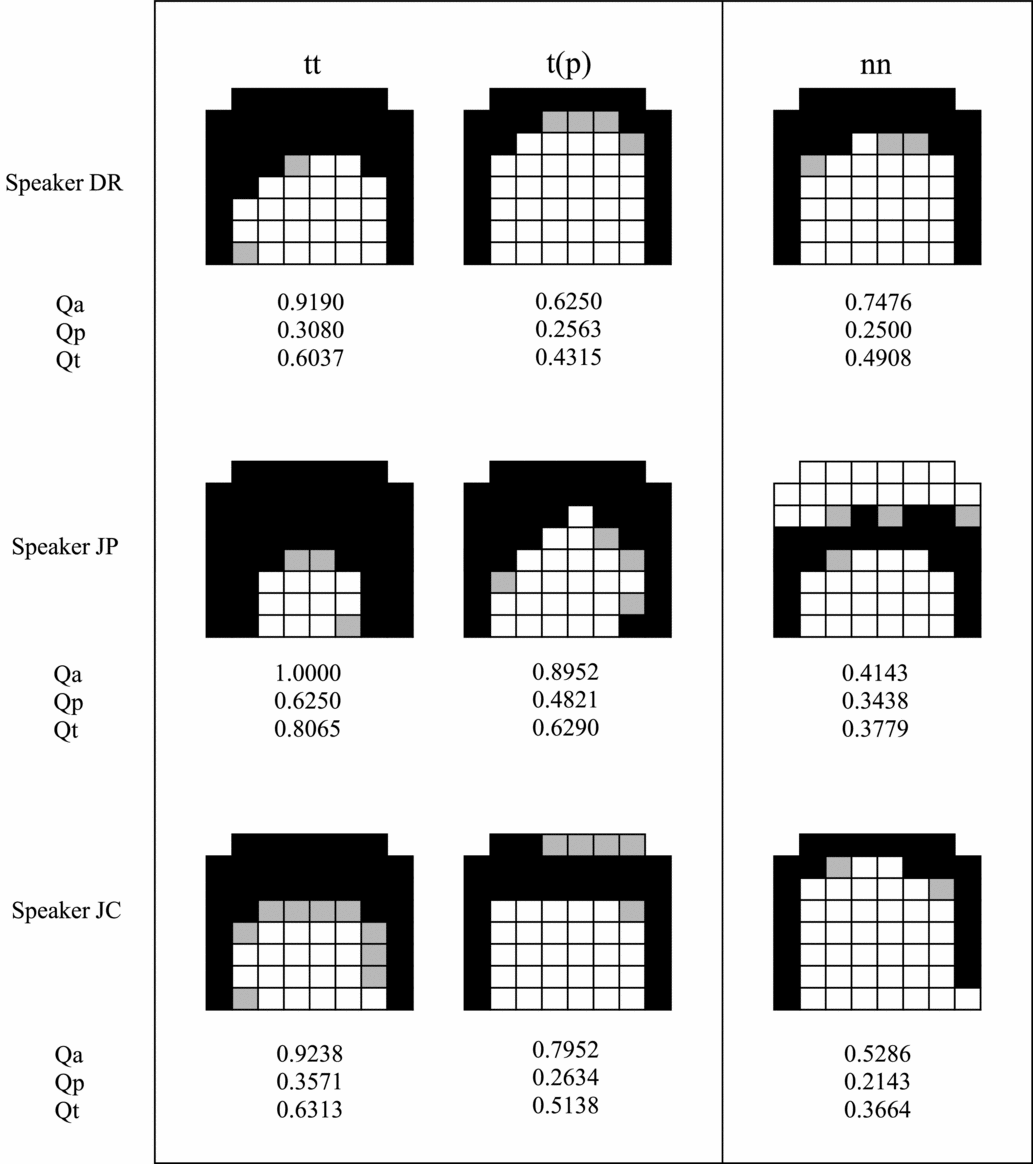
(a) A higher number of regressive place assimilations in clusters with C1 = /n/ than in those with C1 = /t/ may be related to differences in linguopalatal contact size between the two consonants at closure location and at the back palate. The rationale underlying this hypothesis is that less contacted productions ought to undergo more articulatory reduction than those exhibiting more tongue-to-palate contact. As suggested in the Introduction, more tongue contact for /t/ than for /n/ follows presumably from differences in intraoral pressure level motivated by the need to generate a prominent burst for the oral stop but not for the nasal. In order to explore this issue and as referred to in Section 2.4 (a), a comparison was carried out between the EPG contact patterns for /n/ in the control sequence /nn/ (see right column of Figure 6) and those for /t/ in the control sequence /tt/ and in unassimilated realizations of the cluster /tp/ (see mean contact configurations for each speaker on the two left columns of the figure). Values for the contact indices Qa, Qp and Qt are also shown in the same figure.
The three index values yielded a significant ‘sequence’ effect (Qa, F(2,51) = 96.72, p < .001; Qp, F(2,51) = 69.53, p < .001; Qt, F(2,51) = 39.39, p < .001), as well as a significant effect of ‘speaker’ and a significant ‘sequence’ × ‘speaker’ interaction at the p < .001 significance level. According to post-hoc tests, the main ‘sequence’ effect was related to lesser tongue-to-palate contact for /n/ in the sequence /nn/ than for /t/ over the entire palate surface in the sequence /tt/ (p < .001 for all contact indices) and at the front artificial palate in the sequence /tp/ (Qa, p < .001). A set of comparisons between the unassimilated clusters /tC/ and /nC/ referred to elsewhere in the present section indicate that /n/ is consistently produced with less contact than /t/ in other cases as well. Figure 6 illustrates the linguopalatal contact differences in question. The figure shows that the stop /t/ in both sequences /tt/ and /tp/ is usually dentoalveolar and articulated with the tip impinging on the upper teeth and the blade on the alveolar zone, the only clear exception being the contact pattern for /t/ before /p/ for speaker DR where dental contact is barely accompanied by a simultaneous alveolar occlusion. Closure location for the alveolar nasal in the sequence /nn/, on the other hand, takes place at the dentoalveolar zone for speaker DR, at the back alveolar area for speaker JP and at the front teeth for speaker JC. Less tongue contact for /n/ than for /t/ is often present both at closure location and behind the closure site at the sides of the alveolar and palatal zones. Moreover, differences are larger between /nn/ and /tt/ than between /nn/ and /tp/, i.e. dorsopalatal contact for all speakers and also anterior contact for speaker DR are not greater for the oral stop than for the nasal according to the latter sequence pair.
-
(b) As for the role of C2 voicing in regressive place assimilation, data reported in Section 3.1.1 reveal the presence of higher regressive place assimilation percentages for C1 = /t/ before /ɡ/ than before /k/, and a high frequency of assimilations for C1 = /n/ before both velar consonants. As argued in the ‘Introduction’ section (Section 1 above), the finding for clusters with C1 = /t/ is in support of the notion that place assimilations should be triggered by gestural reduction rather than by gestural overlap since the former strategy is expected to apply mostly before voiced stops and the latter before their voiceless cognates.
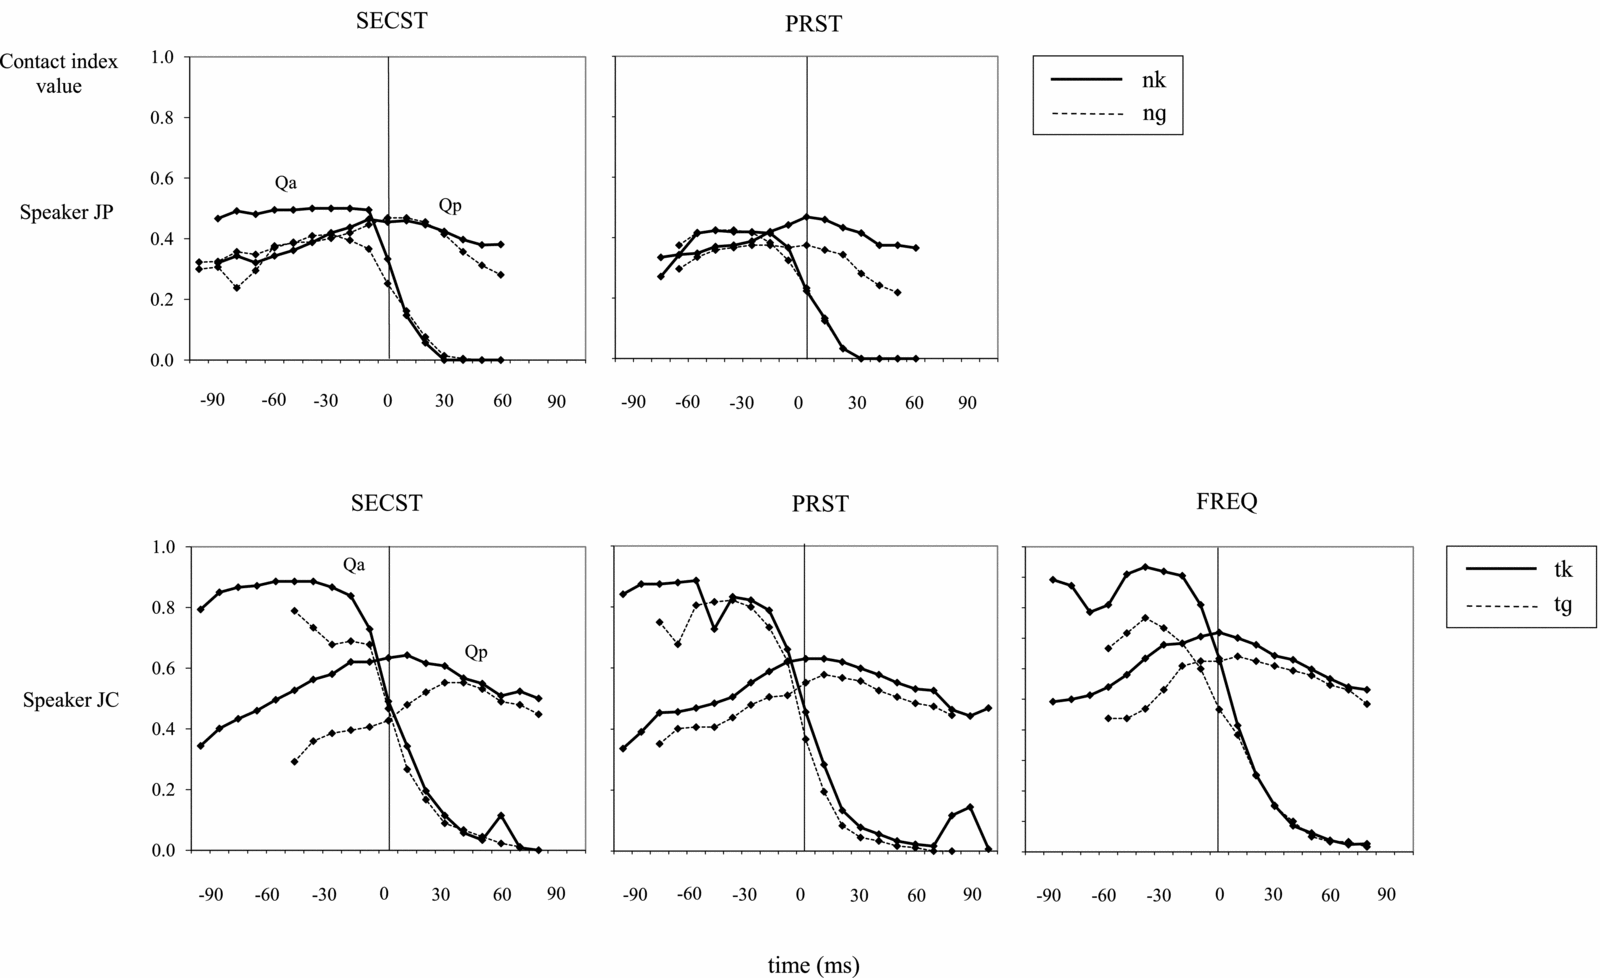
In order to verify the hypothesis that C1 had less tongue contact and was shorter in the voiced vs. voiceless C2 condition, Qa, Qt and Qp values were computed for the unassimilated sequences /tk tɡ nk nɡ/. Data for C1 = /n/ were subjected to evaluation hoping that, even though no differences in frequency of assimilation as a function of C2 = /k/ vs. /ɡ/ took place in this case, the alveolar nasal would be slightly more reduced when showing up before voiced stops than before voiceless ones. Statistical tests revealed the presence of a significant ‘C2’ effect, which was associated with more contact for /k/ vs. /ɡ/ in the case of the Qp and Qt data (F(1,4) = 9.49, p < .05; F(1,5) = 8.39, p < .05), and a significant C1xC2 interaction according to which those C2-dependent voicing differences occurred during C1 = /t/ but not during C1 = /n/ when the Qp data were taken into consideration. All index values were also significantly greater for C1 = /t/ vs. C1 = /n/ (Qa, F(1,5) = 89.45, p < .001; Qp, F(1,4) = 89.99, p < .001; Qt, F(1,5) = 94.56, p < .001). The differences in question become apparent through inspection of the Qa and Qp trajectories during the entire cluster across tokens of unassimilated /tk/ and /tɡ/ for speaker JC and /nk/ and /nɡ/ for speaker JP in several word/stress conditions (Figure 7). In agreement with the predicted articulatory outcome, the trajectories for speaker JP represented at the top of the figure exhibit a higher Qa value for /nk/ than for /nɡ/ during C1 in the case of the SECST condition (upper left graph), and a higher Qp also for /nk/ than for /nɡ/ at C1 offset and during C2 in the case of the PRST condition (upper right graph). On the other hand, the trajectories for speaker JC displayed at the bottom of the figure reveal the presence of analogous and more robust C2-dependent differences between the two clusters /tk/ and /tɡ/ in all three SECST, PRST and FREQ conditions, namely, higher Qa values for /tk/ than for /tɡ/ during C1, and higher Qp values also for /tk/ vs. /tɡ/ during practically the entire cluster. Regarding segmental duration and as also shown in the figure, C1 = /t/ is (non-significantly) longer before the voiceless velar than before the voiced velar with mean C1 duration across stress/word conditions amounting to 95.9 ms for /tk/ (sd = 7.5) and to 62.8 for /tɡ/ (sd = 17.7).
Even though C1 = /t/ and C1 = /n/ were found to undergo place assimilation as often before /p/ as before /b/ (Section 3.1.1), evidence for differences in alveolar contact size and thus in Qa, Qt and Qp as a function of C2 voicing was also sought during C1 = /t n/ in unassimilated realizations of the clusters /tp tb np nb/. According to the statistical tests run on all three contact indices, tongue contact during C1 did not differ significantly as a function of C2 = /p/ vs. C2 = /b/ while being greater for C1 = /t/ vs. C1 = /n/ in the case of the Qa and Qt contact indices (p < .001). In spite of this negative statistical finding, some evidence for differences in C1 gestural prominence as a function of the C2 voicing status was apparent for the unassimilated pair /tp/–/tb/ (though not for /np/–/nb/). Thus, for example, Qa values for /t/ across stress/word conditions and speakers turned out to be higher before /p/ (0.7539 at C1 midpoint, sd = 0.131) than before /b/ (0.7043 at C1 midpoint, sd = 0.102), thus suggesting that the stop may be produced with more alveolar contact in the former C2 context than in the latter. Moreover, /t/ was (non-significantly) shorter before /b/ than before /p/ for all three speakers with cross-speaker means amounting to 68.5 ms for /tb/ and to 79.4 ms for /tp/.
In sum, there appears to be a relationship between differences in frequency of regressive assimilation and in tongue-to-palate contact during C1 and perhaps in C1 duration as a function of C2 voicing. Indeed, cluster pairs which exhibit more assimilations before voiced C2 than before voiceless C2 (/tk/–/tɡ/) show lesser tongue-to-palate contact during C1 and a shorter C1 duration before the voiced than the voiceless velar stop. Moreover, cluster pairs showing no differences in frequency of place assimilation (/nk/–/nɡ/, /tp/–/tb/) exhibit analogous, albeit non-significant, trends. In conjunction with the finding that regressive place assimilations occur more often before /ɡ/ than before /k/ (Section 3.1.1), the articulatory and duration data presented here suggest that place assimilation is triggered by a decrease in contact degree and thus by articulatory reduction rather than by gestural overlap.
Mean linguopalatal contact configurations and Qa, Qp and Qt values for /t/ in the control sequence /tt/ and the cluster /tp/ (PRST condition), and for /n/ in the control sequence /nn/, displayed as a function of speaker. Data correspond to the closure midpoint averaged across tokens. Electrodes show different contact shades depending on contact activation: black (80–100%), grey (40–80%), white (0–40%).

(Top) Qa and Qp trajectories for /nk/ and /nɡ/ according to speaker JP. (Bottom) Qa and Qp trajectories for /tk/ and /tɡ/ according to speaker JC. The 0 line up point is located at C2 onset.

3.1.3 Summary
Linguopalatal contact data on closure formation for Catalan clusters indicate that Catalan speakers show essentially no instances of partial assimilation in the clusters /tC nC/ and therefore either assimilate or do not assimilate /t n/ to a following labial or velar stop. Major patterns regarding the frequency of occurrence of place assimilation processes were accounted for on the basis of gestural reduction: assimilations operate on /n/ rather than on /t/ since the nasal is articulated with less tongue contact than the oral stop, and most often before the dorsovelar voiced stop /ɡ/ in clusters with C1 = /t/ in line with the fact that the dental stop undergoes considerable gestural reduction in this contextual condition. Assimilations were also found to apply more often in frequent vs. content words and for some speakers than for others but did not vary as a function of primary vs. secondary sentence stress.
3.2 Manner of articulation
3.2.1 Frequency of application
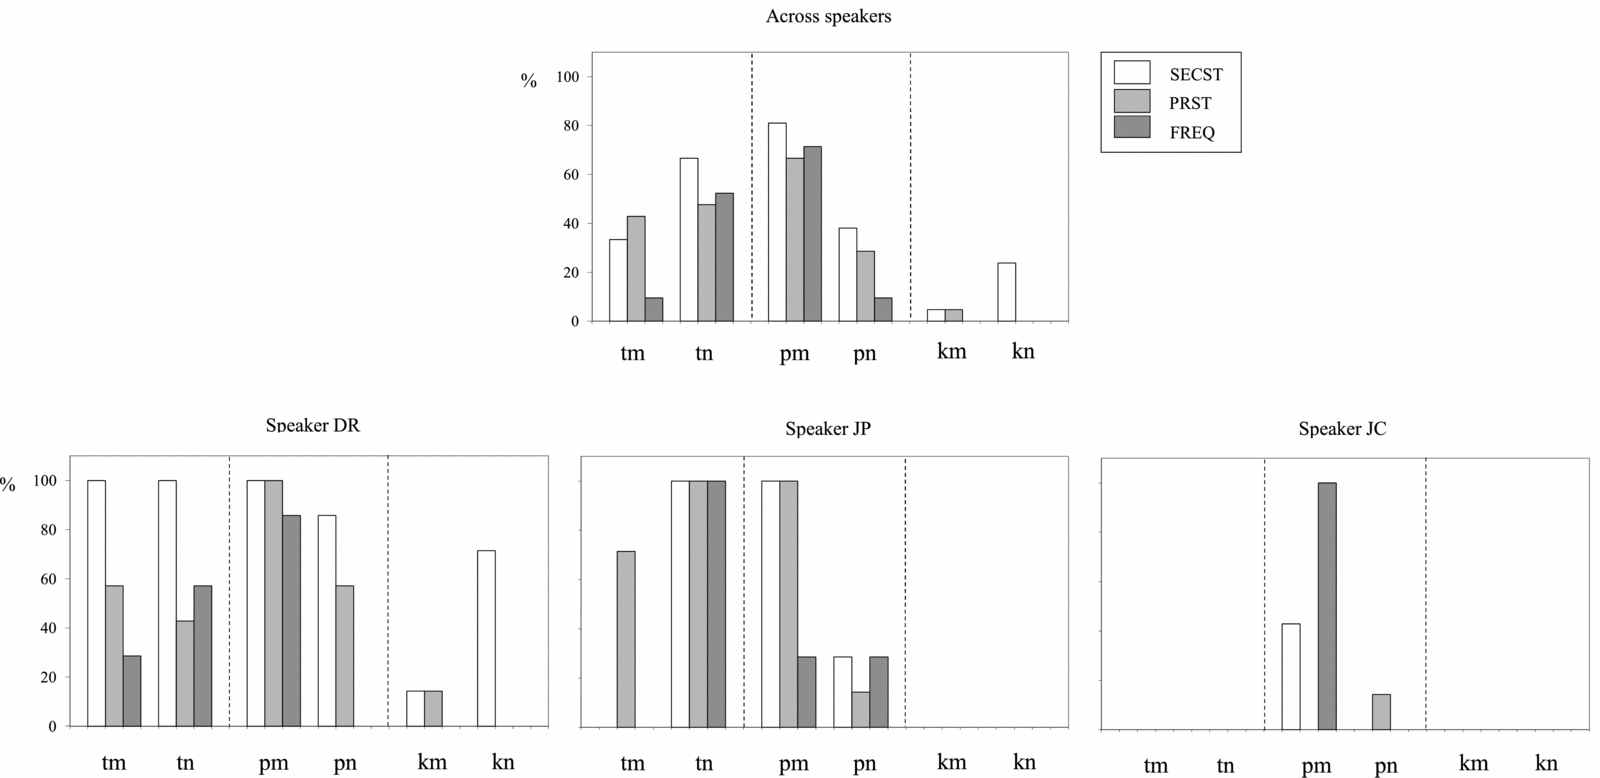
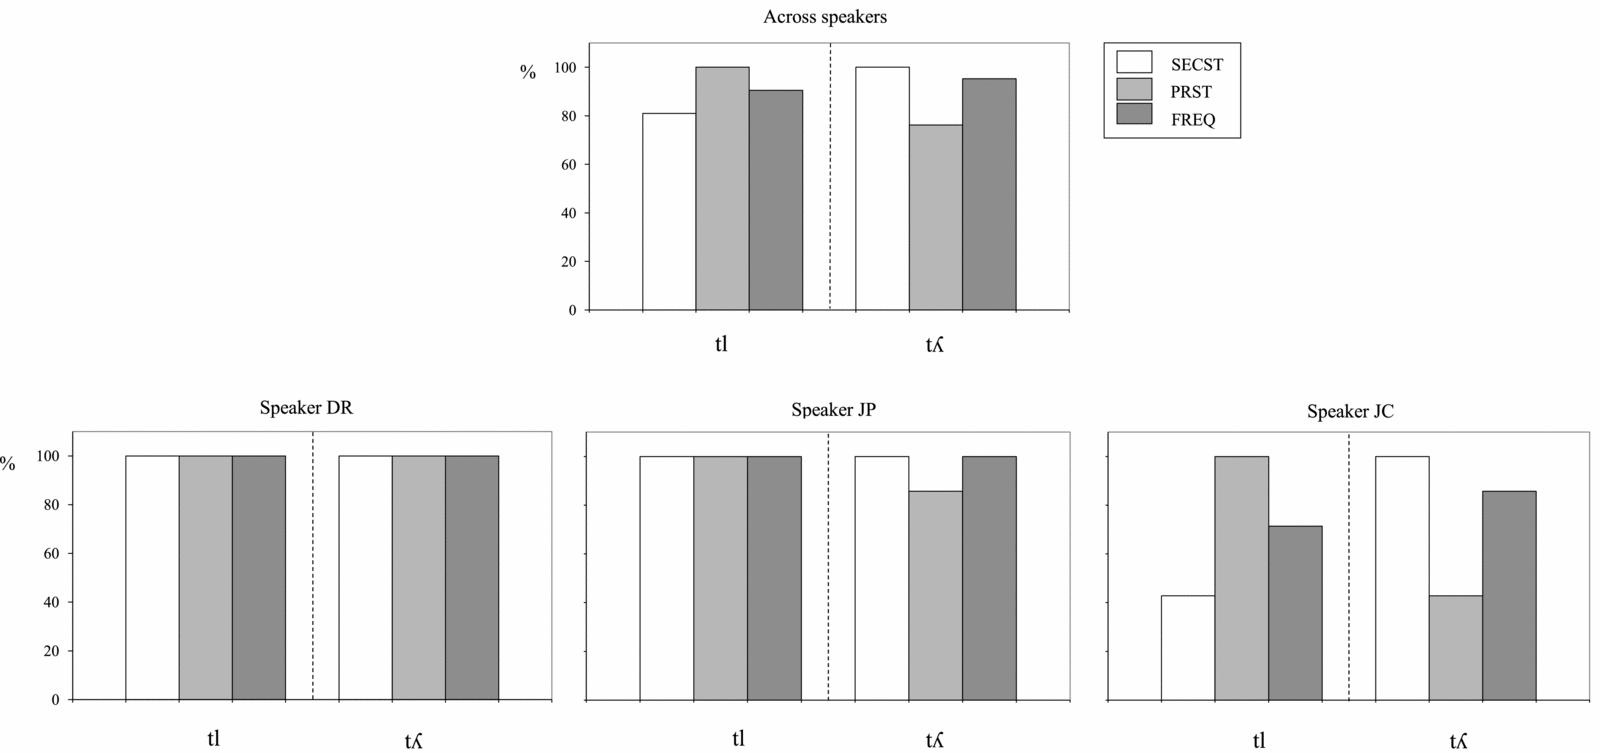
Manner asimilations were almost as frequent as place assimilations, and occurred in 236 out of 504 tokens (46.8%). Figures 8 and 9 plot the frequency of occurrence of the regressive assimilations in nasality for C1 = /p t k/ and in laterality for C1 = /t/ as a function of C2 and stress/word condition (top, data across speakers; bottom, data for the three individual speakers). Assimilations for the cluster /tm/ include two phonetic options, i.e. [nm] and [mm] where C1 = /t/ assimilates in manner but not in place and in both place and manner, respectively (there were no instances of the output [bm] and therefore cases of place assimilation alone).
Percentages of nasality assimilation for clusters with a stop C1 plotted as a function of cluster and stress/word condition. (Top) Data across speakers. (Bottom) Data for the three individual speakers.

Percentages of laterality assimilation for clusters with C1 = /t/ plotted as a function of cluster and stress/word condition. (Top) Data across speakers. (Bottom) Data for the three individual speakers.

The statistical test yielded a main effect of C1 (F(2,60) = 45.37, p < .001) which was associated with significant differences in assimilation degree for /t/ > /p/ > /k/ (p < .001), and a main effect of C2 (F(3,60) = 16.30, p < .001) which was related to higher assimilation percentages for C2 = /m/ than for C2 = /n/ in clusters with C1 = /p/, and for a lateral C2 than for a nasal C2 and for C2 = /n/ than for C2 = /m/ in clusters with C1 = /t/. Data plotted in Figures 8 and 9 show indeed that manner assimilations are almost absent for the two clusters with C1 = /k/ (i.e. /km kn/), and that assimilations for /t p/ take place more often when C1 and C2 are homorganic than when they are not and, therefore, for the sequences /pm tn tl tʎ/ than for the clusters /pn tm km kn/.
The stress/word condition yielded a significant main effect (F(2,60) = 6.21, p < .01) which was related to the frequency of assimilations decreasing in the progression SECST condition > PRST and FREQ conditions (p < .05, p < .001) and, therefore, with stress level rather than with word frequency. There was also a significant speaker-dependent effect (F(2,60) = 32.09, p < .01) which, in partial agreement with the place assimilation data, was associated with a decrease in frequency of assimilation in the progression speaker DR (106/168 = 63%) > speaker JP (88/168 = 52.4%) > speaker JC (42/168 = 25%). Speaker-dependent differences achieved significance, i.e. DR vs. JP (p < .01) and DR, JP vs. JC (p < .001).
3.2.2 Phonetic motivation
This section explores the phonetic motivation of two main trends in manner assimilation reported in Section 3.2.1, i.e. (a) a trend for assimilation to operate on homorganic vs. heterorganic clusters, (b) the reluctance of /k/ to undergo nasal assimilation.
-
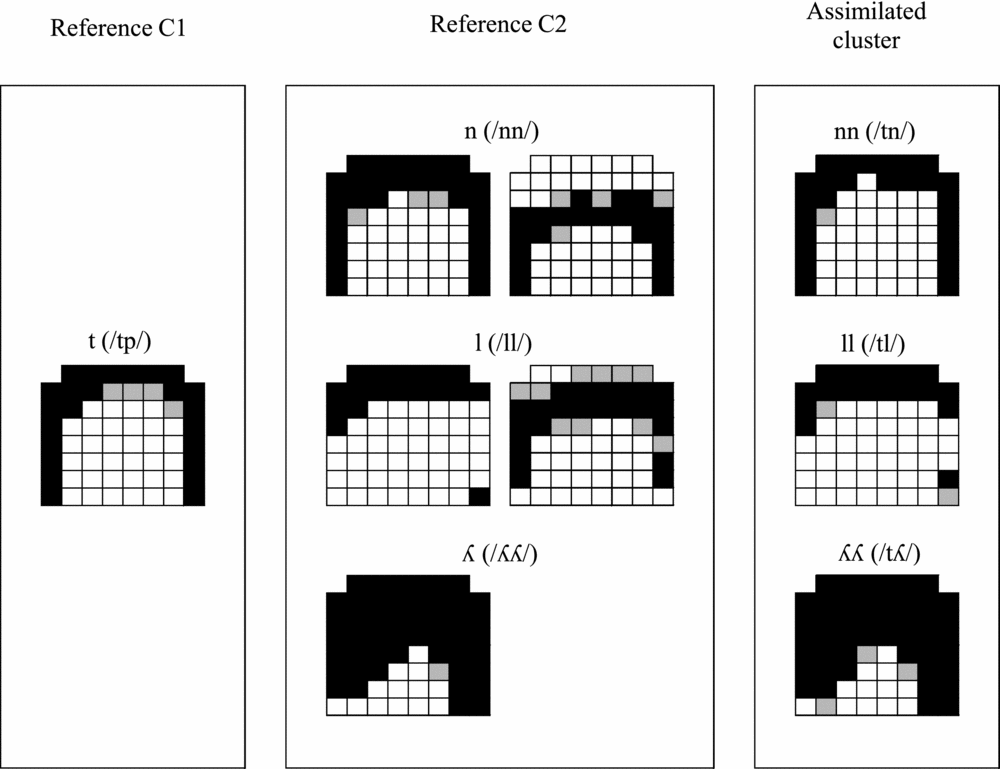
(a) A major finding elicited from the frequency of assimilation data is that homorganic consonant sequences undergo manner assimilation more often than heterorganic ones (see Section 3.2.1). The issue is whether the sequences /tn tl tʎ/ involving two consonants articulated with the tongue front are truly homorganic and, if so, where closure location occurs and what production mechanisms render homorganicity possible. In order to explore this issue, Figure 10 presents several linguopalatal contact configurations for the assimilated outcomes [nn ll ʎʎ] of /tn tl tʎ/ in the right panel (PRST condition only), and for the reference consonants /t/ and /n l ʎ/ in the left and middle panels, respectively. EPG contact configurations for /t/ correspond to the unassimilated sequence /tp/ where C2 is not supposed to affect C1, and those for /n l ʎ/ to the control sequences /nn ll ʎʎ/.
Regarding the reference consonants displayed in the left and middle panels, /t ʎ/ turned out to be essentially dentoalveolar for all subjects, /n/ dentoalveolar for speakers DR and JC and alveolar for JP, and /l/ dentoalveolar for speaker DR and alveolar for JP and JC; moreover, /ʎ/ exhibited a larger alveolar contact size and more dorsopalatal contact than /n l/. The assimilated outcomes of the sequences /tn tl tʎ/ reveal the presence of a single closure location with no changes in closure placement during the entire cluster. As shown for speaker DR in the right panel of the figure, all speakers articulate the assimilated outcomes at row 1 (and thus at the dentoalveolar zone) with variable degrees of alveolar contact decreasing in the progression C2 = /ʎ/ > C2 = /n l/. It thus appears that homorganicity may be achieved either through essentially no adaptation mechanism or through blending whenever C2 is dentoalveolar, or else through progressive dentalization whenever C2 is alveolar. Blending through the superposition of the closure areas for C1 and C2 is prone to take place in the case of the cluster /tʎ/ in light of the fact that the production of the lateral involves a large contact degree at closure location.
-
(b) Frequency of assimilation data reported in Section 3.2.1 also reveal that the velar stop /k/ assimilates in nasality to following /m n/ to a much lesser extent than the labial /p/ and the dental /t/. As pointed out in the Introduction, this different assimilatory behavior could be related to two factors: a higher intraoral pressure level and lesser vocal tract wall compliance for /k/ than for /p t/ which could prevent velar lowering from occurring during the former consonant rather than during the latter; higher demands on tongue body positioning also for dorsal /k/ than for non-dorsal /p/ and /t/ which could cause the dorsovelar stop to block tongue front anticipation for C1 = /n/ to a large extent. As stated in Section 1.2, in order to verify these hypotheses two phonetic characteristics have been looked into which depend on intraoral pressure and/or degree of tongue body constraint: regressive voicing which should be inversely related to intraoral pressure rise (i.e. voicing may stop when intraoral pressure exceeds subglottal pressure), the prediction being that C1 = /k/ ought to allow less regressive voicing than C1 = /p t/ in clusters with C2 = /m n/; tongue front anticipation for /n/ during the preceding stop consonant, which ought to be greater when C1 is /p/ than when it is /k/.
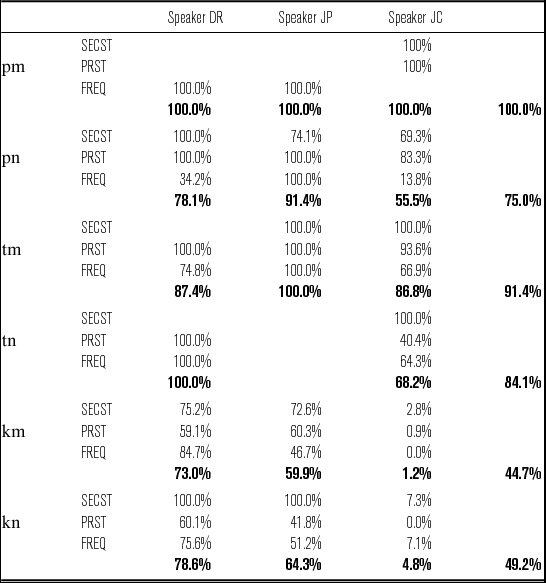
Table 1 reports cross-token C1 voicing percentages for unassimilated clusters in all stress/word conditions and for all speakers. In agreement with the first hypothesis, voicing percentages displayed in the table are much higher during C1 = /p t/ (about 88%) than during C1 = /k/ (47%). Interestingly enough, voicing during /k/ lasts longer for speaker DR who may shift /k/ into [ŋ] before the two nasal consonants than for speakers JP and JC who show no regressive manner assimilation in the clusters /km kn/.
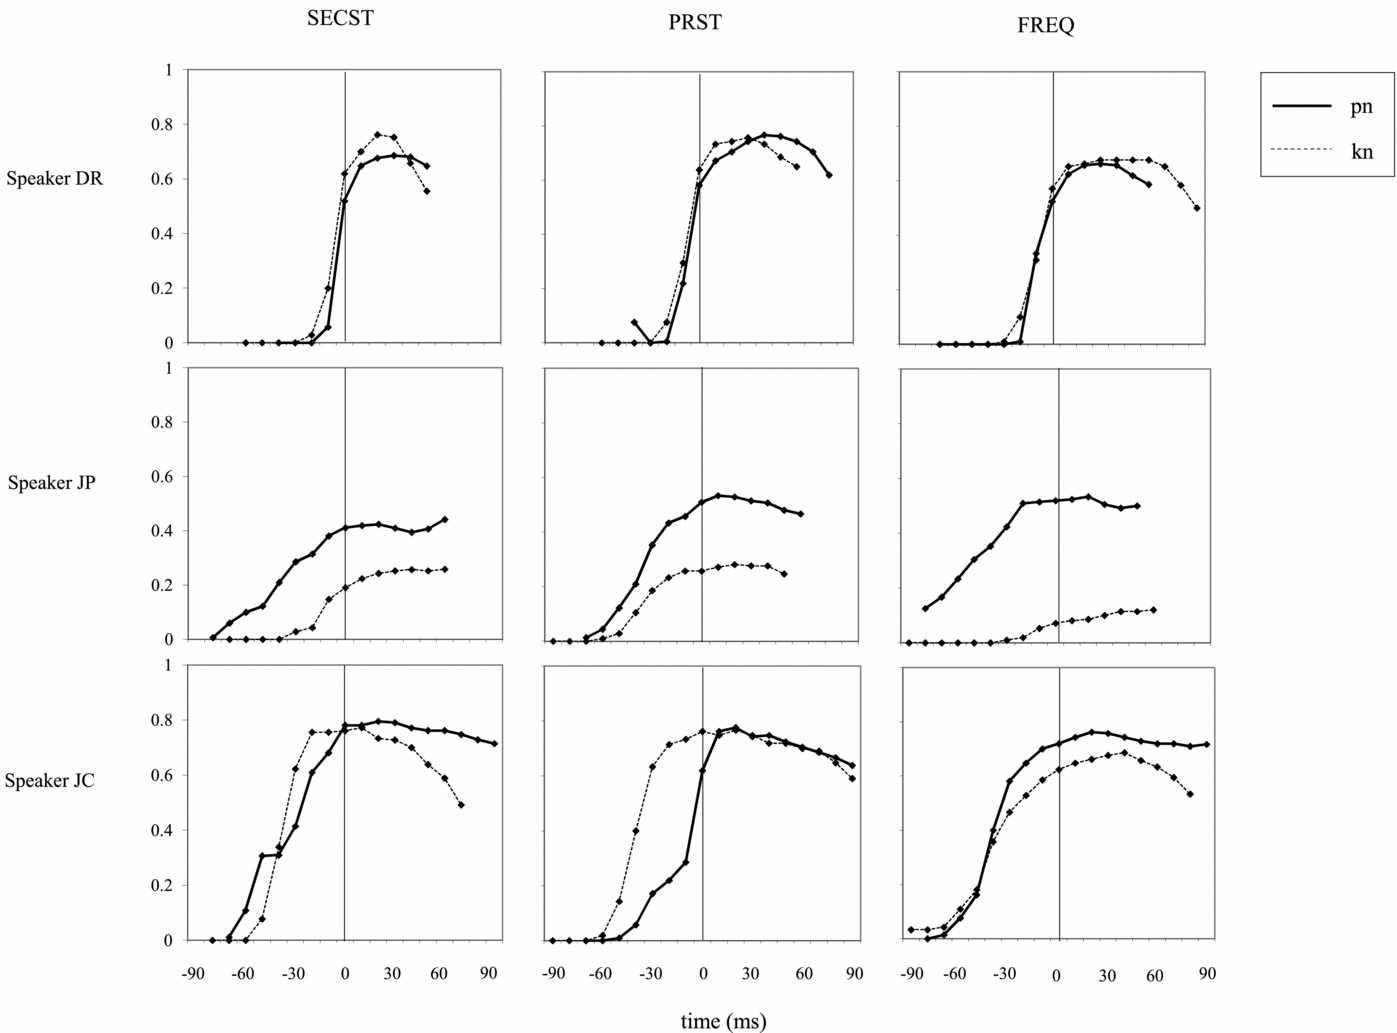
In order to explore possible differences in tongue front anticipation for /n/ during the preceding stop consonant, Qa temporal trajectories for unassimilated /pn/ and /kn/ sequences across tokens have been superimposed for all three speakers in Figure 11. Data for the SECST, PRST and FREQ conditions reveal little C2 anticipation during C1 before the 0 line up point for both sequences /pn/ and /kn/ in the case of speaker DR. Speaker JC, on the other hand, exhibits an inconsistent anticipatory pattern: no clear C2-dependent trend for the SECST condition with a 40% overlap over C1 duration for both /pn/ and /kn/; more anticipation for /kn/ than for /pn/ in the case of the PRST condition (40.3% overlap for /kn/ and 10.6% overlap for /pn/), and the reverse in the case of the FREQ condition (49% for /pn/, 38.1% for /kn/). Regarding speaker JP and according to the initial hypothesis, there is clearly more anticipation for /n/ during preceding /p/ than during preceding /k/, i.e. the tongue front starts raising earlier and exhibits greater displacement in the former vs. latter C1 condition with percentages of C1 duration during which the alveolar closure for C2 occurs amounting to 24.2–52.1% for /pn/ and to 11.5–26% for /kn/. These production data appear to match the speaker-dependent manner assimilation trends reported in Section 3.2.1 to some extent. Indeed, the finding of more tongue front anticipation for /pn/ than for /kn/ in the case of speaker JP but not of speakers DR and JC is in agreement with only the former subject showing higher manner assimilation percentages for /pn/ than for /kn/ in all three stress/word conditions SECST, PRST and FREQ (see Figure 8 above).
Linguopalatal contact configurations for reference /t/ (speaker DR; left), /n l ʎ/ (speaker DR; middle left) and /n l/ (speakers JP and JC; middle right), and for assimilated realizations of /tn tl tʎ/ (speaker DR; right). See Figure 4 for details on contact activation.

Voicing percentages for C1 = /p t k/ in clusters with a nasal C2 as a function of stress/word condition and speaker. Mean cluster percentages for each speaker and across speakers are given in bold.

SECST = secondary sentence stress, context word; PRST = primary sentence stress, content word; FREQ = primary sentence stress, frequent or function word
Mean Qa trajectories for /pn/ and /kn/ according to the three speakers DR, JP and JC. The 0 line up point is located at C2 onset.

3.2.3 Summary
Linguopalatal contact data for /tn tl tʎ/ reveal an active role of homorganicity in facilitating manner adaptation in consonant clusters; moreover, the two consonants become truly homorganic during the clusters under analysis, and homorganicity may be achieved through progressive assimilation or blending. In support of a lower degree of sensitivity for /k/ than for /t p/ to regressive nasality assimilation, production data show less voicing (all speakers) and less gestural overlap (one speaker) for /k/ vs. /p t/ in nasal sequences presumably in line with the aerodynamic and articulatory requirements involved. Manner assimilations were affected by speaker as well as by stress condition rather than by word frequency.
4 Discussion and conclusions
In Catalan, closure location data reveal that regressive place assimilations in /t##C, n##C/ sequences with a labial or a velar C2 are complete or categorical as a general rule thus meaning that Catalan speakers either fully assimilate or do not assimilate C1 to the following heterosyllabic consonant across a word boundary. The frequency of occurrence of place assimilations is affected by the segmental composition of the cluster and in most cases articulatory data may be adduced in support of this segmental effect.
Regarding the role of C1 and in parallel to other languages, /n/ was found to undergo place assimilation more often than /t/, and at least for some speakers the assimilation process turned out to apply almost systematically. The scenario for /n##C/ sequences suggests that, in spite of presenting a large number of C1##C2 combinations, Catalan behaves like other Romance languages such as Spanish and Italian in allowing for highly frequent or systematic place assimilation processes (though this finding needs to be corroborated with data for more speakers in the future). As revealed by articulatory data (i.e. less contact at closure location and at the palatal zone for /n/ than for /t/), C1-dependent differences in frequency of assimilation occur since, in comparison with the stop, the nasal is produced with a more flexible primary articulator and exhibits weaker acoustic cues (Winters Reference Winters2003).
As for the role of C2, regressive place assimilation applied somewhat more frequently before velars than before labials and least often before /m/ in clusters with C1 = /t/, which is in agreement with a universal trend for dorsal consonants to be more aggressive at the coarticulatory level than consonants articulated at the lips. Also in the case of clusters with C1 = /t/, regressive place assimilation was found to apply more often before a voiced velar stop than before its voiceless cognate due presumably to C1 gestural reduction, as shown by the fact that the dental stop exhibits less linguopalatal contact and may be shorter before /ɡ/ than before /k/ in the unassimilated sequences /tk tɡ/. Moreover, the finding that /n/ undergoes place assimilation as often before /ɡ/ as before /k/ appears to be consistent with the absence of differences in linguopalatal contact and duration for /n/ as a function of /k/ vs. /ɡ/ in the unassimilated sequences /nk nɡ/.
Another relevant finding of the present study is that regressive manner assimilations in stop + nasal, lateral clusters are conditioned by the place of articulation requirements for the two consonants in the cluster. In particular, the homorganic relationship between C1 and C2 appears to facilitate the implementation of manner assimilation for the clusters /pm tn tl tʎ/ as opposed to /pn tm km kn/. The homorganic condition in the case of the /tC/ sequences may be achieved through several mechanisms, namely, blending and progressive assimilation. In comparison with the scenario for the reverse clusters /nt lt ʎt/ where blending appears to be the favored strategy (Recasens Reference Recasens, Goldstein, Whalen and Best2006, Reference Recasens2008), speakers appear to prefer the progressive dentalization mechanism in the sequences /tn tl tʎ/ by placing the tongue front at the juncture of the teeth and the alveolar zone and keeping it all the way until the end of the cluster. This asymmetrical behaviour could be associated with a higher degree of articulatory constraint at closure or constriction location for the oral stop (in the /tC/ clusters) than for the alveolar nasal or the alveolar lateral (in the /nC lC ʎC/ clusters). The role of the homorganicity condition in the implementation of manner assimilations also accounts for the phonetic outcome [mm] (also [nm]) but not [bm] of /tm/; thus, once C1 and C2 become homorganic, the most natural strategy appears to be for C1 to assimilate to C2 in manner of articulation. Regressive manner assimilations may also be conditioned by the production requirements for oral stops differing in place of articulation, i.e. regressive nasality was found to affect /t p/ rather than /k/. A high degree of coarticulatory resistance for the dorsovelar consonant than for the non-dorsal ones in this case appears to be related to an increase in intraoral pressure, lesser degree of compliance of the vocal tract surface walls and stricter demands on the tongue body, as suggested by the finding that /k/ allows less regressive voicing than /p t/ and may also exhibit less gestural overlap than /p/ when followed by /n/.
Regressive place assimilations in clusters with C1 = /t/ turned out to occur more frequently when C1 belonged to a function or frequent word than when it belonged to a content word which should follow from differences in articulatory reduction for the final consonant between the two word types. At least for one speaker the same word-type effect was also found to hold for place assimilations in clusters with C1 = /n/ (see data for speaker JP in Figure 5 above). Whether the syllable following the target consonant (C1) received primary or secondary sentence stress did not affect the frequency of occurrence of regressive place assimilations perhaps since the two stress patterns did not differ much regarding degree of articulatory and acoustic prominence as implemented through phonetic characteristics such as linguopalatal contact size and segmental duration. Moreover, the finding that manner assimilations were conditioned by stress condition rather than by word type supports the possibility that place and manner assimilations are ruled by different production strategies. A possible reason for this finding may be that, while place adaptations depend essentially on the primary consonant articulator, manner adaptations may involve other vocal tract structures such as the velum for nasality and the tongue sides for laterality, though the ways in which these production differences interact with speech rate, stress level and word type in causing asimilations to operate more or less often remains unclear. This remark could be extended to speaker-dependent differences as well: place assimilations occurred more frequently for DR vs. JP, JC or for DR, JC vs. JP while manner assimilations were favored by DR and JP over JC. It was also found that the trend for speaker DR to show more assimilations than speakers JP and JC could be due to speaker-dependent differences in speech rate.
This paper also shows that segmental weakening is a relevant mechanism contributing decisively to an increase in the frequency of occurrence of assimilatory processes in the consonant clusters subject to investigation. Weakening is implemented through a decrease in articulatory and acoustic prominence which in its turn is associated with a decrease in tongue-to-palate contact, segmental duration and oral pressure level, and ultimately with the need to allow continuous voicing for voiced stops and airflow through the velopharyngeal port for nasals, and with articulatory undershoot for consonants embedded in unstressed syllables and frequent words. It certainly looks plausible to state then that perceptual misidentification is based on articulatory events in a considerable number of assimilatory processes.
To recapitulate, place and manner assimilatory processes in Catalan consonant clusters across a word boundary have been reported to differ as a function of segmental composition, speaker, token and stress/word type. In partial disagreement with descriptive studies on Catalan phonology (see Recasens Reference Recasens1993, Bonet & Lloret Reference Bonet and Lloret1998, Wheeler Reference Wheeler2005), these processes are not optional but conform to some regular patterns of assimilatory behavior: regressive place assimilations are far more variable for C1 = /t/ than for C1 = /n/, and their frequency of occurrence is also conditioned by the C2 place and voicing characteristics; manner assimilations are influenced by the homorganic relationship between the two consecutive consonants and by the C1 stop place of articulation. Additional research needs to be carried out in order to elicit whether other Catalan speakers behave like the ones analyzed in the present investigation, and the extent to which the assimilatory trends reported in the present study apply cross-linguistically and have perceptual consequences.
Acknowledgements
This research has been funded by projects FFI-2009–09339 from the Ministry of Innovation and Science and FFI2013–40579-P from the Ministry of Economy and Competitiveness of Spain, by ICREA (Catalan Institution for Research and Advanced Studies), and by the research groups 2009SGR003 and 2013SGR61 from the Generalitat de Catalunya. We would like to thank three anonymous reviewers for their comments on a previous version of this paper and the Servei d’Estadística of the Universitat Autònoma de Barcelona for assistance with the statistical analysis.
Appendix. Catalan sentences
List of sentences in Catalan orthography with consonant clusters underlined. English translations are also included.