1 Introduction
Pitjantjatjara is a language of Central Australia with around 2000 speakers, and is still being learned as a first language by infants today (Douglas Reference Douglas1957, Reference Douglas1964; Goddard Reference Goddard1986, Reference Goddard1993, Reference Goddard1996). It has five places of articulation in the oral stop series, all of which occur in the context of the three phonemic vowels /a i u/. This paper examines the stop burst for these five oral stop consonants /p t ʈ c k/Footnote 1 – respectively bilabial, alveolar, retroflex, alveo-palatal (henceforth simply palatal) and velar – in all three vowel contexts. In this paper we focus on two particular contrasts within this series: the alveolar vs. retroflex contrast, and the palatal vs. velar contrast. Although it is recognized that information about place of articulation of multiple coronals can be carried by both temporal and spectral qualities of stop consonants (Ladefoged & Maddieson Reference Ladefoged and Maddieson1996, Ladefoged Reference Ladefoged2001, Bundgaard-Nielsen et al. Reference Bundgaard-Nielsen, Baker, Kroos, Harvey and Best2012), our focus in the present study is on the stop burst itself, since it is known to provide important cues to stop place of articulation for alveolars, bilabials and velars in languages such as English, French and Malayalam (Dorman, Studdert-Kennedy & Raphael Reference Dorman, Studdert-Kennedy and Raphael1977, Stevens & Blumstein Reference Stevens and Blumstein1978, Blumstein & Stevens Reference Blumstein and Stevens1979, Lahiri, Gewirth & Blumstein Reference Lahiri, Gewirth and Blumstein1984). In the present study, we aim to determine to what extent the stop burst can differentiate the five places of articulation in Pitjantjatjara in three vowel contexts.
1.1 The alveolar vs. retroflex contrast
The alveolar and the retroflex consonants in Australian languages are classified, both phonetically and phonologically, as apicals (Dixon Reference Dixon1980, Reference Dixon2002; Butcher Reference Butcher and Lewis1995), but the contrast is notoriously unstable (see Evans Reference Evans and Goldsmith1995 for some discussion).Footnote 2 The primary cue to the contrast lies in the preceding vowel, with a very low spectral centre of gravity (i.e. a low F2 and F3) at the left edge of the consonant. For this reason, the alveolar vs. retroflex contrast is neutralized in initial position in most languages that have the contrast, including Pitjantjatjara (Hamilton Reference Hamilton1996). The alveolar and retroflex are deemed to be very similar at the right edge of the consonant (i.e. at stop release), since in articulatory terms, both consonants are released into the alveolar region: in the case of the retroflex, initial closure in the postalveolar region is followed by a forward movement of the tongue with release into the alveolar region, while for the alveolar, both closure and release occur in the alveolar region. However, there is a high level of variability and overlap in realization for alveolars and retroflexes in languages that contain the contrast, both within and across speakers, and as a result the contrast is notoriously problematic phonetically (see for example Dart Reference Dart1991, Hamann Reference Hamann2003, Simonsen, Moen & Cowen Reference Simonsen, Moen and Cowen2008, and Tabain Reference Tabain2009).
Despite the high level of variability in the apical contrast, and the possibility that burst spectra are the same for the retroflex and the alveolar due to release at a similar point along the hard palate, there is evidence that these two apicals do indeed contrast spectrally, at least in the context of the central vowels /a/ and /ə/. Tabain (Reference Tabain2012) has shown that the retroflex /ʈ/ has a lower (i.e. more steep) spectral tilt – and, depending on speaker, a lower spectral Centre of Gravity and a lower Standard Deviation (indicating a less broad spectral peak) – in another Central Australian language, Arrernte, which is a geographical neighbour of Pitjantjatjara. Both the retroflex and the alveolar in Arrernte have a broad spectral peak with a sharp drop in energy at around 4 kHz; however, this drop in energy occurs at a slightly lower frequency for the retroflex /ʈ/ than for the alveolar /t/. The Arrernte results suggest that, on average, the retroflex is released slightly further back than the alveolar in the context of a central vowel.
In the present study we extend this previous work on the alveolar vs. retroflex contrast to the vowels /i/ and /u/. We seek to determine if spectral differences seen in the central vowel context are evident in the front and back vowel contexts as well. In this sense, it is worth noting that the alveolar vs. retroflex contrast is typologically rare in the context of a following front vowel, such as /i/ (Hamilton Reference Hamilton1996).
It should be noted that in the context of Australian languages, the alveolar and retroflex apicals contrast with dentals and palatals, which are both classified as laminals. However, perceptually, it is usually the dentals and not the palatals that are confused with the apicals, and the two apicals are often confused with each other (Ladefoged Reference Ladefoged2001, Bundgaard-Nielsen et al. Reference Bundgaard-Nielsen, Baker, Kroos, Harvey and Best2012). Since Pitjantjatjara does not have a dental place of articulation, and since palatals are not usually confused with the apicals, we do not explicitly contrast the alveolar and the retroflex with the palatal. However, we will make comparisons between these three coronal stops as needed for descriptive purposes.
1.2 The palatal vs. velar contrast
Although the contrast between palatals and velars is not as obviously problematic as the contrast between alveolars and retroflexes, it too has been a source of some research over the years, both in terms of the articulatory characteristics which distinguish velars from palatals – and palatals from alveo-palatals – and also in terms of the bases for the historical tendency towards palatalization and affrication of velars, particularly in a front vowel context (Recasens Reference Recasens1990, Reference Recasens2013; Keating Reference Keating, Paradis and Prunet1991; Keating & Lahiri Reference Keating and Lahiri1993; Recasens, Fontdevila & Pallarès Reference Recasens, Fontdevila, Pallarès, Connell and Arvaniti1995; Recasens & Romero Reference Recasens and Romero1997; Guignard-Guion Reference Guignard-Guion1998; Recasens & Espinosa Reference Recasens and Espinosa2010). In the present study, our focus is on how the palatal and velar stop bursts contrast in a system where both sounds are phonemic, and indeed lexically frequent (note that the alveolar vs. retroflex contrast discussed above does not carry a heavy functional load). Our focus in the present study is on the moment of stop burst, although we briefly consider the question of how spectra may differ at the midpoint of the burst/aspiration portion, given that the palatal is often said to be affricated (Tabain & Butcher Reference Tabain and Butcher2014).
In the present paper we particularly focus on the formant values for the palatal and the velar. In Fant's (Reference Fant1960) classic nomogram models, the author showed that F2 and F3 have very similar values when a stop articulation is produced in the front velar region (near the hard palate); this spectral prominence, sometimes called the ‘velar pinch’, has been proposed as a main reason for why velars are so frequent in the consonant inventory of the world's languages (Stevens Reference Stevens1989). More recent work, by Schwartz et al. (Reference Schwartz, Boe, Badin and Sawallis2012), has sought to re-create and refine this pioneering work by incorporating advances in the understanding of motor control and perception of speech, as part of their study into the universality of the bilabial–coronal–velar stop series. Schwartz et al. confirm that F2 and F3 are close together for an anterior velar, but become more separate as the velar moves back in place of articulation, with F2 becoming lower (i.e. as it becomes the front cavity resonance). Velar F2 varies from 1 kHz to 2 kHz, and F3 varies from about 2 kHz to 2.5 kHz. By contrast, F2 for palatals is consistently around 2 kHz, with F3 varying between about 2.5 kHz and 3.5 kHz (see Figures 7 and 8 in Schwartz et al. Reference Schwartz, Boe, Badin and Sawallis2012). As a result, the spectral Centre of Gravity is shifted upwards for palatals compared to velars. In general, F3 is deemed to be a front cavity resonance for coronal and palatal constrictions, with F2 the back cavity resonance (with a switch in cavity affiliations in the velar region, leading to the ‘velar pinch’ referred to above). It is thought that the size of the front cavity is actively controlled in the case of the palatal, in order to ensure that F3 is higher for the palatal than for the velar (Keating Reference Keating, Paradis and Prunet1991, Keating & Lahiri Reference Keating and Lahiri1993); this is thought to be done by maximizing the extent of contact along the palate.
Both the palatal and the velar involve relatively large portions of the tongue in contact with the palate at any one point in time. In the case of the velar, the back part of the tongue is involved in making contact, but in the case of the palatal, both the tongue blade and the tongue body may be involved in making contact (Recasens Reference Recasens2013). This is in contrast to the alveolar and the retroflex which, by nature of their apicality, involve a very small portion of the tongue tip in contact with the palate at any one point in time.
It is worth noting that in Pitjantjatjara's neighbouring language Arrernte, the palatal stop burst has a narrow spectral peak at around 4 kHz (Tabain Reference Tabain2012). As a result of this narrow peak, spectral Centre of Gravity and spectral tilt are higher for the palatal than for the other three coronals in the language (lamino-dental, apico-alveolar and apico-retroflex), indicating a greater concentration of energy in the higher frequencies of the spectrum for the palatal. Again, this analysis is limited to the central vowel context (Arrernte has a minimal vowel inventory), and the question remains as to how the palatal behaves in front and back vowel contexts. It is also worth mentioning that this palatal burst spectrum fits the ‘diffuse-rising’ template for English coronals of Blumstein & Stevens (Reference Blumstein and Stevens1979) – i.e. broadly rising up to 5 kHz – whereas the spectra for the two apicals in Arrernte do not.
One issue that is not very clear in the case of the palatal vs. velar contrast is the direction of airflow at the moment of stop release. Stevens (Reference Stevens1998: 371) states that for velars, the presence of the palatal incline behind the alveolar ridge serves as an oblique-angled obstacle to airflow at the moment of velar release; for alveolars, by contrast, there is a partial direct obstacle to airflow at the lower teeth (Stevens Reference Stevens1998: 361). Such obstacles increase the intensity of the burst noise, enhancing spectral peaks, with a direct obstacle providing greater enhancement. Complementary jaw movement and acoustic data for Arrernte (Tabain Reference Tabain2012) suggest that the lower teeth serve as an obstacle not just to alveolars and retroflexes, but to palatals as well, at least in the context of a central vowel (note that velars were not examined in that study). However, it is not clear how the two possible obstacles to airflow (palatal incline and lower teeth) behave in different vowel contexts for /c/ and /k/: although it is possible that the spectral output for both /c/ and /k/ in a front vowel context or in a back vowel context are relatively similar due to a similar length and location of constriction, it is also possible that they differ due to raising of the lower jaw (and hence the presence of the lower teeth as an obstacle) in the case of the palatal articulation due to involvement of the tongue blade rather than the dorsum.
There is one final consideration regarding the palatal vs. velar contrast that needs to be mentioned here. Butcher & Tabain (Reference Butcher and Tabain2004) have shown that velars in a central and back vowel context are articulated further back in Australian languages than in European languages; however, the place of articulation in a front vowel context is comparable in the two groups of languages. These results are based both on static palatographic data and on formant transitions. The precise reasons for this difference are not clear, but one possibility is that the need to contrast with a palatal phoneme in most Australian languages leads the velar to be produced further back in contexts which biomechanically permit this (i.e. central and back vowel contexts), but not in the context which makes it biomechanically difficult (i.e. a front vowel context). It is therefore possible that the burst spectra for velars in Pitjantjatjara are different from those seen for languages such as English, with a lowering of the spectral centre of gravity due to lower F2 values.
1.3 Characteristic measures
In the present study, we use spectral tilt, spectral moment and estimated formant measures, as well as burst duration, to characterize the stop burst spectra of Pitjantjatjara. The first two sets of measures – spectral tilt and spectral moments – capture gross characteristics of the spectrum as may be encoded by the human auditory system (Forrest et al. Reference Forrest, Weismer, Milenkovic and Dougall1988). Spectral tilt is an estimate of the slope of the spectrum, capturing the drop-off in energy across a selected frequency range; as a result, it also gives an indication of the relative amount of high- vs. low-frequency energy in the range, which is known to differentiate stop bursts from each other according to place of articulation and following vowel context (Stevens & Blumstein Reference Stevens and Blumstein1978, Blumstein & Stevens Reference Blumstein and Stevens1979).
The four spectral moments capture different aspects of the spectrum. The first spectral moment, more commonly called spectral Centre of Gravity, is the average frequency in a given range, as weighted by the intensity values in each frequency bin. The second spectral moment, which is less commonly used in speech analysis, gives the variance around the mean (in the present paper, we convert this to Standard Deviation (SD), in order to produce values that are more readily interpreted). The third spectral moment, more commonly called Skewness, indicates whether the spectrum has a long tail to the right of the peak (right-skewed), or a long tail to the left (left-skewed); as a result, Skewness is also an indication of the relative amount of high- vs. low-frequency energy in the selected frequency range. The fourth spectral moment, more commonly called Kurtosis, is an indication of the overall shape of the spectrum: at the extremes either ‘tall and skinny’ (leptokurtic) or ‘short and fat’ (platykurtic) as compared to the normal distribution (mesokurtic) of the same variance. This overall shape descriptor captures the real-world tendency for resonances with a narrow bandwidth to have a relatively high energy peak, and resonances with a wide bandwidth to have a relatively low energy peak (see Speaks Reference Speaks1999: Chapter 6).
In the present study, we also estimate formant values (F2, F3 and F4) at the moment of stop release. These formants are the resonances which contribute to overall spectral shape as described by the gross spectral measures just outlined, and are the key to modelling stop place of articulation. Formant resonances may not be clearly visible in the spectra of all speakers, although they may be more visible in the spectra of female speakers (Blumstein & Stevens Reference Blumstein and Stevens1979) – in the present study, all but one of our speakers are female. It is also recognized that estimation of formants at the moment of stop burst is not always reliable, due to the effect of preceding stop closure silence on linear prediction – this is why we include both the formant measures and the gross spectral measures mentioned above in the present study.
Finally, we recognize that changes in the stop burst over time also contribute to the correct perception of stop place of articulation (Kewley-Port Reference Kewley-Port1983, Kewley-Port, Pisoni & Studdert-Kennedy Reference Kewley-Port, Pisoni and Studdert-Kennedy1983). For this reason, we also present spectral time displays showing the stop spectrum at three different points in time for comparison purposes, although we do not analyse these results in detail.
2 Method
Nine speakers of Pitjantjatjara were recorded for this study, at two different recording sessions 20 years apart. The first group of speakers was recorded in a quiet room at Ernabella community in South Australia in 1990, using cassette tape (speakers KA, LB, MD, ML, MW and T1). The second group of speakers, from Areyonga community in the Northern Territory,Footnote 3 was recorded in a sound-treated room at the La Trobe University recording studio in 2010, directly to computer (speakers CC, HB and KW).Footnote 4 The data were recorded with a Neumann U87 microphone placed at a slight angle about 15–20 cm from the speaker's mouth. The microphone was connected into a Soundcraft GB8 mixer, and then onto computer via a Pro Tools 003 system. The sample rate was 44.1 kHz with a 16 bit bit-depth, and the recordings were in mono. All of the speakers in the recordings were female, with the exception of speaker MW, from Ernabella.
Two types of speech data are used in the present study. The first type is readings of isolated words, and the second type is read texts. All of the speakers read a list of words which was designed to illustrate the sounds of Pitjantjatjara in different positions in the word (i.e. word-initial and word-medial – note that word-final consonants are not permitted in Pitjantjatjara), and in different vowel contexts (i.e. preceding the three vowels of the language, /a i u/Footnote 5 ). In addition, seven of the speakers read a Pitjantjatjara version of the ‘Three Billy Goats’ story, ‘Nanikuta’, taken from a children's picture book. The three Areyonga speakers also read a Pitjantjatjara translation of ‘The South Wind and the Sun’ passage, which was first used for Central Arrernte (Breen & Dobson Reference Breen and Dobson2005) – it is called ‘Walpa Ulpariranya’ in Pitjantjatjara. Any repeated phrases were included for analysis, provided there were no disfluencies.
In the present study, only word-medial, pre-vocalic tokens are included for analysis. Word-initial tokens were excluded because the alveolar vs. retroflex contrast is neutralized in initial position. It should be noted that these word-medial stops are necessarily in unstressed position, given that the first syllable of the word is the location of primary stress in Pitjantjatjara (Tabain, Fletcher & Butcher Reference Tabain and Butcher2014).
Acoustic data were labelled by paid labellers using the EMU speech software package (http://emu.sourceforge.net/) following standard labelling techniques (see Harrington & Cassidy Reference Harrington and Cassidy1999: Chapter 4). It should be noted that in the case of the alveolar vs. retroflex distinction, data were labelled according to orthography (Goddard Reference Goddard1986, Reference Goddard1993, Reference Goddard1996) rather than according to the labeller's perception of the sound.Footnote 6
Spectral analyses of the data were based on a 10 ms Hamming-windowed Fast Fourier Transform (FFT), centred at the stop release. The spectral data were analysed using the four spectral moments – Centre of Gravity (first spectral moment),Footnote 7 Standard Deviation (second spectral moment), Skewness (third spectral moment) and Kurtosis (fourth spectral moment) – see Section 1.3, ‘Characteristic measures’, above. The reader is also referred to Forrest et al. (Reference Forrest, Weismer, Milenkovic and Dougall1988) and Harrington (Reference Harrington2010: 297–304) for explanation of how these spectral moments are calculated. Spectral data were also analysed using spectral tilt (a regression on the amplitude values as a function of frequency, as returned by the FFT). Spectral moments and spectral tilt were calculated for the frequency range 1–6 kHz, based on an initial visual inspection of the spectra and on the comparable analyses presented in Tabain (Reference Tabain2012) for the neighbouring (though unrelated) Central Australian language, Central Arrernte.
In addition, the second, third and fourth formants were estimated for the stop burst. This was done using the ESPS-based Pitch and Formant Tool in EMU, using the default settings with the following exceptions: Window was set to Hamming, and Frame Spacing was set to 5 ms. The temporal measure of stop burst duration was also included in the analysis, giving a total of nine different measures (four spectral moments, three formants, one tilt, and one duration measure).
For the nine measures analysed here, Linear Mixed Effects (LME) models were used for statistical analysis. The first set of LMEs compared the /a/ vowel context with the /i/ and /u/ vowel contexts, respectively, for each of the five stop consonants separately. The next set of LMEs compared selected pairs which previous research has suggested might be perceptually confusable: the palatal vs. velar contrast (for each of the three vowel contexts) and the alveolar vs. retroflex contrast (again for each of the three vowel contexts). The lme() function of the nlme package in the R statistical software was used for all LME analyses (R Core Team 2012) – this function also gives an estimate of the t-value and the p-value for the data being modelled. Significance was set at p < .0056, which is a Bonferroni correction of .05, given the nine measures used; we expected this to be a relatively conservative correction level. A trend was defined at p < .01. In all LME analyses, Speaker and Word/Text were set as random factors.Footnote 8
A caveat is needed with regard to the nature of the recordings. There is an effect on calculated spectral tilt and moment values depending on whether the speaker was recorded to cassette or to computer. Our visual inspection of the spectra showed a clear suppression of frequencies above about 5–6 kHz in the cassette recordings. We inspected the results separately for the two sets of recordings (Areyonga computer and Ernabella cassette recordings), and we present raw spectra for the two sets of recordings separately below. Despite the issue of different recording environments, we combined the Areyonga and Ernabella results in the statistical analyses, since the two groups appeared to pattern similarly in terms of the measures analysed (i.e. stop identity in a given vowel context).
All data were labelled using the EMU speech software version 2.3, and analyses were conducted using EMU/R version 4.2 or higher, interfaced with the R statistical package version 2.14 or higher (R Core Team 2012).
Table 1 gives the number of tokens in the present study, according to stop consonant /p t ʈ c k/, vowel context /a i u/, recording community (Areyonga vs. Ernabella) and type of recording (Wordlists vs. read Texts). It can be seen that there is a total of 4929 stop burst tokens in the database, with a roughly equal number of tokens from the Areyonga and Ernabella recordings. However, there are differences in relative numbers of Word vs. Text recordings: the Areyonga speakers have more tokens from the Text recordings, and the Ernabella speakers have more tokens from the Words recordings. The reason for this is partly because the Areyonga speakers all read two texts rather than one or none; and partly because the Areyonga speakers did not know all of the words on the wordlist, given that the wordlist had been designed for use with speakers in another community 20 years previously. Other data imbalances can also be seen in Table 1, in relation to consonants and vowels. Firstly, it can be seen that there are many more tokens of the velar /k/ and the bilabial /p/ than there are of the coronals, in particular the apicals. We expect that this reflects the lexical frequency of these sounds in the language. Secondly, it can be seen that there are generally more tokens with a following /a/ than with a following /i/ or /u/, which we again suspect reflects lexical frequency. The exceptions in the present database are that there are more tokens of /ti/ than /ta/, roughly comparable numbers of /ʈa/ and /ʈu/ tokens, and roughly comparable numbers of /ka/ and /ku/ tokens.
Number of tokens. The first row gives totals across the entire database. Subsequent rows give sub-totals according to community (Areyonga or Ernabella) and according to type of recording (Wordlists vs. read Texts). The IPA symbols in bold and the numbers in bold indicate totals.

3 Results
3.1 Spectra
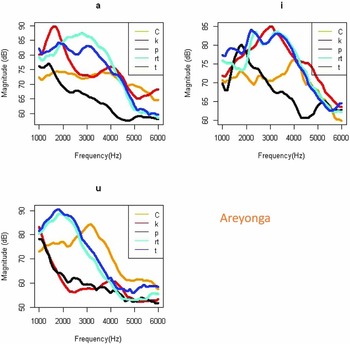
Figure 1 shows averaged spectra of the five stop bursts together on the same panel according to vowel context. It can be seen that, overall, the bilabial /p/ has comparatively little energy and a comparatively flat spectrum. It can also be seen that the two apicals /t ʈ/ are broadly similar to each other in all vowel contexts. Although it might be said that the sharp drop in spectral energy is at a slightly lower frequency for the retroflex /ʈ/ than for /t/ before /u/, and also before /a/ for the Ernabella speakers, this is not so clear before /a/ for the Areyonga speakers. Moreover, the drop in spectral energy is at a slightly higher frequency for the retroflex /ʈ/ than for /t/ before the front vowel /i/.
FFT spectra for the five stops of Pitjantjatjara, centred at acoustic stop burst. The five stops are presented on the same panel according to vowel context. Data are averaged across speakers and across items, and are presented separately according to community/recording (Areyonga and Ernabella). Only data in the 1–6 kHz range are shown. Note that here and in later figures, ‘rt’ denotes /ʈ/.


The spectra for the palatal /c/ and the velar /k/ are a little more complex and vowel dependent. In the context of /a/, /c/ has a relatively flat spectrum, with possible peaks at around 2 kHz and 3.5 kHz. The spectrum for /k/ in this context has more energy in the lower frequencies, with peaks at around 1.5 kHz and 3–4 kHz (the second peak being higher for the Areyonga speakers than for the Ernabella speakers). In the context of /i/, /k/ again has more energy than /c/, with the main /k/ peak at around 3 kHz and the main /c/ peak at around 3.5–4 kHz (again, a little higher for the Areyonga speakers). In the context of /u/, however, the difference between /c/ and /k/ is striking, with overall energy levels reversed: /c/ has much more spectral energy in this context than does /k/, with a main spectral peak of around 3–3.5 kHz for /c/, while there appear to be two peaks for /k/ (one at around 1 kHz and one at around 4 kHz).
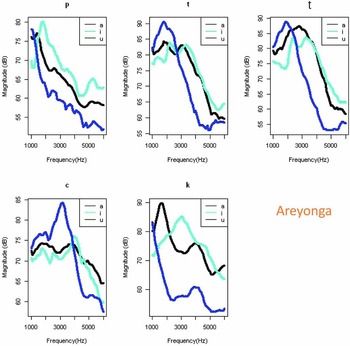
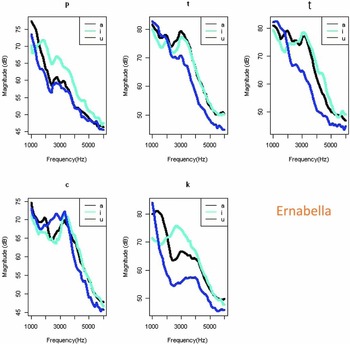
Figure 2 shows averaged spectra of the five stop phonemes separately with the three vowel contexts on each panel. These are the same spectra as those in Figure 1, but have been grouped differently for ease of exposition. It can be seen in Figure 2 that /p/ has the greatest intensity in the context of /i/. It can also be seen that the drop in spectral energy is at a much lower frequency for both /t/ and /ʈ/ in the context of /u/; this drop in spectral energy may also be at slightly higher frequency in the context of /i/ as opposed to /a/. The differences according to vowel context for /c/ are more striking for the Areyonga speakers than for the Ernabella speakers: the shift in the main spectral peak between 3 kHz and 4 kHz according to vowel context is clearer for the Areyonga speakers. The spectral peak for /u/ is particularly narrow and high in energy for the Areyonga speakers. Finally, for /k/, clear differences according to vowel context are seen for both the Areyonga and the Ernabella speakers: there are two peaks in the given frequency range in the context of /a/, and one dominant peak at around 3 kHz in the context of /i/. There is much less energy in the context of /u/, with a large frequency peak at around 1 kHz and a much less intense peak at 4 kHz.
FFT spectra for the five stops of Pitjantjatjara, centred at acoustic stop burst. Three vowel contexts are presented on the same panel for each stop. Data are averaged across speakers and across items, and are presented separately according to community/recording (Areyonga and Ernabella). Only data in the 1–6 kHz range are shown.


3.2 Spectral and temporal measures by consonant and vowel context
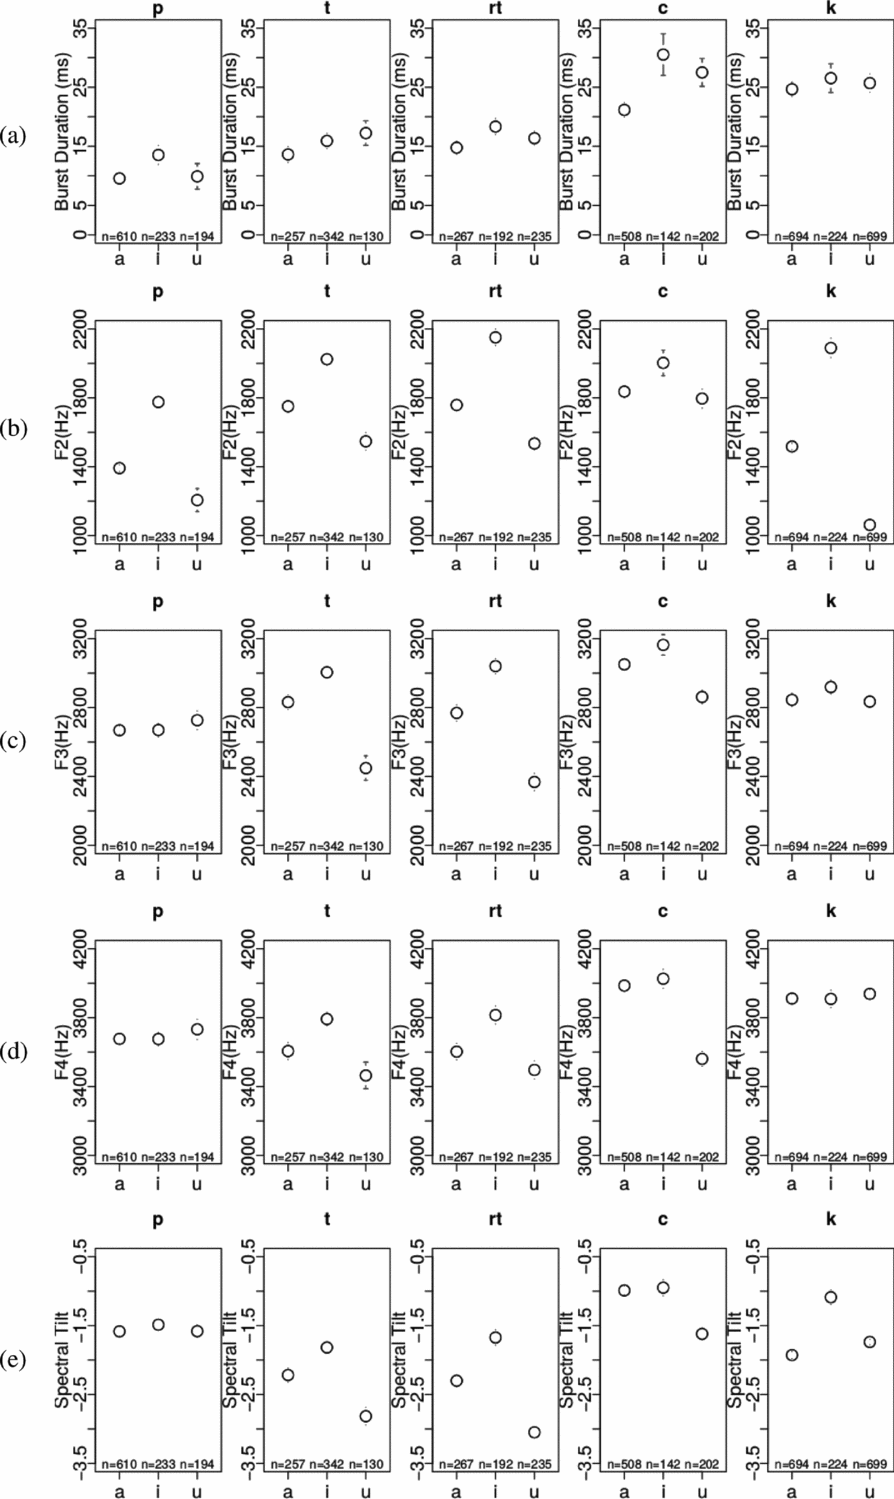
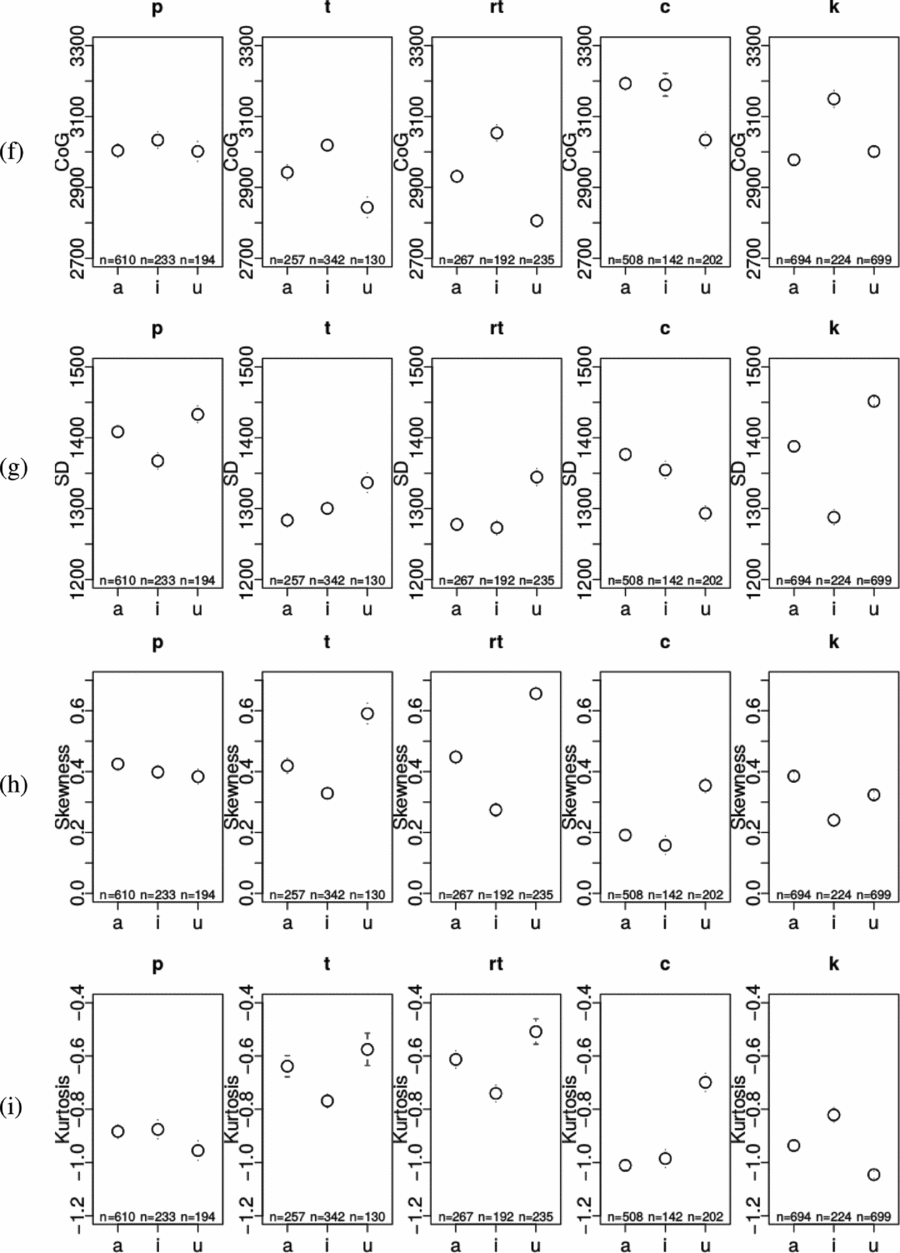
Figure 3 gives plots of the nine spectral and temporal measures for each stop separately according to vowel context. Table 2 gives results of the LME analyses. It can be seen that the burst duration for /p/ is around 10 ms, while for the apicals /t/ and /ʈ/ it is a little higher at around 15 ms. The burst duration for the palatal varies between about 20 ms and 30 ms, being much higher in the context of the high vowels. The burst duration for /k/ tends around 25 ms, which is similar to /c/, but is less dependent on vowel context. The reader is reminded that these values are for stops in unstressed syllables.
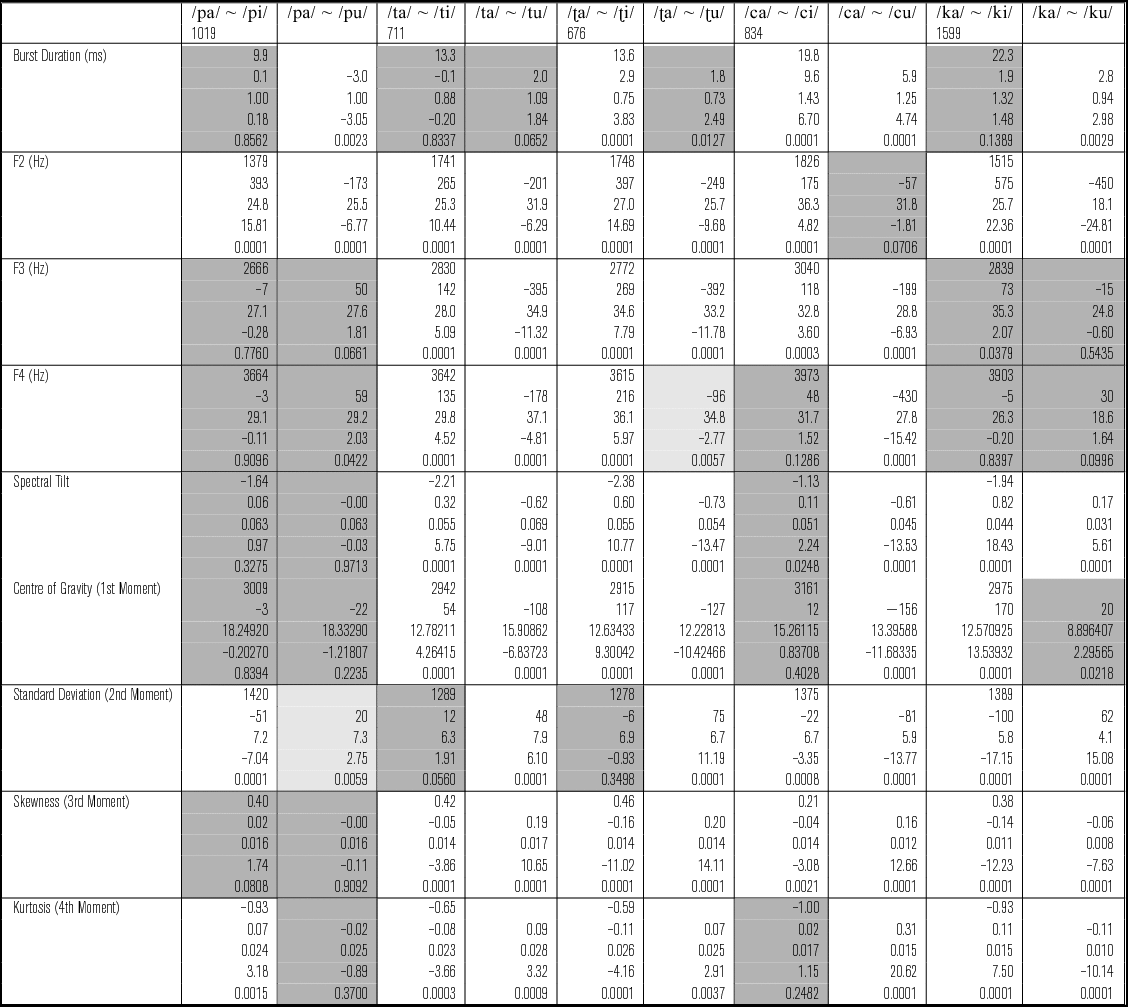
Results from a Linear Mixed Effects model for each consonant by vowel context, with Speaker and Word/Text set as random factors. For each consonant, the reference vowel context is /a/; the comparison with /i/ is given in the left-hand column for each consonant, and the comparison with /u/ is given in the right-hand column. The degrees of freedom for each consonant are given in the top row of the left column for each consonant, and the estimated mean for each measure in the /a/ context is the first value in the left column for each measure. The subsequent values for each cell are: the difference between the means in the two vowels contexts (/a/ vs. /i/ and /a/ vs. /u/); the standard error of the difference; the estimated t-value; and the estimated p-value. Significance was set at p < .0056 (Bonferroni correction of .05 for nine measures), and a trend (shaded light grey) was set at p < .001. Dark-shaded cells give non-significant results; light-shaded cells denote a trend.

Plots of means and 95% confidence intervals for each of the nine measures examined in the present study. Data for each consonant are presented in a separate panel, with three vowel contexts in each panel. Number of tokens is also given in each panel. (a) Burst duration (b) F2 (c) F3 (d) F4 (e) Spectral tilt (f) Centre of Gravity (g) Standard Deviation (h) Skewness (i) Kurtosis.


Although there are several statistically significant results for the stop burst duration, it is not clear that they would meet the Just Noticeable Difference threshold (Quene Reference Quene2007). The likely exception is for the palatal /c/, where the stop burst is about 50% longer for /ci/ than for /ca/, and about 25–30% longer for /cu/ than for /ca/.Footnote 9
As might be expected, there are many significant results for F2. In all cases, F2 is higher in the context of /i/ and lower in the context of /u/, relative to /a/, with only the /ca/ vs. /cu/ contrast failing to reach significance. The results for F3 are also clear and complementary, but with some differences: there are no statistically significant results for /p/ or for /k/. For the other stops, the patterns are the same as for F2, with a higher F3 in the context of /i/ and a lower F3 in the context of /u/, relative to /a/. The results for F4 are almost identical to the results for F3 (i.e. no significant results for /p/ or /k/), with the addition of no significant difference between /ca/ and /ci/.
The results for spectral tilt also distinguish the different vowel contexts for the coronals /t ʈ c/ and for the velar (there is once again no significant difference for /p/). For both of the apicals, spectral tilt is lowest in the context of /u/ and highest in the context of /i/. For the palatal, /cu/ has a lower spectral tilt value than /ca/, with /ca/ and /ci/ having comparable values. For the velar, /ki/ has the highest spectral tilt value and /ka/ the lowest, with /ku/ in between but closer to /ka/.
The results for Centre of Gravity (CoG) are very similar to the spectral tilt results, i.e. highest in the context of /i/ and lowest in the context of /u/ for the apicals, with no significant difference between /ca/ and /ci/, but a significantly lower CoG for /cu/. In addition, there is no significant difference between CoG for /ka/ and /ku/.
The results for SD differ according to consonant. For /p/, SD is significantly lower in the context of /i/. For the two apicals, SD is significantly higher in the context of /u/. For the palatal, SD is significantly lower for /ci/ than for /ca/, and significantly lower still for /cu/. For the velar, SD is significantly higher for /ku/ than for /ka/, and significantly lower for /ki/ than for /ka/.
The results for Skewness are significant for all consonants except /p/. For all three coronals /t ʈ c/, the Skewness value is significantly lower in the context of /i/, and significantly higher in the context of /u/, relative to /a/. However, the difference in values is much greater between the /i/ and /a/ contexts for the apicals than for the palatal. It should be noted that all of the Skewness values are positive, which denotes a right-skewed distribution. The /u/ contexts could therefore be said to be the most right-skewed. The results for /k/ are different from the coronal results: for /k/, the highest Skewness value is for /ka/, and the lowest is for /ki/, with /ku/ in between but still significantly less than /ka/.
Finally, for Kurtosis, there are once again many significant differences according to vowel context. For /p/, the differences are small, but the Kurtosis value is significantly higher for /pi/ than /pa/, suggesting a more tall and narrow spectrum in this context. For the two apicals, the Kurtosis value is significantly lower in the context of /i/ and higher in the context of /u/, relative to /a/. The results for the palatal show higher Kurtosis values for /cu/ compared to /ca/, with no difference between /ci/ and /ca/. These results suggest that for all three coronals, the spectrum is more tall and skinny in the context of /u/. For the velar, however, the results are the opposite of the coronal results: in this case the Kurtosis values are higher for /ki/ and lower for /ku/, compared to /ka/ – this means that the tallest and skinniest spectrum is for /ki/, and the shortest and fattest spectrum is for /ku/.
3.2.1 Summary
To summarize, differences in burst duration according to vowel context were greatest for the palatal /c/. All of the consonants showed effects of vowel context on F2, but only the coronals showed effects of vowel context on F3 and F4. It is notable that /k/ did not show effects of vowel context on F3 or F4.
For all of the coronals, Tilt and CoG were much lower in the context of /u/, and Skewness and Kurtosis were much higher, suggesting a more right-skewed, tall and skinny spectrum, with the spectral balance shifted downwards and a very steep tilt. In addition, for the apicals /t ʈ/, Tilt and CoG were much higher in the context of /i/, and Skewness and Kurtosis were much lower, suggesting a more short and fat spectrum with the spectral balance shifted upwards and a less steep tilt. The three vowel contexts are therefore very clearly differentiated for the apicals.
On several measures, there was no or minimal difference between the /a/ and /i/ contexts for the palatal /c/: there were no differences in F4, Tilt, CoG and Kurtosis, and the difference in Skewness was very small. These results strongly suggest that the /ca/ and /ci/ spectra are similar and that the /cu/ spectrum is quite different (i.e. as for the apicals, the /cu/ spectrum is more tall and skinny, with the spectral balanced shifted downwards and a very steep tilt).
The Tilt and spectral moment measures are different for the velar /k/ as compared to the coronals. For the velar, the /a/ and /u/ contexts tend to pattern together, rather than /a/ and /i/ patterning together. Broadly speaking, /ka/ and /ku/ have lower Tilt values and lower CoG values, suggesting a downwards shift in spectral balance and a steeper tilt, compared to /ki/. /ka/ and /ku/ also have higher Skewness and lower Kurtosis values compared to /ki/, suggesting a more right-skewed spectrum, but also more short and fat, rather than tall and skinny. It therefore appears that the /u/ context stands out for /c/, while the /i/ context stands out for /k/.
3.3 Spectral and temporal measures: Specific comparisons
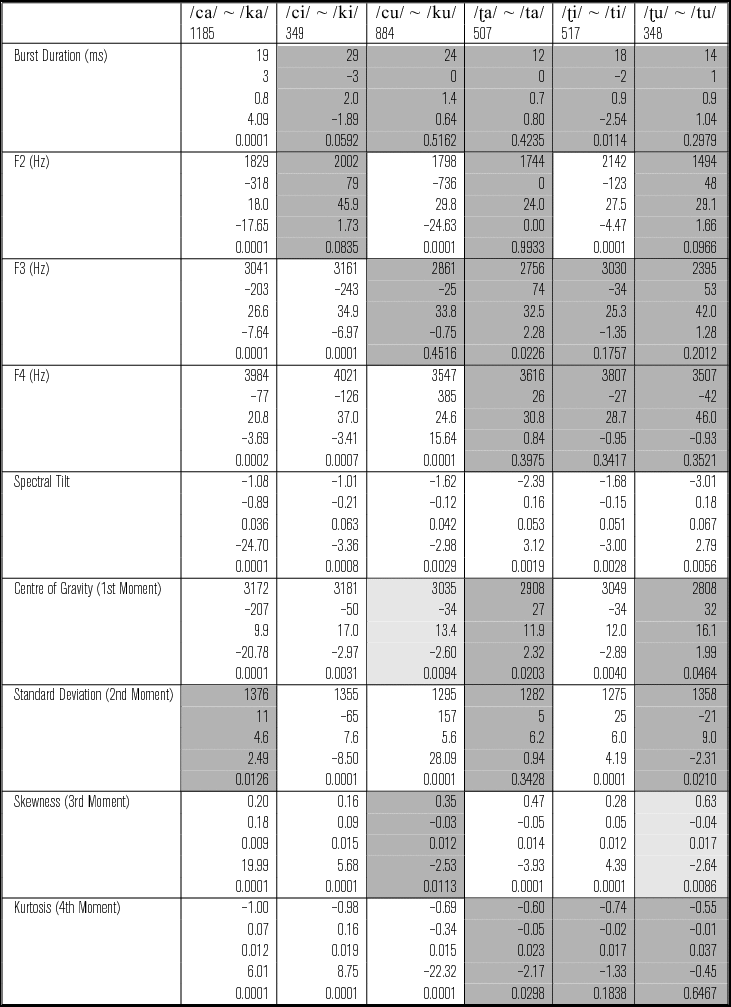
Table 3 gives results of the LME analyses for the apical (alveolar vs. retroflex) and palatal vs. velar comparisons. It can be seen that the only significant difference in burst duration is for /ca/ vs. /ka/, with /ka/ having a longer duration than /ca/.
Results from a Linear Mixed Effects model for specific consonant contrasts in each vowel context, with Speaker and Word/Text set as random factors. The degrees of freedom are given in the top row for each CV pair. The estimated mean for the first CV pair in each column is the first value in the cell for each measure. The subsequent values for each cell are: the difference between the means of the CV pair; the standard error of the difference; the estimated t-value; and the estimated p-value. Significance was set at p < .0056 (Bonferroni correction of .05 for nine measures), and a trend (shaded light grey) was set at p < .001. Dark-shaded cells give non-significant results; light-shaded cells denote a trend.

3.3.1 The apical contrast
Regarding the apical contrast, the only significant difference in formant values is for F2 in the context of /i/, and in this case, F2 is actually higher for the retroflex /ʈ/, rather than for the alveolar /t/, as may have been expected. There are also significant differences in Tilt between the two apicals, with Tilt being higher for /t/ (less steep) in the contexts of /a/ and /u/, and lower (more steep) in the context of /i/. The CoG and SD measures are also different in the context of /i/: comparably to F2 results, CoG is higher for the retroflex /ʈ/ than for the alveolar /t/ in this context. There are no differences in Kurtosis between the two apicals, but there are differences in Skewness, with /t/ having higher Skewness values (more right-skewed) in the context of /a/ and /u/, and lower Skewness values in the context of /i/.
To summarize, there are differences in Tilt and Skewness for the apicals, with the retroflex /ʈ/ being more right-skewed and having a steeper tilt in the context of /a/ and /u/, and being less right-skewed and having a less steep tilt in the context of /i/. These reflect some of the subtle differences observed in the spectra in Figure 1: the retroflex burst seems to be more alveolar than the alveolar in the context of /i/, as reflected not just in the Tilt and Skewness results, but more tellingly in the F2 and CoG results.
3.3.2 Palatal vs. velar
For the palatal vs. velar contrast, there are many more significant results in the formants than there are for the apicals. The velar /k/ has significantly lower F2 values than the palatal in the context of /a/ and /u/, but not /i/, and significantly lower F3 values than the palatal in the context of /a/ and /i/, but not /u/. Similarly to F3, F4 is lower for the velar in the context of /a/ and /i/, but it is higher for the velar than the palatal in the context of /u/. It could therefore be said that for the velar, all formants are lower in the context of /a/, whereas in the context of /i/, only F3 and F4 are lower. In the context of /u/, F2 is lower for the velar, while F4 is higher.
The velar also has lower Tilt and CoG values than the palatal, suggesting a steeper slope and a shift in spectral balance to lower frequencies; however, the difference is much greater in the context of /a/ than in the context of /i/ and /u/. The velar also has higher Skewness and Kurtosis values than the palatal in the contexts of /a/ and /i/, but it has a lower Kurtosis value in the context of /u/ (so in the context of /a/ and /i/, the velar is more right-skewed and more tall and skinny than the palatal; but in the context of /u/, it is the palatal that is more tall and skinny than the velar).
To summarize, it can be said that for the velar, the /ka/ and /ku/ contexts are more similar in terms of burst spectrum, while for the palatal, the /ca/ and /ci/ contexts are more similar. This is most clearly reflected in the Tilt and CoG results, which pattern together, and which show a concentration of energy in lower frequencies for /ka/ and /ku/, and in higher frequencies for /ca/ and /ci/. For /ki/, the concentration in energy moves to higher frequencies, comparable to /ci/; and for /cu/, the concentration in energy moves to lower frequencies, comparable to /ku/. It can therefore be said that the contrast between the two stop bursts is clearest in the context of /a/, again as might be expected.
3.4 Spectral time displays
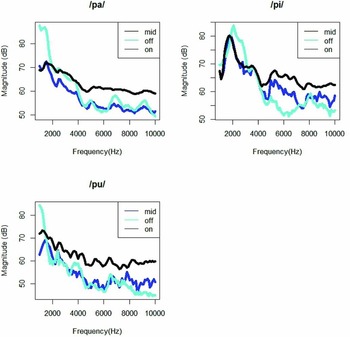
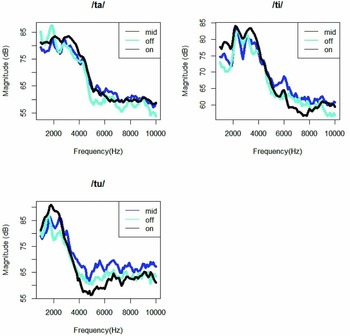
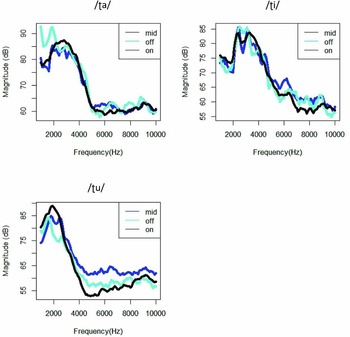
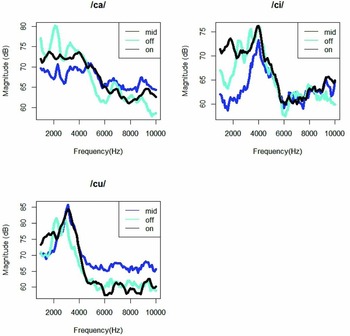
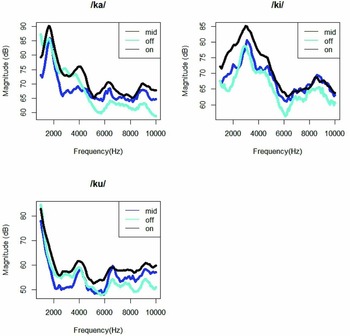
Figure 4 shows averaged stop burst spectra sampled at three points in time: at the onset of the stop burst (as shown in previous figures), at the midpoint of the total burst/aspiration portion, and at the offset of this portion (i.e. at the onset of regular voicing for the following vowel). Spectra are presented for each stop separately, and also for each vowel context separately. In this figure, the spectra are shown up to 10 kHz. Data are only shown for the Areyonga speakers, since the cassette recordings for the Ernabella speakers suppressed the frequency range above about 5–6 kHz. For completeness, all five stops are shown here, though we focus our discussion on the palatal and the velar.
FFT spectra sampled at three points in time for each stop burst in each vowel context: onset (black), midpoint of the burst (blue), and offset of the burst (light blue). Spectra are shown in the 0 kHz to 10 kHz range. Data are for Areyonga speakers only, and are averaged across speakers and across items.


It can be seen that in the context of both /a/ and /u/, there are clear differences in the 6–10 kHz range between the palatal and the velar. Whilst for the palatal there is greater energy at the midpoint of the burst/aspiration portion than at the onset, the opposite is true for the velar, with a drop in energy in this frequency range. In the context of /i/, the palatal once again has greater energy in the 6–10 kHz range at the midpoint of the burst/aspiration than at the onset, while the velar seems to maintain the same level of energy. Although more careful aerodynamic-acoustic studies are needed, these results suggest that while both the palatal and the velar may be affricated in the context of /i/, only the palatal is affricated in the other two vowel contexts.Footnote 10 Such a result suggests that temporal changes in the spectrum are less useful in the context of /i/, and that static spectral differences at the moment of stop burst are more crucial for the contrast between the palatal and the velar in this vowel context.Footnote 11
4 DISCUSSION
The present results confirm that there are minimal differences between the alveolar and the retroflex in terms of spectral burst. The acoustic results for the /a/ and /u/ vowel contexts suggest that the retroflex /ʈ/ may be released at a slightly posterior location than is the alveolar /t/. However, in the context of /i/, results suggest that the retroflex /ʈ/ is released at a more anterior location in articulatory terms than is the alveolar /t/. This is perhaps the most unexpected result of the present study, and to us suggests an overshoot of the articulatory target, with the more forward tongue body position for the vowel projecting the tongue tip beyond the target. This raises the question of where precisely the articulatory target for the retroflex is located. If the target is beyond the palate, it is not likely to be overshot. It is possible that the target for the retroflex, as opposed to the velar or palatal place of articulation, does not lie beyond the palate. In addition, given previous results for the alveolar vs. retroflex contrast cited above (i.e. the high degree of variability – both inter- and intra-speaker – and overlap for these two sounds, with the alveolar at times having retroflex characteristics, and the retroflex at times having alveolar characteristics, with intermediate articulations evidenced as well – see Tabain Reference Tabain2009), it is possible that the target for the alveolar also does not lie beyond the palate. At the very least, our acoustic data suggest that regardless of where the virtual target lies for the retroflex, the trajectory of the target is specified not only in the high–low dimension, but in the front–back dimension as well (Perrier et al. Reference Perrier, Payan, Zandipour and Perkell2003, Proctor et al. Reference Proctor, Bundgaard-Nielsen, Best, Goldstein, Kroos and Harvey2010). Data such as these provide some explanation for why retroflexes are not cross-linguistically common in the context of /i/ – if at the right edge (i.e. at stop release) they are more alveolar than the prototypical alveolar, this is potentially contradictory to the retroflexion cues at the left edge (i.e. stop closure), assuming that such cues are present in a given production.
The present results also confirm the spectral patterns seen in Central Arrernte for the alveolar and the retroflex in a central vowel context. In Pitjantjatjara, these sounds have a broad spectral peak which drops off at about 4 kHz in the context of /a/, and also in the context of /i/; however, in the context of /u/, this drop-off occurs at a lower frequency. This lower frequency in the context of /u/ suggests that as the tongue body is pulled back in anticipation of the vowel, the release of the tongue tip occurs in a more posterior location. It should be noted that in both Arrernte and Pitjantjatjara, these apical bursts do not fit the ‘diffuse-rising’ spectrum of English alveolars; although articulatory-to-acoustic modelling studies would be needed, it is possible that a more strictly apical articulation in Australian languages (i.e. using a smaller portion of the tongue against the palate) contributes to these differences, allowing for lower frequency resonances to be generated/enhanced.
As regards the palatal vs. velar contrast, we have seen once again that this contrast is clearest in the context of the /a/ vowel (as is also the case for the alveolar vs. retroflex contrast). In addition, the spectral time displays (in Figure 4 above) showed that there are some similarities between the palatal and the velar in the context of /i/, in the sense that both have a relatively high level of energy above 6 kHz at the midpoint of burst/aspiration noise. This suggests affrication of the noise source. Although affrication is present for /c/ in the context of /a/ and /u/ as well, this is not the case for the velar /k/. Given that both /c/ and /k/ may be affricated before /i/, it can be argued that the maintenance of spectral differences at stop burst is all the more crucial in this vowel context.
However, one important factor in the situation of Australian Aboriginal languages would suggest that the maintenance of spectral differences at stop burst is crucial in all vowel contexts, not just /i/, and that affrication may be useful only minimally. That factor is the very high incidence of hearing loss due to chronic middle ear infection in Australian Aboriginal communities (Stoakes et al. Reference Stoakes, Butcher, Fletcher and Tabain2011). Long Term Average Spectra from speakers of Pitjantjatjara and another (northern) Australian language, Yolngu Matha, show much less energy in higher frequencies compared to Australian English speech from the same speakers. Indeed, it has been noted that most Australian languages do not contain fricatives (Dixon Reference Dixon1980, Reference Dixon2002; Butcher Reference Butcher, Harrington and Tabain2006), many of which are defined by the presence of very high frequency noise. It is therefore quite possible that frequencies above about 5 kHz are less relevant for the perception of speech sounds in Pitjantjatjara than in English. If speakers do not have available to them frequencies above about 4–5 kHz due to hearing loss (which occurs at a very young age), it becomes all the more crucial to differentiate the palatal and velar stops in the lower frequencies as examined in the present study. In this case, the broad spectral differences of lower Tilt values and lower CoG values for the velar as opposed to the palatal (reflecting a concentration of energy in lower parts of the spectrum) become all the more crucial.
Our present results also provide some support for Schwartz et al.'s (Reference Schwartz, Boe, Badin and Sawallis2012) model for formant cavity affiliations for different stop places of articulation. In their model, which is based on a central vowel context, F2 becomes lower as the velar articulation moves further back, but variability increases the further back the velar articulation. F3 is relatively stable in the velar region in Schwartz et al.'s model, while F4 reaches a local peak in the back velar region after a local minimum in the palatal region (it then begins to decline as the articulation becomes more uvular).Footnote 12 In the present study, F2 for the velar is certainly lower than for the palatal in the context of /a/ and /u/ (but not /i/). This supports the observations by Butcher & Tabain (Reference Butcher and Tabain2004) that place of articulation is further back for the velar in these particular vowel contexts in Australian languages. F3 is lower for the velar than for the palatal in the contexts of /a/ and /i/ (but not /u/) – this suggests that in the case of the palatal, the front cavity is kept small by the relatively large extent of tongue contact along the palate (since F3 is a front cavity resonance for the palatal). It is possible that in the case of /u/, it is difficult to keep F3 high for the palatal due to lip rounding, and this may also be why F4 is lower in the /cu/ context as well. F4 in the context of /u/ is higher for the velar than for the palatal, whereas in the context of /a/ and /i/ it is higher for the palatal than for the velar. Exactly how these differences in F4 might be controlled for palatal vs. velar articulations in different vowel contexts is a topic for further study.
It is clear that there is a complex interplay of possible formant cues to the palatal vs. velar contrast in Pitjantjatjara, and that F4 may be recruited for this contrast in addition to F2 and F3. The extra low F2 for the velar in /a/ and /u/ contexts in Australian languages is also important. It should be noted that overall, the spectrum for the velar in all vowel contexts is quite dark compared to the palatal, with energy concentrated in the lower frequencies for the velar.
Before concluding, we would like to make two speculations based on the spectra for /c/ and /k/. The first speculation is that the spectrum for /c/ in the context of /u/ is strikingly different, particularly for the Areyonga speakers – it has a much higher-energy, more narrow-banded spectral peak (this is reflected in higher kurtosis values, which are also observed for the Ernabella speakers). This result is reminiscent of Shadle & Scully's (Reference Shadle and Scully1995) findings for /s/ in the context of /u/, which suggest a whistle-like source mechanism – it is possible that a long flat front tongue shape at the moment of /c/ release, coupled with lip-rounding, produces a similar result in some cases in Pitjantjatjara.Footnote 13 It should be noted that other spectral moment results, such as CoG and Skewness, suggest that the spectral weight moves to the lower frequencies for /c/ in the context of /u/, as is the case with the other stops as well, so this ‘whistle’ effect is at a slightly lower frequency.
Our second speculation concerns the question of possible airflow in the palatal vs. the velar. Given the affrication in the context of /i/ for both sounds, it is likely that the turbulent airflow in both cases meets a direct obstacle at the (upper and/or lower) teeth – a relatively long extent of tongue–palate contact in a relatively anterior position in the oral cavity facilitates this (see Shadle Reference Shadle1985, Stevens Reference Stevens1998). However, given the greater high-frequency spectral differences in the context of /a/ and /u/, it is likely that only the palatal has a direct obstacle at the teeth in these vowel contexts, whereas the velar has an oblique obstacle to airflow at the palatal incline at the moment of stop release. Further acoustic and aerodynamic modelling of these sounds will elucidate this question.
Finally, we would like to note that we have examined many spectral measures in this study, and we have speculated as to the articulatory reality behind the observed patterns. However, only articulatory studies (e.g. electro-palatography, magnetic resonance imaging or electro-magnetic articulography) can give a better understanding of precisely how these various stop sounds are articulated in the various vowel contexts. It also remains to be seen to what extent the more gross spectral measures such as Tilt, CoG, Skewness and Kurtosis contribute to the perception of these various stop bursts in Pitjantjatjara, as opposed to the more specific resonance measures of F2, F3 and F4. Further perceptual studies of these sounds in different vowel contexts will elucidate this question.
Ackowledgements
We are extremely grateful to the Australian Research Council for funding this research over many years. We would like to thank our speakers for their participation – Charmaine Coulthard, Hilda Bert and Kathleen Windy from Areyonga, and Lucy Brown, Kanytjupai Armstrong, Margaret Dagg, Manyiritjanu Lennon, Tinimai and Mike Williams from Ernabella. We would also like to thank Anna Parsons, Adele Gregory and Marg Purdam for help with various stages of this research, and three anonymous reviewers and editor Adrian Simpson for their comments. Palya.