1 Introduction
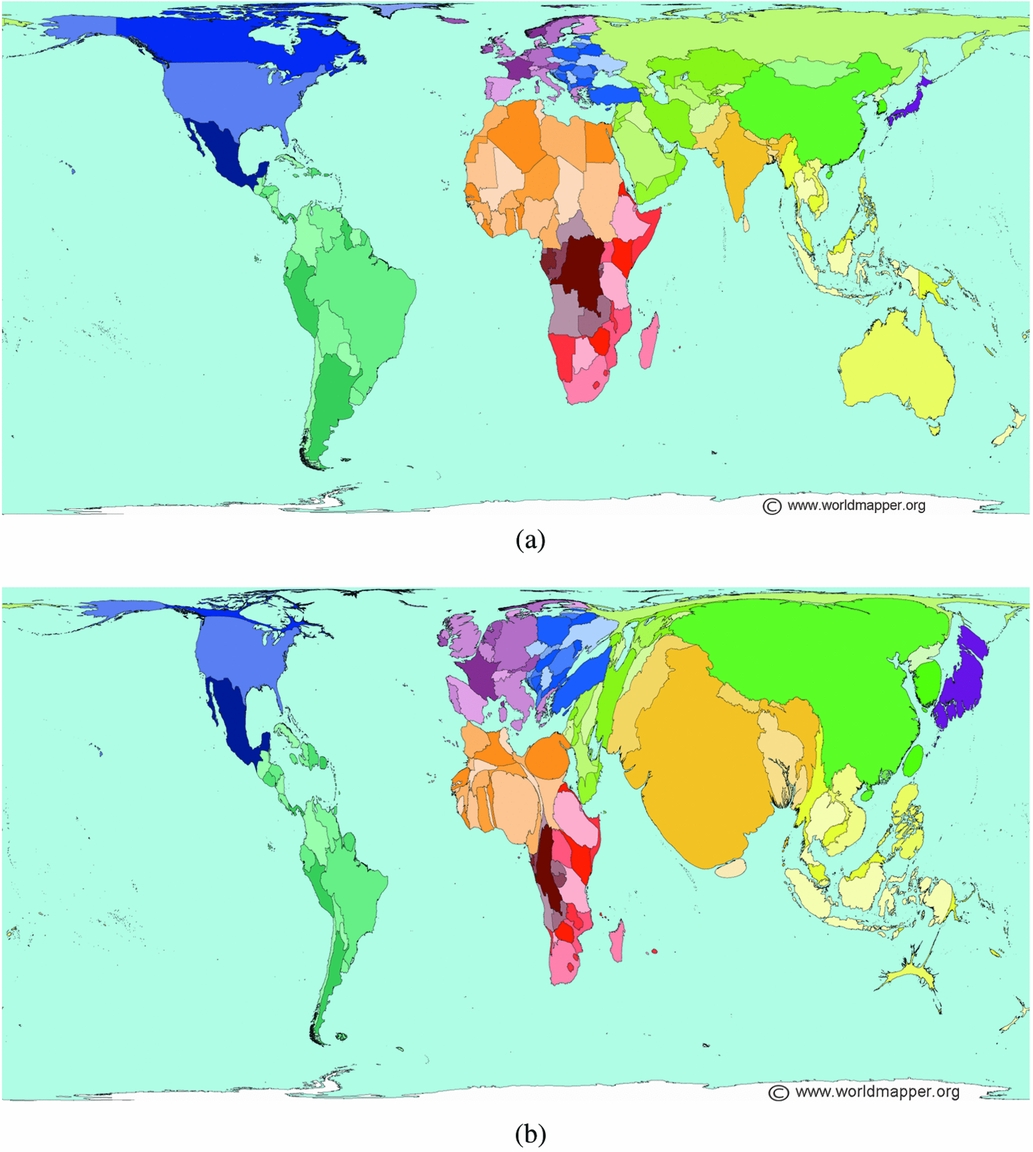
Density-equalizing maps allow familiar spatial maps to display non-spatial information. For example, the maps in the The Atlas of the Real World (Dorling, Newman & Barford Reference Dorling, Newman and Barford2008) represent quantitative information such as population, education, and access to the Internet by altering the area of countries on a world map. The resulting cartograms are likely to be more intuitive than a table of numbers to viewers who have already gained experience with the distribution of countries on a world map, and they enable a visual gestalt impression of similarities and differences between regions. Figure 1 shows two maps from worldmapper.org (Dorling, Barford & Newman Reference Dorling, Barford and Newman2006), one where area represents land area (as expected in equal-area projection world maps), and one that has been warped so that area represents population. The fact that many of the countries in the population map are still recognizable by their distorted shape and/or position is what makes the cartogram effective.
Maps used by permission from worldmapper.org: (a) equal area representation of Earth's surface; (b) population cartogram (equal density representation).

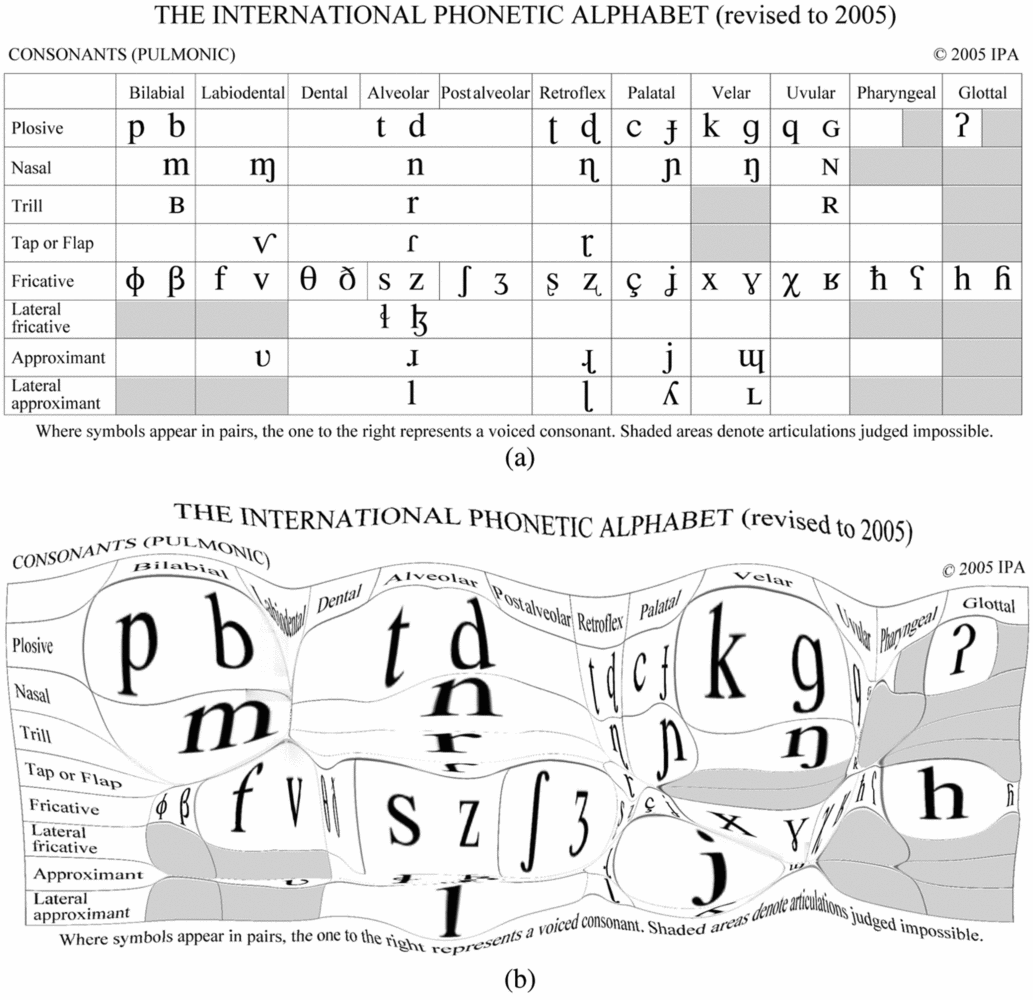
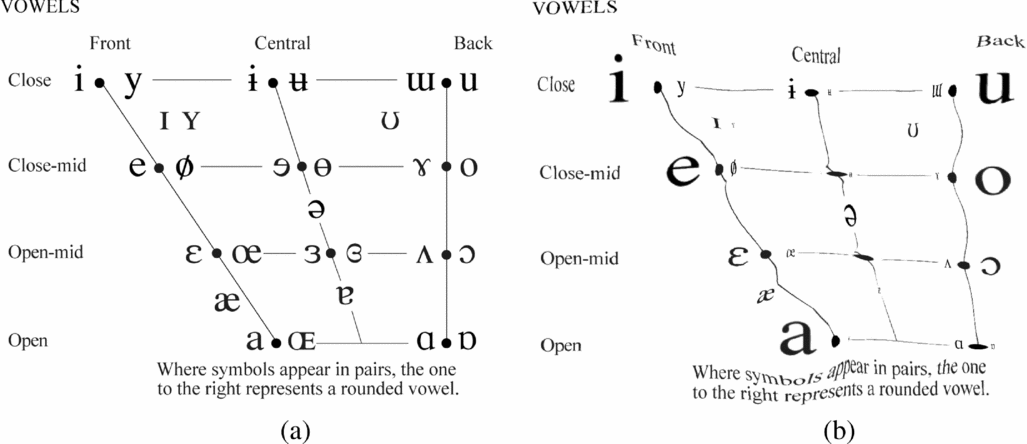
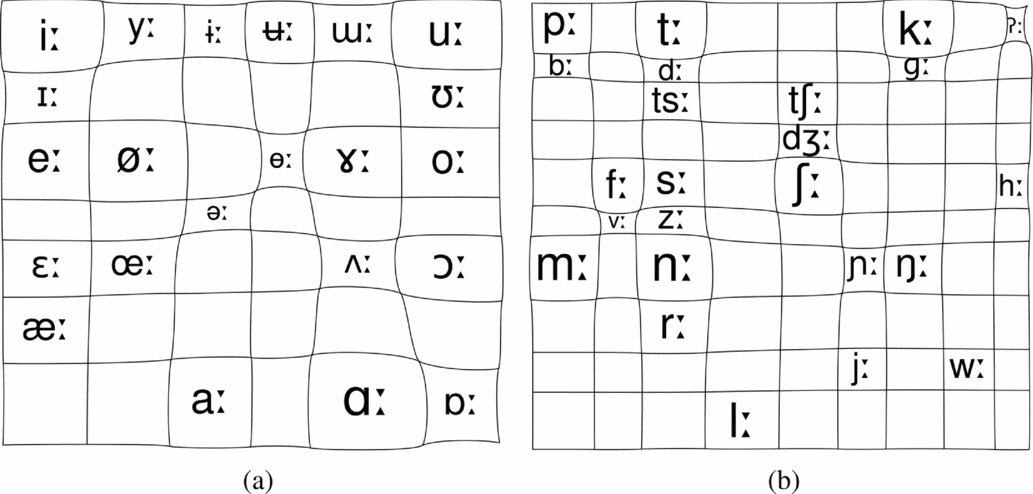
Like a world map, the International Phonetic Alphabet chart involves familiar spatial relationships. Typically the position of an IPA symbol reflects its place and manner or backness and height, and the area of the cell containing the symbol (in the consonant chart) is arbitrary. Familiarity with the position of symbols in the chart can be seized upon to use cell area to display other information, such as crosslinguistic frequency.Footnote 1 Figures 2 and 3 show the official 2005 IPA consonant and vowel charts, and their density-equalized counterparts, where the cell surrounding each symbol reflects its frequency in the phoneme inventories of P-base (Mielke Reference Mielke2008, Mielke & Brohan Reference Mielke and Brohan2013), a database of phonological patterns (described below) which includes inventories for several hundred languages.
IPA pulmonic consonant chart: (a) original; (b) warped by frequency in a phonological database.

IPA vowel chart: (a) original; (b) warped by frequency in a phonological database.

This paper describes the method for making density-equalizing maps depicting typological data, discusses some of the issues involved in determining the set of categories to include and how to count the instances of them, and highlights some of the interesting patterns that are apparent in this type of visualization. The goal of this work is to use density-equalizing IPA maps to aid exploratory analysis of typological data, in order to uncover patterns and develop hypotheses that can be followed up with more narrowly targeted analysis methods. The paper illustrates patterns involving absolute and relative frequency of phonological segments and phonological patterns involving them, and discusses the implications of some of the methodological choices. Possible accounts for some of the patterns that are apparent in the figures are considered in the discussion.
2 IPA maps of segment frequencies
This section introduces density-equalizing maps for visualizing phonetic segment frequency. This involves describing the details of making diffusion-based cartograms with phoneme frequencies and also the phoneme frequencies that serve as inputs. A few methodological issues are considered, and several maps illustrate the frequency of basic consonants and vowels.
2.1 Diffusion-based density equalization
Many algorithms have been proposed to generate density-equalizing maps, e.g. by dividing maps into cells (Tobler Reference Tobler1963, Reference Tobler1973; Appel, Evangelisti & Stein Reference Appel, Evangelisti and Stein1983; Dougenik, Chrisman & Niemeyer Reference Dougenik, Chrisman and Niemeyer1985), with masses and springs (Kocmoud Reference Kocmoud1997), and continuous functions (Gusein-Zade & Tikunov Reference Gusein-Zade and Tikunov1993, Gastner & Newman Reference Gastner and Newman2004). Gastner & Newman's algorithm (used here) achieves uniform density across the map by mimicking diffusion in physical systems: the original population of the map is described by a density function which is allowed to diffuse (Gastner & Newman Reference Gastner and Newman2004: 7500). After diffusion is complete, the displacement of each point in the map defines the projection that is necessary for equal density across the map. This algorithm is implemented in the C program cart (Newman Reference Newman2006), which takes as input a matrix of densities and produces a transformation from points in the original matrix to points in a density-equalized matrix. A utility interp is used to apply the transformation.
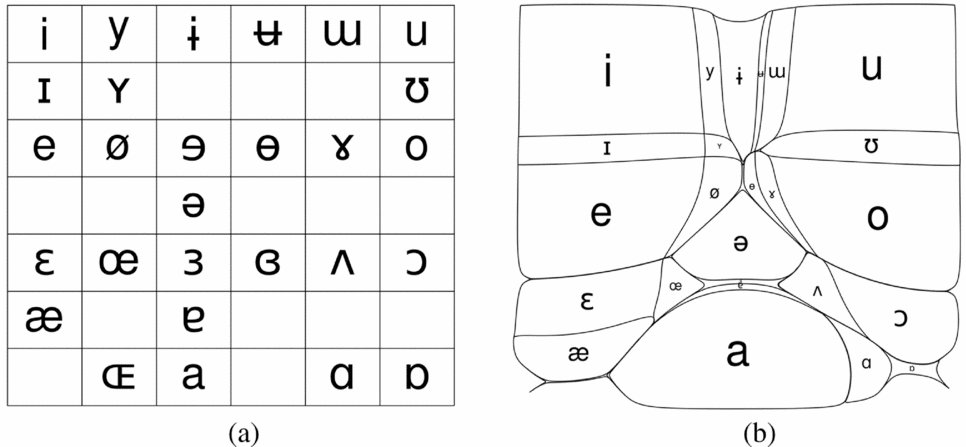
In the case of IPA charts, the starting point is a table of phones with a value for each cell reflecting the phone's frequency. All the steps of the process, from looking up segment frequencies to creating and warping a table and then drawing it, are managed by a script written in the Python language. Prior to submitting the table to cart for warping, the row and column widths are adjusted to reflect the mean row and column frequencies, respectively. This initial step redistributes some of the density, and affects the shape and position, but not the size of the cells in the final density-equalized map, making the IPA chart's rows and columns easier to recognize. The frequency table is then projected onto an 800 × 800 matrix of densities,Footnote 2 which includes a rectangular region of values for each cell. Between the phone cells and the edges of the matrix, the values are set to the mean density of the entire rest of the matrix, so that when the map is transformed, this area has a neutral impact on the cells with their own values. The sea in the map in Figure 1b is treated in the same way. cart then makes a transformation based on the densities in the matrix, mapping any point in the 800 × 800 grid onto a new point in the transformed grid. The polygons indicating each cell, which start out as trivially rectangular, change shape as they are transformed. The transformed polygons and cell labels are plotted using R (R Core Team 2015). Each label appears at the transformed location of the center of its cell, and the font size is scaled by the square root of the cell area. Figure 4 shows a table of vowels before and after transformation. As the density across the map is equalized, areas of high density, such as the cell for [i],Footnote 3 expand, and areas of low density, such as [ʏ], shrink, and some, such as [ɞ], disappear completely.Footnote 4 This procedure works for any given set of input density values in any configuration. How well the resulting map reflects phonetic facts depends on a number of choices about how to count occurrences of phonetic segments, how to arrange them, and which to include. Some of these choices have answers that are inherent in the IPA transcription system, and some do not. These issues are discussed in the next section.
Vowel chart before and after transformation: (a) before transformation (equal area); (b) after transformation (equal density).

2.2 Methods for counting segment frequency in typological databases
Methodological prerequisites to generating the maps include choosing a source of frequencies, sampling procedures, and dealing with different kinds of relationships that can exist between similar transcriptions.
2.2.1 Databases
Much of what is currently known about the typology of phonological inventories is based on the UCLA Phonological Segment Inventory Database (UPSID), compiled by Ian Maddieson and colleagues. The UPSID database was published with 317 languages in Ian Maddieson's Patterns of Sounds (Maddieson Reference Maddieson1984), later expanded to 451 inventories (Maddieson & Precoda Reference Maddieson and Precoda1990), and now being expanded as LAPSyD (Maddieson Reference Maddieson2014).
PHOIBLE (Moran Reference Moran2012, Moran, McCloy & Wright Reference Moran, McCloy and Wright2014) is a database of 2155 inventories from 1672 languages, drawn from UPSID as well as the South American Phonological Inventory Database (Michael, Stark & Chang Reference Michael, Stark and Chang2012), the Stanford Phonology Archive (Crothers et al. Reference Crothers, Lorentz, Sherman and Vihman1979), Alphabets des langues africaines (Hartell Reference Hartell1993, Chanard Reference Chanard2006), and many secondary sources analyzed by Steven Moran and colleagues.
P-base (Mielke Reference Mielke2008, Mielke & Brohan Reference Mielke and Brohan2013) is a database of phonological alternations and distributional patterns in several hundred languages, compiled from descriptions available on library stacks at the Ohio State University and Michigan State University. Figures 6–17 are based on P-base numbers so that they can include counts of inventories and phonological alternations. P-base 3 is a MySQL database with a web interface (http://pbase.phon.chass.ncsu.edu/). It contains phonological patterns from 630 language varieties, corresponding to 537 distinct ISO 639-3 codes, and matched to AUTOTYP family trees (Bickel & Nichols Reference Bickel and Nichols1996). Sound pattern entries contain fields for input, output, segmental context, prosodic domain, morphological effects, prosody, and optionality. It also includes segment inventories of all of these languages. The next subsection considers genealogical sampling. Since UPSID and PHOIBLE are both reasonable benchmarks for studies of inventories, differences between P-base and the other databases are also considered.
2.2.2 Genealogical sampling
The phonological patterns in P-base are the result of an exhaustive search of descriptive grammars in two university libraries. As such, it is not intended as a genealogically balanced sample, and its bias toward better-described language families is discussed in Mielke (Reference Mielke2008: 47–48). An UPSID-like inclusion criterion would reduce the number of included languages considerably. P-base's approach has been to include all available language descriptions and then take genealogical balance into account when interpreting results. PHOIBLE (Moran Reference Moran2012, Moran et al. Reference Moran, McCloy and Wright2014) and LAPSyD (Maddieson Reference Maddieson2014) have both followed a similar approach in expanding upon UPSID, by including more closely related languages in the database and allowing the user to employ appropriate criteria for considering their relationships.
The 451-language version of UPSID (Maddieson & Precoda Reference Maddieson and Precoda1990) includes about the same number of languages as P-base, and used a quota sampling procedure to try to achieve genealogical balance, and so it is useful to compare segment frequencies between them. PHOIBLE is a much larger sample of languages.Footnote 5
In all three databases, [m] is the most frequent segment by raw frequency, followed by [a i k], and then [u j n p]. Differences that are apparent include the lower frequency of approximants such as [ ] and [
 ] in P-base (which is probably a difference in the methods for selecting representative IPA symbols), the lower frequency of long vowels in UPSID, the higher frequency of lowered vowels (such as [
 ] and [
 ]) in PHOIBLE, and the higher frequency of [r] and voiced stops in P-base.
The raw frequencies are not adjusted for genealogical relationships, meaning that the frequency of a segment in a sample is literally the number of languages in the sample that have that segment. This technique does not distinguish between a case where a segment has been innovated many times in many different language families, and a case where a segment has been innovated once in one family that is well represented in the database. UPSID minifies this concern by not sampling closely related languages, but it is still vulnerable to over-counting segments found in large families. Since the genealogical relationships between the languages in the three databases are known (or at least posited), it is possible to compensate for genealogical imbalances by applying a sampling algorithm such as G-sampling (Bickel Reference Bickel2008).
G-sampling works by descending a language family tree and counting only the number of subgroups where the presence or absence of a linguistic feature is significantly skewed and distinct from the value of the next higher level. If all the members of a language family have a particular feature, it is counted once for that family. If only one language in a large family has a particular feature, it is counted once for that language, and the rest of the family, if it is significantly skewed relative to the other language families, would be counted once as not having the feature. See Bickel (Reference Bickel2008: 7–8) for a more explicit statement of the algorithm. AUTOTYP family trees (Bickel & Nichols Reference Bickel and Nichols1996) were matched to all of the P-base and UPSID languages using their ISO 639-3 codes. For PHOIBLE, Glottolog family trees (Hammarström et al. Reference Hammarström, Forkel, Haspelmath and Bank2015) were matched to the languages using their ISO 639-3 codes and Glottolog ID codes.
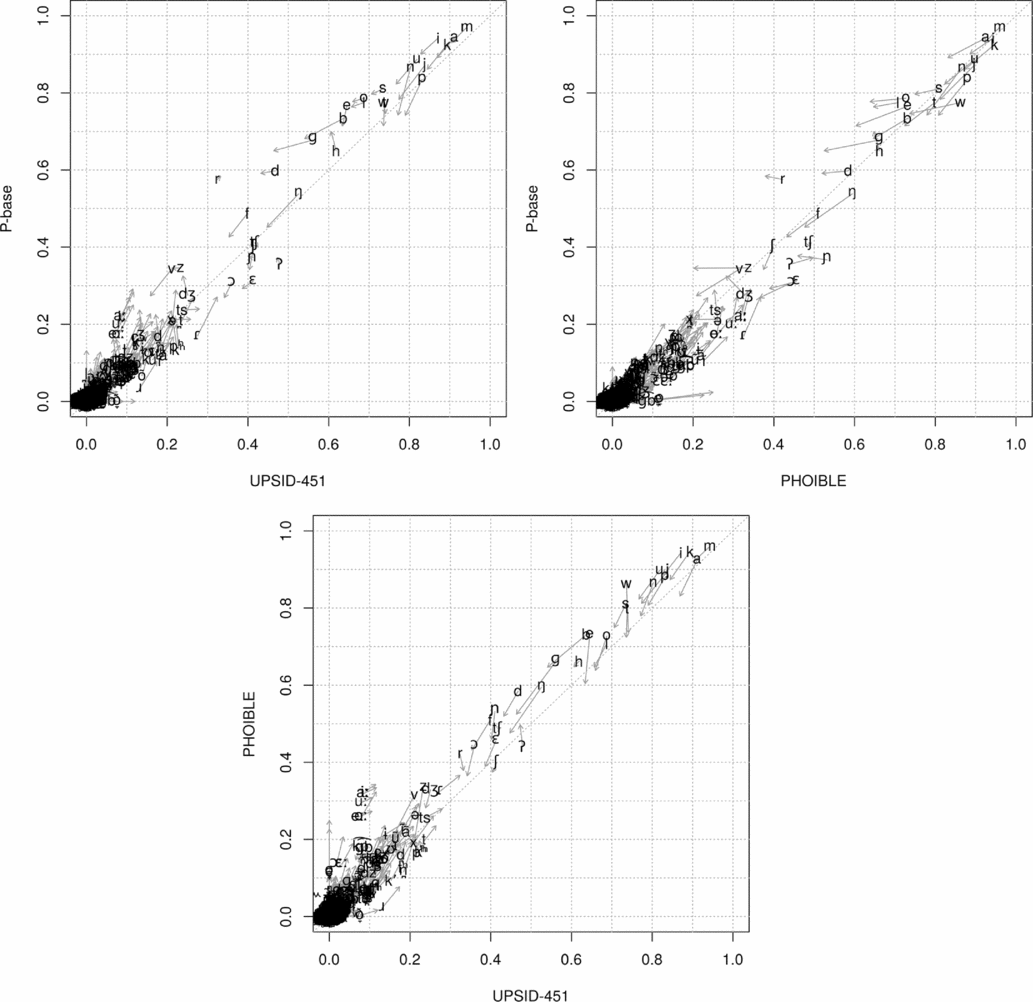
Figure 5 shows the result of applying G-sampling to the UPSID, P-base, and PHOIBLE samples of inventories.Footnote 6 The coordinates of each IPA symbol in each sub-figure represent the proportion of inventories containing the segment in two databases. The gray arrow originating from each IPA symbol represents the effect of G-sampling: an arrow pointing down and to the left means that G-sampling reduced the proportion of languages having the segment (indicating that frequent occurrence in particular language families led to its higher raw numbers). The fact that the segments are close to the diagonal in each sub-figure indicates that they are generally similar in all three databases. The vast majority of distinct IPA transcriptions are attested in only a handful of languages in each sample.
Effects of G-sampling on segment frequencies: pairwise comparison of three databases.

A major effect of G-sampling is to move everything closer to the middle, along the diagonal. What this means is that raw frequencies overstate extremely high and low frequencies relative to G-sampled values, because in either case the majority examples have a smaller number of shared origins. Instances where G-sampling has the effect of reconciling differences between the database samples are indicated by arrows pointing closer to the diagonal. Arrows that do not end near the diagonal indicate differences between databases that are not accounted for by genealogical resampling. P-base and UPSID are the most divergent on [r], and G-sampling indicates that this is not due to sampling. In contrast, [v] and [ɾ] both occur in about 25% of languages, but G-sampling affects them in opposite ways that are similar across the three databases, suggesting that the frequency of [v] is overestimated due shared inheritance, while the frequency of [ɾ] is underestimated due to language families that lack it (see discussion in Moran Reference Moran2012: 220). The relatively high frequency of lowered mid vowels [] and [] in PHOIBLE is even more apparent after G-sampling, highlighting a difference in transcription methods (see Moran Reference Moran2012: Chapter 5) that involves a phonetic difference that varies among closely related languages. These differences not addressed by G-sampling reflect methodological choices of the creators of the database. These will be addressed where they are relevant below.
2.2.3 Overlap between similar phones
Another question is how many different categories to include. There are 1040 distinct symbol and symbol + diacritic combinations used to transcribe the segment inventories in P-base. It is impractical to place them all on the same map, and this also may be misleading, because similar transcriptions can be related in different ways. An important goal is to identify transcriptions that are at least partially used interchangeably. A practical way to find pairs of transcriptions that co-occur less often than expected by chance is a chi-squared test, following Clements’ (Reference Clements2003) investigation of segments co-occurring more frequently than chance.
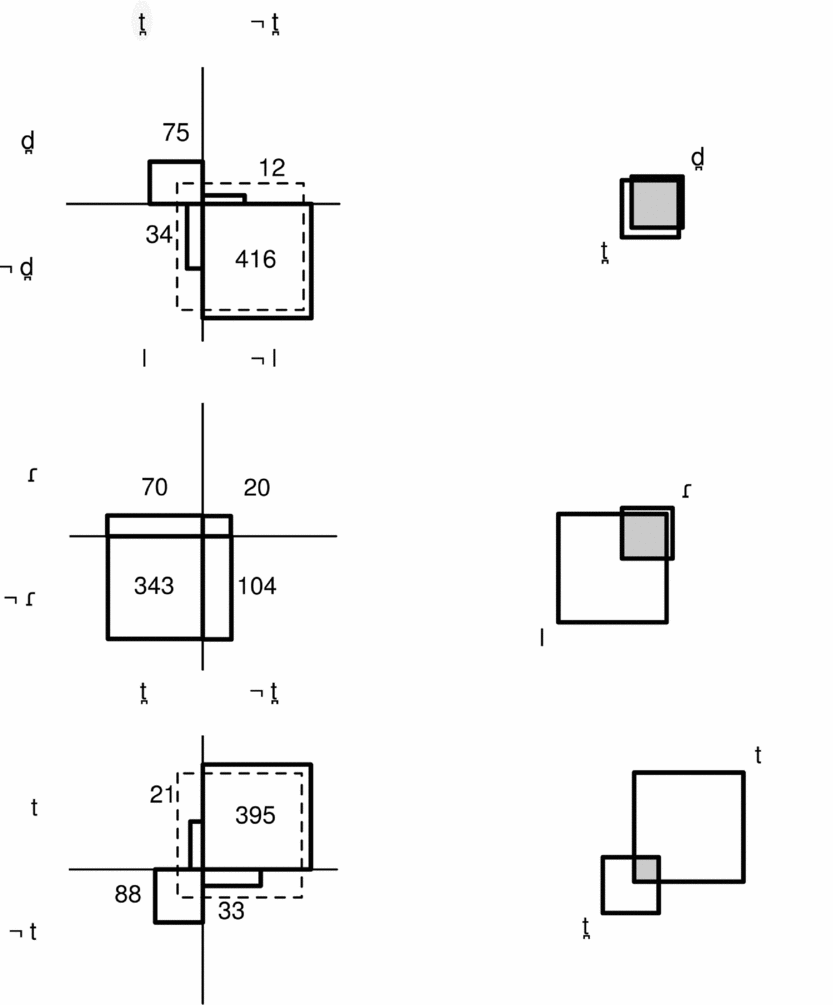
Figure 6 shows examples of three pairs of phonetically similar segments with different co-occurrence patterns. The charts on the left use rectangles to show the number of languages with each of the four logical combinations of the two segments. The dashed rectangle shows the number expected in each cell if the two segments are unrelated (corresponding to the null hypothesis of a chi-squared test). The figures on the right are Euler diagrams showing the overlap between the distribution of the two segments.
Three pairs of phonetically similar segments with different co-occurrence patterns. The left side has rectangles showing the number of languages with each of the four logical combinations of the two segments, with dashed rectangle showing the number expected in each cell if the two segments are unrelated. The right side has Euler diagrams showing the overlap in the distributions of the two segments.

The first set of figures shows the relationship between [ ] and [
 ]: most languages (416) do not have either segment, but more languages have both (75) than have one but not the other. Given the number of languages with either segment, they occur together, or not at all, more than would be expected by chance. The Euler diagram shows them mostly overlapping. The next row shows [l] and [ɾ], which co-occur almost exactly as often as expected: they are independent, and there is considerable overlap because [l] occurs in so many languages’ inventories. The third example is [] and [t], which show a relationship that is opposite the one between [] and []: they occur together less often than would be expected by chance, and the Euler diagram shows large rectangles with little overlap. The goal of inspecting these relationships is to avoid tiling a density-equalizing map with separate regions for segments like [t] and [] that are mostly mutually exclusive.
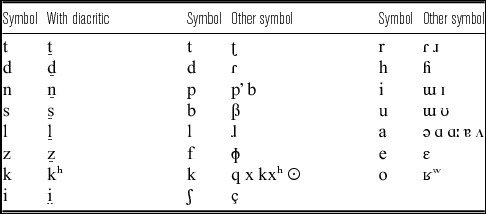
To look for potential trouble spots involving closely related pairs, the 540,280 possible pairs of segments ( $\frac{{{{1040}^2} - 1040}}{2}$) were filtered down to 1685 pairs of segments that differ by six features or fewer in the Halle & Clements (Reference Halle and Clements1983) feature systemFootnote 7 (this is a low bar). Chi-squared tests were performed on all of these pairs. Out of 1685 pairs, 542 are significant at α = 0.05. Of these, 508 are pairs like [] and [] in that they co-occur more often than chance, and many of them are similar instances of phonetic features that are typically found in more than one segment in an inventory if they are found at all. There are 34 pairs of segments that show the opposite relationship, i.e. co-occurring significantly less frequently than expected, and these pairs are shown in Table 1. These pairs include the alveolar and dental series and other similar pairs of phones that are transcribed with different symbols. The relationships for some of these pairs may be due to crowding in the phonetic space and the relationships for others may be due to transcription alternatives, e.g. [] and [t] could be used interchangeably to transcribe voiceless stops that are variably dental or alveolar, but [t] could be used by default when there is no contrast, and [] might be more likely to be used when there is a [ʈ]. For this reason, the dental place of articulation is treated the same way as the other diacritics. This is in line with the IPA's use of a dental diacritic instead of a separate series of symbols, and with UPSID and PHOIBLE's use of symbols representing consonants that are either dental or alveolar.
Phones that co-occur in P-base inventories less frequently than expected. Phones in the ‘Symbol’ column co-occur significantly less frequently than expected with each of the phones in the ‘With diacritic’/‘Other symbol’ column.

The presence of symbols like [a] and [r] in this table is a reminder of the issue of ‘transcription effects’, i.e. a potential bias toward easily typed IPA symbols in primary and secondary sources, e.g. [a] when other low vowel symbols such as [ɑ] might be a closer match, and [r] in place of a wide range of symbols representing rhotic sounds. See Mielke (Reference Mielke2009) and Moran (Reference Moran2012: Chapter 2) for discussion.
In the first set of figures below, segments are grouped according to the basic symbol used to transcribe them, i.e. [d] in the figure represents the number of languages with any segment transcribed using [d] and (optionally) any diacritics, including dental. The basic vowel figure includes the symbols appearing on the 2005 IPA vowel chart. The basic consonant figure includes all the basic symbols appearing on the 2005 IPA pulmonic consonant chart, plus clicks and implosives (which have their own basic symbols) and ejectives (for parallelism with implosives), the ten ‘other symbols’ including [w], etc., labial-velar consonants, homorganic affricates, and approximants requiring the lowering diacritic (for parallelism with approximants at other places of articulation).
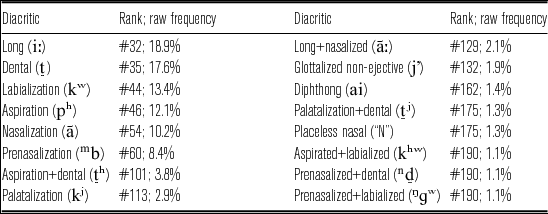
The most frequent phones not included in these figures involve diacritics, mostly handled by additional figures, in Section 3 below. The 31 most frequent phones are in the basic figures. #32 is [iː], occurring in 119 of 629 inventories (18.9%). The relatively frequent diacritics and their most frequent instances are shown in Table 2. All other diacritics and combinations of diacritics occur at a rate of less than one percent (ranked #208 through #1040)
The most frequent instances of diacritics and other non-basic transcriptions.

Figures in Section 3 will depict the number of languages using a diacritic, relative to the number of languages using the segment by itself, for all the individual diacritics that are at least as frequent as palatalization (2.9%). In isolation, a transcription with a diacritic is ambiguous: it could indicate a contrast with a corresponding diacritic-free phoneme, or it could indicate a more close phonetic transcription of the allophone used to represent a phonemic category.Footnote 8
2.3 The segment frequency maps
This section presents density-equalizing maps of IPA charts for the purpose of displaying information about phone frequencies, including basic consonant and vowel maps, maps highlighting interactions between voicing and place, and basic consonant and vowel maps for four large language families.
2.3.1 Basic consonant and vowel maps
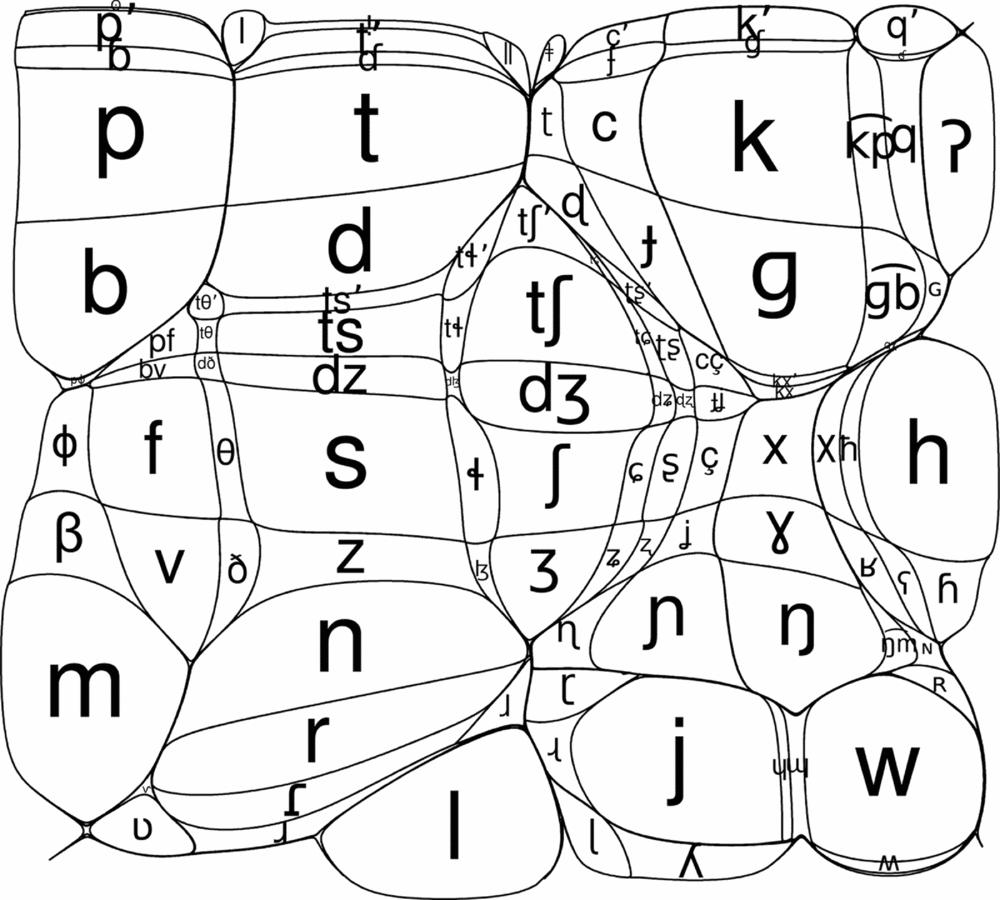
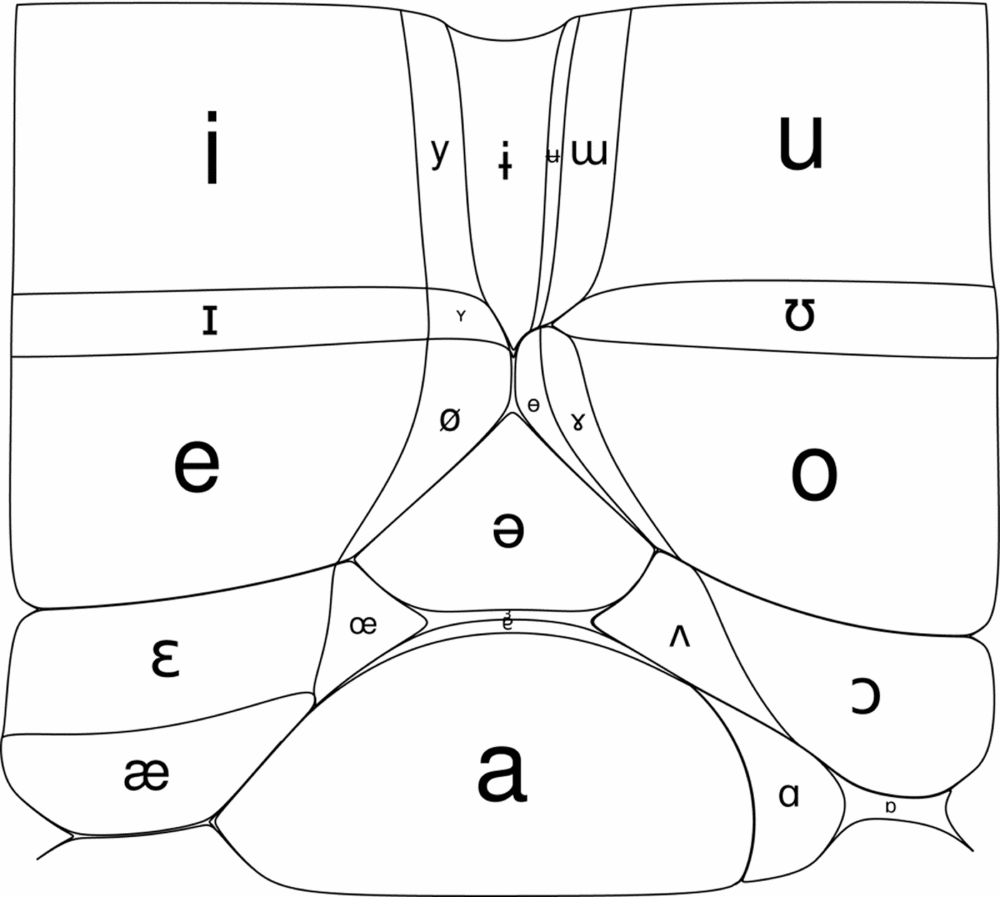
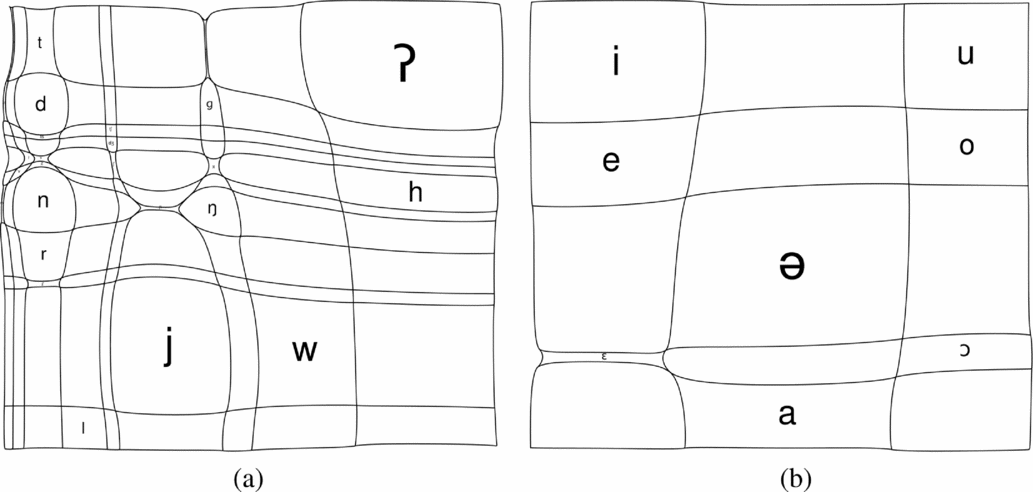
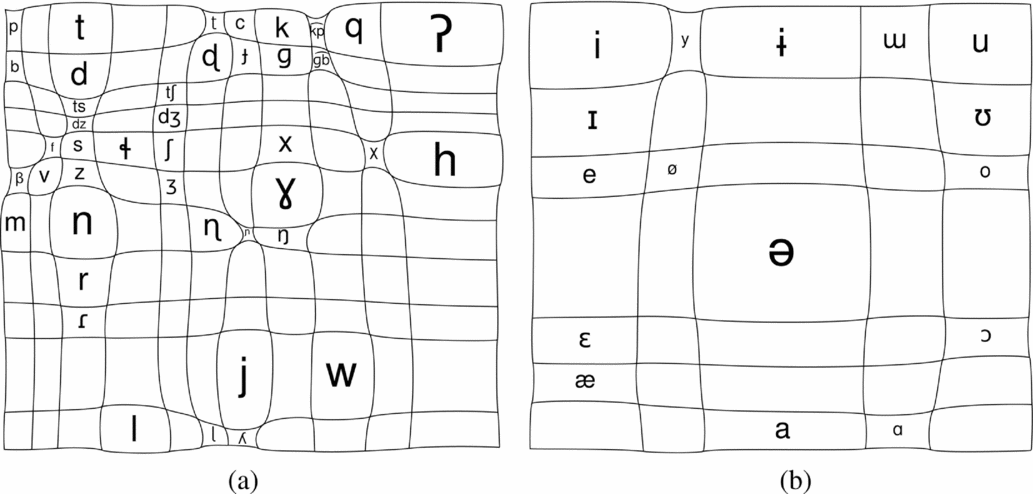
Figures 7 and 8 show cartograms of the G-sampled frequency of basic consonants and vowels in P-base. Each basic symbol represents that symbol's occurrence with or without diacritics, as described above. The starting point for these maps is a (normal) equal-area IPA chart, which is an idealized two-dimensional surface.Footnote 9 Thus, the principal observations to be drawn from the cartograms are instances where some parts of this surface are more densely populated than others. Some basic and familiar observations are that bilabial, alveolar/dental, and velar places of articulation are highly frequent among oral and nasal stops, and that [s h r l j w] are also frequent, as are the vowel qualities [i u e o a]. These are all segments that are well known to be frequent (see e.g. Maddieson & Precoda Reference Maddieson and Precoda1990). Many of the most frequent segments involve combinations of frequent places of articulation and frequent manners of articulation.
Basic consonants by G-sampled frequency in P-base.

Basic vowels by G-sampled frequency in P-base.

The cartograms are more useful for highlighting interactions between place and manner, including cases where the combination of two frequent features is less frequent than expected. For example, the only place of articulation that is particularly frequent among both stops and fricatives is alveolar/dental. Bilabial and velar places are common among stops but less so among fricatives. The concavity or convexity of a cell is a good indicator of its phone's frequency relative to similar phones. Interactions between place and manner appears as columns that shift in size across different places of articulation. The bilabial column, wide for ejectives, implosives, stops, and nasals, narrows for affricates, fricatives, and approximants, which are the only manners of articulation where labiodental is frequent. Labial-velar is also very frequent among approximants, more so than any other manner. Another interaction involves places of articulation in between alveolar and velar. These are infrequent among stops, with small numbers of retroflex and palatal stops. Affricates show the opposite pattern: postalveolars are the most frequent affricates, i.e. what is an effective place of articulation for one manner is less effective for another. The next section explores a similar interaction between place and voicing.
2.3.2 Maps for phonation and place
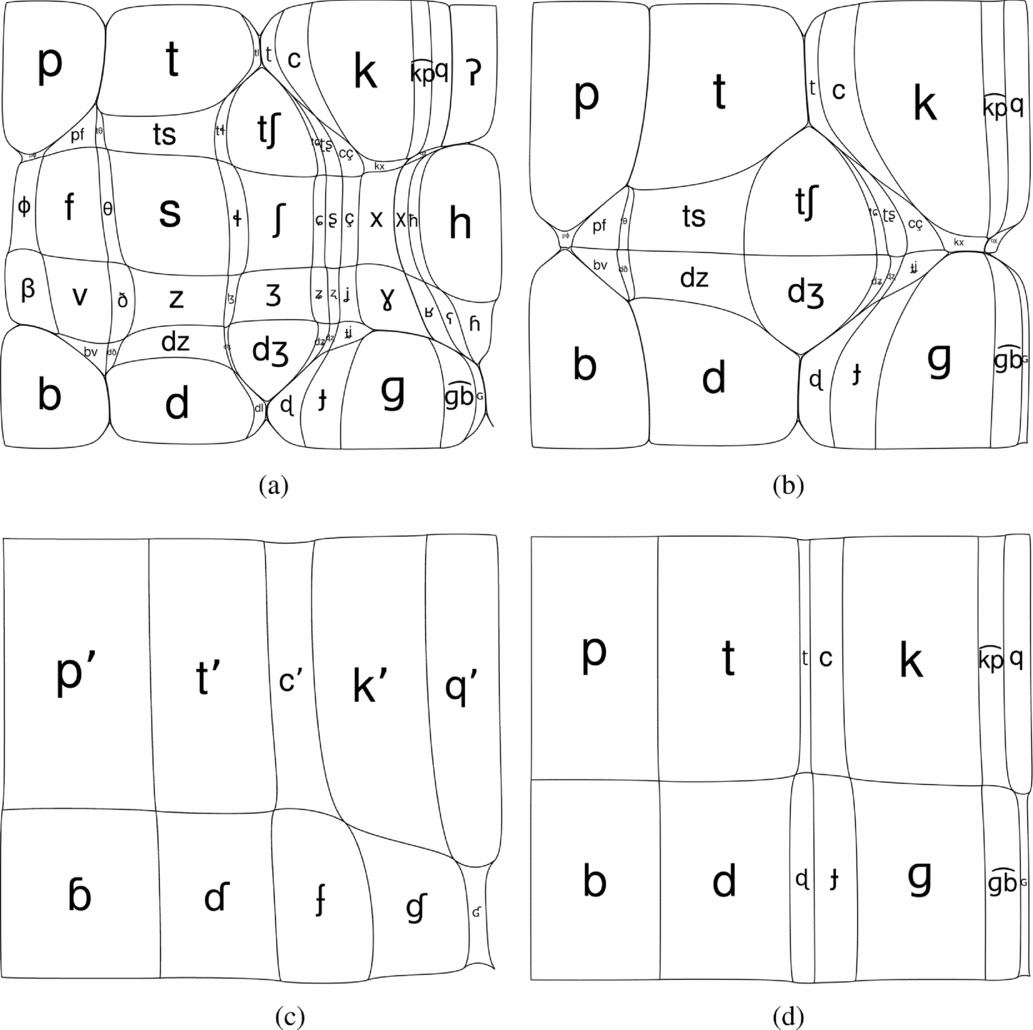
While many languages have the six stops, [p t k b d ɡ], Maddieson (Reference Maddieson1984: 35–36) shows that in languages which have five of these, it is typically [p] or [ɡ] that is missing. In UPSID-317 there are 24 languages with [k] but no [p], and 21 languages have a series of voiced stops that lacks [ɡ]. The recurrent lack of [ɡ] can be attributed to a difficulty in maintaining voicing when the space between the glottis and the stop closure is small, because intra-oral pressure increases rapidly, but must be lower than subglottal pressure in order for voicing to be maintained (Ohala Reference Ohala and MacNeilage1983, Keating Reference Keating1984). The absence of [p] may also have a phonetic explanation, but Maddieson (Reference Maddieson2001) shows that it is much more of an areal phenomenon than the lack of [ɡ].Footnote 10 Figure 9a illustrates this phenomenon by arranging voiced and voiceless obstruents symmetrically. If there was no relationship between anteriority and voicing, the dividing line between voiced and voiceless fricatives would be horizontal. Instead, it slopes in the expected direction, with voicelessness more common among posterior consonants, and voicing relatively more common among anterior ones. Figure 9b removes fricatives and glottals, showing that [ʔ], which by definition has no voiced counterpart, played a big role in the dividing lines position in Figure 9a. Maddieson (Reference Maddieson1984: 103, 119–120) reports stronger tendencies for labial [pʼ] to be excluded from ejective inventories and for velar [ɠ] to be excluded from implosive series. Figure 9c illustrates this asymmetry. A complicating factor is that the uvular place of articulation is rare, and so the rarity of the uvular implosive [ʛ] is exaggerated. Figure 9d shows voiced and voiceless stops. The convex cells for [ɖ ɟ] indicate that retroflex, palatal, and labial-velar voiced stops are more frequent than would be expected on the basis of their voiceless counterparts, indicating another interaction (in the opposite direction) between voicing and anteriority in coronal stops.
Place–voicing interactions in obstruents: (a) stops, affricates, and fricatives; (b) stops and affricates; (c) ejectives and implosives; (d) stops.

2.3.3 Maps for language families
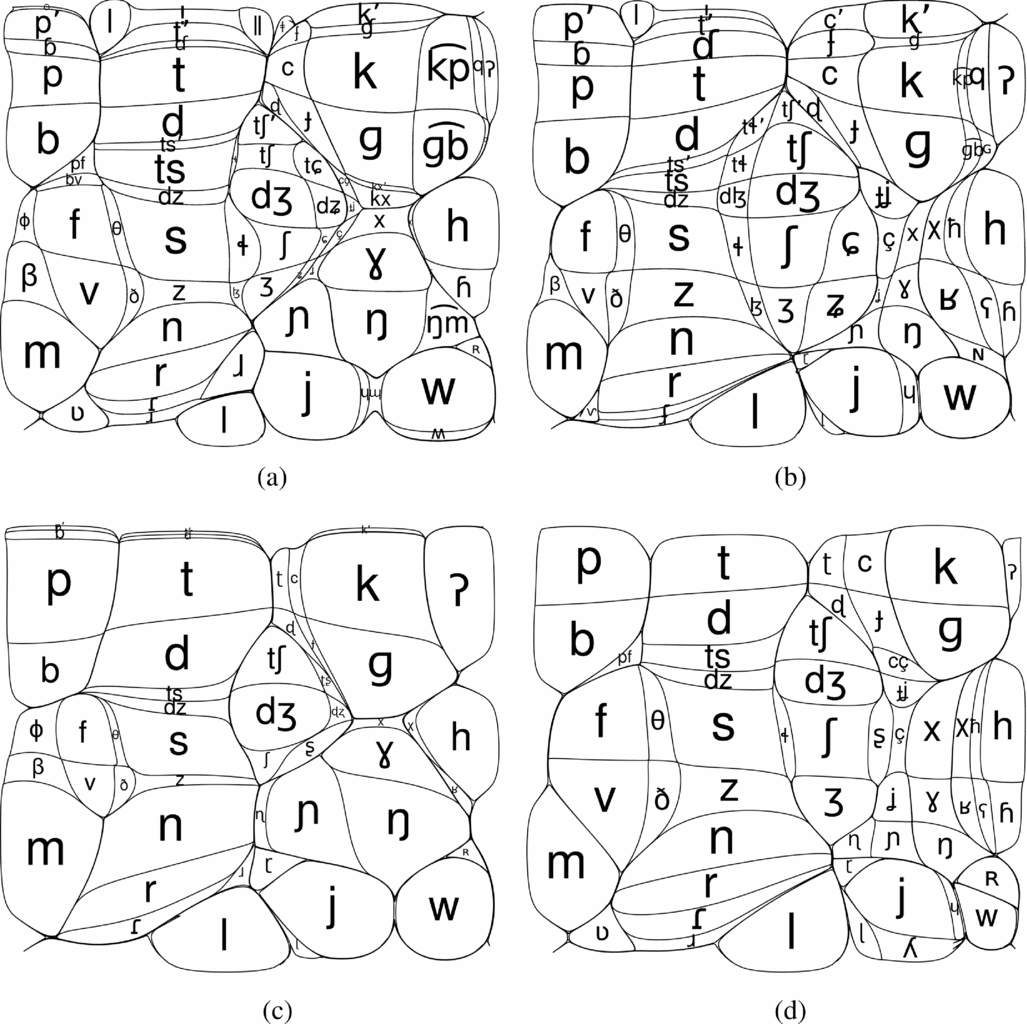
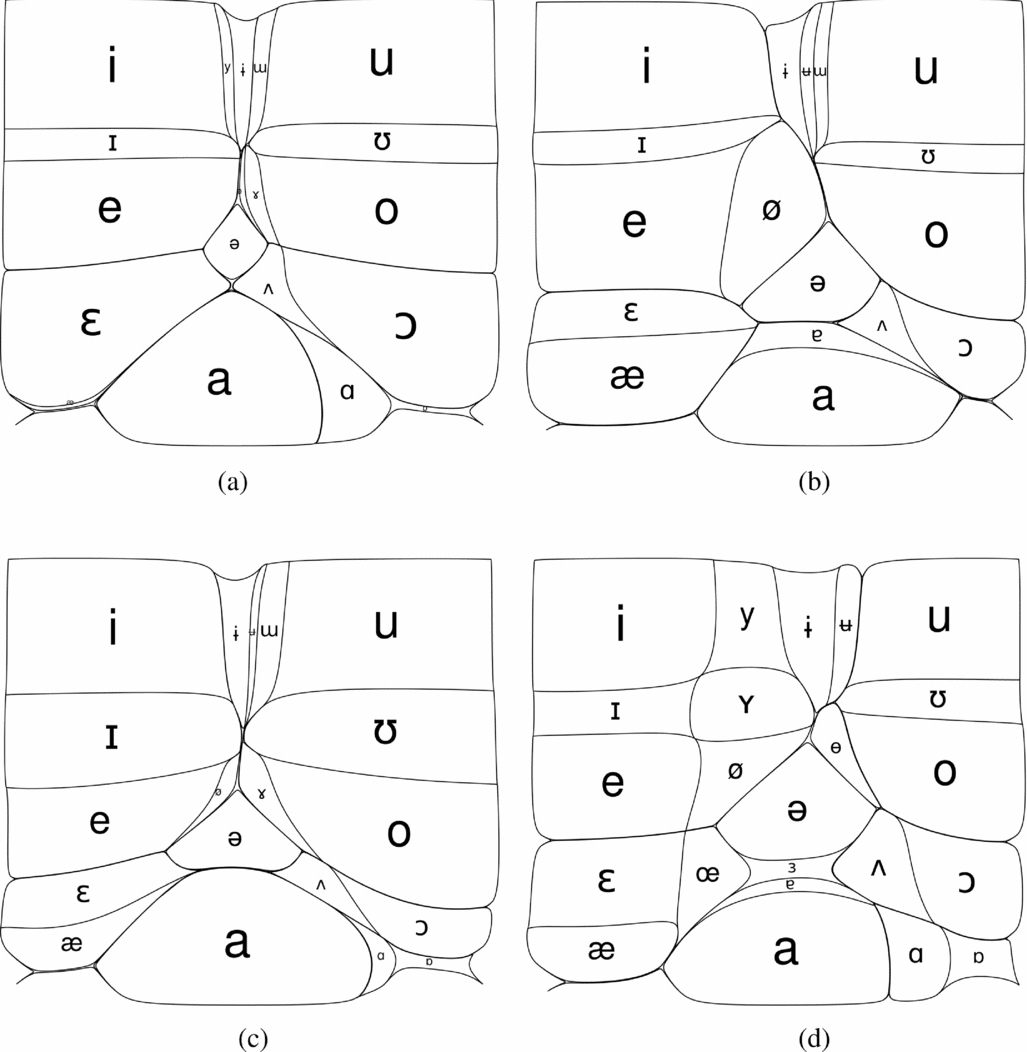
The figures so far have attempted to show general phonetic tendencies by reducing effects of inheritance. This section explores differences between four large language families. Figures 10 and 11 show cartograms for Niger-Congo, Afro-Asiatic, Austronesian, and Indo-European, the four language families with the most languages in P-base. These are all broadly similar to the cartograms in Figures 7 and 8. In the consonant charts, differences include the absence of non-pulmonic consonants in Indo-European, the high frequency of implosives in Afro-Asiatic, labial-velars in Niger-Congo and the low frequency of voiced fricatives in Austronesian. In the vowel charts, differences include the higher frequency of some lax vowels in Niger-Congo and Austronesian, and the higher frequency of one or more front rounded vowels in Afro-Asiatic and Indo-European.
Consonant frequency in four large language families (G-sampled): (a) Niger-Congo (n = 106); (b) Afro-Asiatic (n = 51); (c) Austronesian (n = 51); (d) Indo-European (n = 49).

Vowel frequency in four large language families (G-sampled): (a) Niger-Congo (n = 106); (b) Afro-Asiatic (n = 51); (c) Austronesian (n = 51); (d) Indo-European (n = 49).

3 IPA maps for relative frequency
The IPA cartograms in Figures 7–11 above show basic consonants and vowels by pooling together all instances of those transcriptions, with or without diacritics. This section illustrates the distribution of the most frequent diacritics, and also the participation of segments in deletion and epenthesis patterns, relative to the frequency of the basic phone in inventories. Plotting the actual frequency of the transcriptions with diacritics would largely recapitulate Figures 7 and 8, because in most cases the most frequent basic symbols occur with diacritics more frequently than the least frequent basic symbols, for reasons that are not related to the diacritics. Instead, Figures 12–15 show the G-sampled frequency of a symbol+diacritic combination relative to the frequency of the basic symbol by itself. If the frequency of symbols with diacritics happens to be completely proportional to the frequency of the corresponding basic symbols, the figures will be checkerboard shaped (like the equal area vowel chart above in Figure 4a).
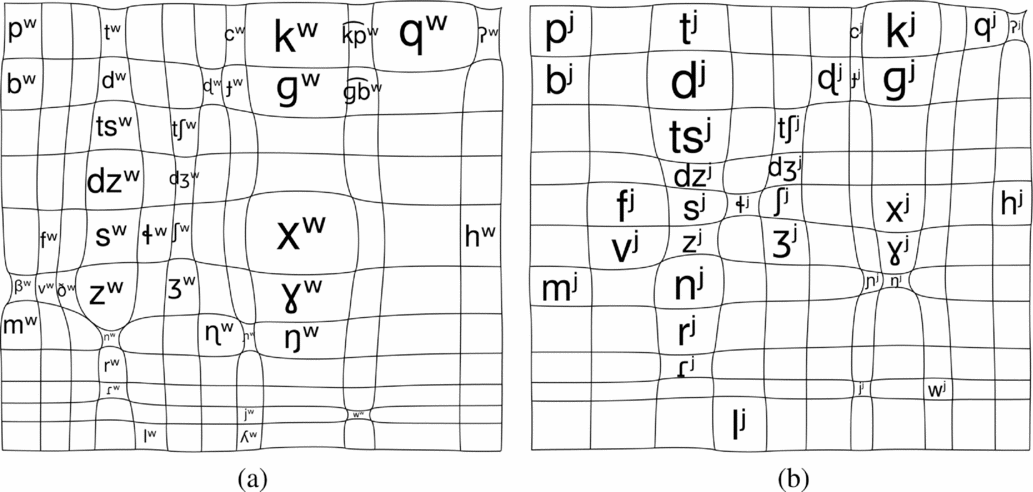
Labialization and palatalization – G-sampled ratio to basic phone: (a) labialized (m = .076); (b) palatalized (m = .050).

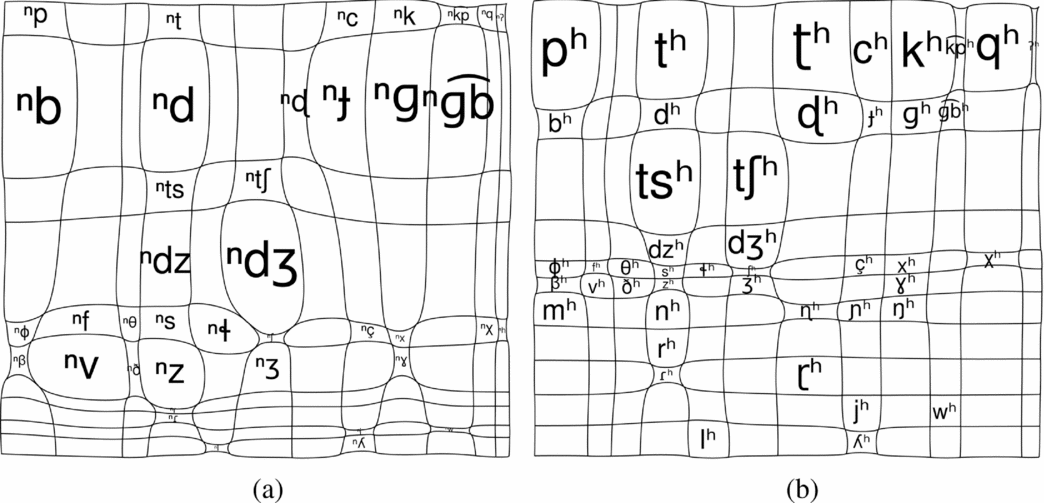
Prenasalization and aspiration – G-sampled ratio to basic phone: (a) prenasalized (m = .085); (b) aspirated (m = .090).

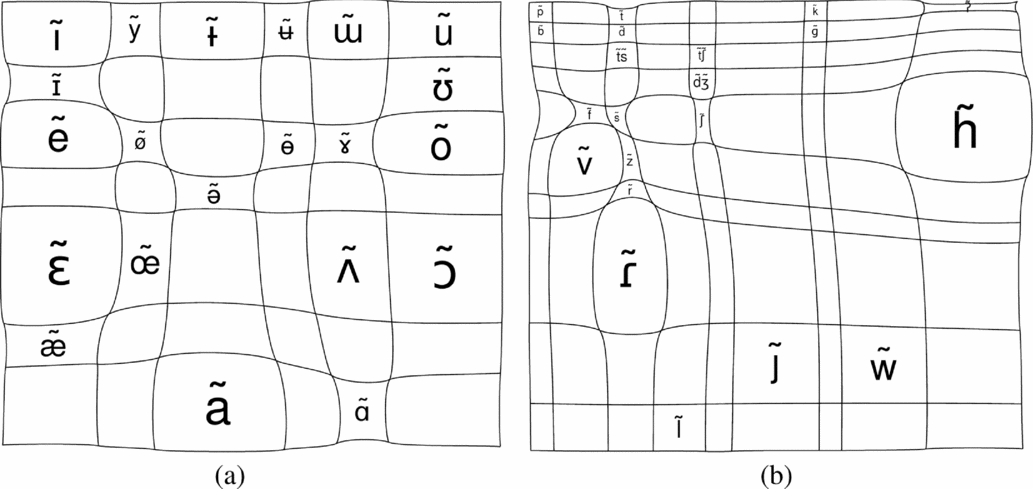
Nasalization in vowels and consonants – G-sampled ratio to basic phone: (a) nasalized vowels (m = .190); (b) nasalized consonants (m = .011).

Length in consonants and vowels – G-sampled ratio to basic phone: (a) long vowels (m = .297); (b) long consonants (m = .025).

3.1 Methods for maps of ratios
Since these figures display ratios, low-frequency basic phones have the potential to cause trouble. For example, the mean rate of occurrence of labialized consonants (relative to the plain consonant) is 5.3%, or about one labialized consonant for each 19 occurrences of the plain counterpart. A labialized consonant observed only once would appear to be twice as frequent as average if the basic phone was counted only nine times. To mitigate this, a condition for including a symbol with diacritic in the figures is that the corresponding basic phone frequency exceeds  $\frac{1}{m}$, where m is the mean frequency of the diacritic relative to the basic phone (calculated across basic phones above this frequency threshold). The value of m is arrived at by increasing the value of the cutoff from 1 until the average rate of the diacritic for phones above the threshold exceeded
 $\frac{1}{m}$ (calculated for the phones above the threshold). For labialization, this results in m = .076, and a cutoff of 14 (which is equal to
 $[\frac{1}{m}]$). The rate of labialization is higher than 5.3% because of the exclusion of a large number infrequent phones whose labialized counterparts are never observed. This results in cutoffs ranging from four (for long vowels, which are frequent) to 90 (for nasalized consonants, which are infrequent). In the nasalized consonants figure (Figure 14b), 40 is used as a cutoff instead of 90, in order to avoid excluding a large proportion of nasalized consonants, and the implications of this will be explained.
To reduce the disruptive influence of phones whose frequency is just above the cutoff, a Bayesian average is used to represent each frequency as a mixture of the actual frequency and the mean frequency for all of the phones. The idea is that phones which are just above the threshold will tend to overstate the rarity or high frequency of a diacritic. The Bayesian average is defined as follows:Footnote 11
 \[
\bar{x} = \frac{{Cm + {n_d}}}{{C + {n_b}}}
\]
C is the minimum basic phone frequency (count), m is again the mean diacritic frequency (a ratio in the interval [0,1]), nd is the diacritic frequency (count), and nb is the basic phone frequency (count). A consequence is that phones which are at the minimum basic phone frequency threshold are assigned rates halfway between the actual observed rate and the overall mean. As the number of observations increases, the adjusted rate approaches the actual rate. ‘Average’ here refers to averaging ones and zeros (representing inventories with and without a phone, respectively) to calculate a rate.
In Figures 7–9 above, where cell size reflects frequency (count), the non-occurring cells disappear, which is appropriate. In Figures 12–15, which express the relative frequency of a diacritic, cells with no data should default to an expected value in order to minimally disrupt the pattern of the cells based on data. Cells with basic phone frequency below the threshold are unlabeled, and their size is set to  $\sqrt {{f_c}{f_r}} $, where fc and fr are the average rates for the column and row the cell is in. This enables the cells with insufficient data to conform to the cells with sufficient data.
3.2 Relative frequency maps
This section presents maps for the frequency of the most frequent diacritics (labialization, palatalization, prenasalization, aspiration, nasalization, and length), relative to the corresponding plain segments, and then presents maps for consonants’ and vowels’ involvement in epenthesis and deletion.
3.2.1 Maps for common diacritics
Figure 12 shows the frequency of labialized and palatalized consonants relative to the corresponding plain consonants.Footnote 12 Contrastive labialization is more frequent at velar and uvular places of articulation (but not labial-velar), while palatalization is more evenly distributed, but infrequent at the palatal place of articulation. This is consistent with Kawasaki's (Reference Kawasaki1982) finding that consonant–glide–vowel sequences involving salient formant modulations are favored crosslinguistically.
The distributions of prenasalization and aspiration are shown in Figure 13. Prenasalized nasals and aspirated [h] are excluded as impossible to distinguish from their plain counterparts. These maps show how prenasalization and aspiration are both most frequent on obstruents, and that they otherwise have nearly opposite distributions: prenasalization appears most typically as a feature of voiced consonants, and aspiration appears most typically as a feature of voiceless stops and affricates. A salient exception to the voicelessness bias of aspirated plosives is the relatively high frequency of [ɖʰ], which is attributable to the fact that retroflex stops and voiced aspirates are both areal features found on the Indian subcontinent.
Nasalization is shown in Figure 14, which illustrates that contrastive nasalization is more evenly spread across vowels than across consonants. Among the vowels, nasalization is somewhat more frequent among low and mid lax vowels. Contrastive nasalization is found in only a handful of consonants. The only nasalized consonants (other than nasals) occurring at all in the database are [


 ] (pictured) and [

 ] (not pictured, because [ʋ ɦ] are not frequent enough). [ ] are the two segments whose inclusion depends on lowering the threshold. All the other nasalized consonant phones visible in Figure 14b have a frequency of zero. This figure would look quite different if nasalization in stops was indicated with a diacritic (e.g. if [m] was [
 ]), since [m n ɲ] are more frequent than their voiced oral stop counterparts.
Contrastive length is shown in Figure 15. The main observation for vowels is that length contrasts are equally frequent for most vowel qualities. This is consistent with the observation that contrastive vowel length is a system-wide feature. Exceptions to this include the low frequency of long mid central vowels such as [əː ɵː] and the slightly lower frequency of long lax vowels, relative to their tense counterparts. These facts are consistent with neutral vowel quality and laxness as features of short vowels. Figure 15b (long consonants) shows a bias against long voiced obstruents, which is consistent with the aerodynamic explanation considered by Ohala (Reference Ohala and MacNeilage1983) and Westbury & Keating (Reference Westbury and Keating1986). See also Blevins (Reference Blevins2005) on accounts of the distribution of geminates. Another observation from these maps and most of the earlier consonant diacritic maps is that the diacritics are less frequent for glottal stop than would be expected on the basis of [h] and voiceless stops, supporting the idea that contrary to its placement in the consonant chart, a glottal stop is not well characterized as just a voiceless stop at the glottal place of articulation.
Figures 12–15, along with Figures 7 and 8, provide a reasonably complete picture of transcriptions used frequently to describe inventories: the most frequent phones not pictured (long nasalized vowels and non-ejective glottalized consonants) occur in only about 2% of inventories in P-base.
3.2.2 Participation in phonological alternations
The next set of cartograms illustrate the involvement of segments in phonological alternations in P-base. While the preceding figures were based on the 630 segment inventories, Figures 16 and 17 are based on the phonological alternations these segments participate in. The current version of P-base has 4560 alternations (Mielke & Brohan Reference Mielke and Brohan2013). Of these, 774 alternations are deletion patterns and 326 are epenthesis patterns. Figures 16 and 17 show which consonants and vowels undergo deletion and epenthesis. These figures express the ratios of languages with particular epenthetic or deleted phones to the languages with the same phones in their inventories, using the same methods as the figures for diacritics above in Section 3.2.1, with one difference: these numbers are not G-sampled, because accurate G-sampling depends on a reliable count of all the instances where a feature is not present, and it is hard to determine from a phonological description whether a particular phonological alternation is absent from the language or not a focus of the description.
Frequency of consonant and vowel epenthesis, relative to frequency in inventories: (a) Epenthetic consonants (m = .006); (b) Epenthetic vowels (m = .005).

Frequency of consonant and vowel deletion (in deletion patterns involving one or two segments), relative to frequency in inventories: (a) Consonant deletion targets (m = .031); (b) Vowel deletion targets (m = .042).

Both epenthesis maps have the frequency threshold set to half the normal value, because epenthesis is infrequent. The main consequence of this choice is the inclusion of [ə], which otherwise is not frequent enough in inventories to be included, but which is involved in a large number of vowel epenthesis patterns. As in the nasalized consonant figure above, the smallest labeled cells represent actual frequencies of zero, and their nonzero size is because the rates that are shown are affected by the overall mean rate of epenthesis.
Consonant epenthesis (Figure 16a) is dominated by the glottal stop and [j w], followed by [h], [n], and a few other non-labial consonants. The prevalence of epenthetic glides and glottals is consistent with Blevins’ (Reference Blevins and Good2008) argument that the record of sound changes supports two basic sources of epenthetic consonants: reinterpretation of vowel–vowel sequences as vowel–glide–vowel, and the phonologization of naturally occurring irregular phonation at prosodic boundaries (Pierrehumbert & Talkin Reference Pierrehumbert, Talkin, Docherty and Ladd1992) as glottal consonants. Indeed, most of the instances of [j w] epenthesis are structure preserving, but [ʔ] epenthesis includes a large number of structure changing patterns. Blevins attributes epenthetic consonants other than glides and glottals to complex and/or unnatural sources such as subsequent glide fortition and the restructuring of consonant deletion patterns. The wide range of epenthetic consonants is consistent with Vaux (Reference Vaux2002), who showed that nearly every familiar consonant is epenthetic in at least one language, and that many of the more obscure epenthetic consonants (such as [ɹ] in some varieties of English) are due to restructuring of deletion patterns. [ə] is particularly frequent in vowel epenthesis. Vowel epenthesis is slightly biased toward high vowels, especially for structure preserving epenthesis patterns. It has often been observed that epenthetic vowels tend to be short and otherwise perceptually non-salient (e.g. Hume & Bromberg Reference Hume and Bromberg2005), and high vowels are often shorter than lower vowels (Catford Reference Catford1977, Maddieson Reference Maddieson, Hardcastle and Laver1997), so epenthetic high vowels consistent with the general idea that phonological repairs make minimal changes (Steriade Reference Steriade, Hume and Johnson2001). This account is also consistent with the absence of most visually salient labial consonants from the range of epenthetic consonants. [w] is labial, but it is typically epenthesized in contexts where rounded vowels are already present.
The deletion patterns in Figure 17 are limited to patterns involving only one or two deleted segments. The reason for this is that a large number of deletion patterns target all consonants or all vowels, and the point of these figures is to visualize differences in segmental behavior. Glottals and glides are frequently deleted consonants, along with a few (glide-like) voiced fricatives, and nasals and apical consonants, especially [n]. The higher frequency of deletion among apical consonants has been attributed to the articulatory demands of apical gestures, which may also be quick and easily overlapped by other consonants (Hardcastle & Roach Reference Hardcastle, Roach, Hollien and Hollien1979, Browman & Goldstein Reference Browman and Goldstein1992). Chiu & Gick (Reference Chiu and Gick2013) and Gick, Stavness & Chiu (Reference Gick, Stavness and Chiu2013) have shown that nasals differ from oral stops in the forcefulness of the closure, for example, lip compression is weaker in [m] than in [b]. This is thought to be because the lingual or labial closure for an oral stop needs to withstand an increase in intra-oral pressure, but the closure in a nasal consonant does not, and the constrictions are executed differently. This less forceful closure at the place of articulation for nasal consonants may make them more susceptible to being reduced, perhaps accounting for the extremely high observed rate of nasal place assimilation, and this may also account for the relatively high rate of nasal deletion, especially [n]. Deletion patterns targeting one or two vowels target [ə] the most.
4 Discussion
The diffusion-based procedure for making density-equalizing maps was developed for maps of Earth's surface. When applied to IPA charts, this technique allows the visualization of some major facts about segment inventories (Figures 7–9). This includes the distribution in the place × manner matrix of frequent place/manner combinations such as bilabial, alveolar/dental, and velar with stop and nasal, frequent phones such as [s h r l j w] and [i u e o a], and interactions between parameters, such as the interaction between place and continuancy in obstruents, the antagonistic relationship between voicing and posterior place of articulation in consonants, and labial place of articulation shifting across manners of articulation.
The relative frequencies of diacritics (Figures 12–15) highlight another set of interactions. Contrastive labialization and palatalization both interact with place, as expected, and also interact to a lesser degree with manner. Consonant length, aspiration, and prenasalization all interact with voicing in different ways. Vowel nasalization interacts with height, but contrastive length is evenly distributed across most non-schwa vowel qualities.
The figures for deletion and epenthesis (Figures 16 and 17) illustrate discrete sources of these sound patterns, such as the reinterpretation of prosodic boundary marking as [ʔ] and vowel–vowel sequences as containing glides, and broader patterns involving places and manners of articulation that have particular reasons for participating or not participating (lack of labial epenthesis, prevalence of glottal, glide, voiced fricative, nasal, and apical consonant deletion, for different reasons).
G-sampling was used to avoid overstating the frequency of phones whose frequency is due at least in part to occurring in large language families. It was seen that an effect of G-sampling is to compress the range of frequencies and move the extremely frequent and extremely infrequent phones closer to the middle. All the figures would look more dramatic if raw frequencies were used instead. Despite this adjustment, some genealogical and areal effects are still apparent in the figures. One example is the relatively high frequency of [ɖʰ], which is attributable to the fact that retroflex stops and voiced aspirates are areal features of the same region. This is challenging to the sampling technique both because it involves the intersection of two features, and because it is an areal feature spanning three separate families. Areal features that do not coincide with genealogical relationships are unaffected by G-sampling. The intersection of uvular consonants and labialization in languages of Western North America also probably inflates the apparent frequency of labialized uvulars in a similar way.
All the usual caveats about studies of phonological inventories apply to these figures. A phoneme inventory is a very high-level description, and many steps intervene between the aggregate information visualized in the figures in this paper and the linguistic and phonetic factors whose influences they reflect. Simpson's (Reference Simpson1999: 349) criticisms of UPSID apply equally to P-base: a phoneme is an abstract object which can be viewed as a set of allophones (in the structuralist tradition) or in terms of the oppositions which minimally distinguish it from other phonemes (in the Prague School). However, choosing a single allophone to represent a phoneme is a different task, and has been a necessary step in the development of inventory databases. The figures reflect major trends in the use of IPA symbols to represent analyses of language sound systems, and visualizing them is part of a program of figuring out which patterns reflect facts about language and which patterns reflect practices used to analyze them.
The IPA's distinction between basic symbols and diacritics provided a natural way to represent a large number of phonetically distinct segmental transcriptions without putting all of them in one unreadable map. It is possible to speculate about alternative notation systems, such as one in which nasalization in stops is treated as a diacritic on par with other nasalized consonants, or where tenseness in vowels is treated as a diacritic feature. On one hand, consonant and vowel charts are two-dimensional representations of the range of combinations of phonetic properties, but they involve further dimensions (voicing in consonants and tenseness and rounding in vowels) that could be handled in the same way as diacritics and make a matrix that is closer to really being two-dimensional. On the other hand, the dental place of articulation fits in a two-dimensional place × manner matrix, but is treated as diacritic. The antagonistic relationship between corresponding dental and alveolar consonants indicates that there is often uncertainty or variation that makes it difficult to treat them as separate places.
Many of the typological facts that are apparent in the density-equalizing maps are familiar from previous studies of segmental inventories. There are pedagogical benefits to visualizing them in this way, and they also encourage the development of models of phonetics and phonology to account for the nonlinear mapping between a representation of phonological categories thought to be possible for use in human language and the distribution of these categories in phonological inventories. Density-equalizing maps suggest a way of relating the frequency of phones to the amount of phonetic space available. Lindblom & Maddieson (Reference Lindblom, Maddieson, Hyman and Li1988: 65–66) show that the relationship between the number of obstruents and the total number of consonants in segment inventories is linear: consonant inventories are typically 70% obstruents and 30% sonorants. They suggest that these numbers reflect the relative size of the phonetic subspace available for the production of obstruent and sonorant consonants.
A major source of explanation for the recurrent properties of inventories is the idea that segments are subject to a pressure to be maximally dispersed in the available phonetic space. Vowel dispersion is modeled by Liljencrants & Lindblom (Reference Liljencrants and Lindblom1972) as electrically charged particles that repel one another but are confined within a limited space. De Boer (Reference de Boer2001) models the emergence of vowel systems using an agent-based simulation. Flemming (Reference Flemming2002) models dispersion in acoustic/auditory space using constraint interaction. The simulations of dispersion show that dispersion-based accounts of inventory structure are most effective when applied to a small number of vowels in low-dimensional phonetic spaces, such as F1-F2 or F1-F2′ space.
Maddieson (Reference Maddieson1984) shows that while some facts about inventories can be accounted for in terms of phonetic salience (e.g. the high rate of occurrence of [s]), it is clear that phonetic distance is not the whole story, because inventories typically involve fewer than the maximum number of phonetic dimensions, such that what is needed is a hierarchy of segment salience plus a hierarchy of contrast salience. The non-maximal utilization of phonetic dimensions has been explored under the guise of feature economy by Clements (Reference Clements2003, Reference Clements, Raimy and Cairns2009) and Mackie & Mielke (Reference Mackie, Mielke, Clements and Ridouane2011). Hall (Reference Hall2011) proposes a phonological contrast-based account of vowel system dispersedness.
Another major source of explanation for the distribution of frequently exploited combinations of phonetic features is the nonlinear mapping between different phonetic domains. Quantal Theory (Stevens Reference Stevens, David and Denes1972, Reference Stevens1989) accounts for the crosslinguistic frequency of certain speech sounds in segment inventories in terms of the nonlinear mapping between articulatory and acoustic parameters and between acoustic and auditory parameters. The regions of stability are associated with crosslinguistically frequent speech sounds.
Gick et al. (Reference Gick, Stavness, Chiu and Fels2011) observe that the most typical labial stops, fricatives, and approximants exhibit categorically different lip postures that exploit quantal regions in biomechanical–articulatory space. In other words, for consonants made with the lips, a stop can be made efficiently by bringing the lips together (bilabial), a fricative can be made efficiently by bringing together the lips and teeth (labiodental), and an approximant can be made efficiently by rounding the lips. These three quantal regions correspond directly to regions of the IPA consonant chart highlighted by density-equalization (bilabial stops, labiodental fricatives, and labial-velar approximants that are all more frequent than other manners of articulation at those same places). Just as the warped IPA vowel chart highlights the ubiquitous vowels that are accounted for by quantal relations in articulatory–acoustic space, the warped consonant chart highlights quantal relations in biomechanical–articulatory space.
Density-equalizing maps of IPA charts have value for displaying familiar typological facts about phonological segment inventories in a way that enables a visual gestalt impression of how languages exploit the available combinations phonetic parameters described by the IPA. The deformations of the idealized two-dimensional charts also provide a way of thinking about what function (in biomechanical–articulatory–acoustic–auditory–perceptual space) could map from the inventory of combinations of phonetic features that is provided by the IPA to their distribution in nature.
Acknowledgments
This paper has benefited from comments from two anonymous reviewers. The development of P-base has been supported by a Presidential Fellowship from The Ohio State University, the University of Ottawa Faculty of Arts and University Research Committee, SSHRC grants #410-2007-0735, ‘Measuring the Phonetic Similarity of Speech Sounds’ and #410-2010-0552 ‘Data Mining Sound Patterns’, the North Carolina State University College of Humanities and Social Sciences, and NSF grant BCS-1451475 ‘Phonological implications of covert articulatory variation’. Thanks to Steven Moran for help with PHOIBLE, and to Balthasar Bickel for help with AUTOTYP, and to Anthony Brohan for helping develop P-base 3.