

1 Introduction
Agent-based (AB) computational models are enormously innovative and flexible, able to incorporate nonlinear relationships, stochastic dynamics, and heterogeneous decision makers. But their flexibility exacts a price. AB models have so many degrees of freedom that a particular simulation can be designed to fit almost any data array. If we can always construct a computational version of some model that fits our data, is the model truly falsifiable? This malleability is especially troublesome when AB models verify their simulations by comparing a model's results to some vague stylized facts—facts that may have been considered during the model's design. We can do better. In this manuscript, we suggest that AB models be subjected to the same scrutiny commonly applied to neoclassical theory: their predictions should be tested empirically. Ultimately, it will be the empirical relevance of AB models that will lead to the broader acceptance of computational modeling as a standard theoretical tool in economics.
Fagiolo et al. (Reference Fagiolo, Windrum and Moneta2007) review the issue of empirical validation in AB models and provide a critical guide to the alternative validation approaches being explored in the AB modeling community. This study enters the empirical validation fray, but in a more traditional fashion. In this manuscript an AB model extends an established neoclassical theory and this extension generates empirical hypotheses, which are then tested using standard econometric procedures. This approach is in the spirit of the pioneering study by Young and Burke (Reference Young and Burke2001) who use an AB model to examine the geographic distribution of crop-sharing contracts in Illinois. Our objective is similar; to show by example, how a computational model can lead theory into areas it previously did not tread, and once that extension is complete, how we can proceed down the conventional hypotheses-testing pathFootnote 1. The specific topic under investigation is the relationship between innovation and organizational structure.
2 Innovation and organizational structure
Ravasi and Schultz (Reference Ravasi and Schultz2006) broadly define corporate culture as shared mental assumptions that define appropriate behaviors in organizations and thereby guide interpretation and action for various situations. The general agreement is that culture is a set of cognitions shared by members of a social unit (e.g. Smircich, Reference Smircich1983; O'Reilly et al., Reference O'Reilly, Chatman and Caldwell1991): those with strong cultures have both widely shared norms and values as well as employees who are dedicated to, and motivated to fulfilling, shared goals (O'Reilly & Chatman, Reference O'Reilly and Chatman1996; Sørensen, Reference Sørensen2002). Moreover, research links organizational culture to organizational effectiveness and shows that firms with certain cultural traits demonstrate more growth and profitability than others (e.g. Denison & Mishra, Reference Denison and Mishra1995). Although there are many different conceptualizations of organizational culture, some organizations are known to have a culture of innovation (Menon et al., Reference Menon, Bharadwaj, Adidam and Edison1999), seeming to have success with round after round of new products and ideas. Other firms seem innovatively moribund: new ideas in such firms consist of slight alterations in existing, well-established products. Why the difference, and more to the point, can we identify organizational characteristics that might explain this variation in innovative culture and thus performance?
A history of study on innovation (Schumpeter, Reference Schumpeter1942; Mansfield, Reference Mansfield1981; Scherer, Reference Scherer1982; Cohen & Klepper, Reference Cohen and Klepper1996) identifies size, research and development efforts, new-product marketing efforts, top management support, as well as the industry to which the firm belongs, and the country in which it resides as determinants of a firm's innovativeness. This study adds the potential effect of an organization's structure. Our contention is that the organization of a firm affects the evolution of that firm's decision-making processes, which affects the firm's corporate culture. Such a view is consistent with prior research examining organizational learning (March, Reference March1991), the effects of organizational design on individual decision making (e.g. Carley & Lin, Reference Carley and Lin1997), and the effects of organizational types on corporate culture (e.g. Harrison & Carroll, Reference Harrison and Carroll2006). For example, March (Reference March1991) argues that organizations store information in their forms (i.e. organizational networks), which, in turn, are used to socialize individuals in the organizations. Harrison and Carroll (Reference Harrison and Carroll2006) provide evidence that organizational types affect corporate culture through, among other things, recruitment and socialization. Thus, some organizational structures may be conducive to the proliferation of conservative decision makers, while others might foster innovative approaches to problem solving. Over time, the former entity is likely to evolve a stogy, tradition-bound culture and the latter a dynamic, innovative one.
An AB model of the evolution of corporate culture is constructed by extending Harrington's (Reference Harrington1998) model of rigid and flexible agents. Harrington studied the persistence of decision-making strategies by posing rigid, convention-bound agents against flexible, open-minded agents in a multi-tiered tournament to see which strategy tended to be the most successful. We impose spatial constraints on a revision of his model to represent an abstract organization's decision-making environment. In our model, firms are populated by agents with different decision-making philosophies; some are innovators, comfortable with change and willing to alter their strategy with changing circumstances. Others are more conservative, tradition-bound decision makers who are guided by ideology: they apply a particular set of procedures to every issue. We place these different agents into an organization and observe their performance as they are confronted with a series of decision-making situations. Over time, agents accumulate a record of success and failure, and, assuming successful agents proliferate while unsuccessful agents decline, the organization is eventually dominated by agents of just one type. This is the organization's emergent culture. Using this model, we can explore some characteristics of firms that tend to push them toward a flexible, innovative culture as opposed one that is conservative and tradition-bound.
Formally, consider a population of N agents who are making decisions as they face one of two possible states of the world, s ∈ {0,1}. In each time period agents are required to make a decision, d ∈ {0,1}. Decision ‘1’ is correct if the state of the world equals ‘1’, and d = 0 is correct if s = 0.
Three types of agents make these decisions. Two of these types are conservative decision makers who adopt a particular philosophy and adhere to it regardless of the current environment. They are named agents C 0, those who always decide d = 0, and agents C 1, those who always decide d = 1. The third type is innovative agents, I, who are agents willing to alter their perception of a problem as they respond to the world around them. Simply, agents I always choose the action that is appropriate given the state of the world, d = s. So, agent C 0 is correct whenever the state of the world is s = 0; C 1 is correct whenever the state of the world is s = 1, and innovative agents, type I, always make the correct decision.
The model is initiated by randomly populating an organization with agents of each type. Then at regular intervals pairs of agents are selected, a state of the world is randomly determined, and the agents execute their decision-making algorithm. If agent i is of type C 0, his opponent, agent j, is of type C 1, and the state of the world is s = 1, then agent i loses and agent j wins. Winning causes the successful decision-making algorithm to spread to the losing agent, in this example, agent i switches from being type C 0 to being of type C 1. This spread of a decision-making philosophy can be thought of as the loser seeing the light and becoming a disciple of the victorious agent. Over time, the decision-making philosophy of the most frequently successful agents spreads, the distribution of agents following each decision-making algorithm adjusts, and we can track the success of a particular approach by observing its spread or contraction.
In many situations the paired agents make the same decision. For example, suppose agent i is of type I (innovative), agent j is type C 1, and s = 1. Both agents make the correct decision, d = 1. In the case of draws, the agent with the greatest experience in executing that particular decision is victorious. Thus agents acquire proficiency with experience; if agent i makes decision 1 more frequently than agent j, then agent i becomes more proficient in that type of decision. If i and j meet, then agent i, being more proficient implementing decision 1, wins, and agent j switches from type C 1 to I. If both agents select the correct action and both are equally experienced, both survive to participate in the next round. Similarly, if two agents of the same type meet, both survive to the next round of play.
In the end, survival depends on both innovativeness and proficiency. Innovators always make the correct decision and thus outperform agents whose decisions do not match the current environment. But innovators build proficiency more slowly because they frequently switch strategies. Conservative agents more quickly acquire proficiency in their chosen philosophy because they always play the same strategy, but they sometimes make incorrect decisions. The interplay of these survival advantages, innovation and proficiency, drives the dynamics in this model and two parameters tune their relative importance. In each period a state of the world emerges randomly. In a perfectly symmetric world the probability of each state is identical and there is no systematic pressure for the population to make one type or another type of decision. Flexibility is the only credible strategy and all agents adopt it. But this outcome is less certain if one state of the world is more likely than the other. To allow for this more interesting circumstance, we weigh the probability that one state of the world emerges by a parameter demoted b, where b ∈ (1/2, 1). On average s = 1 is more likely to arise than s = 0. Thus, the value of parameter b alters the importance of being flexible.
Similarly, we tune the impact of proficiency, p, by restricting the length of each agent's memory. An agent acquires proficiency with experience, that is, the more often an agent chooses an action, the better he becomes at executing that action. However, proficiency fades because the value of practice decays over time and eventually vanishes. Proficiency is assumed to deteriorate linearly, the rate of decay being set by memory length. Specifically, labeling the maximum memory length as M, then agent i's proficiency is  , where
 is the decision (d ∈ {0,1}) made by agent i in the preceding M periods. For example, if M = 10, and agent i has used action 1 for the last four periods and action 0 for rest, then his proficiency value, p, for action 1 equals 1 + 0.9 + 0.8 + 0.7 + 0 + ⋯ +0 = 3.4. Note that a longer memory allows for a greater proficiency advantage for rigid agents, and if M = 0 all agents are equally proficient. Also note that agents retain their updated proficiency for each action when they switch types because it is their decision history that determines their proficiency.
With minor changes, the above describes the flexible/rigid-agent model created by Harrington (Reference Harrington1998), but at this point we make two significant departures. First, Harrington analyzed an infinitely large population in which losing agents die and are removed while surviving agents advance to the next level of play: even after many rounds and many deaths, many agents remain. In this study the population is finite, sometimes quite small and, as we shall see, size matters. Second, at every level of play in the Harrington model agents are matched with another agent chosen randomly from the entire population. In this model agents are embedded in an organization and their interactions do not occur with randomly selected agents from the entire population. Within organizations, individuals tend to interact with a few specific others—their colleagues and co-workers or their immediate subordinates and superiors—and they tend to interact with this smaller subset on a frequent basis.
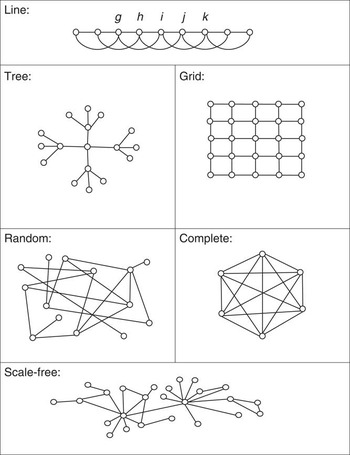
To formalize this organizational structure, we view the organization as a network. Each node of the network is occupied by an agent and the edges that connect nodes define which agents interact. Altering the architecture of the network alters the organization's structure. The question is, do these structural changes affect the evolution of the decision-making culture in some systematic fashion? To explore this possibility, we do not restrict the range of organizational structures by mapping the decision-making machinery of specific firms; instead we explore the evolution of decision making in abstract organizations with exaggerated characteristics. Among these organizations are linear, well-defined organizations, rigid hierarchical structures, organic or free-flowing organizations, and random networks. This study initially reports experimental results of six vastly different networks (these would be idyllic organizational structures) and later a series of more complex networks are created by randomly severing and reattaching edges in these base structures. By repeatedly playing the conservative/innovative decision-making contest in these hypothetical networks we can observe how network structure (organizational characteristics) can affect the evolution of corporate culture. To help visualize the organizational characteristics, a small sketch of each initial network is given in Figure 1.
Six example networks

Consider the line network at the top of Figure 1: each agent interacts with four other ‘neighbors’, two on each side, thus agent i interacts only with agents g, h, j, and k. One could imagine an organization in which individuals occupy offices along a hallway and pass along information with their closest office mates. But this line network is not intended to model an actual firm; more importantly it is instead used to explore the effects of a linear type of organization, one in which information would be passed along person to person to person. While there may be no firms that possess such a rigidly extreme architecture, many firms probably house some departments or areas that incorporate this sort of linear information flow. Similarly, the grid lends a two-dimensional spatial flavor to this ‘talk with your office mates’ construct, reminiscent perhaps of a cubicles space. The tree network can represent a standard hierarchical organization with a clear chain of command, and a complete network reflects a more egalitarian structure: anyone can interact with anyone. A random network, in which edges are random, is included to provide the contrast of decision making in a disorganized organization. Finally, the scale-free network is a frequently observed network consisting of a few hubs, nodes with many links, connected to nodes with few links. Small-world networks, also important in practice and theory, are added to the experiments in the next section.
It is important to reiterate that the hypothetical networks used in the computational experiments of the next section do not represent actual organizations. While it may be possible to map out precise communication networks of firms, that data- and time-intensive commitment would make it prohibitively expensive to attempt such a process for the 400 firms included in this study. Consequently, the simplified structures of Table 1 are used for our experiments. Their exaggerated characteristics allow us to distinguish between types of organizations, hierarchical versus integrative, for example, and to see if there is a tendency for different decision-making cultures to evolve based on those characteristics.
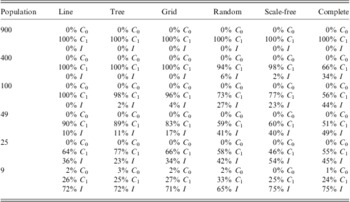
Percentage of times organizations converge to a particular conservative culture (C 0 or C 1) or an innovative culture (I)

Data in each cell come from 100 simulations, each with different initial distributions of strategies.
Combining the decision-making game and alternative network architectures creates the AB model used here. The shape of the organization's internal network defines the set of potential agent pairings. In other words, in each round of play, agent i is matched with a randomly selected agent from his immediate neighborhood, defined as the set of agents with whom he is linked. Depending on the state of the world, agent i wins and converts his neighbor or he loses and is converted. Manipulating the pattern of connections between nodes alters the internal structure of the organization: it changes the agents’ neighbors. We explore whether these alternative topologies systematically affect the evolution of a firm's innovative culture.
As the next section demonstrates, organizational structure seems to be a fundamental component of organizational decision making, that is, the same agents making the same decisions and facing the same states of the world behave differently in one organizational structure than another. The pattern of connections in an organization, or the topology of a firm's network, affects the evolution of corporate strategy and the mores of the eventual culture.
3 The emergence of a corporate culture
There is some precedent for using AB models to explore corporate culture. For example, March (Reference March1991) constructs a model in which individuals adjust to a corporate code while the code evolves in response to the actions of individuals. Carley and Lin (Reference Carley and Lin1997) and Chang and Harrington (Reference Chang and Harrington2005) use AB models to study organizational decision making and problem solving. And Harrison and Carroll (Reference Harrison and Carroll2006) simulate the effects of turnover and socialization on the convergence of culture. However, none of these papers goes beyond the simulation to see if those effects appear in nature. This study uses virtual experiments to construct hypotheses concerning the impact of organizational structure on innovative culture. Those hypotheses are then tested with empirical data from an international sample of firms.
Here, a series of virtual experiments explore structure and culture. In these experiments, a population of agents, like amounts of each agent type, C 0, C 1, and I, are randomly dispersed across a network. An agent, a neighbor of that agent, and a state of the world are all randomly selected to engage in a decision-making round. Each agent employs his decision-making philosophy (type I setting d = s, type C 0 setting d = 0, and C 1 setting d = 1). With the state of the world revealed, the winner survives and gains a round of proficiency, and the loser copies the victor's strategy type. Then a second agent is selected randomly; one of his neighbors is chosen; they make decisions, and so forth. The first round concludes after N random selections and, in each round, agents play no more than once. This implies that if agent i is randomly selected by his neighbor, he does not play again in that same round even if he is selected, and consequently in some rounds some agents do not playFootnote 2. The second round begins with another random selection of players and states of the world, and the process repeats.
Before executing the cross-network experiments, we align the AB model with the original analytic model developed by Harrington (Reference Harrington1998) to see whether the models yield comparable results under similar initial conditions. Thus, we consider a large population of agents (N = 900) and a complete network (one in which every agent is connected with every other agent). Harrington's original model assumed any agent could be matched with any other agent, which implies a complete network structure, although he did not identify it as such. Under these conditions our computational results readily replicate his analytical insights. For example, as the value of b increases, which increases the likelihood that s = 1, the benefits of being innovative and open to alternative strategies (being of type I) decline. This is intuitive: suppose b→1 so that s = 1 in almost every period. In such an environment there is little advantage to being an innovator because the conservative decision maker of type 1 is correct most of the time. Also consistent with Harrington, we find that a longer memory increases the advantage of being a tradition-bound decision maker. Recall that proficiency is acquired through practice: the more often an agent employs a particular decision, the more proficient he becomes. Thus, memory places a ceiling on proficiency. For example, if M = 10, an agent's proficiency reflects his actions in the last 10 rounds of play. Thus, a conservative agent can have 10 rounds of experience, which will defeat most innovators. However, if M = 0, there is no buildup of proficiency and the best philosophy is to be flexible. Harrington finds that even if memory is short (but >0), rigid decision making dominates, but with less memory it takes more rounds of play for that result to emerge. These dynamics exist in our computational analysis as well.
Axtell et al. (Reference Axtell, Axelrod, Epstein and Cohen1997) argue for the value of aligning computational models, showing that a new model can reproduce the results of an existing model before it offers an extension. This computational model successfully replicates the dynamics and the emergent properties of Harrington's (Reference Harrington1998) work, which anchors the computational approach to his analytic resultsFootnote 3. With that foundation, we can probe more deeply into the impact of different organizational structures by introducing different networks. As we shall see, altering an organization's structure can affect the evolutionary path of its culture.
3.1 Organizational structure: networks
To concentrate on organizational differences, we fix the parameters b and M and study a variety of different network structures, starting with the simple networks shown in Figure 1. These highly idealized networks are our starting point not because they represent actual organizations but because their simplicity lets us focus on specific network attributes. We analyze more complex and more realistic networks later in the section. We fix the parameter b = 0.6, and so expect state of the world s = 1 to occur about 60% of the time and s = 0 about 40% of the time. Memory is set at 10 periods (M = 10), so that proficiency in a particular action depends on the actions taken in the last 10 rounds of play. Once again agents of all three types are initially scattered about the organization and the decision-making duals begin.
At this point a critical constraint is imposed: we assume an organization's network architecture does not change during the experiments. Culture evolves but networks do notFootnote 4. This is a critical decision because it constrains the degrees of freedom in the model and the universe of potential results. In short, this restriction allows us to perform controlled experiments. By fixing the topology of the network at the beginning of each experiment, we can test specific network attributes and hold all other attributes constant. The experiment can then be repeated in a different (but also fixed) network. If networks are allowed to evolve, it would be difficult to isolate the impact of specific network characteristics, and designing empirical hypotheses would be too arbitrary (Wilhite, Reference Wilhite2006a, Reference Wilhite2006b). In addition, there is a practical side to this restriction. Even though most networks evolve over time, their evolution may occur more slowly than the pace of the economic decisions being made in the network. In such cases, a fixed network may be a better representation of reality than an evolving network.
Table 1 displays results of the many virtual experiments performed within this structure. Each network configuration, or organizational structure, was analyzed with different population sizes, the largest containing 900 agents and the smallest containing only 9 agents. Then, each network/population combination was subjected to 100 independent experiments; that is, the data in each cell of Table 1 reflect 100 different initial scatterings of the three agent types. The cells in Table 1 report the percentages of the 100 experiments that converge on various strategies. Each experiment ended with the universal adoption of a single decision-making strategy, sometimes a flexible strategy and sometimes a rigid one. Naturally, larger networks take longer to converge than smaller networks, and networks with a greater diameter (measured by the longest geodesic path in the network) tend to converge more slowly. However, most networks converge quickly, in less than 500 rounds of play.
Table 1 shows that conservative decision makers of type zero, C 0, rarely survive. Extinction is the logical end for these agents, as they are making the wrong decision most of the time. In some of the very small organizations these agents occasionally survive because the less likely state-of-the-world (s = 0) just happens to arise frequently in the early rounds of play. In those rare cases a culture of type 0 dominates by accident.
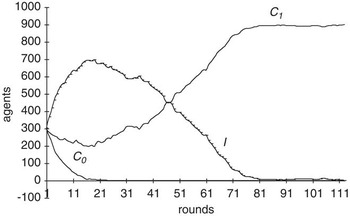
Second, reading down the columns we see smaller organizations are more likely to evolve into flexible, innovation organizations, while larger firms become more conservative. Why? As it turns out, size affects the length of the time horizon over which an organization's culture emerges, and this shorter time frame favors innovative activity. Figure 2 displays a representative firm of 900 individuals and shows the proliferation (or declination) of each type of decision maker in this organization. While the data relevant to Figure 2 emanate from a complete network, this pattern is typical of most large organizational structures. Notice how the dynamics unfold. Conservative decision makers of type 0 immediately start to decline and continue to do so until they disappear. Simultaneously, innovators grow rapidly to become the most prevalent type of decision maker in the early rounds. Over time, however, conservative decision makers of type 1 start to proliferate; innovative agents reach their peak and then decline until they too are extinct. This early proliferation of innovative agents coupled with their eventual decline reflects the shifting advantage given by innovation and proficiency. In the beginning, no agent possesses proficiency in any action, and so innovators win or tie in every round. Conservative agents of type 1 win or tie most of their pairings (because s = 1 is more likely than s = 0), but they lose when s = 0 and they are matched with an agent C 0 or I. Over time, however, the surviving C 1 agents gain an edge in proficiency because they have a history of making the same decision in every period. From then on, C 1 agents tend to win when s=1, and innovative agents win when s=0. Since s=1 occurs more frequently, C 1 grows and I declines.
Proliferation and demise of conservative and innovative decision makers

However, this proficiency advantage takes some time to develop, and in small firms the process can be truncated. In small organizations, the entire population may have switched to an innovative decision philosophy before conservative agents had a chance to establish their proficiency advantage. Thus, smaller firms are less likely to get locked into a fixed, ideological approach to decision making. Another observation can be gleaned from the dynamics sketched in Figure 2. Innovative decision makers tend to dominate in the early rounds of decision making. Thus, even though a firm's culture may not be fully formed, we expect younger firms to be more innovative. And, we might expect to see changes where young dynamic firms grow pedantic and conservative over time.
Third, notice how the number of firms adopting an innovative decision-making culture increases as we move horizontally to the right in Table 1. This increase in innovation stems from a more subtle organizational characteristic: it involves the pattern of the connections in these networks. The left side of Table 1 contains relatively formal, regimented organizational structures: the line, tree, and grid. Such organizations have extreme order, lines of communication that reflect a well-defined chain of command or a formal, almost mechanistic, set of procedures and processes through which decisions are channeled. Toward the right side of Table 1 lie networks with a less systematic structure, a more informal organization. By definition, random networks lack any systematic organization whatsoever. The complete network has a systematic structure because everyone is connected to everyone else, but it is not a very ‘organized’ organization. Thus, Table 1 suggests that organizations with a formal architecture that involves well-defined chains of communication will exhibit greater rigidity in their decision-making practices, while more free-flowing, open-access or organic organizations may be more conducive to a flexible decision-making culture.
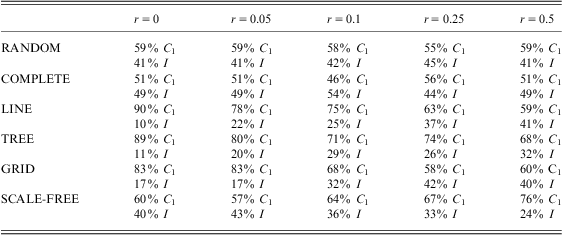
To look more deeply into that possibility, we investigate the impact of a more complex network structure on innovation by replicating these experiments after rewiring the networks into more irregular patterns. The rewiring process follows the small-world procedure described by Watts and Strogatz (Reference Watts and Strogatz1998): a node is randomly selected, one of its edges is severed, and then it is reattached to another randomly selected node. The amount of rewiring is controlled by a parameter, r, which is the probability that each node is rewired. If r = 0.1, then ∼10% of the agents selected for rewiring will actually have a connection cut and another attached, so higher levels of r lead to greater numbers of alterations in the networks’ links. A constraint imposed on this rewiring procedure is that the network must remain connected, that is, every node must be attainable from every other node. We do not allow rewiring to dissect a network into two or more distinct and separate networksFootnote 5. The rewiring process occurs before the decision-making experiments begin. Thus, rewiring simply creates new network architectures and, once the rewiring is complete, these new patterns are frozen and the decision-making evolution game begins. As before, the network architecture does not change during the experiments. The emergent cultures of these more complex structures are reported in Table 2.
RewiringFootnote * and organizational convergence to a conservative culture (C 1)Footnote ** or an innovative culture (I)
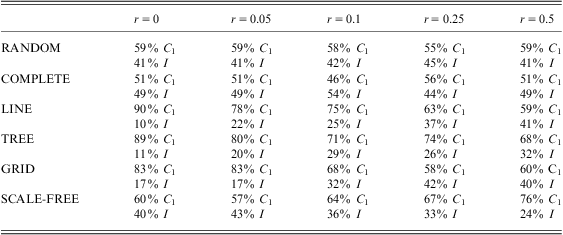
r = probability that any particular node is rewired. Population = 49
* In the complete network edges were only severed; in the tree edges were not severed, but added.
** No simulations converged to a conservative culture of type 0, thus C 0 is omitted.
In the first column of Table 2 the probability that an agent is rewired equals zero, and so these results replicate those of the original networks displayed in the fourth row of Table 1. Subsequent columns report the results of increased rewiring and show that rewiring affects different networks differently. For example, because the connections in a random network are random, a random rewiring has little effect. Severing a few links in the complete network also appears unimportant. However, in all three of the highly structured networks the increasing ‘messiness’ of its rewired links leads to organizations that are much more likely to evolve innovative cultures. Something about the unruliness of these rewired networks seems compatible with innovation. In Table 1, the least innovative organizations were the line, tree, and grid. In Table 2, we see that rewiring has significant effects on all of these previously rigid organizationsFootnote 6.
That excessive structure stifles creativity, while a randomly rewired, less formal network is fertile ground for creativity is intuitively appealing, but there is more than intuition at work here. There is a systematic reason why a less regimented and more organic organization increases the survivability of innovative agents. Recall that in all of these organizations agents interact solely with their neighbors; however, they indirectly interact with their neighbors’ neighbors and more indirectly with their neighbors’ neighbors’ neighbors, and so forth. For a particular decision-making strategy to spread throughout the network, it must spread neighbor by neighbor, and the pattern of connections influences this spread. As some randomly dispersed links are introduced into a regimented network, there is a greater mixing of strategies: in one structure different decision philosophies might be separated by several steps, but in another structure those philosophies might be physically close.
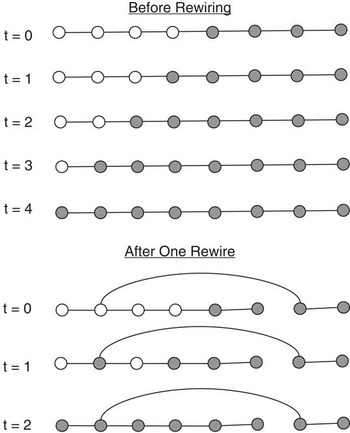
To illustrate, consider a straight line, k2 network in which half of the agents are innovative decision makers and the other half are traditionalists, and suppose a string of states of the world arise such that innovators win in every round. As shown in Figure 3, it takes a minimum of four periods for innovative agents to dominate this small organization. Compare that outcome with the same network after only one rewiring, as shown in the bottom of Figure 3. Innovative agents overtake the network in only two periods. Starting with a regimented network such as a tree, line, or grid, rewiring increases the exposure of agents to alternative decision-making philosophies. Greater exposure leads to a more rapid dispersion of strategies, and as we observed in Figure 2, speed favors innovators. Thus, these more complex networks are more likely to evolve an innovative culture.
Rewiring and the spread of innovative decision making (grey nodes represent innovative decision makers and white nodes conservative decision makers)

4 Empirical methodology and measurement
The AB model in the previous section suggests that smaller firms, firms with complex, small-world configurations, and younger firms are more likely to evolve an open and innovative atmosphere. These results were robust to changes in memory length and the probability weights on the state of the world (excluding trivial cases such as no memory). To test such conjectures empirically, we use data from a new-product development study conducted by Souder (Reference Song, Souder and Dyer1997) and funded by the National Science Foundation that covers more than 400 firms located in 15 different countries. The central objective of that study was to investigate the new-product development process, and so a team of researchers would enter an establishment and interview project managers of new-product development efforts. The interviewers attempted to explore at least one successful and one failing new-product development project in each firm. In addition to the interviews, these managers also answered a battery of survey questions that covered a range of information pertaining to the firm and to new-product development. These surveys contain the information used here.
Within each of the 400 firms, one or more new-product development projects were singled out and studied in detail, providing data on more than 900 innovation projects. Data were collected on attributes of the firm and on specific projects within each firm. The survey also gathered rudimentary information on organizational structure, and these parallel observations on structure and innovation allow us to test the hypothesis that structure affects innovation.
There are shortcomings to these data. For example, while certain firm characteristics are measured directly (size, industry group, etc.), much of these data represent responses to an interviewer's question. Those data capture an individual's perception of things as opposed to capturing actual things. Furthermore, the information concerning an organization's structure lacks the specificity needed to plot a company's organizational network with precision. Consequently our network measures are indirect and descriptive. Nonetheless, having firm-level and project-level data on organizational structure and innovation is uncommon, and it allows us to explore the hypothesized relationship between structure and a firm's decision-making culture.
Data were collected at two levels of aggregation: the individual firm is the initial unit of analysis, and then we disaggregate to focus on specific innovation projects within firms. At each level of aggregation, different measures of innovativeness are reported and different information is provided on the firms’ organizational structure. This provides a variety of perspectives of the impact of structure on innovation.
In three of the following regressions the dependent variables measuring innovation are categorical and rank-ordered. For example, one dependent variable measures the perceived commercial success of an innovation using responses in one of five categories ranked from ‘far below expectations’ to ‘far above expectations’. To account for the discrete nature of the dependent variables and yet still take advantage of the information provided by the ranking of responses, we use an ordered probit model to estimate the impacts of the independent variables on innovation.
Ordered probit is a generalization of the probit model. To estimate such models, begin with a latent regression

We do not observe y* but instead observe responses y = i, if  ⩽y* ⩽
 for a finite number of possible responses, i. The
 's are unknown parameters, or cut points, that measure an intensity of feeling by the respondent. Thus, as a respondent becomes more passionate about an issue, there is some point,
 beyond which his response shifts from ‘agree’ to ‘strongly agree’. Those unknown
 's are estimated with
 , using a set of independent variables expected to influence this intensity of feeling. Assuming e is normally distributed across observations, we estimate the probability of observing response i as a linear function:

where Φ is the standard normal cumulative distribution function.
We use this ordered probit model to ask, ‘does the organizational structure of a firm affect the level of innovation occurring in that firm?’ Following others (Schumpeter, Reference Schumpeter1942; Mansfield, Reference Mansfield1981; Scherer, Reference Scherer1982; Cohen & Klepper, Reference Cohen and Klepper1996), the level of innovative success is expected to be related to firm size, the resources dedicated to R & D, the resources devoted to business and marketing plans for the product, the industry to which the firm belongs, and the country in which it resides. To those traditional measures we add variables that reflect some of the organizational attributes of firms so as to test whether those attributes affect innovation.
Our computational experiments suggest firms with less formal, more organic structures are more likely to be open to innovation, while rigid, hierarchical organizations are more likely to become conservative decision makers and less tolerant of change. This generates our first set of empirical hypotheses, and four different network measures are used to test whether the structure of the organization influences innovation. The virtual experiments suggest the size of the firm may matter as well. The question of firm size and innovativeness has received considerable scrutiny, but empirical studies have not yet reached a consensus on this issue. Schumpeter (Reference Schumpeter1942) suggests large, profitable firms can more readily afford innovation and Cohen and Klepper (Reference Cohen and Klepper1996) argue that ‘cost spreading’ gives an additional advantage to large firms, but empirical work has not provided consistent support for this relationship (see Scherer, Reference Scherer1992). Teece (Reference Teece1996) suggests that size may be a detriment to innovation, but he does not propose a formal model to support that contention. This paper provides such a theoretical link, but faces the same empirical challenges of the past studies, that is, size may have different and opposing impacts on innovation. All else equal, the computational model suggests that smaller firms are more open to flexible decision making and thus we expect them to be more innovative.
The dynamics of the virtual experiments (Figure 2) suggests innovativeness is more pervasive early in an organization's existence. Younger organizations are more likely to tolerate and/or encourage innovation. But with the passage of time, conservative decision makers gain an edge in proficiency, which can allow them to eventually dominate the organization's culture. This dynamic suggests another testable hypothesis: that younger firms might be more innovative and more successful with their innovative activities than older firms, ceteris paribus.
Empirical tests require data, data require measurement, and this paper faces considerable measurement challenges. The first is to measure innovativeness, recognizing that any measure will be indirectFootnote 7. At the firm level of analysis we use two innovation metrics. The first reflects the percentage of the firm's products that are ‘new’. Interviewees were shown a taxonomy of the product life cycle in which a product goes through four stages: introduction, growth, maturity, and decline. They were then asked, ‘What percentages of your current products are in each stage?’ Summing the percentage of products in the introduction and growth stages yields the first measure of innovativeness. Thus more innovative firms are defined as firms with a higher proportion of ‘new’ products in their product mix.
The second measure of a firm's innovativeness is based on its commercial success with innovation. Each firm was asked, ‘What has been your commercial success rate for new products in the last three years?’ Responses were coded from 1 to 5, in which 1 = success that was ‘far below expectations’ and 5 = success ‘far above expectations’. The underlying assumption is that firms that are more comfortable with innovation and change are more likely to have greater commercial success with their innovation, on average, than less innovation-friendly firms.
The more disaggregated, project-level data concentrate on specific innovation projects within each firm and contain additional information on the firm's internal structure. Again, two dependent variables were used to capture different aspects of innovativeness. The first measure of innovativeness rates the ‘degree of innovation’ of this new product. Respondents were asked to classify this product as being:
1 = a brand new product for which a market is undefined,
2 = a new product for which a market is known but for which this firm is not known,
3 = a new product in one of this firm's currently served markets,
4 = a product-line extension to this firm's existing product line, or
5 = an improvement to an existing product.
The network model suggests that firms with a structure that encourages innovative decision making are more likely to introduce radically new products and to stretch themselves into new markets. More soberly structured firms are expected to lean towards product-line extensions and improvements to existing products.
The second project-level measure of innovation mirrors the commercial success data collected at the firm level. Each respondent was asked to rate this new product's commercial success as being far below expectations to far above expectations on a 5-point scale. As before, we expect more irregularly structured firms to be more attuned to the challenges of innovation and thus to have greater success with their innovative endeavors.
The second quantification challenge is to find measures of the internal network structure of a firm. These data do not permit a direct mapping of a network, but at each level of aggregation there are some questions that reflect on that structure. In the more aggregated, firm-level data, managers were asked about their concerns with ‘shepherding ideas through the bureaucracy’, rating their concerns from 1 (no concern) to 5 (a great deal of concern). In general, a higher score reflects a more rigid, stifling organization and a lower value reflects a more open, less hierarchical, or less bureaucratic structure. Managers were also asked how much they emphasize ‘communication between groups and functions’. Those placing an emphasis on communication (an open network) recorded a 5 and those with no concern recorded as 1. As explanatory variables, the categorical nature of these measures is problematic. This 1–5 scale is an ordinal ranking of opinion, not a cardinal measure of their relative importance, and thus it would be inappropriate to use these data in their raw form. Consequently two dummy variables were defined, bureaucracy concerns and communication concerns. In each case, the variable = 1 when respondents answered 4 (a large degree of concern) or 5 (a very large degree of concern). Otherwise the variables = 0.
These dummy variables are used in the analyses reported in Table 4, but, to further explore the relevance of organizational structure, a matching set of regressions were studied in which the organizational dummy variables concentrate on the more severe instances of concern. In this alternative specification the variables, bureaucracy concerns and communication concerns, are set =1 if the response is 5 (a very large degree of concern) and is set =0 otherwise. Because both measures yield similar results, only the initial estimates are reported in full, and significant differences are noted as they arise.
The project-level survey data also yields two different organizational structure variables, the first which was adapted from Burns and Stalker (Reference Burns and Stalker1968). Respondents were asked, ‘How would you classify the project organization?’ and were then asked to respond according to a scale that ranged from Mechanistic to Organic. A mechanistic organization was described as one characterized by
Rigid, hierarchical reporting relationships. Personnel have highly specialized jobs. There is no free flow of people and information across jobs. There are rules regarding the performance of tasks.
An organic organization was described as one characterized by
Delegation and decentralization of authority. There is free flow of people and information across different jobs. There is wide latitude as to the means used to achieve objectives.
Responses were coded categorically on a 1 (mechanistic) to 5 (organic) scale. This mechanistic/organic scale and the accompanying description of each is reminiscent of the networks used in the rewiring experiments of Section 2. Before rewiring, the line, the tree, and the grid are rigid and hierarchical (mechanistic); after rewiring, they are more decentralized, with a freer flow of information across distant parts of the network (organic). Because the rewiring experiments suggest that organic organizations are more conducive to an innovative culture, we hypothesize that ‘organic’ organizations will be more innovative and more successful with their innovation.
In addition, individuals were asked to comment on the statement, ‘There was adequate participation in decision making by people involved in the project’. Responses were ranked on a 5-point scale ranging from strongly agree (=1) to strongly disagree (=5). We expect organizations open to greater participation to evolve into innovative firms and we expect them to experience greater commercial success with those innovations. As in the firm-level data, these ordinal categories are transformed into dummy variables, indicating an organic organizational structure and greater participation. Organic structure = 1 if respondents rate their organization as a 4 or 5 on the mechanistic/organic scale, and participative style=1 if respondents agree (4) or strongly agree (5) that there is adequate participation in the decision-making hierarchy. Once again, we also define a stronger version of each of these dummy variables so that organic structure = 1 only if respondents rate their organization as 5 on the mechanistic/organic scale and participative style=1 only if respondents strongly agree. Differences that arise because of these alternative definitions are noted in Table 4.
The computational experiments also suggest that smaller firms should be more innovative even though previous studies claim that larger firms will be more innovative because they have more resources to fund innovation. This empirical question is tested by including firm size, measured as the number of employees. While there are other potential measures of firm size (output or sales, for example), the number of employees is appropriate for this study because our computational model suggests that it is the size of the organization's network of individuals that influences its culture. Thus more workers should lead to a more rigid, hierarchical system that inhibits innovation.
Finally, we expect younger firms to be more innovative. This hypothesis was not a parameter we planned on exploring when the computational model was initially constructed. Instead this is an emergent property of the virtual experiments. As demonstrated in Figure 2, as these virtual organizations evolve, they go through an early stage of open, innovative, decision making. Typically this fades over time so long-lived firms tend to evolve more rigid, conservative cultures that resist innovation. Firm age is calculated as the difference between 2003 and the founding year of the organization.
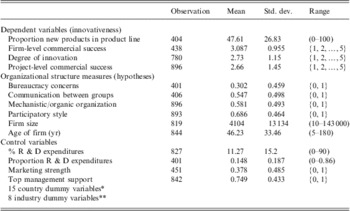
The remaining explanatory variables account for the influences of other market, industry, and firm attributes that earlier studies have identified as important factors in influencing the level of innovation undertaken by firms. These control variables include a measure of funding for research and development (as a proportion of the firm's total sales). Naturally, we expect both greater resource investment in R & D and the percentage of the firm's workforce employed in R & D to be positively related to innovation (Acs & Audretsch, Reference Acs and Audretsch1988). Song and Parry (Reference Song and Parry1997) and Song et al. (Reference Song, Souder and Dyer1997) demonstrate that the level of top management support for a project as well as the marketing effort put forth for the innovation have been shown to have significant effects on that innovation's success. We have measures for each. Finally, we introduce a host of dummy variables for the industry and country in which the firm resides. Industry effects are long associated with different levels of innovation (see the review article by Scherer, Reference Scherer1982) and while cross-country effects are less frequently studied, Nakata and Sivakumar (Reference Nakata and Sivakumar1996) document a significant cultural influence on innovative activity. Table 3 provides summary statistics of the data for these measures.
Summary statistics

*United States of America, Japan, New Zealand, the Netherlands, United Kingdom, Norway, Belgium, Australia, Korea, Taiwan, Germany, Sweden, Scandinavia, France, and Ireland.
**Rubber, plastics, stone, clay, and glass; primary and fabricated metals; industrial machines and equipment; electronic and electric equipment; transportation equipment; instruments and related products; business services; food, furniture, and paper.
5 Empirical results
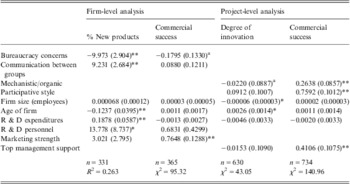
While the particular measures of network structure used here are indirect, they capture enough of the flavor of the computational model presented above to mount a test of the premise that organizational structure affects innovation. Starting with the firm-level analysis in the first two columns of Table 4, managers who express concern about the bureaucratic bottlenecks in their organizational structures tend to belong to firms that have fewer products in the early stages of the product life cycle. These firms have not kept pace with their less rigid counterparts when it comes to introducing new products into their product mix. This result is bolstered by the similarly depressing effect of a rigid structure on the commercial success of the firm's new products. As hypothesized, a rigid decision-making culture seems to suppress the firm's ability to innovate and dampen the energy needed to make innovation successful. In addition, firms that stress communication across functional groups had significantly more new products in their product mix, but communication did not affect the firm's commercial success with innovation.
Estimated coefficients of innovation

Standard errors lie below the estimated coefficients in parenthesis.
**Indicates significance at the 0.05 level; * at the 0.10 level.
aUsing the more severe measure of bureaucracy concerns and mechanistic/organic organizations, these coefficients were strongly significant as well.
The last two columns of Table 4 report the project-level analysis. Consider the effect of an organic versus a mechanistic structure on the degree of innovativeness. Organic organizations do not seem to exhibit a greater degree of innovation, but this result changes when the more severe measure of organic/mechanistic organization is used. Firms that were rated most strongly as having an organic structure (5 on the organic/mechanistic scale) were significantly more likely to introduce new products that are a radical departure from their current product line. Alternatively, mechanistic, rigid organizations are more likely to confine their innovation to existing product line extensions and variations on products they already offer. Organic organizations also report significantly greater commercial success with their new products than do mechanistic organizations. As hypothesized, because an organic organization is more conducive to an innovative culture, it achieves greater commercial success from its innovation.
The final measure of the organizational structure of a firm was its ‘participatory style’. When firms report that a particular project was organized with a more participatory style of management, they also tended to report greater commercial success with their new products (as expected). However, greater participation did not significantly affect the degree of innovation.
The impact of size is less definitive. The firm-level data did not find size to be significantly related to either the product mix or the commercial success of the firm's innovations. The project-level data suggests that smaller firms do indeed offer more radically different products than larger firms, as expected, but there was no effect on their commercial success. While the computational model in Section 2 suggests smaller firms are more likely to evolve a culture of innovation, ceteris paribus, there are other size effects that may work in the opposite fashion. Cohen and Klepper (Reference Cohen and Klepper1996) offer several reasons why larger firms may have an innovative edge: cost spreading, greater access to finance, a greater ability to internalize spillovers, and their ability to absorb the risks associated with R & D. Thus, size may alter a firm's innovative culture, but that organizational effect on innovation may be offset by other attributes of firm size. Viewed alternatively, the conventional view articulated by Schumpeter (Reference Schumpeter1942), that size increases the level of innovation, has received mixed empirical support through the years. This study may offer an explanation as to why: size may give a firm greater access to financial capital and spread risk, but it may also foster a culture that does not promote innovation.
The computational experiments also suggested that younger firms are more likely to embrace innovative cultures, and that property is present in the empirical data. Older firms have significantly fewer new products in their product line and younger firms are more likely to introduce radical innovations than are older firmsFootnote 8. Interestingly, while younger firms are more innovative than older firms, they are not more successful in commercializing those innovations. It seems that the experience of older firms allows them to be as successful with less innovation as their younger, more innovative counterparts.
The remaining explanatory variables reported in Table 4 perform as expected, consistent with the previous research on innovation. Firms that channel more money into research and development are more innovative but do not necessarily have greater commercial success with those innovations. Firms that have a higher proportion of their personnel engaged in R & D are also more innovative, but they are not more commercially successful with those products. While greater resources invested into R & D should lead to increased innovation, there is no reason to expect that R & D will translate into commercial success: engineers innovate, but do not make sales. Commercial success should follow greater investment into business and marketing activities, and Table 4 speaks to that expectation. A firms’ commercial success with innovation is greater when they have a marketing department with experience with new-product development and when they have top management support for projects. But marketing and managerial expertize does not increase the amount of innovation. The consistency of this study's empirical results with the existing literature increases our confidence that this sample captures some of the basics of firm innovation. To those established results we suggest there may be an effect of organizational structure, specifically that irregular, small-world networks are more conducive to innovative activity.
6 Conclusions
The Achilles heel of AB modeling has been empirical verification. AB computational models can produce captivating economic simulations, but, absent testable, refutable hypotheses, such models are sometimes dismissed as little more than stories. Science is cautious, conservative. New tools and methodological innovations are scrutinized before they are embraced by the broader community. This paper suggests that AB models can withstand that scrutiny.
Three critical steps help validate this model. First, we take an existing analytical model and extend it computationally to create a model of innovation and corporate structure. The first test was to see if the expanded computational model would replicate the results of the analytical model given similar initial conditions. It did. Second, we fix the architecture of the underlying network throughout each experiment. This greatly constrains the set of potential results and allows our experiments to isolate the impact of different network shapes on the evolution of culture. To AB modelers this may be the most egregious step because it limits one of the powerful features of computational modeling—that all things can vary. In many AB models such constraints may be unnecessary; in this study it allows us to isolate the effects of organizational structure and to run controlled experiments. Third, the virtual experiments lead to empirically testable hypotheses that are tested using data from a sample of international firms. Empirical validation moves the model from being an interesting simulation to a plausible explanation of innovation that may have predictive power.
And the model does yield insight. Virtual experiments suggest organizations with open organic architectures—topologies that possess small-world characteristics—tend to evolve an open-minded culture willing to experiment with different approaches to problems. Alternatively, rigid, highly ordered, or hierarchical networks are less tolerant of new ideas and less willing to explore unique approaches to problems. The empirical results support those conjectures. Furthermore, those cultural differences seem to impact performance. Not only are mechanistic, hierarchical firms less likely to innovate, they have less commercial success with the innovations they possess.
These empirical results continue to suggest that organizational structure may have a broader effect on innovation than other, more well-known innovation factors. For example, as resources flow into R & D, firms become more innovative, but they do not necessarily benefit commercially from these innovations. Alternatively, as firms put more resources in the business side of innovation (marketing and management resources), they do not generate more innovations, but they reap greater commercial success from the innovations they have. However, organizational structure influences both: a firm with an open organic corporate structure tends to generate more innovations and tends to reap greater commercial success from those innovations.