1. Introduction
Cognitive linguistics regards meaning and meaning making as the basic foundation of language, and further considers that language is best understood as a reflection of humans’ experience with the physical–spatial–social world. In other words, humans utilize their understanding of spatial concepts as a framework for representing abstract concepts which accompany sensory imagery (Hendriks & Hickman, Reference Hendriks, Hickman, Cook and Bassetti2015). Langacker (Reference Langacker1987) argued that sensory imagery generates a real physical phenomenon with a vivid and realistically evocative picture in the mind; the visual image embodies our emotions, self-reflective concepts, and abstract concepts. Furthermore, Talmy (Reference Talmy2000) stated that spatial language constructs an entrenched foundation in the visual processing system, which extends notions of spatial boundedness to explain more abstract concepts in English. These central organizing principles of cognitive linguistics led Lakoff and Johnson (Reference Lakoff and Johnson1999) and many others (see Grady, Reference Grady, Gibbs and Steen1999, for a review) to develop conceptual metaphor theory (CMT). This theory argues that metaphor maps a physically embodied source domain onto a more abstract domain, which structures our understanding of this abstract concept. CMT provides the theoretical background to this study.
Grady (Reference Grady, Gibbs and Steen1999) argued that conceptual metaphors do not reflect the most basic level of human cognition, and proposed primary metaphors, which are based on more fundamental human experiences, and experiential correlations (Littlemore, Reference Littlemore2009). Primary metaphors are central to the present study, which involves concept projection as a device to aid L2 learners in learning politeness. Using this framework, L2 learners map one distinct simple concept – the spatial concept of either near–far or high–low – in the source domain onto another distinct simple concept – degrees of intimacy, power, and speaker difficulty – in the target domain, preserving the image schema of the source domain.
Panther and Thornburg (Reference Panther, Thornburg, Panther and Thornburg2003) proposed the politeness is distance metaphor where politeness is embodied in terms of distance; requests with a lower degree of politeness stemming from reality space are closer to speakers (e.g., Clean my room), whereas requests with a higher degree of politeness, originating in hypothetical space, are further from speakers (e.g., I wonder if you could clean my room). According to the politeness is distance metaphor, requests with past tense modal verbs in the hypothetical space would be more or less impositive than requests without past tense modal verbs in the reality space. This is because past tense verbs (e.g., could, would) hypothesize future actions/conditions in hypothetical space and enable the possibility of realizing the speakers’ intentions further away from the speakers (Littlemore, Reference Littlemore2009). Finally, present tense verbs indicate certainty about future actions/conditions in the reality space and create the possibility of realizing the speakers’ intentions closer to the speakers.
This study takes into account the politeness is distance metaphor along with the three social context variables of power, intimacy, and speaker difficulty and investigates how student participants conceptualize abstract concepts in terms of spatial concepts through two cognitive linguistic approaches, using animated versus static scenes in an illustration. This is especially relevant for learning L2 pragmatics.
2. Pragmalinguistics and socio-pragmatics in teaching L2 pragmatics
Verbal interaction and contact can produce meanings beyond the literal meaning of an utterance. Pragmatic knowledge assumes a key role for verbal interaction and contact and holds a clue to the understanding of a speaker’s intentions and the responses that follow it. Without pragmatic knowledge, there would be very little chance of understanding a speaker’s intention and meaning; thus, pragmatic proficiency is indispensable in order to deepen our mutual understanding of each other.
Pragmatic proficiency is an ability to comprehend the speaker’s intention and meaning under its particular context. It is considered extremely difficult for English as a Foreign Language (EFL) learners to ameliorate their English pragmatic proficiency because they have to pay attention to not only form–meaning connections but also to the contextual surroundings behind them. Knowledge of the strategies for realizing a speaker’s intentions and the linguistic items used to express them are called knowledge of pragmalinguistics, whereas knowledge of the contextual surroundings governing language use is called knowledge of socio-pragmatics (Leech, Reference Leech1983; Thomas, Reference Thomas1983).
Bardovi-Harlig (Reference Bardovi-Harlig2013) emphasized the importance of developing learners’ pragmalinguistic and socio-pragmatic knowledge in the second language (L2) in order to produce appropriate language for different contextual situations. Kasper and Rose (Reference Kasper and Rose2002) also pointed out the importance of teaching both pragmalinguistic forms and socio-pragmatic rules. They argued that some form of awareness-oriented instruction should be employed to make pragmalinguistic forms and socio-pragmatic rules more salient so that learners would be aware of them. This would facilitate the improvement of their pragmatic proficiency because mere exposure to them in use does not help learners notice them. Therefore, this study investigates one possible way to associate pragmalinguistic forms with socio-pragmatic rules in order to generate optimum L2 pragmatic strategies.
3. Research on teaching L2 pragmatics
Many past experimental studies (Takahashi, Reference Takahashi, Martínez-Flor and Use-Juan2010; Taguchi, Reference Taguchi2015) have examined the relative effects of implicit and explicit pragmatic instruction and have developed different methods to improve pragmatic proficiency within an explicit–implicit paradigm. Kasper (Reference Kasper, Rose and Kasper2001) explained that the explicit method entails teacher-fronted pedagogical intervention with a direct meta-pragmatic explanation preceding the focused practice. Accordingly, this implicit method guides learners in developing their awareness of the target pragmatic features through meaningful activities. Both explicit and implicit approaches attempt to combine the target form–meaning pairings with contextual variables in action.
Previous instructional intervention studies (e.g., Takahashi, Reference Takahashi, Rose and Kasper2001; Alcón-Soler, Reference Alcón-Soler2013) discovered that the explicit instructional approach is generally more effective than the implicit instructional approach. Nevertheless, implicit teaching may be equally as adequate as explicit teaching if it includes meaningful activities which lead learners to increase their pragmatic awareness of target pragmatic features (Takahashi, Reference Takahashi, Martínez-Flor and Use-Juan2010; Taguchi, Reference Taguchi2015). Although speech acts – requests in particular – were treated as target pragmatic features in many of the recent studies (Halenko & Jones, Reference Halenko and Jones2011; Li, Reference Li2012; Alcón-Soler, Reference Alcón-Soler2013; Nguyen, Reference Nguyen2013), several studies dealt with discourse organizational skills (Liddicoat & Clozet Reference Liddicoat, Crozet, Rose and Kasper2001) and conversation devices (Sardegna & Molle Reference Sardegna and Molle2010; Narita Reference Narita2012).
Most of the previous empirical studies have tended to focus on whether L2 learners were able to recognize and use the pragmalinguistic realization patterns most appropriate under the given situation, while L2 learners’ socio-pragmatic knowledge was evaluated primarily in terms of whether they could make a correct linguistic selection based on social variables under each given context. Such an emphasis on the pragmalinguistic aspects rather than the socio-pragmatic domain has had an influence on L2 learners’ learning outcomes. For example, Takahashi (Reference Takahashi, Rose and Kasper2001, Reference Takahashi2005) conducted experimental studies investigating the effects of four different explicit instruction conditions on Japanese college students learning English request strategies. They were teacher-fronted explicit explanations, form-comparison, form-search, and meaning-focused conditions. These four treatment conditions were different in that the teacher-fronted explanations showed the greatest degree of explicitness, while the meaning-focused condition indicated the least. The results revealed that the teacher-fronted explanation group performed better than the other three groups in three highly imposed situations (HIS) of discourse completion tests, with a significantly smaller number of non-target forms provided (x 2 = 7.26, df = 1, p < .01 for HIS 1; x 2 = 12, df = 1, p < .001 for HIS 2; x 2 = 5.04, df = 1, p < .05 for HIS 3). Notably, some learners in the other three groups did not carry out appropriate pragmalinguistic realization patterns in line with given social conditions. As the research (Takahashi, Reference Takahashi, Rose and Kasper2001, Reference Takahashi2005) mentioned above supported explicit instruction, Takahashi also noted that a less explicit instruction was not capable of directing the learners’ attention to contextual meanings, and the learners ended up misconstruing socio-pragmatic norms under given contexts.
To summarize, the previous studies suggest that explicit instruction with meta-pragmatic information should: (1) guide learners to enhance their cognitive awareness of the importance of connecting pragmalinguistic and socio-pragmatic aspects of the pragmatic target; and (2) provide opportunities to direct learners to process them, then integrate them into their knowledge. However, such generalizations may not always work best in all circumstances. Rather, inference from the learners’ linguistic behavior in previous studies, along with more required research, is needed to draw a definitive conclusion. Of particular importance is enhancing leaners’ interest in learning the pragmatic target and raising their cognitive awareness of form–meaning–context mappings of the pragmatic target. This will enable learners to proceed to the next step of integrating form–meaning–context relations into their learning system.
To aid L2 learners in internalizing the pragmalinguistic and socio-pragmatic aspects of a pragmatic target, Littlemore (Reference Littlemore2009) explained that embodied cognition utilizing the spatial concept helps L2 learners to connect those aspects of the pragmatic target and acquire the concept of politeness. Littlemore and Low (Reference Littlemore and Low2006) suggested utilizing figurative thinking to acquaint learners with the use of different degrees of politeness according to contexts. Accordingly, Takimoto (Reference Takimoto2020b) adopted the spatial concept to develop Japanese EFL learners’ pragmatic proficiency related to degrees of politeness in making requests. He applied primary metaphors that accompanied a spatial concept projection through which participants comprehended degrees of intimacy, power, and speaker difficulty in terms of the spatially visualized concepts of near–far and high–low. Littlemore (Reference Littlemore2009) argued that primary metaphors represent a wider view of human cognition that provides a more cognitively embodied phenomenon, lending themselves more readily to rigorous empirical testing than conceptual metaphors. The results demonstrated that the spatial concept-based learning group performed significantly better than the rote-learning group and produced long-term retention of their target politeness requests.
Thus, the present study considers the application of spatial concepts in cognitive linguistics as advantageous for learning L2 pragmatics. This will help learners develop their cognitive awareness of the pragmalinguistic and socio-pragmatic aspects of different degrees of politeness, integrate them, and finally increase their pragmatic proficiency.
4. Application of spatial concepts in teaching L2
The cognitive linguistic approach provides experimental evidence of the usefulness of applying cognitive linguistics to teaching L2. For example, Holme (Reference Holme2012) applied the following four principles to teaching L2 construction: embodied learning, conceptualization, the lexico-grammatical continuum, and usage. Accordingly, Couper (Reference Couper2011) incorporated the theoretical background of cognitive linguistics into the teaching of L2 pronunciation. A noticeably productive theory in cognitive linguistics has been conceptual metaphor theory, which has been extensively utilized in the learning of grammar and vocabulary. Furthermore, a number of intervention studies have examined the effects of the metaphor awareness-raising approach on the retention of words or phrases, and have reflected favorable results (Csάbi, Reference Csάbi, Achard and Niemeier2004; Berendi, Csάbi, & Kövecses, Reference Berendi, Csάbi, Kövecses, Boers and Lindstromberg2008). Conversely, some studies have produced indecisive findings about the effectiveness of the metaphor awareness-raising approach, with both metaphor awareness-raising approaches on grammar and vocabulary learning, and other types of approaches, bringing about similar effects. (Gao & Meng, Reference Gao and Meng2010; Yasuda, Reference Yasuda2010; Reif, Reference Reif2012; Tyler, Mueller, & Ho, Reference Tyler, Mueller, Ho and Tyler2012).
To date, previous studies in the area of grammar and vocabulary learning have presented both conclusive and inconclusive findings related to the metaphor awareness-raising approach. Unlike the aforementioned studies, a few studies have adopted the primary metaphor to investigate the efficacy of the metaphor awareness-raising approach (Takimoto, Reference Takimoto2020a, Reference Takimoto2020b; Tyler, Mueller, & Ho, Reference Tyler, Mueller and Ho2010). Tyler et al. (Reference Tyler, Mueller and Ho2010) investigated the effects of the metaphor awareness-raising approach on teaching English modal verbs to EFL learners at a university in the United States. The group was instructed about English modal verbs through a diagram which depicted the use of present tense modal verbs as indicating the highest degree of surety, in contrast to the use of past tense modal verbs indicating a lower degree of surety. The results showed that the metaphor awareness-raising approach group outperformed the traditional group all the way from pre-test to post-test.
Takimoto (Reference Takimoto2020a) evaluated the effectiveness of the spatial concept-based metaphor awareness-raising approach on teaching different degrees of certainty, through animated illustrations on computers, to Japanese EFL learners. The spatial concept-based metaphor awareness-raising approach group understood the degrees of politeness in terms of the spatially visualized concepts in the animated illustrations, whereas the non-cognitive linguistic approach group memorized target English bi-clausal-mitigated requests in a list. The results revealed that the metaphor awareness-raising approach group achieved more significant gains than the traditional teaching group on three post-tests; they also demonstrated maintaining the degree of certainty in long-term memory.
Both studies demonstrated that the primary metaphor can be effectively embedded in the metaphor awareness-raising approach in order to generate positive effects on L2 vocabulary learning. The results of Takimoto’s (Reference Takimoto2020a) study implied that the positive efficacy of the spatial concept-based metaphor awareness-raising approach might have been attributable to the animated visualization to some extent, and it is necessary to further explore animation effects in the area of L2 teaching.
5. Animated visualization in teaching L2
Animation is considered useful in helping learners to understand complex ideas more easily. Animated pictures are motivational with regard to making target features more salient and reducing leaners’ cognitive load, whereby they can develop their mental image of presented situations with external support (Scheller, Reference Scheller2009; Niemeier, Reference Niemeier2017).
However, there are other researchers who view animations with more suspicion and thus recommend limiting their use. Tversky, Morrison, and Betrancourt (Reference Tversky, Morrison and Betrancourt2002) argued that animated motions are often too complex or too fast to be accurately comprehended. Lowe (Reference Lowe2003) suggested that perceptually salient information in animated pictures may direct learners’ attention away from the more subtle but thematically germane information, and that narrated animations to attract learners’ attention to relevant information are more effective than those that lack narration. Furthermore, Mayer, Hegarty, Mayer, and Campbell (Reference Mayer, Hegarty, Mayer and Campbell2005) pointed out that static pictures allow for more active processing because learners need to make inferences from static pictures, while learners make passive observations with animated ones.
In spite of the fact that using animation as a pedagogical approach has pros and cons, there is a strand of recent metaphor awareness-raising approach studies which assesses the effects of animations on teaching German grammar, such as motion verbs (Roche & Scheller, Reference Roche, Scheller, Barber and Zhang2008; Scheller, Reference Scheller2009), passive voice (Arnett, Suñer, & Pust, Reference Arnett, Suñer and Pust2019), the case system (Gradel, Reference Gradel2016), modal verbs (Kanaplianik, Reference Kanaplianik2016), and light verbs (Suñer & Roche, Reference Suñer and Roche2019). Some studies compared the use of animated visual-aid descriptions with formal form-based descriptions and found that using animation for the presentation of embodied concepts of grammar yielded lasting learning effects (Roche & Scheller, Reference Roche, Scheller, Barber and Zhang2008; Gradel, Reference Gradel2016; Kanaplianik, Reference Kanaplianik2016; Suñer & Roche, Reference Suñer and Roche2019). Furthermore, Roche and Scheller (Reference Roche, Scheller, Barber and Zhang2008) and Kanaplianik (Reference Kanaplianik2016) made a comparison between animated and static versions of the metaphor awareness-raising approach, showing that learners using the animated version improved their performance. However, it must be noted that the participants in their study were experienced and linguistically motivated learners, which might have had some effect on the results (Roche & Scheller, Reference Roche, Scheller, Barber and Zhang2008). Similarly, Kanaplianik (Reference Kanaplianik2016) implied that learners who were linguistically motivated adopted the grammatical metaphor actively and produced significantly better learning outcomes. Kanaplianik showed that using an animated version of the metaphor awareness-raising approach did not have the same positive effect on all learners, as learners with less prior knowledge about grammatical targets benefitted more than learners with more prior knowledge. Roche and Scheller (Reference Roche, Scheller, Barber and Zhang2008) and Kanaplianik (Reference Kanaplianik2016) suggested that simple exposure to the animated version of the metaphor-awareness approach does not guide learners to integrate grammatical targets into their mental models.
Lastly, with regard to the nature of L2 pragmatic learning, Takimoto (Reference Takimoto2020b) used animated pictures to assess the efficacy of the spatial concept-based metaphor awareness-raising approach on the development of Japanese EFL learners’ pragmatic proficiency, in relation to degrees of politeness in making requests. He applied primary metaphors that entailed a spatial concept projection through which participants understood degrees of politeness in terms of the spatially visualized concepts of near–far and high–low associated with three social variables in the animated illustrations. Takimoto’s study indicated that this approach through animated illustrations was effective in improving EFL learners’ pragmatic proficiency. However, it is not certain whether the spatial concept-based metaphor awareness-raising approach alone was effective, or if the animated instructional contents might have played some role in contributing to the enhancement the learners’ pragmatic proficiency.
Therefore, owing to the still under-researched area of animated versus static effects on the spatial concept-oriented metaphor approach, and to follow up on the findings by Takimoto (Reference Takimoto2020b), it is important that we further examine whether the animated visualization of the instructional content can assist in enhancing the effects of the spatial concept-based metaphor awareness-raising approach in improving L2 proficiency. This study compares the effects of animated illustrations with those of static illustrations based on the spatial concept-based metaphor in teaching L2 pragmatics.
6. Present study
There have been no studies so far comparing the animated and static versions of the spatial concept-based metaphor awareness-raising approaches to teach different degrees of politeness. Therefore, there is no way of knowing the relative superiority of using either the animated or static versions of the spatial concept-based metaphor awareness-raising approach to teach different degrees of politeness in the literature. To fill this gap, the present study investigates the following research question:
What are the relative effects of animated versions and static versions of cognitive linguistic approaches as well as non-cognitive linguistic approaches on Japanese EFL learners’ processing of request strategies withdifferent degrees of politeness?
6.1. participants
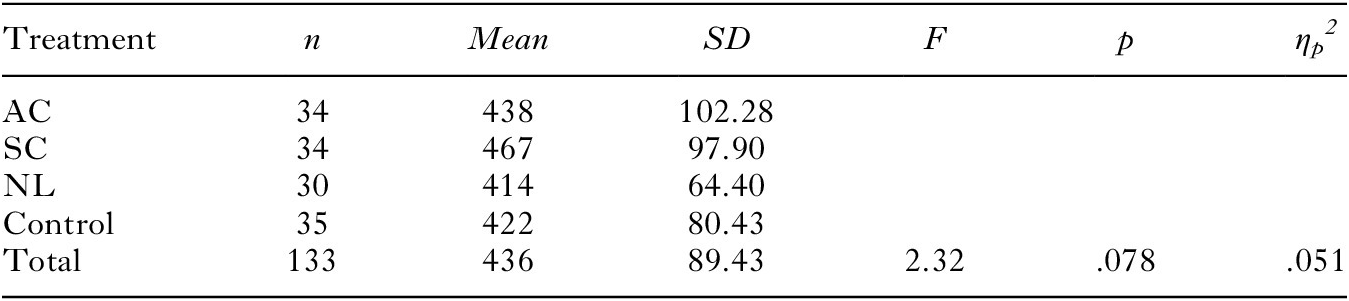
Four intact classes, consisting of 133 monolingual Japanese students at a university in Japan, participated in the study. These classes were randomly assigned to three treatment groups: animated version of cognitive linguistic treatment (AC) (n = 34: female = 5, male = 29); static version of cognitive linguistic treatment (SC) (n = 34: female = 4, male = 30); non-cognitive linguistic treatment (NL) (n = 30: female = 1, male = 29); and one control group (n = 35: female = 7, male = 28). The participants’ age-range was from 18 to 21 years old and their majors were science and engineering. The participants had studied English as a foreign language for six to eight years in Japan, and their English proficiency level was low-intermediate, with an average Test of English for International Communication (TOEIC) score of 436. There were no significant differences on the TOEIC scores between the four groups (F(3,129) = 2.32, p = .078 > .05, ηp 2 = .051) as indicated in Table 1. Additionally, six female and two male native speakers of EnglishFootnote 1 took part in the study and their data were used as a baseline.
Means of the TOEIC scores across the four groups

Note: AC = animated version of cognitive linguistic approach; SC = static version of cognitive linguistic approach; NL = non-cognitive linguistic approach.
6.2. target expressions
Takimoto (Reference Takimoto2009) found that Japanese learners of English lack L2 pragmalinguistic and socio-pragmatic knowledge because they failed to use bi-clausal mitigated-request forms (e.g., Would it be possible to VP?), which is typically the preferred type in a highly imposed situation. This tendency is closely related to what Japanese high-school students are taught with regard to English requests. In Japanese school contexts, high-school students are usually instructed that mono-clausal English requests with past modal verbs (e.g., Would/Could you VP?) are the most polite requests, which leads these students to have the misconception that mono-clausal requests with past modal verbs are preferable request forms under HISs.
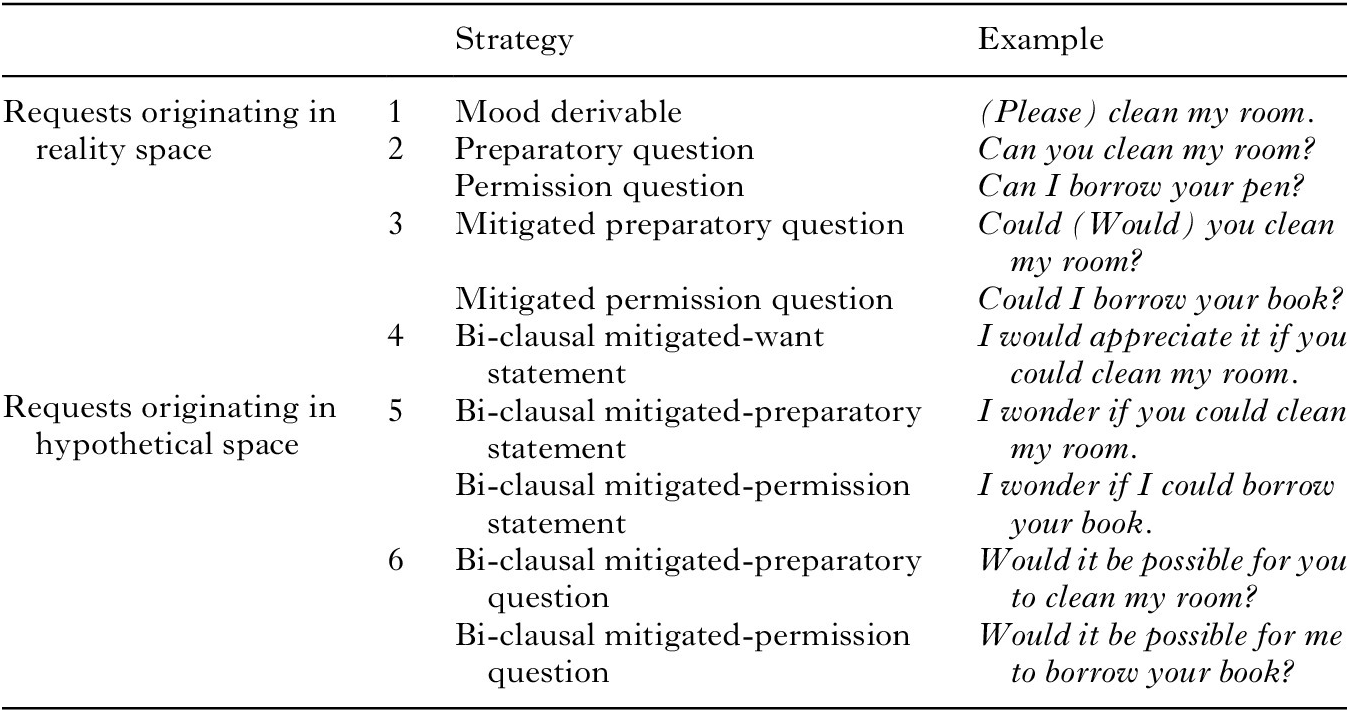
Accordingly, the aim of this study is to teach different types of English requests invoking hypotheticality. The request strategies were categorized into six, based on hypotheticality and directness, by two native speakers of English (New Zealand and British males), and were adopted by the researcher for this study (see Table 2).
A list of request strategies

Note: 1 = most direct ~ 6 = least direct.
The research considers that the three social context variables power, intimacy, and speaker difficulty wield influence on degrees of politeness and are carefully controlled and reflected in the instructional and testing materials. According to Brown and Levinson (Reference Brown and Levinson1987), the three social variables are culturally sensitive factors which cover all of the other related factors associated with cross-cultural pragmatics. Moreover, they argued that the amount of politeness during a speech act is determined by these three social context variables, defined as follows: (a) power: the relative social status of the speaker compared to the listener; (b) intimacy: the relational distance between speaker and listener; and (c) speaker difficulty:Footnote 2 the difficulty the speaker is asking for in the listener’s performance of the request.
6.3. learning treatments
Each 20-minute learning session was conducted in Japanese, once a week for four weeks, by the same instructor – who was also the researcher. The three learning treatments were matched for target request strategies. The first learning session was spent on requests originating in reality space, and the second involved requests originating in hypothetical space. The third and fourth sessions were reviews of the first and second sessions. The participants in the control group worked on reading and listening comprehension activities and were not exposed to the target request strategies at all.
The three different types of learning treatments were a combination of 10-minute teacher-directed computer-based learning, and 10-minute self-directed paper-based learning through problem-solving activities. No feedback was provided during these activities, so that the three different types of instructional effects are not blurred. The problem-solving activities (see ‘Appendix D’) for the three treatment groups were the same, and the aim was to engage the participants in step-by-step problem-solving activities in order to solidify their explicit knowledge about the target request strategies.
The animated and static versions of the cognitive linguistic approach consisted of two consecutive parts: (a) watching animated illustrations (see ‘Appendix A’) or static illustrations (see ‘Appendix B’), based on the spatial concepts on different request strategies, on computers for 10 minutes with the instructor’s explanation; and then (b) engaging in problem-solving activities for 10 minutes in a self-directed way. The two versions of the cognitive linguistic approach groups were guided to link differences in degree of politeness to differences in degree of spatially visualized concepts of near–far and high–low, with all target expressions in the first and second scenes. After that, while the static version group engaged in the problem-solving activities, the animated version group was further guided to watch and comprehend the degrees of politeness of each target expression, in terms of near–far and high–low, from the third scene to the thirteenth scene.
During the first part of the two types of cognitive linguistic approaches, the instructors adhered to the same information available in the illustrations to: (a) introduce different request strategies; and (b) explain the politeness levels of each request strategy in terms of the spatial concepts of high–low and near–far associated with intimacy, power, and speaker difficulty.
The non-cognitive linguistic approach was composed of two consecutive parts: (a) watching a list of different request strategies on computers for 10 minutes with the instructor’s explanation (see ‘Appendix C’); and then (b) engaging in problem-solving activities for 10 minutes in a self-directed manner. During the first part, the instructor used the information available in the list to (a) introduce different request strategies in the lists, and (b) explain the politeness level (combined with intimacy, power, and speaker difficulty) of each request strategy.
6.4. testing instruments and procedures
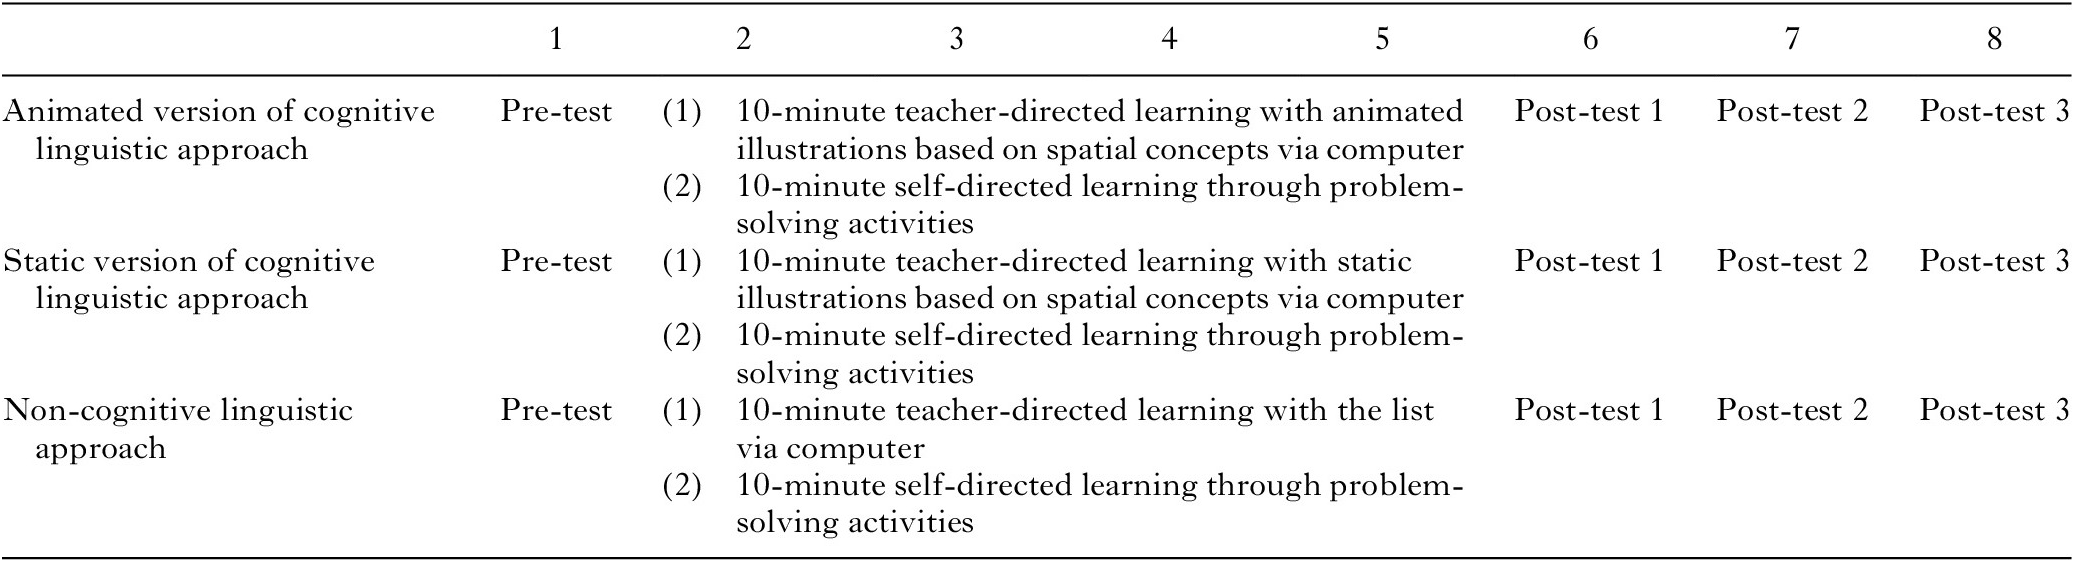
As shown in Table 3, a pre-post design was employed in the present study to measure the relative effectiveness of the two types of cognitive approaches and the non-cognitive linguistic approach. A pre-test was administered a week prior to the first learning session to see whether there were any statistical differences among the four groups. Post-test 1 was given a week after the fourth learning session to find any instructional effects of each treatment; Post-test 2 was implemented five weeks after the fourth learning session; and Post-test 3 was issued about nine weeks after the fourth learning session in order to identify any long-term instructional effects of each treatment.
Overview of experimental procedures

Four different versions of an acceptability judgment test (AJT) (see ‘Appendix E’) were developed and given in order to minimize any test-learning effects. In the pre-test and the three post-tests, the participants were instructed to complete their AJT within five minutes. In addition to the AJT, a written retrospective evaluation questionnaire was administered during the fourth learning session. Interviews were conducted after Post-tests 2 and 3 to supply detailed information on the participants’ cognitive processing of the target request strategies.
6.4.1. Acceptability Judgment Test
This study adopted the AJTs (see ‘Appendix E’), which instructed the participants to read 20 situations in English and then assess three requests in accordance with the degree of perceived acceptability on an 11-point scale. The present study adopted the 11-point rather than a 5-point scale because wider scales produce more precision. When a participant’s assessment fell within the range of English native speakers’ baseline data (see ftn 1), five points were awarded – otherwise, no points were given. The test consisted of 20 items with a maximum score of 100 (5 points × 20 items).
6.4.2. Retrospective evaluation questionnaire
The retrospective evaluation questionnaire was carried out as a supplement to further confirm how the participants processed different request strategies. During the fourth lesson, the participants were asked to answer the following two open-ended questions in Japanese:
-
1. How did you derive your answer to Question 5 in the problem-solving activities?
-
2. Did the explicit instructions before the problem-solving activities help you answer Question 5?
6.4.3. Interview
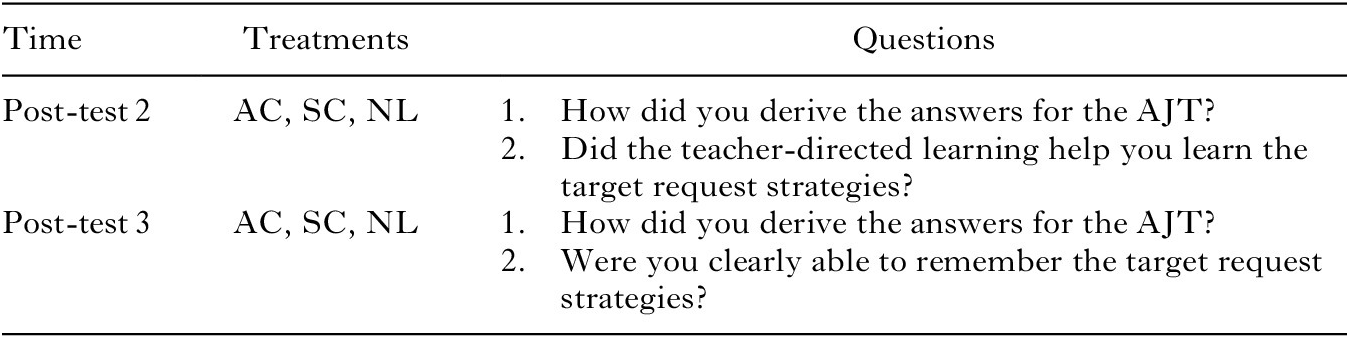
Interviews with two questions were conducted in Japanese after Post-test 2 and Post-test 3 (see Table 4). The purpose of the interviews was to ascertain the results of the retrospective evaluation questionnaires and supply more detailed information on the participants’ cognitive processing of the target request strategies. Three participants from each treatment group were chosen, based on their English proficiency levels (the highest, lowest, and median scores on the TOEIC).
Questions after Post-test 2 and Post-test 3

Note: AC = animated version of cognitive linguistic approach; SC = static version of cognitive linguistic approach; NL = non-cognitive linguistic approach.
7. Results
7.1. statistical analysis of data
The AJTs were scored by the researcher and then analyzed using SPSS Version 26.0 (IBM Corp, 2019). Textual information from the participants’ responses in the retrospective evaluation questionnaire was investigated with text-mining techniques using KH Corder software (Higuchi, Reference Higuchi2019).
Before the data analysis, the reliability and validity of the AJT and the assumptions for the data analysis were examined.
7.2. reliability
Cronbach’s alpha reliability estimates for the AJTs were calculated. The internal consistency estimates were high except for Version A of the AJT, which was somewhat lower than the other tests, but still fell under an acceptable range of reliability (see Table 5).
Cronbach’s alpha reliability for each test

7.3. validity
For the purpose of promoting content validity, the situations of the AJT were carefully planned and the situation contents evenly reflected a theoretical framework based on the three social variables: power, intimacy, and speaker difficulty (see Table 6).
Distribution of social context variables (version A for the acceptability judgment test)

Note: S = Situation; SD = Speaker difficulty; P = Power; C = Intimacy; + = More; – = Less; ± = Equal.
7.4. descriptive statistics and the results of statistical analysis
With regard to the assumptions behind statistical procedures, although no univariate and multivariate outliers were found, the assumption of normality was not met according to the results of the Kolmogorov–Smirnov test and the Shapiro–Wilk test. Furthermore, based on the results of Levene’s test and Box’s M test, the present study discovered that the equal variance assumptions were also violated. However, Brown (Reference Brown2014) suggested that violations of the normality assumption are only problematic on norm-referenced tests and a skewed distribution may actually be a desirable outcome on criterion-referenced tests. Since the analysis of variance (ANOVA) is robust to the violations of the assumptions of normality, and also to the violations of the equal variance assumption (Tabachnick & Fidell, Reference Tabachnick and Fidell2007), the administrators of this study decided to run the parametric tests.
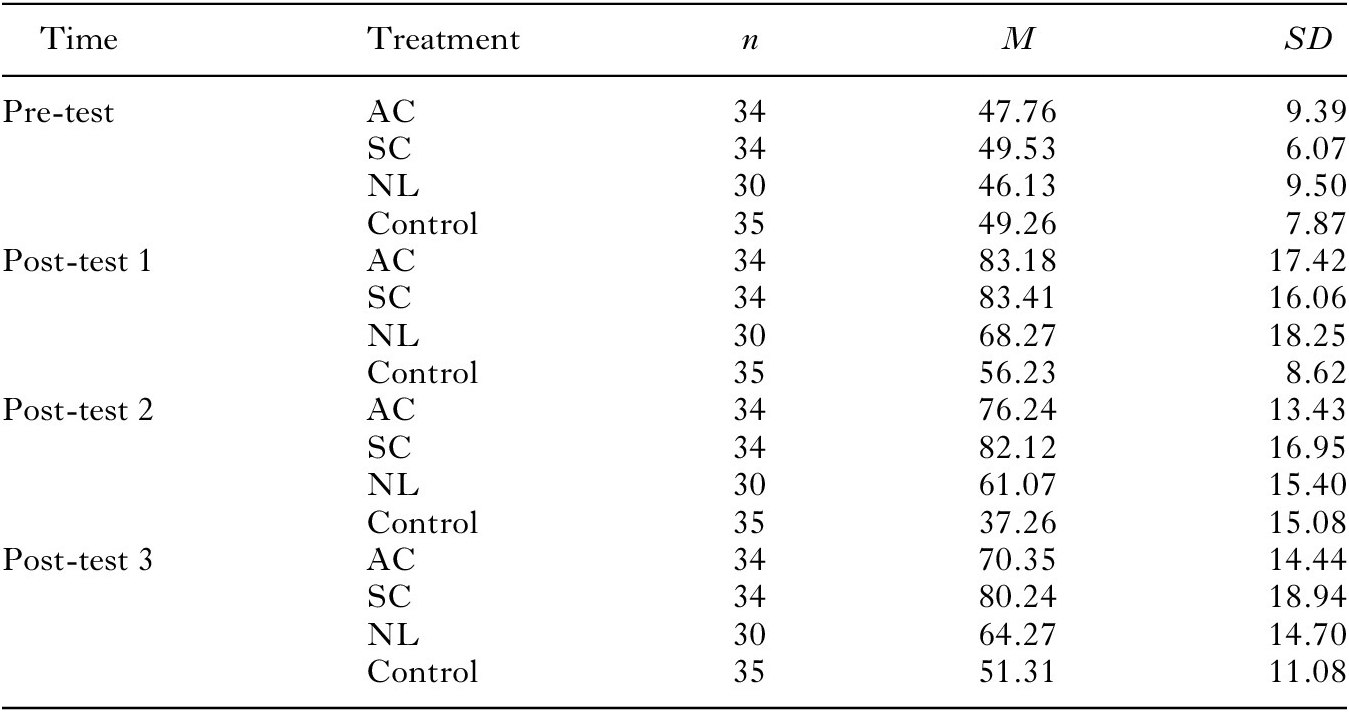
Table 7 shows the performance of the subjects in the three different treatment groups and the control group on the pre-test, as well as the three post-tests of each testing instrument. The breakdown of these performances is presented with the number of participants (n), mean (M), and standard deviation (SD) in each case. To statistically support the findings, the study included the implementation of an ANOVA.
Descriptive statistics for the AJT

Note: AC = animated version of cognitive linguistic approach; SC = static version of cognitive linguistic approach; NL = non-cognitive linguistic approach.
The results of the ANOVA show a significant main effect for Instruction (F = 43.33, p < .05, = .502), a significant main effect of Time (F = 119.26, p < .05, ηp 2 = .480), and a significant interaction effect between Instruction and Time (F = 20.64, p < .05, ηp 2 = .324).
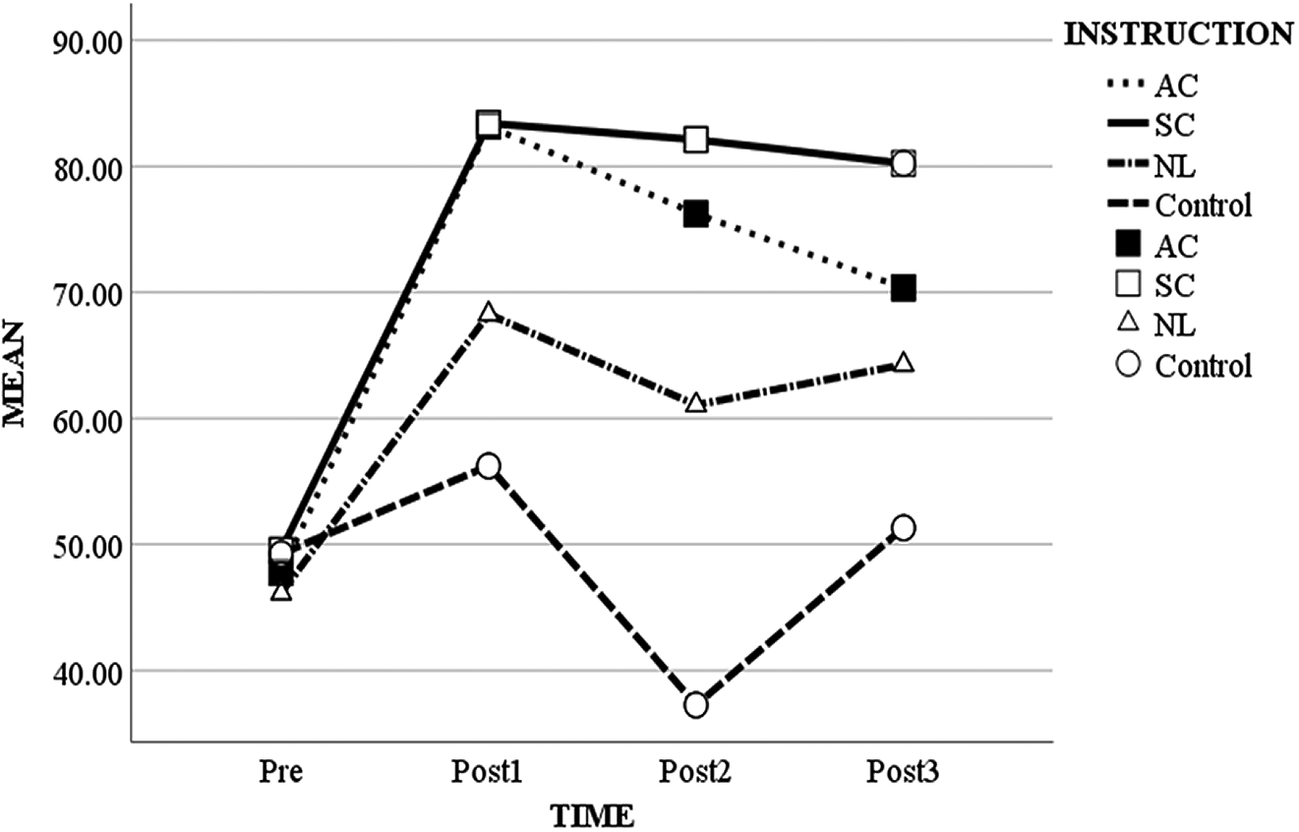
The results show no significant differences in the pre-test among the three treatment groups and the control group (F = 1.14, p >.05, ηp 2 = .026). Notably, the animated and static versions of the cognitive linguistic approach groups gained substantial improvement from the pre-tests to Post-test 1, thereby performing better than the non-cognitive linguistic approach and control groups. On Post-test 2 and Post-test 3, the animated and static versions of the cognitive linguistic approach groups continued to significantly surpass the others, though the animated version of the cognitive linguistic approach group did not perform to the same extent as the static version (see Figure 1). In summary, the two types of cognitive linguistic approach groups outperformed the non-cognitive linguistic approach and the control groups, with the non-cognitive approach group performing significantly better than the control. In other words, the instructional effects were stronger on the three post-tests than on the pre-test, and the superiority of the two types of cognitive linguistic approaches and the non-cognitive linguistic approach in comparison with the control was clearly observed. The Games–Howell post-hoc test on the scores of the pre-test and the three post-tests demonstrates the following contrasts: SC, AC > NL > Control (p < .05)
Interaction plot for the acceptability judgment test.
Note: AC = animated version of cognitive linguistic approach; SC = static version of cognitive linguistic approach; NL = non-cognitive linguistic approach.

7.5. retrospective evaluation questionnaire
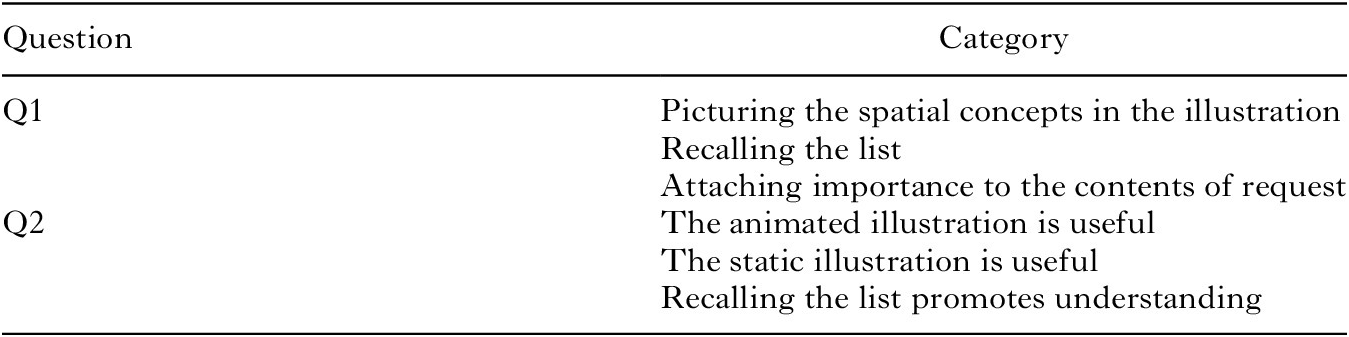
During the fourth lesson, the participants were asked to answer two open-ended questions (Q1 and Q2) in Japanese, which produced 5,392 words of textual information for Q1 and 5,158 words of textual information for Q2. The results of the text-mining analysis presented three different categories for Q1 and Q2 (see Table 8).
Categories for Q1 and Q2

An examination of the relationships between the three different categories for Q1 and Q2, by way of cross-tabulation analysis, confirmed associations between the categories and the treatments. The secondary purpose of this analysis was to discover whether the participants in the treatments processed the request strategies in the way each treatment was intended.
7.5.1. Question 1
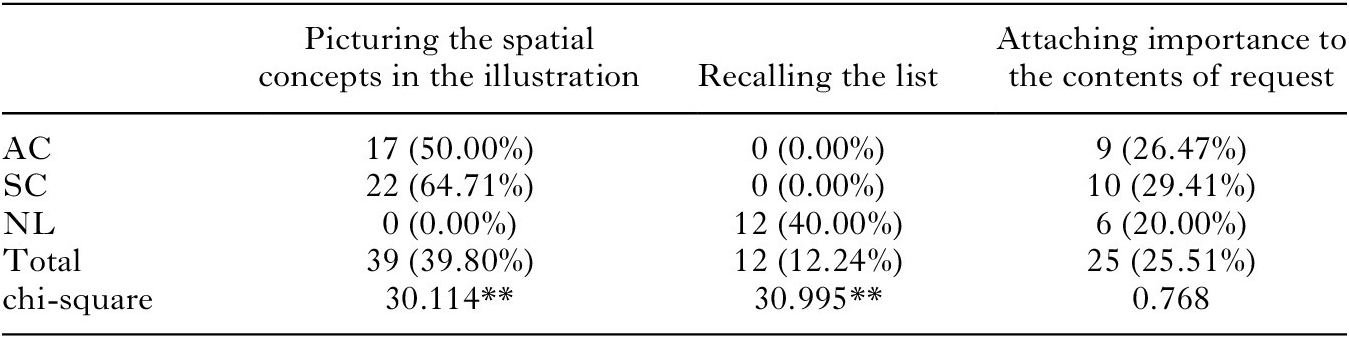
According to the results of the cross-tabulation analysis (see Table 9), 50.00% of the participants in the animated version of the cognitive linguistic approach group and 64.71% of the participants in the static version mentioned visualizing the spatial concepts in the illustrations. Accordingly, 37.93% of the participants in the non-cognitive linguistic approach group referred to recalling the list of request forms when answering questions in the problem-solving activities.
Cross-tabulation table for Q1

Note: AC = animated version of cognitive linguistic approach; SC = static version of cognitive linguistic approach; NL = non-cognitive linguistic approach. ** p < .01.
7.5.2. Question 2
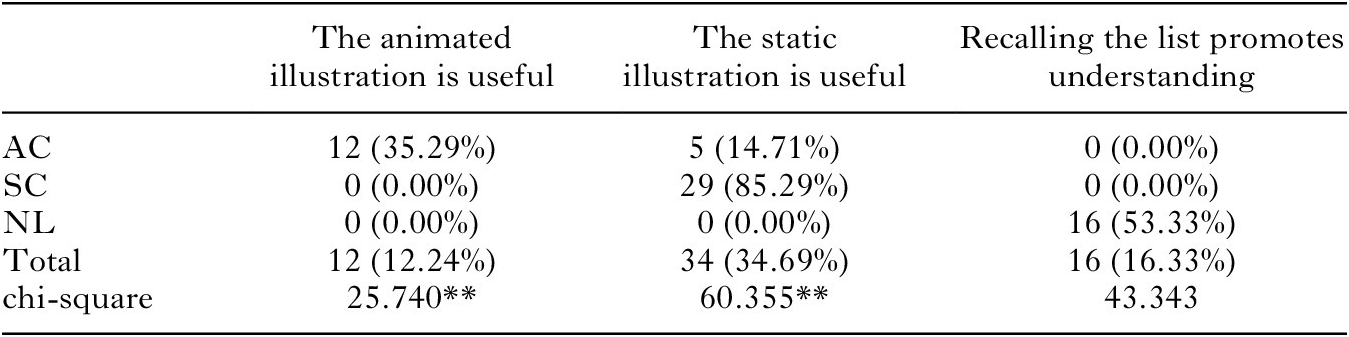
The results of the cross-tabulation analysis (see Table 10) revealed that 85.29% of the participants in the static version of the cognitive linguistic approach group responded that the static illustrations were useful in their understanding of the degrees of politeness. On the other hand, 35.29% of the participants in the animated version considered that the animation was helpful. Additionally, 53.33% of the participants in the non-cognitive linguistic approach group mentioned that memorization requests through the list promoted their understanding. Therefore, it could be hypothesized that many of the animated and static versions of the cognitive linguistic approach groups visualized and determined the degrees of politeness in terms of the spatial concepts of high–low and near–far that are associated with the three social context variables. Yet, most of the participants in the static version considered the static illustration helpful for gaining a deeper understanding of politeness, while only some participants in the animated version sensed that. Conversely, some of the non-cognitive linguistic approach groups learned request forms through the list by rote and considered that their strategies promoted their understanding of different request forms.
Cross-tabulation table for Q2

Note: AC = animated version of cognitive linguistic approach; SC = static version of cognitive linguistic approach; NL = non-cognitive linguistic approach. ** p < .01.
7.6. results from interviews
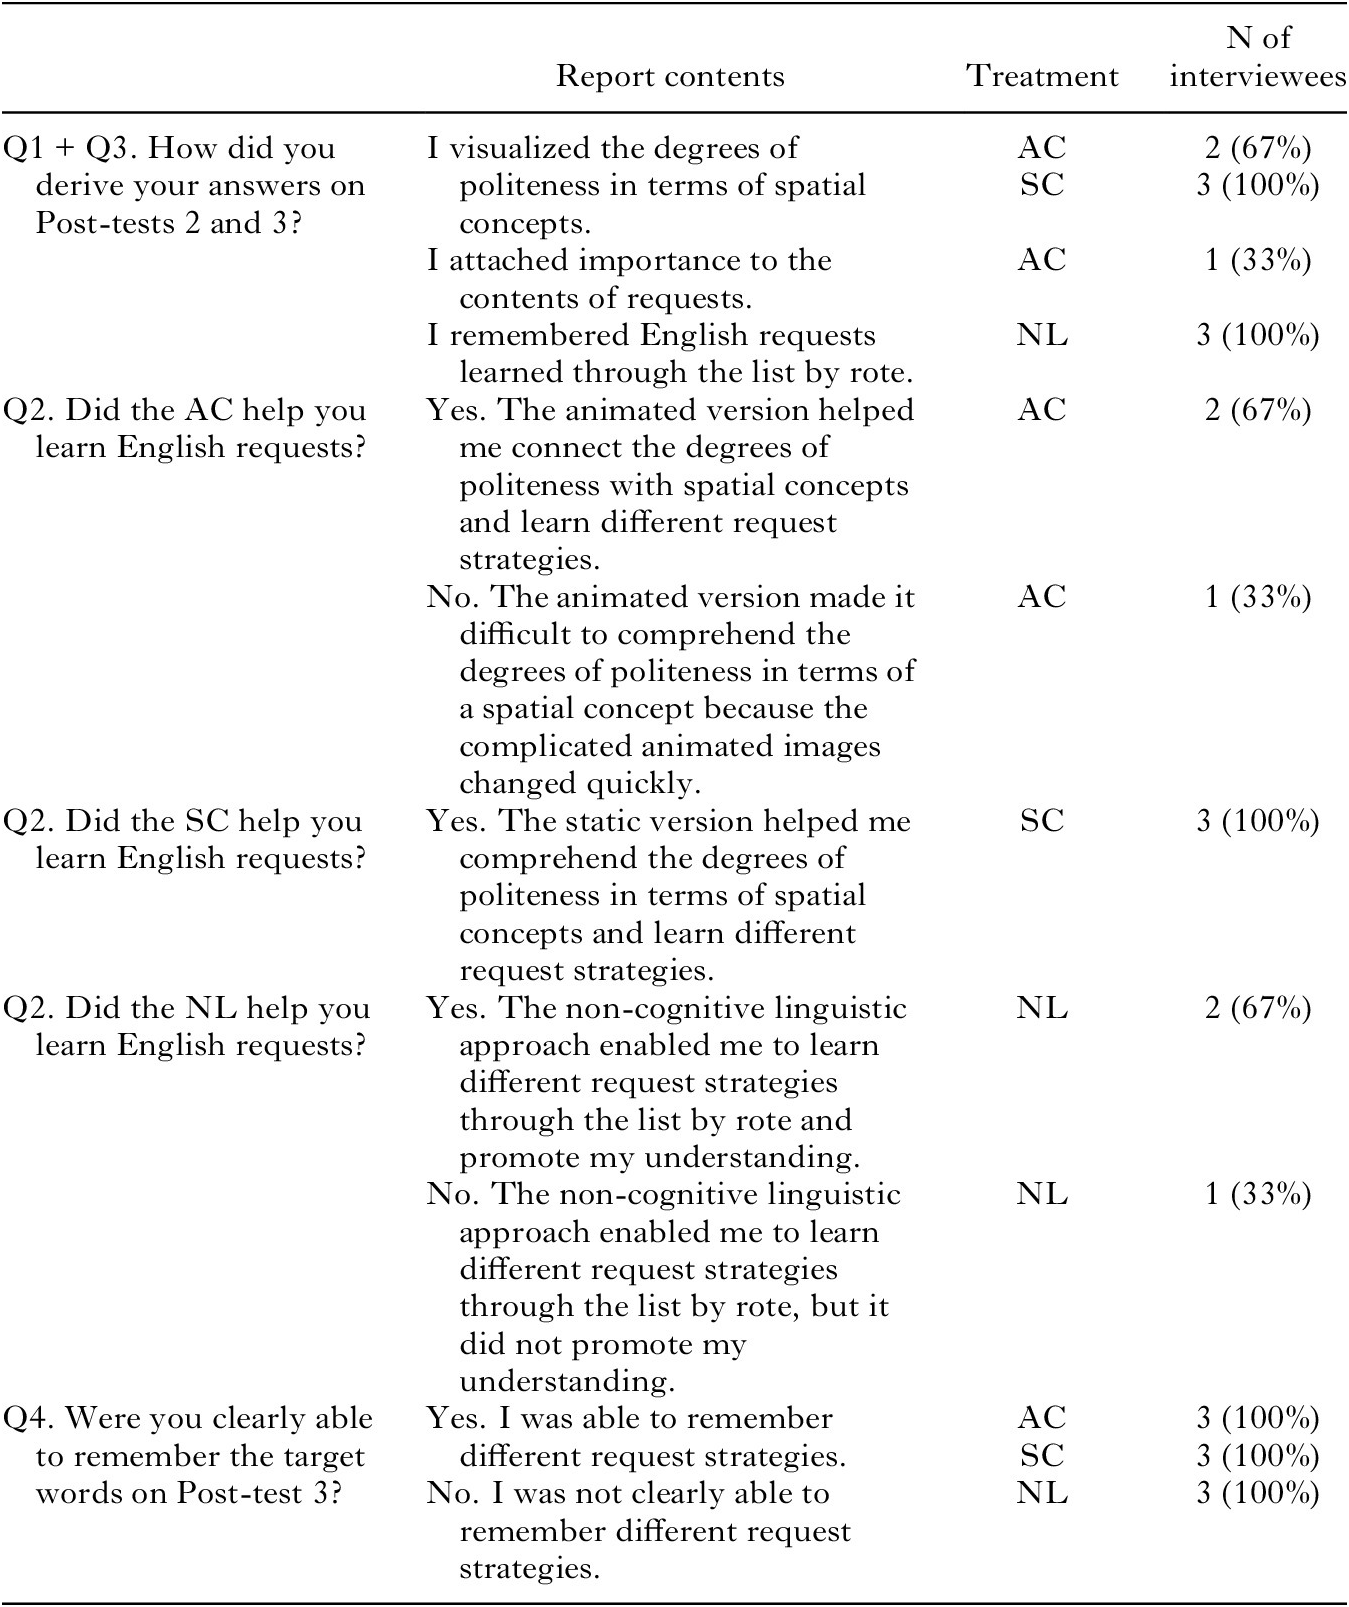
The researcher interviewed three participants from each treatment group and recorded and transcribed the interviews. There were nine interview transcripts after Post-test 2 and another nine interview transcripts after Post-test 3, which generated about 1,847 words of data. The length of the interviews was about 11 minutes for the interviews after Post-test 2 and about 10 minutes for the interviews after Post-test 3. The summary of responses to the four interview questions are displayed in Table 11.
Summary of responses to the interview questions

Note: AC = animated version of cognitive linguistic approach; SC = static version of cognitive linguistic approach; NL = non-cognitive linguistic approach; N of Interviewees = number of interviewees.
All of the interviewees from the static version of the cognitive linguistic approach group and two interviewees from the animated version responded that they comprehended the degrees of politeness in terms of a spatial concept associated with power, intimacy, and speaker difficulty through the illustration. This understanding enabled them to derive answers easily, and also guided them to maintain their long-term memory of politeness because the spatial concepts of high–low and near–far remained with them – even nine weeks after the fourth learning session. On the other hand, all of the interviewees from the non-cognitive linguistic group said they simply learned the English requests through the list by rote and answered the questions. However, all of the interviewees from the non-cognitive linguistic approach group felt that they were not able to remember different request strategies clearly, and two of them did not retain them in their long-term memory.
8. Discussion and conclusion
The results showed that the animated and static versions of the cognitive linguistic approach groups outperformed the non-cognitive linguistic approach and control groups in the AJT. The outcomes also indicated that, regardless of the version, the spatial concept-based metaphor awareness-raising approach enabled participants to have great leverage while similarly processing the appropriate English request strategies according to context.
The present study provides two possible ways of processing to explain the effectiveness of this approach. The primary way of processing is associated with spatial concept projection, through which the participants understood the degrees of politeness in terms of the spatially visualized concepts of near–far and high–low. As the results of the retrospective evaluation questionnaire and interviews indicated, many of the participants in the animated and static versions of the cognitive linguistic approach groups connected the degrees of politeness with spatial concepts associated with power, intimacy, and speaker difficulty, and considered the use of spatial concept-based metaphors an effective memory-enhancing strategy. The spatial concept projection guided the participants to cognitively process those visual images in the illustrations and memorize them in the long term. Still, many participants in the non-cognitive linguistic approach group learned different request strategies through the list by rote. Although they responded that recalling request strategies promoted their understanding, their AJT results were not as high as they had predicted, and their scores on the three post-tests were lower than those of the cognitive linguistic approach groups. Lakoff and Johnson (Reference Lakoff and Johnson2003), and Boers (Reference Boers2013) argued that, when we comprehend abstract concepts in terms of actual concepts reflecting spatial ones like near–far and high–low in mental imagery, we are able to cognitively process these visually highlighted spatial images at deep levels and maintain strong memory traces of them. Additionally, Jamroziki, McQuire, Cardillo, and Chatterjee (Reference Jamrozik, McQuire, Cardillo and Chatterjee2016) suggested that metaphor is one important vehicle that guides the development and use of abstract concepts, and that repeated metaphoric use drawing on embodied understanding can result in the formation of explicit knowledge of such concepts.
The second possible way of processing may be related to the form–meaning–context connections. The instructor’s explanation in the cognitive and non-cognitive linguistic approaches was accompanied by the information that the three social context variables – power, intimacy, and speaker difficulty – impact degrees of politeness. However, the information was conveyed through highly visualized illustrations with the instructor’s verbal explanation which promoted the participants to connect the three social variables in the animated and static versions of the cognitive linguistic approach groups, whereas the information was provided only by the instructor’s verbal explanation in the non-cognitive linguistic approach group. The results from the retrospective evaluation questionnaire and the interviews demonstrated that many of the participants from the animated and static versions of the cognitive linguistic approach groups realized the importance of the three social context variables and connected them to come up with the most appropriate degree of politeness. Notably, in this regard, the findings also indicated that the participants in the non-cognitive linguistic approach group did not really recognize the importance of the three social context variables, nor did they connect the three social variables. According to the spatial concept-based metaphor awareness-raising approach proposed by Littlemore (Reference Littlemore2009) and Littlemore and Low (Reference Littlemore and Low2006), visualizing the spatial concepts associated with the degrees of politeness through embodied cognition helps learners enhance their awareness of the social and cultural meanings of the target forms (De Knop & Mollica, Reference De Knop, Mollica, De Knop and Gilquin2016). In this study, the highly visualized embodiment through illustrations, in both animated and static versions of the cognitive linguistic approach, played a key mediating role, increasing the participants’ awareness of the socio-pragmatic aspects and promoting stronger, long-term retention associated with different request strategies. This is because there are semantic ties between learners’ lower levels of bodily engagement and politeness to be learned (Scheller, Reference Scheller2009; Suñer & Roche, Reference Suñer and Roche2019)
While the two types of cognitive linguistic approach groups significantly performed better than the non-cognitive linguistic approach and control groups, the performance of the animated version group deteriorated in Post-tests 2 and 3 and were not able to perform to the same extent as the static version group. The results of the retrospective evaluation questionnaire indicate that only some participants in the animated version felt it was helpful in aiding them to visualize the spatial images in their minds. In fact, one of the interviewees from the animated version confessed that it was difficult for him to comprehend degrees of politeness in terms of spatial concepts because the complicated animated images changed quickly. This made it difficult for him to thoroughly examine the contents of each illustration and subsequently he was not able to cognitively facilitate the processing of the visually highlighted spatial images.
Tversky et al. (Reference Tversky, Morrison and Betrancourt2002) explained that animated movements are sometimes too complicated or too fast for learners to accurately understand what is being taught. Additionally, although the animated version in the process directed the participants’ attention to the target request sentences, it might have taken away from the surrounding three social context variables because Lowe (Reference Lowe2003) described how salient information in animated pictures tends to distract learners from important and relevant surrounding information. Thus, the participants’ explicit knowledge in the animated version group was not established as strongly as the one in the static version. This made it difficult for them to access its relatively weakly established explicit knowledge, and they ended up losing steam on Post-tests 2 and 3. In order to prevent the problems reported above from taking place, Scheller (Reference Scheller2009) emphasized the importance of carefully designing the use of visual materials, and particularly technical effects, to make sure that perceptual processing adapts well to learners’ cognitive requirements in the mental model. This is important because the animations would not produce additional effects unless there were a semantic connection between the cognitive concepts and the modality of the presentation (Roche & Scheller, Reference Roche, Scheller, Barber and Zhang2008; Suñer & Roche, Reference Suñer and Roche2019).
Furthermore, while the animated version group involved in passively processing the contents of the illustration, the static version group was given a chance to closely contemplate the contents of the illustration and to process the contents more actively. Kanaplianik (Reference Kanaplianik2016) hinted that regardless of presentation mode, visually presented materials do not bring about the learning process per se, and learners should be drawn to actively assimilate metaphors and integrate them into their conceptual mental model. In other words, the recollection of the different request strategies may have been reinforced by the static version group as a memory trace of the image was established, thereby generating an additional access point for remembering what they had actively learned (Boers & Lindstromberg, Reference Boers and Lindstromberg2009). According to the results of the retrospective evaluation questionnaire and the interviews, most of the participants and all interviewees from the static version group replied that the static illustration contributed to them actively facilitating a deeper understanding of different request strategies and surrounding context variables. Therefore, the passive processing of the animated illustration contents, rather than the active processing, may have become more visible, translating into a degraded performance later – especially on Post-tests 2 and 3.
Regarding the limitations of this study, although the assumptions for the statistical analysis were tested, neither the assumption of normality nor the assumption of homogeneity of variances was met due to the nature of the criterion-referenced test (Brown, Reference Brown2014), in addition to an unequal number of participants in each group. However, since the ANOVA is generally robust to violations of normality, as well as equal variance assumptions (Tabachnick & Fidell, Reference Tabachnick and Fidell2007), the ANOVA was implemented as planned. Furthermore, although the present study had two kinds of cognitive linguistic approach, it had only one type of non-cognitive linguistic approach, namely the static version. Ideally, because the cognitive linguistic approach was examined through animated and static versions, the animated version of the non-cognitive linguistic approach should have been added to compare the animated and the static versions from the perspective of the non-cognitive linguistic approach.
Finally, this study compared the animated version with the static versions of the spatial concept-based metaphor awareness-raising approach to teach different degrees of politeness quantitatively as well as qualitatively. Nevertheless, it still remains a relatively under-studied area and it is necessary to explore the effects of the static version further in comparison to the animated version in the concept projection. This would provide researchers with further insights in applying the concept-based metaphor awareness-raising approach and it would surely be beneficial for researchers and teachers with regard to which way they need to turn to develop useful approaches necessary to improving learners’ L2 language proficiency.
Appendix A
Animated illustration from the first scene to the thirteenth scene


Appendix B
Static illustration in the first and second scenes

Appendix C
List of English requests

Appendix D
Examples of problem-solving activities
Read dialogue A and dialogue B and answer the following questions.
Dialogue A.
Situation: Yuka is about to start her car when she notices that her car battery has gone flat. She needs to go to school now and she does not have any other means but to ask her neighbor, James, whom Yuka knows well, to give her a ride to school. Yuka sees James go out by car and she decides to ask James to drive her to school.
Yuka: Hi, Jim. My car battery has just gone flat and I can’t start my car. I really need to get to school. (a) Could I have a lift?
Dialogue B.
Situation: Yuka is about to start her car when she notices that her car battery has gone flat. She needs to go to school now and she does not have any other means but to ask her landlord, Mr. Brown, whom Yuka has never spoken to before, to give her a ride to school. Mr. Brown is extremely busy, but she decides to ask Mr. Brown to drive her to school.
Yuka: Hi, you are Mr. Brown, right?
Brown: That’s right.
Yuka: I am a tenant next door. My car battery has just gone flat and I can’t start my car. I really need to go to school. (a) I was wondering if it would be possible for me to get a lift.
-
1. Write up the requests Yuka makes in Dialogue A and Dialogue B and also comment on the differences between the two.
-
2. Indicate the level of relationship between Brown and Yuka in Dialogue A and Dialogue B.
-
3. In consideration of the respective relationship between Brown and Yuka in Dialogue A and Dialogue B, do you think that Yuka is asking for something difficult or simple in Dialogue A and Dialogue B?
-
4. Look at the requests you found in #1 and answer the following questions.
-
(1) Indicate the politeness level of the requests by Yuka in Dialogue A.
-
(2) Indicate the politeness level of the request by Yuka in Dialogue B.
-
-
5. How does Yuka try to be polite making requests?
Appendix E
Acceptability judgment test
You overslept and missed the final exam for Professor Jackson’s course. You are not so familiar with Professor Jackson and you know that Professor Jackson has to hand in students’ grades in a few days and does not like to offer students a make-up exam. However, you need to pass the final exam to graduate and you have decided to go and ask Professor Jackson to give you a make-up exam. What would you ask Professor Jackson?
Note: speaker difficulty =+; power =‒; intimacy =+; += more; ‒= less; ±= equal
-
a. I was wondering if it would be possible for me to have a make-up exam.
not appropriate at all 0—1—2—3—4—5—6—7—8—9—10 completely appropriate
-
b. I want you to give me a make-up exam.
not appropriate at all 0—1—2—3—4—5—6—7—8—9—10 completely appropriate
-
c. Could you possibly give me a make-up exam?
not appropriate at all 0—1—2—3—4—5—6—7—8—9—10 completely appropriate