





1. Introduction
Language learners acquire a new language’s phonetic and phonological patterns from highly variable input. Here we investigate input variability associated with individual talkers – and in particular the consequences of the social characteristics associated with these talkers – on adults’ acquisition of the pronunciation of a new spoken language. While it is well-known that speech perception is shaped not just by the (auditory) input but also by who we think we are hearing (Tripp & Munson, Reference Tripp and Munson2021), relatively little research has considered how adult language learning is impacted by the social characteristics of the individuals who are the source of learners’ language input.
In the language classroom setting, learners may experience input from teachers and from other students, raising questions regarding how learners’ beliefs about accent and pronunciation authority shape their preferences among the multiple input sources available in the language classroom. In Hayes-Harb et al. (Reference Hayes-Harb, Barrios and Tripp2022), we developed a study paradigm to investigate the hypothesis that listeners will prefer a pronunciation pattern exhibited by a ‘teacher’ over that of a ‘student’ in a simulated language classroom. Participants were told that they would be observing a language class where students are learning new vocabulary and that they would hear both the ‘teacher’ and a ‘student’ pronounce the new words. In the experimental conditions, the speech samples varied systematically in the voice onset time (VOT) durationFootnote 1 of word-initial voiceless stop consonants depending on the source of the input (‘teacher’ or ‘student’). Speech materials were synthetically manipulated to produce two ‘accents’ contrasting in VOT duration: 25 msec vs. 125 msec. Following the class observation phase, participants were asked to select which of two speech samples produced by a new talker sounded ‘better.’ One option resembled the teacher’s accent and another the student’s accent heard during exposure. As predicted, participants preferred productions matching the teacher’s accent. While this may seem like an intuitive finding, it is not predicted by dominant asocial models of language learning and provides strong evidence that any understanding of input must take speakers’ social characteristics – and learners’ sensitivity to them – into account. Furthermore, to our knowledge, this is among the first experimental findings directly implicating social perception in adult learning of accent. For this reason, it is essential that we confirm the robustness of the pattern via replication studies.
Our first goal in the present study is thus to perform a close replication (Porte & McManus, Reference Porte and McManus2019) of Hayes-Harb et al. (Reference Hayes-Harb, Barrios and Tripp2022). We modified a single variable (the pronunciation pattern exemplified in the materials), providing an opportunity to determine whether the original study’s findings are generalizable to new speech materials. The teacher preference effect reported in the original study was quite small, possibly due in part to the subphonemic status – and thus low perceptibility – of the VOT pronunciation contrast they used. Here we created a word-initial /s/–/z/ pronunciation contrast, which we expected to be relatively more perceptible to English-speaking participants due to the phonemic status of /s/ and /z/ in English. We therefore hypothesized that this new contrast would produce the same preference for the teacher’s accent, but with a larger effect size. One rationale for attempting to increase the effect size of participants’ teacher preference is to provide the conditions needed to pursue our second goal, which is to investigate whether the degree of preference for the teacher’s accent is sensitive to social characteristics attributed to the teacher. A larger preference effect for the teacher’s accent over that of the student allows us to test whether manipulating the teacher’s social characteristics will modulate the degree of this preference.
Language learners typically identify pronunciation as among the most important contributors to their ability to communicate in a new language (Nguyen et al., Reference Nguyen, Hung, Duong and Le2021). Learners demonstrate awareness of the social desirability of so-called ‘native’ pronunciation, often expressing a preference for ‘native speaker’ teachers (Gurkan & Yuksel, Reference Gurkan and Yuksel2012; Lasagabaster & Sierra, Reference Lasagabaster and Sierra2002; Watson Todd & Pojanapunya, Reference Watson Todd and Pojanapunya2009). This is unsurprising given the prevalence and consequences of accent-based discrimination for language learners. For example, speakers with ‘nonnative’ accents may be perceived as less professional (Piccolo & Baese-Berk, Reference Piccolo and Baese-Berk2022), less employable (Deprez-Sims & Morris, Reference Deprez-Sims and Morris2010), and less competent communicators (Nelson et al., Reference Nelson, Signorella and Botti2016) than speakers with ‘native’ accents. Accent bias also has detrimental consequences for the perceived credibility of eyewitness accounts (Frumkin, Reference Frumkin2007), in jury verdicts (Cantone et al., Reference Cantone, Martinez, Willis-esqueda and Miller2019), and in access to housing (Purnell et al., Reference Purnell, Idsardi and Baugh1999). This bias is similarly observed in language teacher recruitment and hiring practices. For example, recruitment materials in the global English language teaching industry show a preference for White ‘native English speakers’ from predominantly White, English-speaking countries (Ramjattan, Reference Ramjattan2019; Ruecker & Ives, Reference Ruecker and Ives2015). For these reasons and others, the idealized standard of the racialized ‘native speaker’ is ubiquitous in language teaching and learning (von Esch et al., Reference von Esch, Motha and Kubota2020).
In addition to noting that learners value teachers whose pronunciation and visual presentations are consistent with their expectations of ‘native speakers,’ Levis et al. (Reference Levis, Sonsaat and Link2017) report that students value teachers with training and experience in teaching pronunciation. Indeed, the teacher characteristics of ‘native speakerhood,’ teaching experience, and teaching effectiveness are widely documented as valued by learners across language learning contexts (Hismanoglu, Reference Hismanoglu2019; Ling & Braine, Reference Ling and Braine2007; Park & Lee, Reference Park and Lee2006). In Experiment 2, we investigate the combined effect of these teacher characteristics on participants’ preferences for the teacher’s accent by manipulating the characteristics attributed to the teacher via ‘favorable’ vs. ‘unfavorable’ vignettes. The following are the research questions addressed in this study:
• Do participants prefer the accent of a teacher relative to that of a student peer in an artificial language learning setting? (Experiment 1; close replication of Hayes-Harb et al., Reference Hayes-Harb, Barrios and Tripp2022).
• Are preferences for the teacher’s pronunciation relative to that of a student influenced by ‘favorable’ and ‘unfavorable’ vignettes regarding the teacher’s characteristics (language background, teaching experience, teaching effectiveness)? (Experiment 2; extension of Hayes-Harb et al., Reference Hayes-Harb, Barrios and Tripp2022).
2. Experiment 1
Experiment 1 is a close replication of the study reported in Hayes-Harb et al. (Reference Hayes-Harb, Barrios and Tripp2022). Hayes-Harb et al. (Reference Hayes-Harb, Barrios and Tripp2022) demonstrated a very small but significant teacher preference effect in what they called the ‘experimental conditions,’ where the teacher and the student produced systematically different accents (short vs. long VOT durations). They also included ‘control conditions,’ where the teacher and student produced the same accent, though these conditions did not directly address their research question, which was answered by performance in the experimental conditions alone. For this reason, we replicate only the ‘experimental conditions’ of the original study.
Experiment scripts, anonymized data, and analysis scripts are available at: https://osf.io/uw8y5/ (original study) and https://osf.io/8nu2p/ (current study).
2.1. Methods
2.1.1. Participants
The population of interest in this replication study is the same as in the original study; however, due to a much larger effect observed here, we recruited a much smaller participant sample. The smaller sample permitted us to collect data exclusively from the Linguistics Department study pool at the University of Utah for course credit, and did not require additional participant recruitment via Prolific, as was necessary for the original study. As a consequence of sampling exclusively from a university-based undergraduate participant pool, rather than also sampling via Prolific (which recruits adults of all ages), participants in the current experiment were, on average, approximately 5 years younger than those in the original study. From a total of 87 participants, data from 20 were excluded from the final data set for the following reasons: participant was a minor (1); incomplete background questionnaire data (7); or English was not identified as a ‘native’ or a childhood language (12). The data from the remaining 67 individuals (mean age [range] = 22.03 [18–52] years; female = 42, male = 24, non-binary = 1) who identified English as a ‘native’ language and/or a language used with childhood caregivers make up the final data set reported in this manuscript. While the original study applied additional exclusionary criteria, we did not exclude participants based on self-reported medical conditions or medication use, and unlike the original study, we required only that participants identify English as a ‘native’ and/or childhood language, rather than both.
As in the original study, many of our participants were multilingual. Seventeen identified one or more languages (in addition to English) among their ‘native’ and childhood languages, including Chinese (2), Hindi (1), Hmong (1), French (1), Gujarati (1), Italian (1), Japanese (2), Kutchhi (1), Malagasy (1), Marathi (1), Portuguese (1), Spanish (5), Tamil (1), Tibetan (1), Tongan (1), Urdu (1), Vietnamese (1), and 51 participants also reported having learned additional languages: American Sign Language (ASL) (3), Chinese (3), French (12), German (5), Greek (1), Hindi (1), Italian (3), Japanese (3), Korean (5), Malagasy (1), Mandarin (2), Navajo (1), Portuguese (5), Romanian (1), Russian (2), Spanish (33), Tamil (1), Thai(1), Tongan (1), Vietnamese (1).
The 67 participants were randomly assigned to one of four counterbalanced exposure conditions crossing the variable TeacherVoice (the talker whose productions are attributed to the teacher; two levels: Talker1, Talker2) and the variable TeacherAccent (the accent produced by the teacher; two levels: z-accent, s-accent), as summarized in Table 1.
Summary of participants assigned to each exposure condition in Experiment 1

Table 1 Long description
Participants are grouped by TeacherVoice and TeacherAccent, with columns for N, Mean age with range, and Gender identity counts for non-binary, female, and male. For Talker1 with s-accent, N is 16, mean age is 23.94 years with a range from 18 to 52, and gender identity is 0 non-binary, 11 female, and 5 male. For Talker1 with z-accent, N is 18, mean age is 20.39 years with a range from 18 to 25, and gender identity is 1 non-binary, 13 female, and 4 male. For Talker2 with s-accent, N is 16, mean age is 21.81 years with a range from 18 to 34, and gender identity is 0 non-binary, 10 female, and 6 male. For Talker2 with z-accent, N is 17, mean age is 22.18 years with a range from 18 to 39, and gender identity is 0 non-binary, 8 female, and 9 male. A Total row reports N of 67, mean age of 22.03 years with a range from 18 to 52, and gender identity totals of 1 non-binary, 42 female, and 24 male.
Table 2 provides a summary of notable differences between the participants in the original and current studies.
Summary of notable differences between the original Hayes-Harb et al. (Reference Hayes-Harb, Barrios and Tripp2022) study and the current study

Table 2 Long description
Two columns compare the experimental conditions from Hayes Harb et al. 2022 with the current study, Experiment 1, across recruitment, sample size, exclusion criteria, and participant demographics. Hayes Harb et al. 2022 recruited from the Department of Linguistics study pool at the University of Utah and Prolific, while the current study recruited from the University of Utah pool only. Hayes Harb et al. 2022 reports 132 participants after exclusions, with 33 per condition; the current study reports 67 participants after exclusions, with 16 to 18 per condition. Hayes Harb et al. 2022 exclusionary criteria include being under 18 years or over 65 years, not identifying English as one of their native languages and a childhood language, self reported speech, hearing, or neurological disorders, and taking medications affecting motor skills. The current study exclusionary criteria include being under 18 years and not identifying English as a native language and or a language used with childhood caregivers. Hayes Harb et al. 2022 reports mean age 27.9 years with a range from 18 to 62, and gender counts of 78 female, 51 male, and 3 non-binary. The current study reports mean age 22.03 years with a range from 18 to 52, and gender counts of 42 female, 24 male, and 1 non-binary.
2.1.2. Materials
The primary methodological difference between the original study and the current one involves the auditory materials. For the current study, a new set of auditory stimuli was created to accommodate the new accent contrast. As before, the 12 (non)words were of the form consonant-vowel-consonant-vowel; however, the new stimuli have /s/ or /z/ in initial position rather than voiceless stop consonants. Three women speakers of American English (Talker1, Talker2, and Talker3) recorded four tokens each of the [s] and [z] variants of each nonword. A Praat script (Lennes, Reference Lennes2002) was used to extract each of the individual productions from the recordings. Each of the authors then listened to each stimulus for artifacts (e.g., hesitations, background noise) and marked one [s] and one [z] token as the best option for a given word for each talker. Final tokens were chosen based on majority endorsement and were scaled for peak intensity using a Praat script (Yoon, Reference Yoonn.d.) The tokens produced by Talker1 and Talker2 were used during the exposure phase and were assigned to be the voice of either the teacher or the student per the exposure condition. TeacherVoice and TeacherAccent were counterbalanced such that participants in the Talker1/z-accent condition and the Talker2/s-accent condition heard identical auditory stimuli; the difference between these conditions was only which of the voices and accents was attributed to the teacher vs. the student. The same was true for participants in the Talker1/s-accent and the Talker2/z-accent conditions. The tokens produced by Talker3 were reserved for the test phase. Each word was paired with a unique line drawing image (Snodgrass & Vanderwart, Reference Snodgrass and Vanderwart1980) depicting its meaning (see Fig. 1). All visual stimuli, including the line drawings in Fig. 1 and the iconographic images of teachers and students in Fig. 3, are identical to those used in the original study.
Twelve words in their [s] and [z] accents and associated meanings.

2.1.3. Procedure
The procedure is identical to that in the original study, employing the same informed consent, sound check, instructions, experiment tasks, and questionnaire. Both the original and the current study were conducted entirely online and lasted approximately 20 minutes. Participants were instructed to complete the entire study in a quiet location of their choosing and in a single session, and to use a computer with either a Firefox or Chrome browser and headphones.
The study flow, which is identical to the original study, is shown in Fig. 2. Participants began the study by clicking a link in the Sona experiment scheduling platform (Sona-Systems.com), which redirected them to a consent document presented via Qualtrics survey (Qualtrics.com). Upon reading the document and agreeing to participate, participants were redirected to the experimental tasks, which were created in PsychoPy (Peirce et al., Reference Peirce, Gray, Simpson, MacAskill, Höchenberger, Sogo, Kastman and Lindeløv2019) and hosted on Pavlovia.org. During an initial sound check task, participants heard a male English speaker produce several high-frequency English words and were instructed to adjust their volume to a comfortable listening level. Next, participants completed the experimental tasks, which consisted of two iterations of an exposure phase and a test phase described in more detail in Sections 2.2 and 2.3. Following the experimental tasks, participants were redirected to a participant questionnaire implemented in Qualtrics, also described in Section 2.4.
Experiment 1 study flow. It is identical to the study flow of the original study.

2.2. Exposure phase
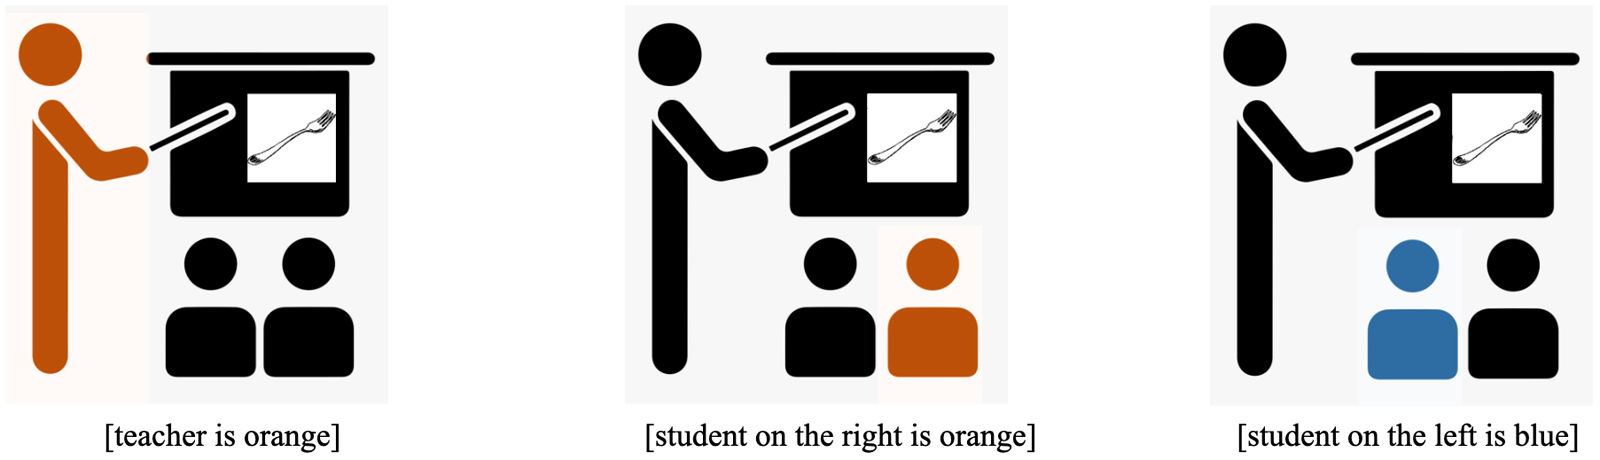
Immediately prior to the first exposure phase, participants were told that they would observe a ‘foreign’ language class where students are learning new vocabulary, that they would hear the teacher say the new words followed by a student, and that they should pay attention to the pronunciation of the words. The individual (teacher or student) who produced each token was indicated via orange highlighting (see Fig. 3) while each auditory word was presented and the word’s corresponding image/meaning appeared on the screen. Each exposure phase involved the teacher producing each of the 12 words in a random order, followed by the student doing the same. This sequence was repeated twice per exposure phase (48 exposure trials per exposure phase). There were two exposure phases for a total of 96 exposure trials (see Fig. 4).
Images presented during exposure and test, indicating that the person saying the vocabulary word is the teacher (left image), exposure student (center image), and test student (right image). The word being said in these examples is [s/zego] ‘fork.’

Schematic representation of the exposure and test phase sequence for the condition where TeacherVoice = Talker1, TeacherAccent = z-accent.

Figure 4 Long description
Two exposure phases and two test phases are shown. In Exposure1, Talker1 uses the z-accent. Talker2 uses the s-accent. These talkers each produce the 12 words twice for 48 trials. Test1 involves a two-alternative forced-choice with 12 trials, comparing Talker3′s productions of the word with z-accent (‘zego’) and s-accent (‘sego’). Exposure2 repeats the process with Talker1 using the z-accent and Talker2 using the s-accent for 48 trials, followed by Test2 with the same forced-choice setup as Test1.
2.3. Test phase
Each exposure phase was followed by a test phase which consisted of 12 trials (one trial for each of the 12 words presented in a random order). On each trial, participants heard both the [s] and [z] variant of the word spoken by a new talker (Talker3) who they were told was a different student than the one observed during exposure (this is the student highlighted in blue in the rightmost image in Fig. 3). Participants were instructed to choose the ‘better’ of the two pronunciations by pressing the ‘1’ or the ‘2’ keys on the keyboard to indicate the first or second production, respectively. The order of presentation of the [s] and [z] variants in the test trial associated with a particular word was counterbalanced such that for a given word, if the [s] variant was presented first in the first test phase, it was presented second in the second test phase, and vice versa. The exposure and test phase sequence was repeated twice for a total of 24 test trials (Fig. 4).
2.4. Participant questionnaire
Upon completion of the experimental tasks, participants were redirected to a Qualtrics-based questionnaire, covering their demographic and linguistic backgrounds. Several items assessing participants’ social beliefs were included in the background questionnaire for the purpose of future instrument development; these items are not associated with the present research questions and are not considered in the analyses reported here.
Table 3 provides a summary of notable differences between the materials and procedure in the original and current study.
Summary of notable materials and procedure differences between the original Hayes-Harb et al. (Reference Hayes-Harb, Barrios and Tripp2022) study and the current study

Table 3 Long description
Two columns compare Hayes-Harb et al. 2022 with the current study, Experiment 1, for pronunciation contrast. In Hayes-Harb et al. 2022, the pronunciation contrast is word initial short vs. long voice onset time, described as synthetically manipulated. In the current study, Experiment 1, the pronunciation contrast is word-initial s and z, described as naturally produced.
2.5. Results
The data from Experiment 1 consist of 1,608 observations (24 observations/participant). Of those, 103 (6.4%; compared to 6.7% in the original study) observations for which the response time exceeded 4 seconds were excluded from the final data set. The response coding scheme from the original study was adapted to the current accent contrast, with ‘1’ and ‘2’ responses converted to [z] responses (1 = [z] response and 0 = [s] response). The most substantial difference between the analyses of the original and current studies is that, as explained above, the current study lacks the four control conditions that were included in the original study. Therefore, analyses in the current study are simplified in that they do not include a fixed factor for control/experimental condition.
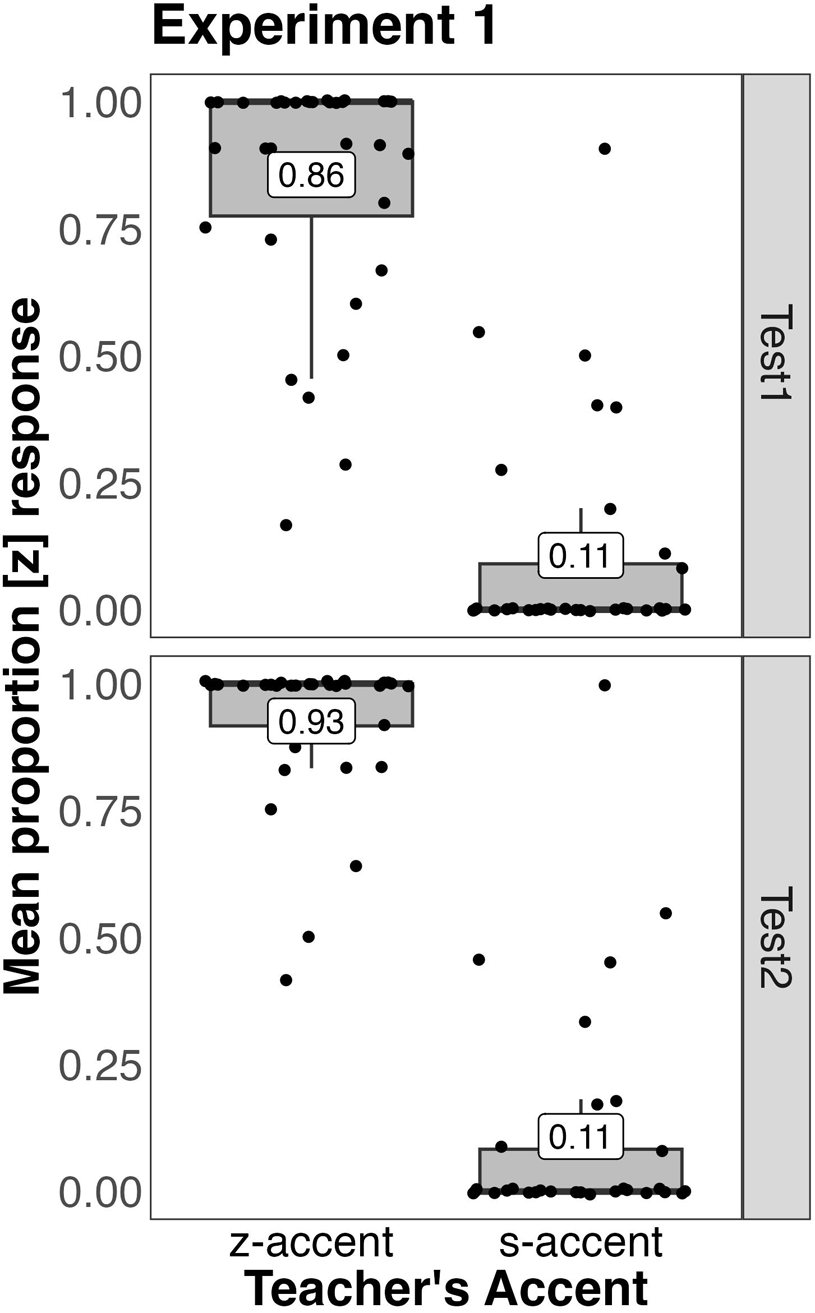
Figure 5 presents the mean proportion of [z] response by TeacherAccent at Test1 and Test2. TeacherAccent (the accent associated with the Teacher during exposure; either s-accent or z-accent) had a large effect on the proportion of [z] responses. Participants who heard the teacher produce the z-accent during exposure produced primarily [z] responses at test (Test1 = .86, Test2 = .93), whereas participants who observed the teacher produce the words with the s-accent produced few [z] preference responses at test (Test1 = .11, Test2 = .11).
Boxplots of mean proportion [z] responses by TeacherAccent (z-accent, s-accent) and TestNumber (Test1, Test2) in Experiment 1. Dots indicate individual participant means, and medians are represented as horizontal lines. Superimposed proportions show the group mean proportion [z] response for the corresponding condition.

2.5.1. Omnibus analysis
Our omnibus analysis consisted of fitting a generalized linear mixed effects model with a binomial linking function using the lme4 package (version 1.1.35.5; Bates et al., Reference Bates, Mächler, Bolker and Walker2015) of R (version 4.4.0) and the bobyqa optimizer for speed and valid convergence. Our dependent variable was [z] response ([z] = 1, [s] = 0), and our contrast-coded fixed effects included TeacherAccent (two levels: z-accent [−.5], s-accent [.5]), TestNumber (two levels: Test1 [−.5], Test2 [.5]), and the counterbalancing variable TeacherVoice (two levels: teacher = Talker1/student = Talker2 [−.5], teacher = Talker2/student = Talker1 [.5]), and random intercepts for Word and Participant and random by-participant slopes for TestNumber (m.three.way; see Table 4b).
Generalized linear mixed effects model analysis of TeacherAccent and TestNumber (TestN) in Experiment 1

Table 4 Long description
Fixed effects are reported as Estimate, SE, z, and p, alongside random effects standard deviations by participant and by word. The fixed effect intercept has Estimate minus 0.25, SE 0.38, z minus 0.65, and p 0.52. TeacherAccent has Estimate minus 8.08, SE 0.95, z minus 8.47, and p less than 0.001. TestN has Estimate 0.60, SE 0.31, z 1.91, and p 0.06. The TeacherAccent by TestN interaction has Estimate minus 1.06, SE 1.23, z minus 0.86, and p 0.39. Random effects standard deviations are 2.52 by participant and 0.19 by word for the intercept row, and 1.16 by participant for the TestN row; the other random effects cells are blank.
Notes: All factors were coded using contrast coding, as follows: TeacherAccent (z-accent = −.5, s-accent = .5), TestN (Test1 = −.5, Test2 = .5), TeacherVoice (Talker1 = −.5, Talker2 = .5).
(a) Two-way analysis model formula (m.two.way): ZResponse ∼ TeacherAccent * TestN + (1 + TestN|participant) + (1|Word), family = binomial, control = glmerControl(optimizer = ‘bobyqa’).
(b) Three-way analysis model formula (m.three.way): ZResponse ∼ TeacherAccent * TestN * TeacherVoice + (1 + TestN|participant) + (1|Word), family = binomial, control = glmerControl(optimizer = ‘bobyqa’).
In the original study, the decision to remove the counterbalance variable TeacherVoice (which they called Teacher-Talker) from the final model was made on the basis of a lack of main effect or interactions involving this variable in the omnibus model. Here we employed a model comparison approach to this same end: We compared the three-way model described above to one without TeacherVoice (m.two.way; see Table 4a), using a likelihood ratio test to determine whether the more complex model including TeacherVoice provided a better fit of the data. The model including TeacherVoice did not provide a significantly better fit of the data than the simpler model (χ 2(4) = 5.45, p = .24), and thus the inclusion of the counterbalance factor TeacherVoice was not statistically justified. This final model is summarized in Table 4. A significant main effect of TeacherAccent (estimate = −8.08, SE = .95, z = −8.47, p < .001) was observed (the analogous main effect was also significant in the original study), suggesting that accent preferences were influenced by the social role of the talker who used a particular accent during the exposure phase. As expected, participants exhibited a preference for the accent that had been used by the teacher over that of the student. Like the original study, the main effect of TestNumber was not significant; however, in contrast to the original study, we observed no significant interaction of TeacherAccent and TestNumber.
2.5.2. Subset analyses by TestNumber
The TestNumber variable emerged as an artifact of our efforts to ensure that participants had an opportunity to gain familiarity with the test procedure (their first encounter with the test procedure was at Test1) and that they received adequate exposure to the words (via two exposure–test cycles) and is not associated with our research question. Indeed, Hayes-Harb et al. (Reference Hayes-Harb, Barrios and Tripp2022) attributed observed differences between Test1 and Test2 to participants’ inexperience with the test procedure and/or relatively sparser exposure earlier in the study. For this reason, and as in the original study, we performed subset analyses of the data separately by TestNumber, with the expectation that while performance at Test1 and Test2 may differ, performance at Test2 will provide a more valid measure of the effects of the manipulated variables. An effect of TeacherAccent at Test2 would replicate the original study’s finding that adult language learners prefer the accent of the teacher relative to that of a student in an artificial language learning setting.
The subset analyses consisted of fixed effects of TeacherAccent and TeacherVoice, and their interactions, as well as random by-participant (participant) and by-item (Word) intercepts. We compared a model that included TeacherVoice (subset.m.two.way.Test1 [Table 5b] and subset.m.two.way.Test2 [Table 6b]) with one that did not (subset.m.one.way.Test1 [Table 5a] and subset.m.one.way.Test2 [Table 6a]). At neither Test1 nor Test2 did the model that included TeacherVoice provide a better fit to the data (Test1 subset: [χ 2(2) = 1.75, p = .42]; Test2 subset: [χ 2(2) = 5.10, p = .08]). These models of the Test1 and Test2 subsets are summarized in Tables 5 and 6, respectively.
Generalized linear mixed effects model analysis of TeacherAccent at Test1in Experiment 1

Table 5 Long description
Fixed effects and random effects are reported for parameters labeled, (intercept) and, TeacherAccent, with fixed effect columns Estimate, SE, z, and p, and random effect columns SD by participant and SD by word. For, (intercept), the estimate is minus 0.60, SE 0.54, z minus 1.12, and p 0.27. The random effect standard deviations for, (intercept), are 3.18 by participant and 0.87 by word. For, TeacherAccent, the estimate is minus 9.08, SE 1.61, z minus 5.66, and p less than 0.001. No random effect standard deviations are shown in the TeacherAccent row.
Notes: All factors were coded using contrast coding, as follows: TeacherAccent (z-accent = −.5, s-accent = .5), TeacherVoice (Talker1 = −.5, Talker2 = .5).
(a) Two-way analysis model formula (subset.m.one.way.Test1): ZResponse ∼ TeacherAccent + (1|participant) + (1|Word), family = binomial, control = glmerControl(optimizer = ‘bobyqa’).
(b) Three-way analysis model formula (subset.m.two.way.Test1): ZResponse ∼ TeacherAccent * TeacherVoice + (1|participant) + (1|Word), family = binomial, control = glmerControl(optimizer = ‘bobyqa’).
Generalized linear mixed effects model analysis of TeacherAccent at Test2 in Experiment 1

Table 6 Long description
Generalized linear mixed effects model results are reported with fixed effects columns for Estimate, SE, z, and p, and random effects columns for SD by participant and SD by word. Fixed effects include two rows: (intercept) and TeacherAccent. For (intercept), the estimate is 0.23, SE is 0.47, z is 0.49, and p is 0.62; random effect SD is 3.13 by participant and 0.22 by word. For TeacherAccent, the estimate is minus 9.77, SE is 1.94, z is minus 5.03, and p is less than 0.001; the random effects SD cells in this row are blank.
Notes: All factors were coded using contrast coding, as follows: TeacherAccent (z-accent = −.5, s-accent = .5), TeacherVoice (Talker1 = −.5, Talker2 = .5).
(a) Two-way analysis model formula (subset.m.one.way.Test2): ZResponse ∼ TeacherAccent + (1|participant) + (1|Word), family = binomial, control = glmerControl(optimizer = ‘bobyqa’).
(b) Three-way analysis model formula (subset.m.two.way.Test2): ZResponse ∼ TeacherAccent * TeacherVoice + (1|participant) + (1|Word), family = binomial, control = glmerControl(optimizer = ‘bobyqa’).
In contrast with the original study, where a significant effect of the teacher’s accent emerged only at Test2, we observe an effect of TeacherAccent for both Test1 (estimate = −9.08, SE = 1.61, z = −5.66, p < .001) and Test2 (estimate = −9.77, SE = 1.94, z = −5.03, p < .001) subsets, with participants exhibiting a strong preference for the accent that had been associated with the teacher (as opposed to the student) during the exposure phase.
2.6. Discussion
Experiment 1 was a close replication of the experimental conditions reported in Hayes-Harb et al. (Reference Hayes-Harb, Barrios and Tripp2022), addressing the question of whether participants will prefer the accent of a teacher relative to that of a student peer in an artificial language learning setting. We varied the accent that learners heard associated with 12 words such that between the teacher and the student the learners heard equal numbers of [s] and [z] variants and such that the accent and the voice attributed to the teacher and student were counterbalanced across participants. We found that participants exhibited a preference for the pronunciation that was associated with the teacher during exposure. We thus replicate the teacher preference effect reported in Hayes-Harb et al. (Reference Hayes-Harb, Barrios and Tripp2022) with the new /s/–/z/ contrast. Indeed, with this new contrast, the effect is both larger and appears sooner (at Test1) than in the original study. It is worth noting that in addition to the intentional alteration in pronunciation contrast, incidental participant differences between the original and current studies in (1) how participants were sampled (via a university participant pool vs. a combination of the participant pool and Prolific); (2) the current lack of a medical condition/medication exclusionary criterion (it is no longer the practice of our lab to exclude participants using a medical criterion); and even (3) a loosening of the language background criterion to require only that participants identify English as a ‘native’ or childhood language (we currently employ a more expansive definition of L1 English speaker) did not alter the pattern of results. Thus, the finding is robust to these differences, and having observed this strong preference for the teacher’s accent with these new materials, in Experiment 2, we set out to address the question of whether language learners’ preferences for the teacher’s pronunciation relative to that of a student are influenced by ‘favorable’ and ‘unfavorable’ vignettes regarding the teacher’s characteristics.
3. Experiment 2
Study materials, experiment scripts, anonymized data, and analysis scripts are available at: https://osf.io/8nu2p/.
3.1. Methods
3.1.1. Participants
We recruited 220 individuals from the Linguistics Department study pool at the University of Utah, all of whom received course credit for their participation. Data from 74 participants were excluded from the final data set for one or more of the following reasons: not identifying English among the languages they considered ‘native’ or a language they used with childhood caregivers (19), familiarity with one of the talker’s voices (46), and for having completed a prior version of this study (23). Data from the remaining 146 participants were included in the analyzed data set. Forty-eight of these individuals additionally identified one or more of the following languages as their ‘native’ language(s) and/or languages used with childhood caregivers: Arabic (1), ASL (2), Bosnian (1), Croatian (1), Cantonese (1), German (3), Gujarati (2), Hindi (2), Marathi (1), Japanese (1), Korean (1), Kutchi (1), Mandarin (1), Navajo (2), Nepali (1), Punjabi (1), Russian (1), Samoan (1), Sindhi (1), Spanish (25), Tagalog (1), Taishanese (1), Tamil (1), Turkish (1), Urdu (3). Ninety-one of these individuals also reported having learned additional languages, including Albanian (1), Arabic (5), ASL (7), Chinese (2), Croatian (1), French (22), German (11), Hindi (1), Italian (5), Japanese (8), Korean (6), Latin (1), Mandarin (2), Navajo (1), Norwegian (2), Russian (7), Sanskrit (1), Spanish (47), Swahili (1), Tagalog (1), Turkish (2). Participants were distributed across the eight counterbalanced exposure conditions crossing TeacherVoice (Talker1, Talker2), TeacherAccent (z-accent, s-accent), and VignetteCondition (‘favorable,’ ‘unfavorable’), as summarized in Table 7.
Summary of participants assigned to each exposure condition in Experiment 2

Table 7 Long description
Participants are grouped by vignette condition, teacher voice, and teacher accent, with columns for N, mean age with range, and gender identity counts for non-binary, female, male, and prefer not to answer. In the favorable condition with Talker1 and accent s, N is 19, mean age is 24 years with a range from 18 to 64, and gender identity counts are 1 non-binary, 11 female, 7 male, 0 prefer not to answer; with accent z, N is 18, mean age is 20.29 with a range from 18 to 24, and gender identity counts are 0, 14, 3, 0. In the favorable condition with Talker2 and accent s, N is 21, mean age is 21.86 with a range from 18 to 52, and gender identity counts are 0, 14, 7, 0; with accent z, N is 19, mean age is 20.16 with a range from 18 to 23, and gender identity counts are 1, 12, 6, 0. In the unfavorable condition with Talker1 and accent s, N is 19, mean age is 21.89 with a range from 18 to 36, and gender identity counts are 0, 13, 6, 0; with accent z, N is 19, mean age is 20.32 with a range from 18 to 24, and gender identity counts are 0, 13, 6, 0. In the unfavorable condition with Talker2 and accent s, N is 16, mean age is 21.12 with a range from 18 to 33, and gender identity counts are 0, 9, 7, 0; with accent z, N is 16, mean age is 22.88 with a range from 18 to 47, and gender identity counts are 0, 10, 4, 2.
3.1.2. Materials
The auditory and visual stimuli used in the exposure and test phase were identical to those used in Experiment 1. The only difference between the procedures in Experiment 1 and Experiment 2 was that prior to exposure, participants read a vignette (see Table 8) describing the teacher with social characteristics that were expected to enhance (‘favorable’) or diminish (‘unfavorable’) the preference for the teacher’s pronunciation observed in Experiment 1.
Two vignettes describing the teacher’s language background, teacher training, and teaching effectiveness in Experiment 2

Table 8 Long description
Two conditions are listed, labeled, favorable and unfavorable, each paired with a teacher description covering language background, training, and pronunciation teaching. In the favorable condition, the teacher is a native speaker of the language they are teaching. This teacher has a master’s degree in language teaching and has won several awards for effectiveness in teaching pronunciation. In the unfavorable condition, the teacher learned the language they are teaching in college. This teacher is new to teaching and has struggled to develop skills in teaching pronunciation.
3.1.3. Procedure
The procedure was identical to Experiment 1 except that immediately prior to each exposure phase, participants read the vignette corresponding with their randomly assigned condition. In addition, we included four new items in the questionnaire probing participants’ beliefs about language and accents. Responses to these items are not included in the planned analyses as they are not associated with our research questions. However, we present a preliminary exploratory analysis of participants’ responses to these items in an exploratory analysis of individual participant differences and further take up these analyses in Section 4.
3.2. Results
Experiment 2 data consist of 3,504 observations (24 observations/participant). Of those, 192 (5.5%) observations for which the response time exceeded 4 seconds were excluded. The final data set includes 3,312 observations. ‘1’ and ‘2’ responses were converted to [z] responses (1 = [z] response and 0 = [s] response). Figure 6 presents the mean proportion of [z] response by TeacherAccent at Test1 and Test2 for the ‘favorable’ vs. ‘unfavorable’ VignetteCondition. In the ‘favorable’ VignetteCondition, TeacherAccent had a large effect on the proportion of [z] responses. As in Experiment 1, participants who heard the teacher produce the z-accent during the exposure phase produced primarily [z] responses at test (Test1 = .82, Test2 = .92), whereas participants who observed the teacher produce the words with the s-accent produced few [z] preference responses (more [s] responses) at test (Test1 = .17, Test2 = .10). By contrast, participants in the ‘unfavorable’ VignetteCondition exhibited a reduced preference for the teacher’s accent when the teacher was characterized unfavorably (z-accent-Test1 = .68, z-accent-Test2 = .59, s-accent-Test1 = .48, s-accent-Test2 = .51).
Boxplots of mean proportion [z] responses by Vignette (favorable, unfavorable), TeacherAccent (z-accent, s-accent), and TestNumber (Test1, Test2) in Experiment 2. Dots indicate individual participant means, and medians are represented as horizontal lines. Superimposed proportions show the group mean proportion [z] response for the corresponding condition.

Figure 6 Long description
Experiment 2. Two by two set of boxplots with dots. Horizontal axis label, Teacher′s Accent. Categories, z-accent and s-accent. Vertical axis label, Mean proportion [z] response. Range 0.00 to 1.00. Top row label, Test1. Bottom row label, Test2. Left column label, favorable. Right column label, unfavorable. Favorable, Test1: z-accent boxplot has a labeled value 0.82. s-accent boxplot has a labeled value 0.17. Favorable, Test2: z-accent boxplot has a labeled value 0.92. s-accent boxplot has a labeled value 0.10. Unfavorable, Test1: z-accent boxplot has a labeled value 0.68. s-accent boxplot has a labeled value 0.48. Unfavorable, Test2: z-accent boxplot has a labeled value 0.59. s-accent boxplot has a labeled value 0.51.
3.2.1. Omnibus analysis
We again fit a generalized linear mixed effects model with a binomial linking function using the lme4 package (version 1.1.35.5; Bates et al., Reference Bates, Mächler, Bolker and Walker2015) of R (version 4.4.0) and the bobyqa optimizer. Our dependent variable was [z] response ([z] = 1, [s] = 0) and our contrast-coded fixed effects included VignetteCondition (two levels: ‘favorable’ [−.5], ‘unfavorable’ [.5]), TeacherAccent (two levels: z-accent [−.5], s-accent [.5]), TestNumber (two levels: Test1 [−.5], Test2 [.5]), and the counterbalancing variable TeacherVoice (two levels: teacher = Talker1/student = Talker2 [−.5], teacher = Talker2/student = Talker1 [.5]), and random intercepts for Word and Participant and random by-participant slopes for TestNumber. Planned comparisons were conducted using simultaneous tests for general linear hypotheses with the multcomp package (version 1.4.25; Hothorn et al., Reference Hothorn, Bretz and Westfall2008). P-values were adjusted using the single-step method and a family-wise error rate protection via Bonferroni correction.
As was done for Experiment 1, we first compared two models, one that included TeacherVoice (m.four.way; see Table 9b) as main effect as well as all possible interaction terms with the other fixed effects in the model and one without TeacherVoice (m.three.way; see Table 9a), using a likelihood ratio test to determine whether the more complex model including TeacherVoice provided a better fit of the data. The model including TeacherVoice was not statistically justified (χ 2(8) = 7.68, p = .47).
Generalized linear mixed effects model analysis of VignetteCondition, TeacherAccent, and TestNumber (TestN) in Experiment 2

Table 9 Long description
Fixed effects are reported with columns for Estimate, SE, z, and p, plus random effects standard deviations for by-participant and by-word. The intercept has estimate 0.13, SE 0.29, z 0.46, p 0.65, with by-participant SD 3.13 and by-word SD 0.07. VignetteCondition has estimate 0.62, SE 0.58, z 1.06, p 0.29. TeacherAccent has estimate minus 5.20, SE 0.64, z minus 8.14, p less than 0.001. TestN has estimate minus 0.19, SE 0.34, z minus 0.57, p 0.57, with by-participant SD 3.05. Interaction rows list: VignetteCondition with TeacherAccent estimate 7.49, SE 1.22, z 6.13, p less than 0.001; VignetteCondition with TestN estimate minus 0.36, SE 0.68, z minus 0.53, p 0.59; TeacherAccent with TestN estimate minus 2.43, SE. 086, z minus 2.83, p less than 0.01; and the three-way interaction VignetteCondition with TeacherAccent with TestN estimate 6.40, SE 1.55, z 4.13, p less than 0.001.
Notes: All factors were contrast coded, as follows: VignetteCondition (‘favorable’ = −.5, ‘unfavorable’ = .5), TeacherAccent (z-accent = −.5, s-accent = .5), TeacherVoice (Talker1 = −.5, Talker2 = .5), TestN (Test1 = −.5, Test2 = .5).
(a) Three-way analysis model formula (m.three.way): ZResponse ∼ VignetteCondition * TeacherAccent * TestN + (1 + TestN|participant) + (1|Word), family = binomial, control = glmerControl(optimizer = ‘bobyqa’).
(b) Four-way analysis model formula (m.four.way): ZResponse ∼ VignetteCondition * TeacherAccent * TestN * TeacherVoice + (1 + TestN|participant) + (1|Word), family = binomial, control = glmerControl(optimizer = ‘bobyqa’).
The final model is summarized in Table 9. We observed a significant main effect of TeacherAccent (estimate = −5.20, SE = .64, z = −8.14, p < .001), as well as significant interactions of VignetteCondition * TeacherAccent (estimate = 7.49, SE = 1.22, z = 6.13, p < .001), TeacherAccent * TestNumber (estimate = −2.43, SE = .86, z = −2.83, p < .01), and VignetteCondition * TeacherAccent * TestNumber (estimate = 6.40, SE = 1.55, z = 4.13, p < .001).
3.2.2. Subset analyses by TestNumber
Our subset analyses consisted of fixed effects of VignetteCondition, TeacherAccent, and TeacherVoice, and their interactions, as well as random by-participant (Part_ID) and by-item (Word) intercepts. A two-way interaction of VignetteCondition and TeacherAccent at Test2 would support our hypothesis that adult language learners’ preferences for the accent of the teacher (relative to that of a student) are influenced by the social characteristics of the teacher (teaching experience, teaching effectiveness, and linguistic background) presented via vignettes. As was done for the omnibus analysis, we compared a model that included TeacherVoice (see Tables 10b and 11b) with one that did not include this variable (see Tables 10a and 11a). In neither of the subset analyses of data did the model that included TeacherVoice provide a better fit to the data (Test1 subset: [χ 2(4) = 4.38, p = .36]; Test2 subset: [χ 2(4) = 5.18, p = .27]). These models of the Test1 and Test2 subsets are summarized in Tables 10 and 11, respectively.
Generalized linear mixed effects model analysis of VignetteCondition, TeacherAccent for Test1 subset in Experiment 2

Table 10 Long description
Fixed effects are reported with columns for Estimate, SE, z, and p, and random effects are reported as SD by participant and SD by word. The intercept has an estimate of 0.30, SE 0.27, z 1.11, p 0.27, with random effect SD 2.80 by participant and 0.17 by word. VignetteCondition has an estimate of 0.79, SE 0.54, z 1.47, p 0.14. TeacherAccent has an estimate of minus 4.13, SE.60, z minus 6.94, p less than 0.001. The interaction, VignetteCondition times TeacherAccent, has an estimate of 4.36, SE 1.11, z 3.94, p less than 0.001. Random effect SD values are shown only for the intercept row.
Notes: All factors were contrast coded, as follows: VignetteCondition (‘favorable’ = −.5, ‘unfavorable’ = .5), TeacherAccent (z-accent = −.5, s-accent = .5), TeacherVoice (Talker1 = −.5, Talker2 = .5).
(a) Two-way analysis model formula (subset.m.two.way.Test1): ZResponse ∼ VignetteCondition * TeacherAccent + (1|participant) + (1|Word), family = binomial, control = glmerControl(optimizer = ‘bobyqa’).
(b) Three-way analysis model formula (subset.m.three.way.Test1): ZResponse ∼ VignetteCondition * TeacherAccent * TeacherVoice + (1|participant) + (1|Word), family = binomial, control = glmerControl(optimizer = ‘bobyqa’).
Generalized linear mixed effects model analysis of VignetteCondition, TeacherAccent for Test2 subset in Experiment 2

Table 11 Long description
Fixed effects are reported with columns for Estimate, SE, z, and p, and random effects are reported as SD by participant and SD by word. The intercept has Estimate 0.14, SE 0.41, z 0.34, p 0.74, with random effect SD 4.53 by participant and 0.10 by word. VignetteCondition has Estimate 0.49, SE 0.82, z 0.60, p 0.55. TeacherAccent has Estimate minus 7.05, SE 1.02, z minus 6.92, p less than 0.001. The VignetteCondition by TeacherAccent interaction has Estimate 11.66, SE 1.86, z 6.26, p less than 0.001. Random effect SD values are shown only on the intercept row, with blank SD cells for the other fixed effect rows.
Notes: All factors were contrast coded, as follows: VignetteCondition (‘favorable’ = −.5, ‘unfavorable’ = .5), TeacherAccent (z-accent = −.5, s-accent = .5), TeacherVoice (Talker1 = −.5, Talker2 = .5).
(a) Two-way analysis model formula (subset.m.two.way.Test2): ZResponse ∼ VignetteCondition * TeacherAccent + (1|participant) + (1|Word), family = binomial, control = glmerControl(optimizer = ‘bobyqa’).
(b) Three-way analysis model formula (subset.m.three.way.Test2): ZResponse ∼ VignetteCondition * TeacherAccent * TeacherVoice + (1|participant) + (1|Word), family = binomial, control = glmerControl(optimizer = ‘bobyqa’).
For the Test1 subset, we observe a significant main effect of TeacherAccent (estimate = −4.13, SE = .60, z = −6.94, p = < .001), as well as a significant two-way interaction of VignetteCondition and TeacherAccent (estimate = 4.36, SE = 1.11, z = 3.94, p = <.001). Pairwise comparisons of TeacherAccent were significant at Test1 for both the ‘favorable’ (estimate = −6.31, SE = .86, z = −7.33, p < .001) and the ‘unfavorable’ vignette conditions (estimate = −1.95, SE = .76, z = −2.57, p = .02).
For the Test2 subset, we observe a significant main effect of TeacherAccent (estimate = −7.05, SE = 1.02, z = −6.92, p < .001), as well as a significant two-way interaction of VignetteCondition and TeacherAccent (estimate = 11.66, SE = 1.86, z = 6.26, p < .001), suggesting that participants’ accent preferences were influenced by who produced the particular accent (teacher or student) but also that this preference was modulated by the social characteristics attributed to the teacher via the vignette. Pairwise comparisons of TeacherAccent were significant at Test2 for the ‘favorable’ (estimate = −12.88, SE = 1.49, z = −8.64, p < .001), but not for the ‘unfavorable’ vignette conditions (estimate = −1.21, SE = 1.26, z = −0.96, p = .56).
3.2.3. Exploratory analysis of individual participant differences
The research questions addressed in this study concern group-level responses to input sources in accent learning. However, study participants are likely to vary in their responses to the social characteristics of talkers based on their experiences and attitudes (Babel & Russell, Reference Babel and Russell2015; Ingvalson et al., Reference Ingvalson, Lansford, Federova and Fernandez2017; Kutlu et al., Reference Kutlu, Tiv, Wulff and Titone2022; Ryken et al., Reference Ryken, Tupper and Weatherhead2024), and individual listener factors have also been shown to affect perceptual learning (Amitay et al., Reference Amitay, Halliday, Taylor, Sohoglu and Moore2010). In order to explore whether individuals varied in the preference for the teacher’s accent regardless of the particular accent that had been associated with the teacher, we computed the mean proportion of the time that participants exhibited a TeacherPreference response on a by-participant basis from their mean proportion [z] response. For participants in the z-accent condition, their mean proportion [z]-response is the same as their mean proportion TeacherPreference response. For participants in the s-accent condition, TeacherPreference was the inverse of their mean proportion [z]-response. Figure 7 shows histograms of participants’ mean proportion of TeacherPreference responses by VignetteCondition and TestNumber. This exploratory descriptive analysis of the results of Experiment 2 reveals a bimodal distribution of participants’ mean Teacher Preference responses in the unfavorable vignette condition.
Histograms of the distribution of participants’ mean proportion TeacherPreference responses by VignetteCondition and TestNumber in Experiment 2.

Figure 7 Long description
Four histograms arranged in a two by two grid. Top left histogram text: favorable vertical bar Test1. The horizontal axis label is Teacher Preference. The vertical axis label is Frequency. The vertical axis shows 0, 10, 20, 30, 40, 50, 60. The horizontal axis shows 0.0, 0.2, 0.4, 0.6, 0.8, 1.0. Bars appear at approximately 0.0 to 0.1, 0.1 to 0.2, 0.2 to 0.3, 0.3 to 0.4, 0.4 to 0.5, 0.5 to 0.6, 0.6 to 0.7, 0.7 to 0.8, 0.8 to 0.9 and 0.9 to 1.0. The tallest bar is in the 0.9 to 1.0 bin, reaching about 50 on the Frequency axis. Top right histogram text: unfavorable vertical bar Test1. The horizontal axis label is Teacher Preference. The vertical axis label is Frequency. The vertical axis shows 0, 10, 20, 30, 40, 50, 60. The horizontal axis shows 0.0, 0.2, 0.4, 0.6, 0.8, 1.0. Bars appear at approximately 0.0 to 0.1, 0.2 to 0.3, 0.3 to 0.4, 0.4 to 0.5, 0.5 to 0.6, 0.6 to 0.7, 0.7 to 0.8, 0.8 to 0.9 and 0.9 to 1.0. The tallest bar is in the 0.9 to 1.0 bin, reaching about 25 on the Frequency axis. A bar at approximately 0.0 to 0.1 reaches about 15. Bottom left histogram text: favorable vertical bar Test2. The horizontal axis label is Teacher Preference. The vertical axis label is Frequency. The vertical axis shows 0, 10, 20, 30, 40, 50, 60. The horizontal axis shows 0.0, 0.2, 0.4, 0.6, 0.8, 1.0. Bars appear at approximately 0.2 to 0.3, 0.3 to 0.4, 0.4 to 0.5, 0.5 to 0.6, 0.6 to 0.7, 0.7 to 0.8, 0.8 to 0.9 and 0.9 to 1.0. The tallest bar is in the 0.9 to 1.0 bin, reaching about 60 on the Frequency axis. Bottom right histogram text: unfavorable vertical bar Test2. The horizontal axis label is Teacher Preference. The vertical axis label is Frequency. The vertical axis shows 0, 10, 20, 30, 40, 50, 60. The horizontal axis shows 0.0, 0.2, 0.4, 0.6, 0.8, 1.0. Bars appear at approximately 0.0 to 0.1, 0.1 to 0.2, 0.2 to 0.3, 0.3 to 0.4, 0.4 to 0.5, 0.5 to 0.6, 0.6 to 0.7, 0.7 to 0.8, 0.8 to 0.9 and 0.9 to 1.0. The tallest bars are in the 0.0 to 0.1 bin and the 0.9 to 1.0 bin, both bars reaching about 25 on the Frequency axis.
The group means reported in Fig. 6 might be interpreted as indicating that these participants as a group experienced a modulation of their accent preferences as a result of the ‘unfavorable’ vignette; however, the histograms presented in Fig. 7 instead indicate that most of the participants exhibited either a strong preference for the teacher’s accent or a strong preference for the student’s accent.
As noted above, Experiment 2 participants responded to four language belief items in the participant background questionnaire. These items required participants to select a response along a slider from 0 (not at all agree) to 100 (completely agree) to each of the following statements: (1) It is important for a language teacher to be a native speaker of the language; (2) The goal of a language learner should be to pronounce the language like a native speaker; (3) Correct pronunciation is an important goal for language learners; and (4) Non-native accents make it hard for me to understand speech.
While the slider items are preliminary and the instrument is still under development, responses to these might shed light on the individual differences observed in Experiment 2 performance. We conducted further exploratory analysis to determine whether responses to these items would help to explain participants’ accent preferences. We compared the three-way omnibus model (m.three.way; see Table 10a) with four additional models, each of which incorporated one of the four accent sliders as an additional predictor variable (teacher_ns, ns_goal, correct_goal, and accent_hard). Because we cannot assume that individual participants use this scale in the same way across items, or that these scales are used the same way by different individuals, we standardized and centered the variables prior to including them as predictors in or model using the scale (…, center = TRUE, scale = TRUE) function in R. Model comparisons confirmed that none of these models improved model fit relative to the simpler three-way model (teacher_ns = [χ 2(1) = .75, p = .39], ns_goal = [χ 2(1) = .01, p = .91], correct_goal = [χ 2(1) = .92, p = .34], or accent_hard = [χ 2(1) = .16, p = .69]). Thus, this preliminary and exploratory analysis of these four language beliefs items did not enhance our understanding of the individual differences we observed. The need for additional work on individual variation is taken up in Section 4.
3.3. Discussion
In Experiment 2, we asked whether participants’ preferences for the teacher’s pronunciation relative to that of a student are influenced by ‘favorable’ and ‘unfavorable’ vignettes provided regarding the teacher’s social characteristics. We again found that despite identical auditory input during the exposure phase, participants preferred the teacher’s pronunciation, replicating the findings of Hayes-Harb et al. (Reference Hayes-Harb, Barrios and Tripp2022) and Experiment 1. However, the preference for the teacher’s accent was modulated by the social characteristics ascribed to the teacher via vignettes concerning the teacher’s teaching experience, teaching effectiveness, and linguistic background. At both Test1 and Test2, we observed a two-way interaction of TeacherAccent and Vignette Condition. While we observed a strong preference for the TeacherAccent in the ‘favorable’ condition at both Test1 and Test2, we observed an effect of TeacherAccent at Test1, but not Test2, in the ‘unfavorable’ condition; by Test2, participants show no preference for the teacher’s accent relative to that of the student when the teacher is described ‘unfavorably.’ Exploratory analyses revealed that participants, especially those in the ‘unfavorable’ conditions, exhibited a great deal of individual variation; however, statistical analyses incorporating responses to four preliminary language and accent belief items failed to explain the individual differences.
4. General discussion
This study had two main goals: First, to replicate Hayes-Harb et al. (Reference Hayes-Harb, Barrios and Tripp2022) with a new pronunciation contrast (Experiment 1), and second, to further build on those findings by investigating whether adult language learners’ preferences for the accent exemplified by a language teacher are affected by a (favorable vs. unfavorable) characterization of the teacher’s language background, teaching experience, and teaching effectiveness. Experiment 1 robustly replicated the Hayes-Harb et al. (Reference Hayes-Harb, Barrios and Tripp2022) finding with the new /s/–/z/ accent contrast, with participants showing a strong preference for the accent that was associated with the teacher in their counterbalanced exposure condition. This new contrast produced the same preference for the teacher’s accent, but with a larger effect size. As noted above, this was the case despite incidental differences in how participants were sampled and our more inclusive criteria for participant inclusion. Moreover, Experiment 2 revealed that this teacher preference is modulated by the presentation of vignettes providing ‘favorable’ vs. ‘unfavorable’ descriptions of the teacher’s language background, teaching experience, and teaching effectiveness, with participants showing a strong preference for the teacher’s accent in the ‘favorable’ vignette condition and no preference for the teacher’s accent in the ‘unfavorable’ vignette condition at Test2.
The results presented here highlight the influence of a teacher’s ascribed social characteristics on language learners’ accent preferences, further complicating our understanding of how speech input influences speech learning in a new language. It appears that learners take into account not only the formal role of the speaker (teacher vs. student) but further weigh the value of input from the teacher based on their beliefs about the quality of the teacher’s speech as influenced by information about the teacher’s language background and teaching experience and effectiveness. Thus, language learners engage in sophisticated assessments of the (perceived) value of different input sources and take this information into account when developing accent preferences.
In contrast to studies that attempt to isolate speech learning from its social context, the findings reported here highlight the importance of considering the influence of social factors on language learning. Importantly, despite identical auditory input across conditions, participants exhibited differential patterns of accent preference based on the social characteristics ascribed to their input sources. Therefore, any account of phonetic and phonological acquisition must accommodate the influence of learners’ awareness of and response to social factors in pronunciation teaching and learning (Atkinson, Reference Atkinson2014; Atkinson et al., Reference Atkinson, Churchill, Nishino and Okada2007; Foote & Trofimovich, Reference Foote, Trofimovich, Kang, Thomson and Murphy2017; Trofimovich, Reference Trofimovich2016).
Our approach in the present work was to explore whether a preference for the teacher’s accent is modulated by attributing social characteristics to the teacher persona. The vignettes presented in this study described the teachers ‘favorably’ and ‘unfavorably’ on multiple social dimensions simultaneously. In order to understand the contributions of each of these individual dimensions to learners’ accent preferences, future work must manipulate teacher language background, teaching experience, and teaching effectiveness independently. For example, vignettes focused only on the language background of the teacher (‘The teacher is a native/nonnative speaker of the language they are teaching’) could produce results that clarify the contribution of ‘native speakerhood’ ideology to participants’ accent preferences. Similar studies isolating and manipulating ascribed characterizations of teaching experience or teaching effectiveness would shed additional light on how language learners’ beliefs about language learning and language teaching shape pronunciation learning in the classroom. In addition, here we have chosen to focus on only a small number of social characteristics that could influence accent preference in the present study. Future research should examine which individual and social variables influence the relative value assigned to various sources of language input in the language teaching context and beyond.
Another feature of this study worth scrutinizing is the use of human-shaped iconographic images to represent the teacher and students. These images were selected with the intention of limiting the complicating influence of social information that individuals extract from talkers’ visual presentations. It is well-established that the auditory and visual presentations of talkers are inextricably linked such that listeners extract rich information about the (presumed) social identities of talkers from the speech signal alone (Lippi-Green, Reference Lippi-Green1997), and adult language learners recruit race-based linguistic expectations to inform their interpretation of phonological variation (Ryken et al., Reference Ryken, Tupper and Weatherhead2024). Similarly, responses to speech are modulated by the perceived racial identity of the speaker gleaned from the speaker’s visual presentation (Babel & Russell, Reference Babel and Russell2015; Kang & Rubin, Reference Kang and Rubin2009; Kutlu, Reference Kutlu2020; McGowan, Reference McGowan2015; Rubin, Reference Rubin1992). In this way, in future investigations, we might expect the preference for a teacher’s speech to be influenced by their beliefs about the relationship between a teacher’s (perceived) race and their (perceived) legitimacy as a source of a socially desirable accent.
Finally, the judgments participants make regarding pronunciation quality in a two-alternative forced-choice accent preference task like the one used here may rely on representations which are distinct from those that a learner eventually acquires and uses over the course of learning a new language. While highly controlled experiments such as the ones reported here provide one perspective on the impact of social bias on the adult learning of the pronunciation in a new language, an enhanced understanding of the social and perceptual mechanisms that underlie accent learning will require that we move beyond the two-alternative forced-choice accent preference task and beyond the simulated language classroom.
5. Conclusion
The two experiments reported here provide new empirical evidence that individuals are sensitive to social characteristics of talkers when developing pronunciation preferences in a new language. Specifically, participants exhibited a preference for the pronunciation patterns of a talker they believed to be a language teacher over those of a talker they believed to be a language learner. In addition, participants were sensitive to elaborations on the teacher’s language background, teaching experience, and teaching efficacy, such that the preference for the teacher over the student was greater when the teacher was ascribed ‘favorable’ vs. ‘unfavorable’ characteristics. These findings support the argument that the social and linguistic aspects of language learning are inseparable (Block, Reference Block2003; Young, Reference Young1999) by demonstrating that language learners’ internalized social biases influence their pronunciation preferences. Shedding light on these social biases and their impacts on learners can help to address the many overt – and covert – ways in which linguistic discrimination is perpetuated in language teaching and learning contexts. Future research should continue to address gaps in our understanding of how learners navigate speech variability and how language learning is impacted by linguistic bias.
Acknowledgements
We are grateful for the contributions of our colleagues Alayo Tripp, Joanne Moffatt and the members of the Speech Acquisition Lab at the University of Utah, in addition to the valuable feedback provided by Graeme Porte and an anonymous reviewer, the Cognitive Language Research Aficionados Research Group (CLARG) at the University of Utah, the L2 Speech Learning Research Group at the University of Western Ontario, as well as by audiences at a TESOL Special Interest Speech, Pronunciation, and Listening (SPLIS) webinar (2022) and Pronunciation in Second Language Learning and Teaching (PSLLT) conference (2023).
Funding statement
The research reported in the article was made possible in part by a grant from the Spencer Foundation (#S202500152). The views expressed are those of the authors and do not necessarily reflect the views of the Spencer Foundation.
Shannon Barrios is an Associate Professor in the Department of Linguistics at the University of Utah and co-director of the Speech Acquisition Lab. In her work, she uses techniques from psycholinguistics to study the adult acquisition of the phonology of a new language. She is especially interested in the learning of new phonological contrasts and phonological processes and the factors that influence this development, including prior language experience, exposure to written input, and learners’ beliefs about accents.
Rachel Hayes-Harb is a Professor of Linguistics and Associate Dean of the Honors College at the University of Utah (Salt Lake City, Utah, United States). Her scholarship focuses on a variety of phenomena related to the acquisition of the sound systems of new languages by adult learners, specifically the development of sound inventories and the sound structure of words. Her research typically involves experimental investigations of the perception of new sounds and words, and the influence of various types of linguistic experience on adults’ linguistic development. She co-directs the Speech Acquisition LabFootnote 2.







 Open access

