





Introduction
Lichens are complex symbiotic systems, primarily composed of a mycobiont (a heterotrophic fungus) and a photobiont, usually a green microalga (phycobiont) and/or a cyanobacterium (Honegger Reference Honegger1998, Reference Honegger and Hock2012; Lumbsch Reference Lumbsch, Russo and Wolf2025). Together they form a composite organism capable of colonizing diverse habitats, including extreme environments on Earth (Kranner et al. Reference Kranner, Beckett, Hochman and Nash2008; Grube Reference Grube, Hsueh and Blackwell2024). Although c. 50 algal genera have been recorded as lichen phycobionts (Muggia et al. Reference Muggia, Nelsen, Kirika, Barreno, Beck, Lindgren, Lumbsch and Leavitt2020; Veselá et al. Reference Veselá, Malavasi and Škaloud2024), our understanding of their taxonomy and diversity remains limited, especially when compared to the more than 1000 described genera of lichen-forming fungi (Lücking et al. Reference Lücking, Hodkinson and Leavitt2017). Most green phycobionts belong to the class Trebouxiophyceae, with Trebouxia, Asterochloris and Myrmecia among the most frequently reported genera (Škaloud & Peksa Reference Škaloud and Peksa2010). Among them, Trebouxia stands out as the most widespread and frequently occurring phycobiont genus, forming associations with a broad range of lichenized fungi (Honegger Reference Honegger and Deising2009; Leavitt et al. Reference Leavitt, Kraichak, Nelsen, Altermann, Divakar, Alors, Esslinger, Crespo and Lumbsch2015; Kosecka et al. Reference Kosecka, Kukwa, Jabłońska, Flakus, Rodriguez-Flakus, Ptach and Guzow-Krzemińska2022). While molecular analyses have revealed dozens of species-level lineages and OTUs (Operational Taxonomic Unit), only a fraction (34 species) have been formally described based on an integrative taxonomic framework combining morphology and molecular data (Friedl Reference Friedl1989; Muggia et al. Reference Muggia, Nelsen, Kirika, Barreno, Beck, Lindgren, Lumbsch and Leavitt2020; Barreno et al. Reference Barreno, Muggia, Chiva, Molins, Bordenave, García-Breijo and Moya2022; Bordenave et al. Reference Bordenave, Muggia, Chiva, Leavitt, Carrasco and Barreno2022; Garrido-Benavent et al. Reference Garrido-Benavent, Chiva, Bordenave, Molins and Barreno2022a; Chiva et al. Reference Chiva, Bordenave, Assunção, Craveiro, Calado, Barreno and Santos2025; Guiry & Guiry Reference Guiry and Guiry2025; Pazos et al. Reference Pazos, Moya, Garrido-Benavent, Bordenave, Gazquez and Chiva2025).
Recent phylogenetic reconstructions have consistently supported the existence of four main clades (A, C, I and S) within Trebouxia (Muggia et al. Reference Muggia, Nelsen, Kirika, Barreno, Beck, Lindgren, Lumbsch and Leavitt2020), with a fifth clade (D) later proposed based on multilocus data (Xu et al. Reference Xu, De Boer, Olafsdottir, Omarsdottir and Heidmarsson2020), although its members remain morphologically undescribed. Despite the challenges associated with the formal description of lichen symbiotic microalgae, an often arduous and complex task, this process remains essential for advancing lichenology by either achieving a deeper understanding of fungal-algal interactions in lichens or facilitating scientific communication (Chiva & Moya Reference Chiva, Moya and Blanco2025).
One of the main obstacles in describing Trebouxia species is the requirement to isolate these algae in pure (axenic) culture (Muggia et al. Reference Muggia, Leavitt and Barreno2018). Accurate species delimitation in Trebouxia depends on such isolation, since morphological traits observed in situ may be altered by the symbiotic state (Bordenave et al. Reference Bordenave, Muggia, Chiva, Leavitt, Carrasco and Barreno2022). Formal identification therefore relies on a combination of ultrastructural, physiological and molecular data (Casano et al. Reference Casano, del Campo, García‐Breijo, Reig‐Armiñana, Gasulla, Del Hoyo, Guéra and Barreno2011; del Hoyo et al. Reference del Hoyo, Álvarez, del Campo, Gasulla, Barreno and Casano2011; Muggia et al. Reference Muggia, Leavitt and Barreno2018; Molins et al. Reference Molins, Chiva, Calatayud, Marco, García-Breijo, Reig-Armiñana, Carrasco and Moya2020; Barreno et al. Reference Barreno, Muggia, Chiva, Molins, Bordenave, García-Breijo and Moya2022). Cultured strains also provide essential material for phylogenomic analyses by avoiding contamination from co-occurring algae (Divakar & Crespo Reference Divakar, Crespo, Upreti, Divakar, Bisht and Singh2015), and they form the foundation for both taxonomic studies and potential biotechnological applications. Among the key tools for species characterization is transmission electron microscopy (TEM), which enables the observation of stable intracellular features such as chloroplast morphology and pyrenoid architecture under controlled and reproducible conditions (Friedl Reference Friedl1989; Muggia et al. Reference Muggia, Nelsen, Kirika, Barreno, Beck, Lindgren, Lumbsch and Leavitt2020; Bordenave et al. Reference Bordenave, Muggia, Chiva, Leavitt, Carrasco and Barreno2022).
Within the phylogenetic framework proposed by Muggia et al. (Reference Muggia, Nelsen, Kirika, Barreno, Beck, Lindgren, Lumbsch and Leavitt2020), an undescribed species-level lineage, designated as Trebouxia sp. A48, was detected in association with Xanthoria species. This lineage was originally identified by Nyati et al. (Reference Nyati, Scherrer, Werth and Honegger2014) as Trebouxia decolorans, based on specimens collected from thalli inhabiting coastal habitats in Australia, Greece, Brittany, and the Canary Islands. More recently, this lineage has been reported across several lowland coastal regions of the western Mediterranean, including southern Spain, France, Italy and northern Morocco, where it exhibits a clear ecological preference for warm, humid, and thermally stable environments (Chiva et al. Reference Chiva, Pazos, Montero-Pau, Moya, Garrido-Benavent, Barreno and Muggia2026). Furthermore, a recent genomic and transcriptomic analysis of Trebouxia sp. A48 has been conducted by Tagirdzhanova et al. (Reference Tagirdzhanova, Raistrick and Talbot2026), providing novel insights into its evolutionary adaptations and ecological specialization. So far, X. parietina (L.) Th. Fr. has been known to partner with a range of Trebouxia species, primarily Trebouxia decolorans, T. solaris, T. lynniae, T. maresiae and the Trebouxia sp. A13 complex (which includes T. arboricola, T. aggregata and T. crenulata) (Beck et al. Reference Beck, Friedl and Rambold1998; Beck & Mayr Reference Beck and Mayr2012; Nyati et al. Reference Nyati, Werth and Honegger2013, Reference Nyati, Scherrer, Werth and Honegger2014; Dal Grande et al. Reference Dal Grande, Alors, Divakar, Bálint, Crespo and Schmitt2014; Voytsekhovich & Beck Reference Voytsekhovich and Beck2016; Wyczanska et al. Reference Wyczanska, Wacker, Dyer and Werth2023; Chiva et al. Reference Chiva, Pazos, Montero-Pau, Moya, Garrido-Benavent, Barreno and Muggia2026). Although primarily associated with X. parietina, Trebouxia sp. A48 has also been recognized in association with other lichens from the family Teloschistaceae, such as from Seirophora villosa (Ach.) Frödén (Garrido-Benavent et al. Reference Garrido-Benavent, Molins and Barreno2022b), Xanthoria aureola s. lat. and X. monofoliosa S. Y. Kondr. & Kärnefelt (Chiva et al. Reference Chiva, Pazos, Montero-Pau, Moya, Garrido-Benavent, Barreno and Muggia2026), and the family Lecanoraceae, in the lichen Polyozosia (= Myriolecis) reuteri (Schaer.) S. Y. Kondr. et al. (Garrido-Benavent et al. Reference Garrido-Benavent, Mora-Rodríguez and Chiva2021).
Despite these insights, no formal taxonomic description has yet been published. Here, we describe Trebouxia tabarcae sp. nov., a new phycobiont lineage isolated from thalli of Xanthoria parietina collected on Tabarca Island (Alicante, Spain). Using an integrative taxonomic approach based on axenic culture, ultrastructural microscopy and nrITS phylogenetic data, we provide morphological, molecular and ecological evidence supporting the recognition of this lineage as a distinct species. This work contributes to the ongoing effort to resolve cryptic diversity within Trebouxia and advances our understanding of phycobiont diversity and association patterns in Mediterranean lichen communities.
Materials and Methods
Microalgal isolation and establishment of axenic cultures
A thallus of Xanthoria parietina (herbarium code VAL_Lich 34432) was collected in 2022 from the western Mediterranean island of Tabarca (Alicante, Spain; 38.163579, −0.476251, 4 m a.s.l.). The specimen was dried for 1 d and stored at −20 °C until processing. Thallus lobules were examined under a stereomicroscope to remove surface contamination (e.g. sand and epiphytic algae). Selected lichen thallus fragments were rehydrated and acclimated in a growth chamber 2 d before the procedure. Microalgae were isolated using the method described in Chiva et al. (Reference Chiva, Dumitru, Bordenave and Barreno2021), where tiny clumps of the algal layer were captured using a 0.3 mm sterile needle and inoculated directly into Bold’s Basal Medium (BBM; Bischoff & Bold Reference Bischoff and Bold1963). Once algal colonies grew to a sufficient biomass (c. 1 mm wide), they were individually sub-cultivated on liquid BBM (named as unialgal culture). A subsample of this liquid culture was taken for DNA extraction and genetic identification. A volume of 50 μl of this unialgal culture was plated over solid BBM for 21 d (Muggia et al. Reference Muggia, Leavitt and Barreno2018) and the colonies grown were used for morphological analyses. The unialgal culture was stored as both a living strain and cryostocks at the Symbiotic Algal Collection of the Universitat de València (ASUV, with code ASUV 162) and at the Culture Collection of Algae of Charles University (CAUP, with code CAUP H 1020). Cultures were kept in a growth chamber at 20 °C with a 12 h/12 h light/dark cycle (photosynthetic photon flux density (PPFD) of 25 μmol m−2 s−1). These cultures were used for conducting phylogenetic, ultrastructural and morphological analyses.
A second strain of Trebouxia sp. A48 was isolated from a thallus of Ramalina rosacea (A. Massal.) Hepp collected in 2022 in San José, within the Natural Park of Cabo de Gata (Almería, Spain) (36.775343, −2.074440, 70 m a.s.l.), using the method described by Gasulla et al. (Reference Gasulla, Guéra and Barreno2010). After 45 days of growth, 10 colonies were selected under a stereomicroscope and transferred, using sterile toothpicks, to Petri dishes containing Trebouxia medium (Ahmadjian Reference Ahmadjian1967), prepared with 1.5% agar 3N-BBM supplemented with 2% (w/v) glucose and 1% (w/v) casein hydrolysate. A colony was selected as the reference culture (ASUV 163) and maintained under the following controlled conditions: 15 °C, a 14 h/10 h light/dark cycle, with a PPFD of 25 μmol m⁻² s⁻¹. This strain was used to examine its growth behaviour under different conditions of light and temperature.
DNA extraction, PCR amplification and Sanger sequencing
Total genomic DNA of the unialgal liquid cultures ASUV 162 and 163 were isolated and purified using the DNeasy TM Plant Mini Kit (Qiagen, Hilden, Germany) following the manufacturer’s instructions. For strain ASUV 162 (the type strain; see below), three algal loci were amplified using algal-specific primers published by Muggia et al. (Reference Muggia, Nelsen, Kirika, Barreno, Beck, Lindgren, Lumbsch and Leavitt2020). These molecular markers were the nuclear ribosomal internal transcribed spacer (nrITS), the ribulose-1,5-bisphosphate carboxylase/oxygenase large subunit (rbcL), and the cytochrome c oxidase (cox2). The algal nrITS was amplified with the primers ITS1T (GGAAGGATCATTGAATCTATCGT) and ITS4T (GGTTCGCTCGCCGCTACTA) (Kroken & Taylor Reference Kroken and Taylor2000); the plastid rbcL with primers rbcL151f (GAMACTGATATTCTTCTT GCAGC) and rbcL986R (GCAGCTAATTCAGGACTCCA) (Nelsen et al. Reference Nelsen, Rivas Plata, Andrew, Lücking and Lumbsch2011); and the mitochondrial cox2 was amplified with COXIIf2 (TTAACGCCTAACGAGGGAAC) and COXIIr (ATACGAAATCCCGTTCCTGA) (Lindgren et al. Reference Lindgren, Velmala, Högnabba, Goward, Holien and Myllys2014). PCR reactions and Sanger sequencing were performed as described in Molins et al. (Reference Molins, Moya, García-Breijo, Reig-Armiñana and Barreno2018a). In the case of strain ASUV 163, only the algal nrITS region was amplified to corroborate the species identity. The PCR products were visualized on 1% agarose gels and purified using the Gel Band Purification Kit (GE Healthcare Life Science, Logan, UT, USA). Amplicons showing clear bands on gels were purified using ExoCleanUp FAST (VWR®) enzymatic treatment. Sanger sequencing of complementary strands of the cleaned PCR products was carried out by StabVida (Portugal), with the same primers used for amplification.
Sequence datasets, alignment and phylogenetic analyses
The Trebouxia Research Portal-based clade A phylogeny
Muggia et al. (Reference Muggia, Nelsen, Kirika, Barreno, Beck, Lindgren, Lumbsch and Leavitt2020) circumscribed Trebouxia sp. A48 in clade A (arboricola/gigantea group). To further examine its phylogenetic placement, a sequence dataset was built to include the most up-to-date assemblage of members in this clade following recommendations of the Trebouxia Research Portal (https://trebouxia.net/; last accessed in July 2025). Since most representative members of Trebouxia clade A lacked rbcL and cox2 data, a single locus, nrITS dataset was constructed. Several Trebouxia clade C specimens were included as outgroup to root inferred phylogenies. Specimens and GenBank Accession numbers are available in Supplementary Material Table S1 (available online). The alignment was carried out in Geneious Prime v. 2025.0.2 (Biomatters) using MAFFT v. 7.490 (Katoh et al. Reference Katoh, Misawa, Kuma and Miyata2002; Katoh & Standley Reference Katoh and Standley2013) and the following parameters: the FFT-NS-I ×1000 algorithm, the 200PAM/k = 2 scoring matrix, a gap open penalty of 1.5 and an offset value of 0.123. A manual editing of the resulting nrITS alignment consisted of trimming alignment ends coding for 18S and 26S ribosomal subunits, as well as replacing gaps at the ends of shorter sequences with ‘N’, which represents any base. Partitions (i.e. nrITS1 and nrITS2 spacers, and the 5.8S subunit) were adequately annotated. A maximum likelihood (ML) phylogenetic tree was then inferred with RAxML v. 8.2.12 on the CIPRES Science Gateway (Miller et al. Reference Miller, Pfeiffer and Schwartz2010; Stamatakis Reference Stamatakis2014) using the GTRGAMMA nucleotide substitution model for the two data partitions (nrITS1 + 2, and 5.8S). Bootstrapping consisted of a fixed number of iterations (1000). Additionally, a phylogenetic reconstruction using the same dataset was conducted with MrBayes v. 3.2.7 (Ronquist et al. Reference Ronquist, Teslenko, van der Mark, Ayres, Darling, Höhna, Larget, Liu, Suchard and Huelsenbeck2012) which operates under a Bayesian inference context. The following optimal partitioned evolutionary models were selected according to a preliminary analysis with PartitionFinder v. 1.1.1 (Lanfear et al. Reference Lanfear, Calcott, Ho and Guindon2012): GTR + Γ (nrITS1 + 2) and K80 + I (5.8S). The analysis considered two parallel, simultaneous four-chain runs executed over 5 × 10⁷ generations, starting with a random tree and sampling after every 500th step; the first 25% of data was discarded as burn-in, and the 50% majority-rule consensus tree and corresponding posterior probabilities (PP) were calculated from the remaining trees. Chain convergence was assessed by ensuring that values of the average standard deviation of split frequencies (ASDSF) dropped below 0.005, and values of the potential scale reduction factor (PSRF) approached 1.00. Tree nodes with bootstrap support (BS) values ≥ 70% and Bayesian PP ≥ 0.95 were regarded as significantly supported. Adobe Illustrator 2023 was used to manually edit the tree.
The BLAST-based expanded nrITS phylogeny
To better circumscribe Trebouxia sp. A48 phylogenetically, and to gain a deeper knowledge of its intraspecific genetic structure, geographical distribution and ecology (including the taxonomic breadth of associated mycobionts), a second nrITS sequence dataset was built. To this end, BLASTn (Altschul et al. Reference Altschul, Gish, Miller, Myers and Lipman1990) searches against the GenBank database (https://www.ncbi.nlm.nih.gov/genbank/; last accessed in July 2025) were conducted using, as queries, a representative nrITS sequence of Trebouxia sp. A48 (GenBank Accession number AJ969587; Trebouxia Research Portal; Muggia et al. Reference Muggia, Nelsen, Kirika, Barreno, Beck, Lindgren, Lumbsch and Leavitt2020) and the nrITS type sequence selected in the present study (PX412012). A total of 49 hits with up to 97.53% sequence similarity (representing up to 16 sequence differences) were retrieved and added to the dataset and their associated metadata were recorded. The sequence dataset also included several closely related lineages found in the previously described phylogenetic analyses, such as the already described T. crenulata (A13), T. decolorans (A33), T. maresiae (A46) and T. solaris (A35), as well as some still undescribed Trebouxia, including the recently reported lineages A71 to A74 (Gasulla et al. Reference Gasulla, Casano and Pérez-Ortega2025). Sequences used in this analysis and their associated specimen data are provided in Supplementary Material Table S1. ML and Bayesian analyses were carried out as described above, but the MrBayes analysis used the nucleotide substitution models SYM + Γ for the nrITS1 + 2 partition and K80 for the 5.8S.
Ultrastructural and morphological analyses: light, transmission electron and confocal laser scanning microscopy
For all descriptive images obtained from the isolated strain ASUV 162 (Trebouxia sp. A48 phycobionts in symbiosis with Xanthoria parietina), cells were grown on solid BBM for 21 days of cultivation at 17 °C under 15 μmol m−² s−¹ and a 12 h/12 h light/dark photoperiod, in accordance with the standards proposed by Muggia et al. (Reference Muggia, Leavitt and Barreno2018) for comparative studies of Trebouxia strains. Light microscopy (LM) observations were performed on the isolated algal strain ASUV 162 with a DM 2500 microscope (Leica, Wetzlar, Germany). Images were acquired with a Leica DFC 490 digital camera, and morphological features such as cell shape, size and chloroplast structure were analysed using ImageJ v. 1.53.
The ultrastructure of the microalgae in symbiosis was characterized by transmission electron microscopy (TEM) from selected thalli (specimen of Xanthoria parietina VAL_Lich 34432 collected in Tabarca) and the isolated strain ASUV 162. The cells were fixed and dehydrated as described in Molins et al. (Reference Molins, Moya, García‐Breijo, Reig‐Armiñana and Barreno2018b). In brief, samples were fixed in 2% Karnovsky fixative for 12 h at 4 °C, washed three times for 15 min with 0.01 M PBS (pH 7.4), and postfixed with 2% OsO4 in 0.01 M PBS (pH 7.4) for 2 h at room temperature. After washing in 0.01 M PBS (pH 7.4), the samples were dehydrated at room temperature in a graded series of ethanol starting at 50% and increasing to 70%, 95% and 100% for no less than 20–30 min at each step. The samples were embedded in LR white resin according to the manufacturer’s instructions. Ultrathin sections (80 nm) were cut, mounted and stained with 10% uranyl acetate and 0.1% lead citrate using the SynapTek Grid-Stick Kit, as described in Moya et al. (Reference Moya, Chiva, Molins, Jadrná, Skaloud, Peksa and Barreno2018). The ultrathin sections were observed with a JEOL JEM-1010 (80 kV) electron microscope equipped with a MegaView III digital camera and AnalySIS image acquisition software (SCSIE, Universitat de València).
Confocal laser scanning (CLSM) was performed to study chloroplast morphology in the algal strain ASUV 162 as described in Gazquez et al. (Reference Gazquez, Bordenave, Montero-Pau, Pérez-Rodrigo, Marco, Martínez-Alberola, Barreno and Carrasco2024). Briefly, 15 μl of cell suspension or a cross-section of a fully hydrated thallus was placed on a plate with a thin layer of 1% agar in sterile water, air dried and placed upside down over a 35 mm imaging dish suitable for inverted microscopy (Ibidi, Fitchburg, WI, USA). An Olympus FluoView FV1000 laser scanning confocal microscope (Olympus, Tokyo, Japan) was used with a 405 nm excitation laser. Fluorescence emitted between 650–750 nm was collected to observe chlorophyll autofluorescence, thus recovering the chloroplast layers. Images were processed with the Max Projection and Volume Viewer tools from ImageJ (v. 1.53).
Light and temperature treatments
Actively growing cells of the culture ASUV 163 isolated from a thallus of Ramalina rosacea were collected, and c. 1 mg of biomass was resuspended in 50 μl distilled water and inoculated onto 2 × 2 cm nylon membranes (Santa Cruz Biotechnology Inc., CA, USA) placed on Petri dishes containing 3N-BBM medium with the same supplements as outlined above. Each dish contained five colonies. Cultures were incubated under a 14 h/10 h light/dark cycle at combinations of six temperatures (10, 15, 20, 22.5, 25 and 27.5 °C) and six irradiance levels (15, 30, 45, 60, 100 and 150 μmol m−² s−¹ PPFD). Each condition was replicated five times. After 21 days of incubation, biomass and chlorophyll a fluorescence were assessed. Algal biomass was estimated by weighing each colony together with its supporting nylon membrane. Net biomass was calculated by subtracting the mean weight of control membranes without colonies. This reference value was determined by weighing 20 nylon membranes (2 × 2 cm) exposed to agar-solidified culture medium under identical conditions, and calculating the mean. Prior to fluorescence measurements, cultures were dark acclimated for 15 min. The maximum photochemical efficiency of PSII was measured using a modulated pulse fluorometer (PEA, Plant Efficiency Analyzer; Hansatech Instruments, UK). The F v/F m ratio, calculated as (F m – F o)/F m, where F o represents the minimum fluorescence and F m the maximum fluorescence, was recorded following the application of a saturating light pulse (~3000 μmol m−² s−¹) lasting 1 s (Schreiber Reference Schreiber1986; Calatayud et al. Reference Calatayud, Sanz, Calvo, Barreno and del Valle-Tascon1996).
Results
Alignment statistics and phylogenetic analyses
The Trebouxia Research Portal-based clade A nrITS dataset included 74 sequences, of which 69 corresponded to members of Trebouxia clade A (A01 to A75) and the remaining five to specimens representing Trebouxia clade C (outgroup). The total alignment length was 836 bp and contained 420 variable and 306 parsimony-informative sites. The ML analysis in RAxML estimated a topology with a final log likelihood of −8765.8204, and the MrBayes analysis reached an ASDSF value of 0.005 after 6.06 × 10⁶ generations, and Estimated Sample Sizes (EESs) were well above 200 for all parameters. Since the ML and MrBayes topologies showed no supported conflicts, the topology inferred with RAxML is presented in Fig. 1. It revealed the two specimens of Trebouxia sp. A48, including the one selected here as type (nrITS GenBank Accession PX412012) and the sequence selected by Muggia et al. (Reference Muggia, Nelsen, Kirika, Barreno, Beck, Lindgren, Lumbsch and Leavitt2020), formed a highly supported clade (BS = 100%, PP = 1). The closest already described Trebouxia species were T. decolorans (A33) and T. maresiae (A46), but no clear sister relationships were supported due to low bootstrap values. These three species, together with T. solaris, T. crenulata and 13 undescribed but already recognized species-level phylogenetic lineages, formed a well-supported subclade (BS = 91, PP = 1) within Trebouxia clade A.
Phylogram showing the placement of the new species in Trebouxia clade A. The phylogeny was built with RAxML based on a partitioned ITS region sequence dataset (nrITS1 + 2, 5.8S). Green- and orange-filled boxes on the left of each tip indicate the species code of each Trebouxia species following the Trebouxia Research Portal (last accessed in July 2025). The name of the species, if any, the GenBank Accession number and, if applicable, a black circle indicating type material are provided. Bootstrap support values (BS) and posterior probabilities (PP, MrBayes analysis) are represented on branches leading to nodes (BS/PP). Branches in bold had a significant statistical support (BS = 70%, PP ≥ 0.95). In colour online.

Figure 1. Long description
A phylogenetic tree with a scale bar of 0.06 at the bottom-left. The tree branches from left to right, with nodes labeled with B S forward slash P P values. Bold branches indicate B S equal to or greater than 70 percent and P P equal to or greater than 0.95.
Terminal tips are organized vertically. Most tips feature an orange oval with an ‘A’ prefix code followed by the species name and GenBank accession. Key highlights from top to bottom include:
* A 0 6 Trebouxia incrustata O K 5 7 7 8 5 1 highlighted in teal.
* A 6 0 Trebouxia valentina P P 8 0 9 6 8 3 with a black circle T symbol.
* A 1 5 Trebouxia gigantea A J 2 4 9 5 7 7 with a black circle T symbol.
* A 2 3 Trebouxia showmanii A F 2 4 2 4 7 0 with a black circle T symbol.
* A 1 0 Trebouxia vagua K T 8 1 9 9 4 5 with a black circle T symbol.
* A 1 1 Trebouxia asymmetrica A J 2 4 9 5 6 5 with a black circle T symbol.
* A 0 1 Trebouxia cretacea K T 8 1 9 9 1 9 with a black circle T symbol.
* A 3 3 Trebouxia decolorans F J 6 2 6 7 2 8 with a black circle T symbol.
* A 4 8 Trebouxia tabarcae P X 4 1 2 0 1 2 highlighted in a dark grey box with a black circle T symbol.
* A 3 5 Trebouxia solaris K T 8 1 9 9 1 8 with a black circle T symbol.
* A 1 3 Trebouxia crenulata M W 4 7 1 0 2 9 with a black circle T symbol.
* A 3 9 Trebouxia lynniae K U 7 1 6 0 5 1 with a black circle T symbol.
* A 0 3 Trebouxia jamesii F J 6 2 6 7 3 3 with a black circle T symbol.
At the bottom, a separate cluster features green ovals with ‘C’ prefix codes, including C 0 5 Trebouxia galapagensis, C 0 7 Trebouxia higginsiae, and C 0 1 Trebouxia crespoana, the latter marked with a black circle T symbol.
The BLAST-based expanded nrITS dataset included 88 sequences, 86 of which corresponded to members of Trebouxia clade A and two to Trebouxia clade C (outgroup). The total alignment length was 732 bp and contained 263 variable and 195 parsimony-informative sites. The ML analysis in RAxML estimated a topology with a final log likelihood of −3645.9708, and the MrBayes analysis reached an ASDSF value of 0.005 after 5.95 × 10⁶ generations and retrieved EESs values above 200 for all parameters. Again, because no conflicts existed between ML and MrBayes topologies, the ML topology is presented in Fig. 2. Sixty-eight specimens represented the phylogenetic concept of Trebouxia sp. A48, forming a well-supported clade (BS = 90%, PP = 1). The reference sequence of this species in the Trebouxia Research Portal (GenBank Accession number AJ969587) differed in its nrITS sequence from the type selected in the present study (PX412012). Specifically, the two sequences varied by six nucleotide substitutions. As a result, these individuals were placed in different subclades within Trebouxia sp. A48. Most individuals in this clade originated from Mediterranean Basin samples (31), followed by Atlantic and temperate Europe (19), western North America (California; 12) and the Canary Islands (2) in the Northern Hemisphere, and a small number of samples from South Africa and Australia in the Southern Hemisphere. The nrITS sequence of the new species isolated from Almería (ASUV 163, GenBank Accession PX412009) that was subjected to different light and temperature treatments differed from that of the type specimen ASUV 162 (PX412012) by only seven nucleotide substitutions and is identical to the reference sequence of this species in the Trebouxia Research Portal (AJ969587); however, all sequences appeared grouped in the same supported clade. Accordingly, the nrITS sequence obtained from the type strain ASUV 162 of Trebouxia tabarcae (PX412012) is designated here as the new reference sequence for this species (A48). The family of mycobionts Teloschistaceae was the most frequently associated with Trebouxia sp. A48, with Xanthoria being the most predominant genus. Trebouxia sp. A48 was revealed to be sister to a Trebouxia with GenBank Accession number KT819929, with BS and PP values of 98% and 1, respectively. This nrITS sequence was obtained from a thallus of the lichen Candelariella medians from Ukraine (Europe). Despite the number of nucleotide differences from the two representative sequences of Trebouxia sp. A48 being low (up to nine bp changes), we refrain from including this sequence within the concept of the newly described species until more data is gathered.
A, phylogram showing the evolutionary relationships and intraspecific genetic diversity of the new species in a subclade of Trebouxia clade A. B, pie chart showing summaries of the geographical origin of lichen samples hosting the new microalgal species. C, pie chart displaying the main families to which lichenized fungi belong. The phylogeny was built with RAxML based on a partitioned ITS region sequence dataset (nrITS1 + 2, 5.8S). Green- and orange-filled boxes on the left of each tip indicate the species code of each Trebouxia species following the Trebouxia Research Portal (last accessed in July 2025). The name of the species, if any, the GenBank Accession number and, if applicable, a black circle indicating type material are provided. The clade including sequences of the new species provides the identity of associated lichenized fungi and a three-letter code indicating the geographical origin (country). Bootstrap support values (BS) and Posterior Probabilities (PP, MrBayes analysis) are represented on branches leading to nodes (BS/PP). Branches in bold had a significant statistical support (BS ≥ 70 %, PP ≥ 0.95). In colour online.

Figure 2. Long description
Panel A is a phylogram based on I T S region sequences. The tree branches from left to right, with bold lines indicating significant statistical support. A large shaded box highlights a subclade labeled Trebouxia tabarcae. Tips include GenBank accession numbers, host lichen species, and country codes such as U S A, G B R, E S P, and I T A. Species codes like A 48, A 33, and C 07 are highlighted in orange, green, or teal boxes. Black circles indicate type material. A small overview diagram at the bottom left shows the position of Clade A and Clade C.
Panel B is a pie chart of geographic origins. The largest segment is the Mediterranean Basin (31), followed by Atlantic and temperate Europe (19), Western North America (12), Canary Islands (2), South Africa (2), and Australia (1).
Panel C is a pie chart of mycobiont families. Teloschistaceae is the dominant family (51), followed by Ramalinaceae (14), Lecanoraceae (2), and Physciaceae (1).
Four photographs show lichen specimens: Xanthoria parietina (yellow, foliose), Ramalina lacera (pale green, fruticose), Seirophora villosa (grey-white, branched), and Myriolecis reuteri (white, crustose).
Taxonomy
Trebouxia tabarcae Moya, Chiva & Garrido-Benavent sp. nov.
Differs from other Trebouxia species included in clade A by the type of pyrenoid and chloroplast. Regarding the type of pyrenoid, T. tabarcae, with a crenulata-type pyrenoid, differs from Trebouxia aggregata, T. arboricola, T. asymmetrica, T. cretacea, T. incrustata, T. gigantea, T. showmanii and T. valentina (gigantea-type), from T. decolorans (decolorans-type), and from T. jamesii and T. lynniae (impressa-type), with the latter often showing multiple pyrenoids. Additionally, T. tabarcae, with a crenulate-type chloroplast, differs from T. asymmetrica, T. gigantea, T. incrustata, T. jamesii, T. lynniae and T. valentina, which possess a shallowly lobed-type chloroplast, as well as from T. decolorans, characterized by a deeply lobed-type chloroplast. Regarding chloroplast lobe morphology, T. tabarcae, characterized by short and simple terminations, differs from species with elongated lobes (T. decolorans, T. asymmetrica, T. gigantea, T. incrustata, T. jamesii and T. lynniae), those with slightly branched lobes (T. aggregata, T. arboricola), branched lobes (T. showmanii, T. crenulata, T. maresiae), and flat terminations (T. valentina). See Table 1 below for more details. Finally, T. tabarcae sp. nov. clearly diverges from other Trebouxia species in clade A by the nrITS, rbcL and cox2 molecular markers.
A comparative table of the morphological and ultrastructural traits of Trebouxia species in clade A. Species nomenclature follows AlgaeBase (Guiry & Guiry Reference Guiry and Guiry2025). The new species is in bold.

Table 1. Long description
The table consists of four columns: Trebouxia species, Shape and size of mature cells, Chloroplast type, and Pyrenoid type.
* Trebouxia aggregata: Spherical cells 8 to 24 micrometers; Crenulate-type chloroplast with slightly branched lobes; Gigantea-type single pyrenoid.
* T. arboricola: Spherical cells 13 to 15 micrometers; Crenulate-type chloroplast with slightly branched lobes; Gigantea-type single pyrenoid.
* T. asymmetrica: Ovoid or ellipsoidal cells up to 19 by 14 micrometers; Shallowly lobed-type chloroplast with flat terminations; Gigantea-type multiple pyrenoids.
* T. crenulata: Spherical cells 5 to 24 micrometers; Crenulate-type chloroplast with tree-like lobes; Crenulata-type single pyrenoid.
* T. cretacea: Spherical, ovoid, or ellipsoid cells 15 to 30 micrometers; Crenulate-type chloroplast with small unbranched lobes; Gigantea-type multiple pyrenoids.
* T. decolorans: Spherical cells 6 to 30 micrometers; Deeply lobed-type chloroplast; Decolorans-type multiple pyrenoids.
* T. gigantea: Spherical cells 14 to 27 micrometers; Shallowly lobed-type chloroplast with elongated lobes; Gigantea-type single pyrenoid.
* T. incrustata: Spherical cells 8 to 22 micrometers; Shallowly lobed-type chloroplast with elongated lobes; Gigantea-type single pyrenoid.
* T. jamesii: Spherical cells 10 to 20 micrometers; Shallowly lobed-type chloroplast with elongated lobes; Impressa-type single or multiple pyrenoids.
* T. lynniae: Spherical cells 7 to 16 micrometers; Shallowly lobed-type chloroplast with elongated lobes; Impressa-type single or multiple pyrenoids.
* T. maresiae: Spherical cells 7 to 15 micrometers; Crenulate-type chloroplast with tree-like lobes; Crenulata-type single pyrenoid or maresiae-type in symbiosis.
* T. showmanii: Spherical to ovoid cells 11 to 22 micrometers; Crenulate-type chloroplast with tree-like lobes; Gigantea-type single pyrenoid.
* T. solaris: Spherical cells 15 to 22 micrometers; Crenulate-type chloroplast; Single pyrenoid with starch grains or satellites.
* T. tabarcae (bolded): Spherical cells 13.8 to 22.5 micrometers; Crenulate-type chloroplast with simple lobes; Crenulata-type single pyrenoid or maresiae-type in symbiosis.
* T. vagua: Spherical, ovoid, or ellipsoid cells 13 to 28 micrometers; Chloroplast with wide lobes in young cells and narrow lobes in old cells; Single pyrenoid with starch grains or satellites.
* T. valentina: Spherical cells 9.3 to 19.2 micrometers; Shallowly lobed-type chloroplast with flat terminations; Gigantea-type single pyrenoid.
aAhmadjian (Reference Ahmadjian1967); bArchibald (Reference Archibald1975); cGärtner (Reference Gärtner1985); dFriedl & Gärtner (Reference Friedl and Gärtner1988); eVoytsekhovich & Beck (Reference Voytsekhovich and Beck2016); fBordenave et al. (Reference Bordenave, Muggia, Chiva, Leavitt, Carrasco and Barreno2022); gGarrido-Benavent et al. (Reference Garrido-Benavent, Chiva, Bordenave, Molins and Barreno2022a); hBarreno et al. (Reference Barreno, Muggia, Chiva, Molins, Bordenave, García-Breijo and Moya2022); iChiva et al. (Reference Chiva, Bordenave, Assunção, Craveiro, Calado, Barreno and Santos2025).
Type: Europe, Spain, Comunitat Valenciana, Alacant, Tabarca Island, latitude 38.163579, longitude −0.476251, 4 m a.s.l., collected in 2022, leg. Isaac Garrido-Benavent (VAL_Lich 34432—holotype!). Holotype includes thallus and resin block with cells of strain ASUV 162, derived from holotype, and fixed for TEM. Strain ASUV 162 deposited at ASUV Symbiotic Algal Collection at the University of Valencia (www.asuvalgae.com) and as strain CAUP H 1020 at the Culture Collection of Algae at Charles University; GenBank Accession numbers, PX412012 (nrITS), PX411277 (rbcL) and PX411278 (cox2).
(Fig. 3)
Ultrastructure and morphology of Trebouxia tabarcae sp. nov. in culture (ASUV 162). Light microscopy (LM; A–C), transmission electron microscopy (TEM; D–H), and laser scanning confocal microscopy (LSCM; I–P) images showing T. tabarcae sp. nov. proliferating in axenic solid cultures. A, LM micrograph of several algal cells showing a pyrenoid (arrow). B, LM of a vegetative cell. C, LM of an autosporangium. D, TEM of a vegetative cell with a pyrenoid (arrow). E, TEM detail of thylakoids within a lobe oriented towards the cell wall. F, TEM detail of the pyrenoid (arrow) with associated satellite pyrenoids. G, TEM of the bilayered cell wall, secretion space, vesicles and external polysaccharidic layer. H, TEM of an autosporangium. I–L, LSCM images of mature vegetative cells: I, transmitted light. J, chlorophyll autofluorescence (maximum intensity projection). K, chlorophyll autofluorescence (cross-section through a pyrenoid). L, merging of I and J. M–O, LSCM images of autosporangia: M, transmitted light. N, chlorophyll autofluorescence (maximum intensity projection). O, merging of M and N. P, LSCM image of an autosporangium with 64 autospores. Cw = cell wall; Chl = chloroplast; Eps = external polysaccharidic; m =mitochondria; n = nucleus; v = vesicles. Scales: A–D, M–O = 2 μm; E & L = 10 μm; F = 20 μm; G & I–K = 5 μm; H & P = 1 μm. In colour online.

Figure 3. Long description
The figure consists of 16 panels labeled A through P.
* Panel A: L M micrograph of green algal cells; an arrow points to a central pyrenoid and ‘n’ indicates the nucleus.
* Panel B: L M of a single vegetative cell with a visible nucleus ‘n’.
* Panel C: L M of an autosporangium.
* Panel D: T E M of a vegetative cell. From the perimeter inward: a thick cell wall surrounds a large chloroplast ‘Chl’ with thylakoid membranes. A nucleus ‘n’ is at the top left, mitochondria ‘m’ at the top right, and vesicles ‘v’ are scattered within.
* Panel E: T E M detail of the cell periphery showing the external polysaccharidic layer ‘Eps’, cell wall ‘Cw’, and thylakoids within a chloroplast lobe near a vesicle ‘v’.
* Panel F: T E M high-magnification of the pyrenoid, indicated by an arrow, showing dense thylakoid integration.
* Panel G: T E M detail of the bilayered cell wall ‘Cw’, secretion space, and internal vesicles ‘v’.
* Panel H: T E M of an autosporangium containing multiple developing daughter cells.
* Panels I through L: L S C M of a mature vegetative cell. I shows transmitted light; J shows green chlorophyll autofluorescence; K is a cross-section through the pyrenoid; L is a merge of I and J.
* Panels M through O: L S C M of an autosporangium. M is transmitted light; N is chlorophyll autofluorescence; O is a merge of M and N.
* Panel P: L S C M showing an autosporangium containing approximately 64 distinct green-fluorescing autospores.
Scale bars vary by panel: 2 micrometers for A through D and M through O; 10 micrometers for E and L; 20 micrometers for F; 5 micrometers for G and I through K; 1 micrometer for H and P.
Vegetative mature cells are spherical, with diam. ranging from 13.8 to 22.5 μm. The cell wall is thick and well defined, appearing as a double layer structure. The secretion space is irregular, with abundant small vesicles in the peri-cellular region of the cytoplasm. An electro-dense layer on the outward surface of the cell wall is observed, possibly extracellular polymeric substances (EPS). One axial crenulate-type, regularly lobed, chloroplast occupying most of the cell volume is observed. Lobes are short and simple, with no branching. In the centre of the plastid, one crenulata-type pyrenoid is observed, characterized by long branched tubules meandering through the pyrenoid matrix with a matrix thicker than the tubules. Small groupings of pyrenoglobuli are observed that do not constitute fully developed pyrenoids. The thylakoids of the chloroplast are organized into bundles of 4–5 filaments, arranged in dense, parallel bands that are oriented towards the cell wall and extend into the lobes, while in the main body they display a less ordered architecture and lack grana-like stacking. No starch granules were observed within the chloroplast at working conditions. The nucleus is spherical and parietally located, within a chloroplast pocket. It exhibits a prominent nucleolus. Small vesicles and mitochondria are distributed throughout the remaining cytoplasm arranged between the chloroplast lobes and the secretion space.
Asexual reproduction with the formation of 4–64 autospores within autosporangia (21.4–27.0 μm) of an irregular shape; autospores are tightly appressed to each other.
No evidence of flagellated stages or sexual reproduction was observed.
Etymology
As part of the species description process, an educational innovation project was conducted involving 133 undergraduate students from various degree programmes at the University of Valencia. The students actively participated in naming the species, completing pre- and post-activity questionnaires, as well as a final survey in which they selected the official species name from a list of proposed options. The activity was structured in the following three phases. 1) Pre-assessment: an anonymous questionnaire designed to evaluate prior knowledge, consisting of six questions on regulation, public participation, scientific publishing, and knowledge of lichens and their biodiversity in the Valencian Community. 2) Intervention: over the following weeks, students received theoretical and practical instruction on systematics, taxonomy, nomenclature and phylogeny as part of the Botany course curriculum. 3) Post-assessment: a questionnaire assessing student perception and the educational value of the experience. This included Likert-scale questions (1–5) on understanding, educational impact, research interest and potential future engagement. Students also voted for the species epithet from five proposed options. The post-activity results demonstrated a clear educational impact. For example, 63% of students rated their improvement in understanding the species description process as a 4 or 5, and 80% reported having gained insights into their professors’ research lines. Among the five proposed names, Trebouxia tabarcae sp. nov. received 37.6% of the 133 votes and was selected as the official name of the new species.
Phylogeny
Trebouxia tabarcae sp. nov. is close to T. decolorans (A33) and T. maresiae (A46) as well as other undescribed species in Trebouxia clade A (Trebouxia sp. A40, A56, A67, A68, A69, A70, A71, A72, A73).
Morphology of Trebouxia tabarcae sp. nov. in cultured state
Trebouxia tabarcae sp. nov. exhibits spherical vegetative cells, ranging from 13.8 to 22.5 μm diam., with a thick, well-defined, bilayered cell wall, an irregular secretion space with small and irregular vesicles in the peri-cellular region and an electron-dense outer layer interpreted as EPS, clearly visible in thin sections (Fig. 3E). The chloroplast is axial, crenulate-type, regularly lobed, and occupies most of the cell volume (Fig. 3D, I–L); it contains a central crenulata-type pyrenoid traversed by branched tubules embedded in a dense matrix (Fig. 3F), along with small groups of pyrenoglobuli. Interestingly, in several LM images, two large pyrenoids can be distinguished (Fig. 3A, arrow), although only one was ever observed in TEM preparations (Fig. 3D). Thylakoids are arranged in bundles of 4–5 filaments forming dense, parallel bands oriented towards the cell wall in the lobes (Fig. 3E), whereas in the main body they show a looser arrangement and lack grana-like stacking. No starch granules were observed under the working conditions. The nucleus is spherical, parietally located in a chloroplast pocket, and contains a prominent nucleolus, even visible under LM (Fig. 3A, B & D). Asexual reproduction occurs through the formation of 4–64 autospores within irregularly shaped autosporangia measuring 21.4–27.0 μm, where the autospores are tightly appressed to one another (Fig. 3C, H, M–P). No evidence of flagellated stages or sexual reproduction was detected. Altogether, the LM (Fig. 3A–C), TEM (Fig. 3D–H) and LSCM (Fig. 3I–P) images provide complementary insights into both the morphology and ultrastructural features of this newly described species.
Symbiotic morphology of Trebouxia tabarcae sp. nov.
In symbiosis, Trebouxia tabarcae cells appear slightly polygonal rather than perfectly spherical, a shape probably resulting from being embedded in the fungal matrix. At these contact zones, TEM images reveal that fungal hyphae establish simple wall-to-wall contact with the phycobiont (Honegger Reference Honegger1992), while no intracellular or intraparietal haustoria were observed in the analyzed sections. On the algal side facing the hyphae, small cytoplasmic regions devoid of chloroplast are frequently observed. Cells are surrounded by a thick, well-defined, bilayered cell wall (Fig. 4A–D). The crenulate-type chloroplast occupies most of the cell volume, with lobes oriented towards the periphery. A single central pyrenoid of maresiae-type is present. These pyrenoids vary in the number of tubules crossing the central region, but in all cases the tubules remain narrow in the centre and become wider towards the periphery, resembling the crenulata-type in the core and the gigantea-type at the margins. In addition to this main pyrenoid, small satellite pyrenoids are occasionally present (Fig. 4A, B & D). The nucleus is parietally located within a chloroplast pocket (Fig. 4D). Overall, the ultrastructural organization in symbiosis largely mirrors that of cultured cells, confirming the stability of characters such as chloroplast structure, nuclear position, and cell wall organization, while the pyrenoid displays a distinct hybrid morphology under symbiotic conditions.
Ultrastructure and morphology of Trebouxia tabarcae sp. nov. in symbiosis. A–D, transmission electron microscopy (TEM) images showing algal cells of T. tabarcae embedded within the fungal matrix and in contact with fungal hyphae through simple wall-to-wall apposition. Secretion spaces are discernible. Black arrows indicate satellite pyrenoids in addition to the central pyrenoid. h = hyphae; n = nucleus. Scales = 2 μm.

Figure 4. Long description
A four-panel set of T E M micrographs labeled A through D. Each panel features a large, central algal cell with a dense, lobed chloroplast containing a central pyrenoid.
* Panel A: Shows an irregularly shaped algal cell. Black arrowheads point to satellite pyrenoids located near the periphery of the chloroplast. The cell is surrounded by a thin secretion space and is in direct contact with fungal hyphae, labeled h, at the bottom left and bottom right.
* Panel B: Displays a more rounded algal cell. The label h identifies hyphae positioned to the left and bottom right of the algal cell wall. A black arrowhead indicates a satellite pyrenoid.
* Panel C: Features a circular algal cell with a prominent central pyrenoid. The surrounding fungal matrix contains several smaller hyphae, with one labeled h in the bottom right corner.
* Panel D: Shows an algal cell where the nucleus is labeled n on the right side. Two black arrowheads point to satellite pyrenoids within the chloroplast. A hypha labeled h is visible at the bottom center.
In all panels, the algal cells are embedded within a fungal matrix, showing simple wall-to-wall apposition between the two bionts. Scale bars in the bottom right of each panel represent 2 micrometers.
Biomass
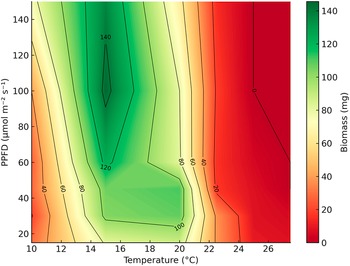
The biomass of Trebouxia tabarcae sp. nov. after 21 days of culture was significantly affected by temperature and by the temperature × irradiance interaction, whereas irradiance alone had no significant effect (two-way ANOVA; P < 0.001 for temperature and the interaction; P = 0.4288 for irradiance). Algal growth was sustained across a wide range of conditions, from 10 °C to 25 °C and irradiances between 15 and 100 μmol m−² s−¹. Biomass reached its maximum at intermediate temperatures (15–20 °C) combined with moderate to high irradiance (45–100 μmol m−² s−¹), with a peak of 144.8 mg at 15 °C and 100 μmol m−² s−¹. Growth progressively declined at higher temperatures (≥ 22.5 °C) and ceased under extreme combinations of high temperature and light intensity, 25 °C with ≥ 100 μmol m−² s−¹ and 27.5 °C with 45 μmol m−² s−¹ (Fig. 5, Supplementary Material Table S2, available online).
Contour plot of mean biomass (mg) of Trebouxia tabarcae sp. nov. after 21 days of culture across a gradient of temperature (°C) and irradiance (photosynthetic photon flux density (PPFD), μmol m−² s−¹). Colours represent biomass values (mg), with red colours indicating lower biomass and green colours indicating higher biomass. Black contour lines (isoclines) connect combinations of temperature and irradiance that yielded the same biomass, labelled in 20 mg intervals. Biomass values correspond to the mean 20–25 replicates per condition. In colour online.

Figure 5. Long description
The contour plot maps Temperature on the x-axis from 10 to 26 degrees Celsius and P P F D (irradiance) on the y-axis from 20 to 140 micromol m super minus 2 s super minus 1. A vertical color bar on the right indicates biomass in milligrams, ranging from dark red (0) to dark green (140).
* The highest biomass (140 mg) is concentrated in a dark green vertical peak located at approximately 15 degrees Celsius and between 100 to 130 P P F D.
* A secondary high-biomass region (100 to 120 mg) extends between 15 and 20 degrees Celsius across lower irradiance levels (20 to 60 P P F D).
* Biomass decreases sharply as temperatures rise above 21 degrees Celsius, transitioning through yellow and orange to a large red region on the right side of the plot.
* At 25 degrees Celsius and above, biomass drops to near zero regardless of irradiance levels.
* Isoclines are labeled at 20 mg intervals (20, 40, 60, 80, 100, 120, 140) to show the boundaries of these biomass zones.
Maximum quantum yield of PSII (F v /F m )
The maximum quantum yield of PSII (F v/F m) after 21 days of culture was significantly affected by temperature, irradiance, and their interaction (two-way ANOVA; P < 0.001 for all factors and interaction). The highest F v/F m values (0.733) were observed at the lowest temperature tested (10 °C) and low irradiance (15 μmol m−² s−¹). At higher temperatures and irradiance levels, F v/F m progressively declined. Algal cultures maintained measurable F v/F m values up to 25 °C at 60 μmol m−² s−¹ and up to 27.5 °C at 30 μmol m−² s−¹, but PSII efficiency fell to negligible levels (approaching zero) under the most extreme conditions (25 °C at 100 μmol m−² s−¹ and 27.5 °C at ≥ 60 μmol m−² s−¹). These results indicate a marked sensitivity of PSII to both heat and excessive light, with optimal photochemical performance under cool and low-light conditions (Fig. 6, Supplementary Material Table S3, available online).
Contour plot of mean maximum quantum yield of PSII (F v/F m) in Trebouxia tabarcae sp. nov. after 21 days of culture across a gradient of temperature (°C) and irradiance (photosynthetic photon flux density (PPFD), μmol m−² s−¹). Colours represent F v/F m values, with red colours indicating lower and green colours indicating higher PSII efficiency. Black contour lines (isoclines) connect combinations of temperature and irradiance that yielded the same F v/F m, labelled at intervals of 0.1 units. F v/F m values correspond to the mean of up to 20–25 replicates per condition. In colour online.

Figure 6. Long description
The contour plot uses a horizontal X-axis for Temperature in degrees Celsius ranging from 10 to 26 and a vertical Y-axis for P P F D in micromoles per meter squared per second ranging from 20 to 140. A vertical color bar on the right indicates F v forward slash F m values from 0.0 in dark red to 0.7 in dark green.
* The highest efficiency area (F v forward slash F m of 0.70) is located in the bottom-left corner, representing low temperatures between 10 and 14 degrees Celsius and low irradiance below 40 P P F D.
* Moving right along the X-axis, efficiency decreases as temperature increases. A large green-to-yellow region covers temperatures from 10 to 22 degrees Celsius across most irradiance levels, with isoclines labeled 0.60 and 0.50.
* A sharp decline in efficiency occurs between 23 and 25 degrees Celsius, where the color transitions rapidly from yellow to orange. Isoclines for 0.40, 0.30, and 0.20 are tightly packed in this narrow temperature band.
* The rightmost portion of the plot, representing temperatures above 25 degrees Celsius, is solid dark red with F v forward slash F m values dropping to 0.10 and 0.00, indicating a total loss of P S I I efficiency regardless of the irradiance level.
Discussion
This study provides integrative evidence that the lichenized microalga previously labelled as Trebouxia sp. A48 (Muggia et al. Reference Muggia, Nelsen, Kirika, Barreno, Beck, Lindgren, Lumbsch and Leavitt2020) represents a distinct species, T. tabarcae sp. nov. The species is diagnosed by cells exhibiting a stable suite of traits: crenulate-type chloroplasts with short, simple lobes; a crenulata-type pyrenoid in axenic culture; bilayered cell wall; and a coherent physiological profile under temperature and light gradients. These features remain stable in axenic material and are congruent in thalli, where the phycobiont associates with the mycobiont by simple wall-to-wall contact, without haustoria. Our integrative dataset (morphological, ultrastructural, physiological and molecular) consistently supports this lineage to represent a distinct species within Trebouxia clade A. Geographically, T. tabarcae forms a cohesive lineage distributed across the Mediterranean Basin, Atlantic/temperate Europe, coastal California, and scattered Southern Hemisphere records (Rivas-Martínez et al. Reference Rivas-Martínez, Penas, del Río, Díaz González, Rivas-Sáenz and Loidi2017; Loidi & Vynokurov Reference Loidi and Vynokurov2024). This distribution, broader than initially expected for ‘A48’, suggests adaptation to coastal environments characterized by high irradiance, periodic desiccation, and moderate thermal buffering by maritime influences.
Ultrastructural traits of the pyrenoid observed in cultured phycobionts have traditionally been considered reliable characters for the characterization and delimitation of Trebouxia species (Friedl Reference Friedl1989), and several authors have corroborated their taxonomic value when examined by transmission electron microscopy (e.g. Barreno et al. Reference Barreno, Muggia, Chiva, Molins, Bordenave, García-Breijo and Moya2022; Bordenave et al. Reference Bordenave, Muggia, Chiva, Leavitt, Carrasco and Barreno2022). Nevertheless, it is well documented that lichenized algae can undergo a range of structural and ultrastructural modifications as a consequence of the lichenization process (Galun et al. Reference Galun, Paran and Ben-Shaul1970; Friedl & Büdel Reference Friedl, Büdel and Nash2008). In this context, pyrenoid architecture in T. tabarcae varies from culture to symbiosis. In axenic conditions, the crenulata-type predominates, whereas in symbiosis the pyrenoid often exhibits a maresiae-type morphology (narrow tubules in the centre widening towards the periphery), occasionally accompanied by satellite pyrenoids. We interpret this shift as symbiosis-associated morphological plasticity rather than a taxonomic inconsistency. A comparable modification has been reported in T. maresiae (Garrido-Benavent et al. Reference Garrido-Benavent, Chiva, Bordenave, Molins and Barreno2022a), a closely related species, suggesting that pyrenoid ultrastructure can be modulated by the symbiotic context. Despite this plasticity, a stable combination of traits (crenulate chloroplasts with short, simple lobes; dense parallel thylakoids lacking grana-like stacks; a bilayered wall with putative extracellular polysaccharides and a nucleus positioned in a chloroplast pocket) provides a robust diagnostic framework for T. tabarcae. The occurrence of maresiae-type pyrenoids in symbiosis should therefore be viewed not as contradictory but as an ecologically meaningful extension of the species’ phenotypic envelope.
Phylogenetically, T. tabarcae nests within Trebouxia clade A and is separable from close congeners allied to the ‘A48’ clade, supporting species status when considered together with ultrastructural and ecological evidence. Both ML and Bayesian analyses recover T. tabarcae in clade A, in proximity to T. decolorans, T. maresiae, T. solaris and T. crenulata, although its closest sister taxon remains unresolved. An expanded, clade-A-focused dataset recovers a cohesive T. tabarcae clade comprising dozens of specimens and a geographically broad footprint (Mediterranean Basin, Atlantic/temperate Europe, coastal California, and scattered Southern Hemisphere records). Within the species, nrITS variation, including discrete indels, generates a shallow substructure. Given the limited divergence, strong clade support and morphological/physiological coherence across isolates, we interpret this signal as intraspecific variation rather than cryptic diversity. Comparable intraspecific variation has been documented in T. decolorans (Werth & Sork Reference Werth and Sork2010; Dal Grande et al. Reference Dal Grande, Alors, Divakar, Bálint, Crespo and Schmitt2014; Catalá et al. Reference Catalá, Del Campo, Barreno, García-Breijo, Reig-Armiñana and Casano2016) and T. maresiae (Garrido-Benavent et al. Reference Garrido-Benavent, Chiva, Bordenave, Molins and Barreno2022a), reinforcing that genetic heterogeneity is common in Trebouxia clade A.
The results of the ecophysiological experiments showed that Trebouxia tabarcae exhibits optimal growth and photosynthetic performance at 15–20 °C under moderate to high irradiance (45–100 μmol m−² s−¹). Growth was sustained up to 25 °C under irradiances ≤ 100 μmol m−² s−¹, and up to 27.5 °C at ≤ 60 μmol m−² s−¹, whereas beyond these limits, both biomass and F v/F m fell sharply, indicating physiological thresholds. When compared with other Trebouxia strains grown in vitro, T. tabarcae shows a tolerance profile similar to phycobionts from subtropical and Mediterranean environments. For instance, T. lynniae (former TR9), a strain associated with Ramalina farinacea and predominant in the Canary Islands, exhibited a notably broader tolerance range than its continental counterpart T. jamesii (former TR1), with sustained growth and stable F v/F m values at 20 °C and moderate-to-high irradiance (Casano et al. Reference Casano, del Campo, García‐Breijo, Reig‐Armiñana, Gasulla, Del Hoyo, Guéra and Barreno2011). Similarly, Trebouxia sp. A55 and T. cretacea, isolated from lichens inhabiting subtropical zones in the Canary Islands, showed peak F v/F m values at 20 °C and a marked decline at 17 °C, indicating a preference for relatively high temperatures (Molins et al. Reference Molins, Chiva, Calatayud, Marco, García-Breijo, Reig-Armiñana, Carrasco and Moya2020). In contrast, polar strains of Trebouxia spp. associated with Cetraria aculeata exhibited maximum photosynthetic activity at lower temperatures (~11 °C), with limited performance in warmer conditions (Domaschke et al. Reference Domaschke, Vivas, Sancho and Printzen2013), whereas tropical strains have been reported to maintain growth at temperatures up to 24 °C (Cordeiro et al. Reference Cordeiro, de Lima, Marcelli, de Souza and Martins2005). Overall, these results indicate that T. tabarcae shares ecophysiological traits with heat- and light-tolerant strains such as T. lynniae and Trebouxia sp. (A55), differing clearly from temperate or polar phycobionts. Its ability to maintain growth and high PSII efficiency up to 27.5 °C suggests a broad acclimation capacity, probably reflecting adaptation to Mediterranean coastal environments where high temperatures and irradiances are common but mitigated by sea breezes and local microclimatic buffering. Host records indicate a marked preference for Teloschistaceae lichens, especially species of the genus Xanthoria, with additional occurrences in Austroplaca sp., Flavoplaca flavocitrina, Leproplaca cirrochroa and Seirophora villosa; Physciaceae, such as in Physcia adscendens; Lecanoraceae, as in Polyozosia (= Myriolecis) reuteri and P. sambuci; and Ramalinaceae, with the mycobiont species Ramalina fastigiata, R. lacera and R. menziesii. This pattern suggests ‘flexible fidelity’: a strong bias toward X. parietina but with limited, non-random associations with other co-occurring lichens. Such dynamics align with reports of algal switching and phycobiont community structure in X. parietina (Nyati et al. Reference Nyati, Scherrer, Werth and Honegger2014; Leavitt et al. Reference Leavitt, Kraichak, Nelsen, Altermann, Divakar, Alors, Esslinger, Crespo and Lumbsch2015). In this context, T. tabarcae appears to function as a specialized coastal phycobiont that is preferentially recruited by teloschistoid lichens thriving in nutrient-enriched maritime environments, while retaining some capacity to associate with unrelated lichen families. This ecological flexibility mirrors the associations reported for T. decolorans (Werth & Sork Reference Werth and Sork2010; Catalá et al. Reference Catalá, Del Campo, Barreno, García-Breijo, Reig-Armiñana and Casano2016) and T. maresiae (Garrido-Benavent et al. Reference Garrido-Benavent, Chiva, Bordenave, Molins and Barreno2022a) across Ramalinaceae and Teloschistaceae, suggesting that host range overlap is a recurrent trait within clade A. In being recruited by relatively generalist lichen hosts such as Xanthoria parietina, T. tabarcae may facilitate the colonization and persistence of these lichens in coastal habitats, potentially allowing non-strictly coastal species to expand their ecological range into maritime environments, as previously suggested by Chiva et al. (Reference Chiva, Pazos, Montero-Pau, Moya, Garrido-Benavent, Barreno and Muggia2026).
We recognize the limitations of relying solely on single-locus markers (e.g. nrITS) for species delimitation in Trebouxia, especially in rapidly radiating lineages where barcoding gaps are blurred (Leavitt et al. Reference Leavitt, Kraichak, Nelsen, Altermann, Divakar, Alors, Esslinger, Crespo and Lumbsch2015; Muggia et al. Reference Muggia, Nelsen, Kirika, Barreno, Beck, Lindgren, Lumbsch and Leavitt2020). Nevertheless, T. tabarcae is supported through an integrative framework: i) a cohesive, well-supported nrITS clade with internal heterogeneity compatible with intraspecific variation; ii) stable and diagnostic ultrastructural traits in culture, coupled with predictable, context-dependent plasticity in symbiosis (maresiae-type pyrenoid); iii) a consistent physiological profile across temperature–light gradients; and iv) an ecological footprint concentrated in coastal, thermally buffered habitats and largely associated with X. parietina.
Describing new species within Trebouxia remains a challenging task. Morphological features are often subtle, and many traits can vary depending on whether cells are in culture or in symbiosis, making them difficult to evaluate in isolation. Therefore, an integrative approach that combines multiple lines of evidence (ultrastructural morphology, physiology, ecology and phylogeny) is essential to achieve robust delimitation. Continuing to expand this framework will be key for advancing the taxonomy of lichen phycobionts, where a large fraction of diversity is still known only from OTUs and remains undescribed. By integrating ultrastructural diagnostics, ecophysiological performance data and phylogenetic placement, T. tabarcae bridges the gap between OTU-level diversity (Leavitt et al. Reference Leavitt, Kraichak, Nelsen, Altermann, Divakar, Alors, Esslinger, Crespo and Lumbsch2015; Muggia et al. Reference Muggia, Nelsen, Kirika, Barreno, Beck, Lindgren, Lumbsch and Leavitt2020) and formally described Trebouxia species. Recognizing this taxon sharpens our understanding of coastal Mediterranean lichen symbioses, formalizing a morpho-physiologically coherent, climate-specialist lineage within clade A. In this sense, T. tabarcae complements the recent description of T. maresiae, together illustrating how subtle but consistent phenotypic and ecological traits can underpin robust species delimitations in Trebouxia. Beyond its taxonomic relevance, T. tabarcae also contributes to the broader discussion on the ecological versatility of phycobionts in coastal ecosystems, where recurrent selection by teloschistoid lichens highlights the interplay between microalgal identity, microclimatic buffering, and adaptation to maritime stressors.
Supplementary Material
The Supplementary Material for this article can be found at http://doi.org/10.1017/S0024282926101546.
Acknowledgements
This study was supported by the projects PROMETEO/2021/005 and CIPROM2024-044 (GVA), awarded to Eva Barreno, and PID2021-127087NB-I00 (Ministerio de Ciencia e Innovación), awarded to Isaac Garrido-Benavent. We thank Dr Michael D. Guiry (AlgaeBase, Ireland) for his comments about the new species’ epithet, and Yihe Chen (UAH) for her valuable assistance during the ecophysiological experiments.
Author ORCIDs
Patricia Moya, 0000-0003-0397-863X; Salvador Chiva, 0000-0002-1615-6443; Isaac Garrido-Benavent 0000-0002-5230-225X.
Competing Interests
The authors declare none.
Data Accessibility
Newly generated sequences have been deposited in GenBank (see Supplementary Material Table S1, available online).




 Open access

