





Introduction
Fungi are recognized as a megadiverse and taxonomically complex kingdom, with an estimated two to four million species worldwide (Hawksworth & Lücking Reference Hawksworth and Lücking2017). Significant fractions of this diversity are yet to be discovered or formally described. Based on current trends, cataloguing fungal diversity may take centuries or potentially millennia (Wu et al. Reference Wu, Hussain, Zhang, Stadler, Liu and Xiang2019). Against this backdrop of fungal discovery, anthropogenic-influenced climate change has contributed to the already severe effects of habitat loss, fragmentation, pollution, etc. (Heilmann-Clausen et al. Reference Heilmann-Clausen, Barron, Boddy, Dahlberg, Griffith, Nordén, Ovaskainen, Perini, Senn-Irlet and Halme2015; Mueller et al. Reference Mueller, Cunha, May, Allen, Westrip, Canteiro, Costa-Rezende, Drechsler-Santos, Vasco-Palacios and Ainsworth2022) to what is now considered a sixth mass extinction. Given the increasingly rapid pace of global change and the subsequent pressures on species at risk, large-scale efforts are attempting to both speed the cataloguing of fungal diversity and streamline the use of digital data for fungal conservation status assessment (van Galen et al. Reference van Galen, Corrales, Truong, van den Hoogen, Kumar, Manley, Stewart, Kohout, Baldrian and Větrovský2025). Such efforts are implemented through biodiversity and DNA sequencing consortia including UNITE and Pluto-F (Kõljalg et al. Reference Kõljalg, Nilsson, Abarenkov, Tedersoo, Taylor, Bahram, Bates, Bruns, Bengtsson-Palme and Callaghan2013) and the BOLD (Ratnasingham & Herbert Reference Ratnasingham and Herbert2007) platforms, and projects including Biodiversity Genomics Europe (https://biodiversitygenomics.eu/), Darwin Tree of Life (https://www.darwintreeoflife.org/) and others. Comprehensive fungal cataloguing will be necessary to accurately assess the rate at which we are losing fungal diversity and to understand ways we can best maintain and conserve species.
DNA barcoding has become a powerful tool in taxonomy and biodiversity research (Hebert et al. Reference Hebert, Hollingsworth and Hajibabaei2016). Barcoding allows for the assignment and differentiation of species by short marker sequences, making species identification cheap and accessible outside of the small pool of classically trained taxonomic experts. These short sequences of one to a few specific regions have been selected typically for certain characteristics: a high substitution rate, which means mutations accumulate over time, making species-level variation high and comparisons feasible; a relatively high copy number for more straightforward amplification; no introns; a lack of recombination. Ideally, such gene regions (hereafter called markers) can then be used as unique identifiers for individual species. For fungi, the standard barcode DNA marker is the internal transcribed spacer (ITS) (Schoch et al. Reference Schoch, Seifert, Huhndorf, Robert, Spouge, Levesque and Chen2012), which is a short non-coding DNA sequence c. 450–800 base pairs in length, located in the ribosomal RNA gene cluster separating the 18S and 28S coding regions. Ideally, such a barcode marker would separate species by a consistent pattern of intraspecific diversity being smaller than interspecific diversity, creating what is termed the ‘barcoding gap’ (Meyer & Paulay Reference Meyer and Paulay2005); in this scenario, delimitation of species would be indicated by a barcoding gap, and a reference database of barcode sequences would be used for species recognition and as a molecular identification step (e.g. Lücking et al. Reference Lücking, Aime, Robbertse, Miller, Ariyawansa, Aoki, Cardinali, Crous, Druzhinina and Geiser2020), hereafter called species assignment.
Lichens, structurally dominated by a heterotrophic fungus and with internal autotrophic algae and/or cyanobacteria, represent c. 20% of known fungal diversity (Nash Reference Nash2008). They are functionally important across a wide range of ecosystems: acting as a food source for many different organisms from microbes to mammals, and capturing and recycling nutrients and moisture (Asplund & Wardle Reference Asplund and Wardle2017; Ellis et al. Reference Ellis, Asplund, Benesperi, Branquinho, Di Nuzzo, Hurtado, Martínez, Matos, Nascimbene and Pinho2021). However, survey and status assessment of lichens is challenging because they can be problematic to find and identify. Many species are often small and exist in specific microhabitats, including hard to access locations such as on cliff faces or in forest canopies. For example, epiphytic lichens form vertical strata (Ellis Reference Ellis2012), and surveyors will frequently miss lichen species present at the tops of trees (Kiebacher et al. Reference Kiebacher, Keller, Scheidegger and Bergamini2016). Furthermore, traditional morphological lichen identification may require the inspection of anatomical structures that can be difficult to observe, even microscopically, plus specialist chemical tests, so that many years of specialist training may be required to achieve reliability in species surveys. This dual detection-identification problem has been explored in studies by Vondrák et al. (Reference Vondrák, Malíček, Palice, Coppins, Kukwa, Czarnota, Sanderson and Acton2016) and von Hirschheydt et al. (Reference von Hirschheydt, Kéry, Ekman, Stofer, Dietrich, Keller and Scheidegger2024), where multiple experts surveyed the same sites and, on average, one expert surveyor alone detected only 50–70% of the lichen species present. To overcome these challenges, bulk sampling of environmental DNA (eDNA) could provide a suitable supplementary and more systematically reproducible measure for lichen diversity status assessment, monitoring and ecological studies.
The study of eDNA through sampling of water and soil has become an increasingly popular way to estimate microbial diversity and reveal complexity among cryptic taxa such as mycorrhizal fungi, and this has catalyzed method development (Ruppert et al. Reference Ruppert, Kline and Rahman2019; Tedersoo et al. Reference Tedersoo, Bahram, Zinger, Nilsson, Kennedy, Yang, Anslan and Mikryukov2022). Since lichens are not often considered a dominant component of aquatic habitats or soil systems, other methods have been developed to target the substrata on which they occur, such as swabbing or scraping bark and rocks (Dreyling et al. Reference Dreyling, Schmitt and Dal Grande2022; Henrie et al. Reference Henrie, Thomson, Yungfleisch, Kerr and Leavitt2022; Kirchgeorg et al. Reference Kirchgeorg, Chang, Ip, Jucker, Geckeler, Lüthi, van der Loo, Mächler, Franco-Sierra and Herrera2024; Vondrák et al. Reference Vondrák, Košnar, Svoboda, Palice, Šoun, Kubásek, Říha, Malíček, Rydlo and Hofmeister2025) or capturing water that flows down the trunks of trees (Sakata et al. Reference Sakata, Sado, Oka, Ushio and Miya2023). Alternatively, targeting the diversity of all fungi using air samplers for spore capture and subsequent eDNA has tremendous promise (Banchi et al. Reference Banchi, Ametrano, Stanković, Verardo, Moretti, Gabrielli, Lazzarin, Borney, Tassan and Tretiach2018; Abrego et al. Reference Abrego, Furneaux, Hardwick, Somervuo, Palorinne, Aguilar-Trigueros, Andrew, Babiy, Bao and Bazzano2024), but with potential methodological limitations. Automated methods of multispecies detection also propose incorporating spore-trapping in air samplers, but this has not yet been implemented at scale (Wägele et al. Reference Wägele, Bodesheim, Bourlat, Denzler, Diepenbroek, Fonseca, Frommolt, Geiger, Gemeinholzer and Glöckner2022). The only large-scale study to date, the Global Spore Sampling Project (GSSP) (Ovaskainen et al. Reference Ovaskainen, Abrego, Furneaux, Hardwick, Somervuo, Palorinne, Andrew, Babiy, Bao and Bazzano2024), was an enormous effort that consistently logged spore samples every two weeks for two years. However, many of the sampler locations were chosen for accessibility, since they were frequently visited, and the deployed samplers were large pieces of machinery. These limitations meant that most GSSP sample locations were situated in urban areas, which probably resulted in an under-representation of regional lichen diversity in the final dataset because of lichen sensitivity to urban air pollution (Pardo et al. Reference Pardo, Fenn, Goodale, Geiser, Driscoll, Allen, Baron, Bobbink, Bowman and Clark2011; Johansson et al. Reference Johansson, Palmqvist and Olofsson2012; Jovan et al. Reference Jovan, Riddell, Padgett and Nash2012).
Another important but sometimes overlooked limitation in the ability to detect lichens is the lack of sequence reference data for species assignment (e.g. Lücking et al. Reference Lücking, Aime, Robbertse, Miller, Ariyawansa, Aoki, Cardinali, Crous, Druzhinina and Geiser2020; Henrie et al. Reference Henrie, Thomson, Yungfleisch, Kerr and Leavitt2022). Reference data in the form of markers generated from reliably identified and well-curated specimens play a key role in correctly cataloguing and verifying lichen fungi in eDNA studies. We will demonstrate here that a lack of well-populated reference databases combined with taxonomic uncertainties currently impedes the application of eDNA to lichen survey and monitoring. More generally, taxonomic groups that have been understudied will be underestimated in the total count of diversity since there are simply no reference sequences to compare with incoming eDNA sequence data. Combined with the additional complexity introduced by ‘dark taxa’ (i.e. those entities known only from sequences), these various hurdles may prevent automated sequence-based techniques from generating meaningful species assignments and downstream diversity assessments. This problem is particularly severe for lichens since unravelling their complex diversity still demands progress. Study of the genus Cora by large-scale sampling and sequencing of preserved and fresh specimens has led to a predicted expansion of the genus, from a single species to potentially between 170–450 species (Lawrey et al. Reference Lawrey, Lücking, Sipman, Chaves, Redhead, Bungartz, Sikaroodi and Gillevet2009; Dal Forno et al. Reference Dal Forno, Lawrey, Moncada, Bungartz, Grube, Schuettpelz and Lücking2022), which would make it one of the largest genera of lichen-forming fungi. Although two orders of magnitude difference may be exceptional, it is not difficult to find other examples of lichens with extensive cryptic diversity (e.g. Zhang et al. Reference Zhang, Clancy, Jensen, McMullin, Wang and Leavitt2022). These and other studies demonstrate the potential scale of diversity that remains undiscovered, notwithstanding the photobiont which remains even less well studied than the lichen fungal partner and probably contains much more diversity than previously thought (Muggia et al. Reference Muggia, Nelsen, Kirika, Barreno, Beck, Lindgren, Lumbsch and Leavitt2020).
Considering the two problems outlined above – the large proportion of species lacking sequence data and unresolved species delimitation – perhaps one of the best ways to improve eDNA success is by investing in a well-documented curation of custom reference databases with a set of clearly articulated criteria for inclusion, as opposed to a reliance on unfiltered large-scale global databases such as NCBI GenBank (Kerr & Leavitt Reference Kerr and Leavitt2023; Mugnai et al. Reference Mugnai, Costantini, Chenuil, Leduc, Gutiérrez Ortega and Meglécz2023). When surveying 500 scientists on which area of eDNA research requires the most development, reference databases were selected as the area requiring most progress (Blackman et al. Reference Blackman, Couton, Keck, Kirschner, Carraro, Cereghetti, Perrelet, Bossart, Brantschen and Zhang2024). A sample containing many different species can often result in a lack of confidence in species assignments, particularly when relying on a singular noisy and incomplete reference database. In a review paper outlining key considerations for the construction of reference databases, the highlighted suggestions included explicit consideration of 1) species represented by multiple sequences, 2) references from a constrained geographical region, 3) phylogenetic placement to guard against incorrect labelling, and 4) inclusion of outgroups to avoid problematic assignments due to the co-amplification of non-target groups (Blackman et al. Reference Blackman, Walser, Rüber, Brantschen, Villalba, Brodersen, Seehausen and Altermatt2023).
In considering the resources that could be used to construct reference databases, UNITE has been established as a unified fungal database, providing curated fungal sequences from public data uploaded to GenBank. Within UNITE is a large quantity of data and a system for quantifying diversity using Species Hypotheses (SH), making it the obvious choice for identifying fungal-focused eDNA. However, several challenges to its use remain. First, standard integration of UNITE is through the FASTA or tool-specific formatted database, but these provided files lack metadata, which must be obtained from GenBank through the linked accession ID. This prepackaged format makes it challenging to create a customized, geographically targeted database. Second, the clustering approach used in the formation of SHs does not place sequences on a phylogenetic tree, which remains challenging at a broad taxonomic scale with only the ITS marker (Li et al. Reference Li, Steenwyk, Chang, Wang, James, Stajich, Spatafora, Groenewald, Dunn and Hittinger2021; Bradshaw et al. Reference Bradshaw, Aime, Rokas, Maust, Moparthi, Jellings, Pane, Hendricks, Pandey and Li2023). Additionally, much of the original data are missing since the curated FASTA file uses only ‘one sequence to represent each SH; these sequences are called representative sequences (RepS) when chosen automatically by the computer, and reference sequences (RefS) when those choices are overridden (or confirmed) by users with expert knowledge of the taxon at hand’ (https://unite.ut.ee/repository.php). Incorporating tree-based references could improve the rank at which the target sequence is classified. However, equating the total number of SHs found with diversity measured in terms of OTUs/ASVs does not link to single species, because the degree of intraspecific variation across species differs and using SHs for species assignments could mean over- or under-representation of species diversity. Lastly, the amount of noise within the entire UNITE database is considerable, represented by the unidentified fungi labelled simply as ‘Fungi’, and may lead to uninformative assignments. This constraint makes species identification more onerous when SHs are returned rather than a list of scientific names, where, for conservation purposes, determining if a species of concern exists within a particular area would be an ideal use of eDNA. Although worthwhile overall in the cataloguing of fungal ITS data, those considering eDNA studies may want to take an approach such as Vondrák et al. (Reference Vondrák, Košnar, Svoboda, Palice, Šoun, Kubásek, Říha, Malíček, Rydlo and Hofmeister2025) adopted, in which a customized reference database (Vondrák et al. Reference Vondrák, Svoboda, Košnar, Malíček, Šoun, Frolov, Svensson, Novotný and Palice2023) was constructed of high quality specimen records that were identified by experts, in order to ensure that sequence data are attached to the current scientific name.
Before starting to address the potential of eDNA in assessing lichen composition and diversity from a methodological point of view, we aimed to pare back the promise of eDNA to a simple preliminary question: how many British lichens have catalogued DNA barcodes usable as reference data for eDNA detection? There is merit in asking this question for one of the most intensively studied regions of the world (the British Isles) in terms of traditional lichenological knowledge (Leighton Reference Leighton1879; Smith Reference Smith1921; Laundon Reference Laundon1965; Duncan Reference Duncan1970; Purvis et al. Reference Purvis, Coppins, Hawksworth, James and Moore1992; Smith et al. Reference Smith, Aptroot, Coppins, Fletcher, Gilbert, James and Wolseley2009), with the next step in UK lichenology being the transition to genomic methods from more than two centuries of taxonomic effort, based on sampling, measurement and status assessment of lichen diversity. Addressing this goal, our approach aims to identify current sequencing gaps by compiling the best possible reference database with existing open-source materials and examining how close the lichen research community has come to achieving full taxonomic coverage for the application of eDNA studies from baseline surveys to monitoring. Previous studies on fish and aquatic eDNA have conducted comprehensive worldwide gap analyses to determine the completeness of the genetic database for a given taxonomic group across space and concerning conservation status (Weigand et al. Reference Weigand, Beermann, Čiampor, Costa, Csabai, Duarte, Geiger, Grabowski, Rimet and Rulik2019; Marques et al. Reference Marques, Milhau, Albouy, Dejean, Manel, Mouillot and Juhel2021). Nothing at that scale has been carried out for fungi. However, fungi represent a large and complex taxonomic group including significant taxonomic uncertainty, particularly across large geographical areas, so dividing the work among global researchers and focusing on specific target clades within the fungal kingdom is a sensible approach to estimating the current gaps sufficiently. In the most recent 2020 update on the state of genetic data in NCBI Taxonomy (https://www.ncbi.nlm.nih.gov/taxonomy), 83% of described fungal taxa were missing from the database (Schoch et al. Reference Schoch, Ciufo, Domrachev, Hotton, Kannan, Khovanskaya, Leipe, Mcveigh, O’Neill and Robbertse2020). However, these database-focused efforts have limitations since relevant data have now been spread across many sources, and curating and compiling these sources takes considerable effort, with not all data present in any one source (e.g. UNITE, BOLD, GenBank, etc.). Accordingly, the research described here aims to estimate the current state of DNA marker data for lichens and, in so doing, suggest a set of targeted species that should be prioritized in future sequencing efforts.
Methods
Sequence retrieval and compilation
The Lichen Taxon Dictionary provided by the British Lichen Society (BLS; https://britishlichensociety.org.uk/) is a collection of all historical synonyms and current scientific names for British Isles lichen fungi, varieties and chemical races in addition to allied fungi and lichenicolous fungi. These are collectively referred to here as LAT (lichenized and associated taxa) throughout the rest of this paper. Our investigation began by downloading the BLS Taxon Dictionary (British Lichen Society 2024; accessed 1 October 2024) to establish a list of scientific names for further querying sequence databases. Then, to assess which marker may be the best target and determine where biases lie in current databases, we retrieved metadata on all potential LAT in GenBank (accessed 30 December 2024). Access to metadata was obtained with the gbfetch package (Nitta Reference Nitta2024) in R Statistical Software (v. 4.2.3; R Core Team 2023) and curated by querying for the various names under which a marker may be listed and replacing it by assigning a marker type to each record. For example, the nuclear large subunit was listed under the following names in different records: ‘large subunit ribosomal RNA’, ‘28S’ and ‘nucLSU’. These records were then filtered by geography to focus only on sequences originating from European countries; this limits potential large-scale genetic variation or taxonomic overextension originating from specimens across disjunct continental scales (Bergsten et al. Reference Bergsten, Bilton, Fujisawa, Elliott, Monaghan, Balke, Hendrich, Geijer, Herrmann and Foster2012; Muggia et al. Reference Muggia, Pérez-Ortega, Fryday, Spribille and Grube2014; Zhang et al. Reference Zhang, Clancy, Jensen, McMullin, Wang and Leavitt2022).
The four markers identified as having the most species records were ITS1/ITS2, mtSSU, nucLSU (28S) and nucSSU (18S). ITS data was then retrieved for LAT from multiple databases: UNITE (Kõljalg et al. Reference Kõljalg, Nilsson, Schigel, Tedersoo, Larsson, May, Taylor, Jeppesen, Frøslev and Lindahl2020; Abarenkov et al. Reference Abarenkov, Nilsson, Larsson, Taylor, May, Frøslev, Pawlowska, Lindahl, Põldmaa and Truong2024), Global Fungi (Větrovský et al. Reference Větrovský, Morais, Kohout, Lepinay, Algora, Awokunle Hollá, Bahnmann, Bílohnědá, Brabcová and D’Alò2020) and BOLD (Ratnasingham & Herbert Reference Ratnasingham and Herbert2007), and a previously custom-made reference database (Martin7) for European lichens (Vondrák et al. Reference Vondrák, Svoboda, Košnar, Malíček, Šoun, Frolov, Svensson, Novotný and Palice2023). LAT names were queried and then sequences for each linked species hypothesis (SH) in UNITE were downloaded using web scraping (i.e. automated extraction) with Selenium (Angmo & Sharma Reference Angmo and Sharma2014) in Python to query for LAT in UNITE and Global Fungi (accessed 23 October 2024). Raw data were obtained since no well-formatted metadata were linked to the UNITE published FASTA file, and we wanted to constrain records to Europe. Through searching and scraping each page for every potential lichen name, all potential sequences and which country they originated from were collated (scraped on 26 October 2024).
Using the bold package (Dubois & Chamberlain Reference Dubois and Chamberlain2023) in R, the Barcode of Life Data was programmatically accessed and queried for LAT scientific names (accessed 3 October 2024). Martin7 was also downloaded (accessed 16 December 2024) and filtered for British Isles LAT. The ITS region was not downloaded from GenBank because it is mirrored then curated in UNITE. All the records were filtered for European origin. The ITS region was then downsampled since some of the species from Global Fungi had thousands of records, which could add excessive noise and introduce bias; therefore, after deduplication a maximum of 200 sequences were retained per species, which were prioritized by sequence length. Mitochondrial small subunit data were retrieved from GenBank using the package gbfetch and merged with Martin7. The sizeable nuclear subunit (LSU) marker and the small nuclear subunit (SSU) were subsequently investigated by retrieving GenBank data. These sequences were then filtered for LAT by searching for any possible names in the BLS Lichen Taxon Dictionary (downloaded 1 October 2024) and filtering for only European records. Data were curated using the packages tidyr (Wickham et al. Reference Wickham, Vaughan and Girlich2024), dplyr (Wickham et al. Reference Wickham, François, Henry, Müller and Vaughan2023), Biostrings (Pagès et al. Reference Pagès, Aboyoun, Gentleman and DebRoy2022) and stringr (Wickham Reference Wickham2023), and plotting was carried out with VennDiagram (Chen Reference Chen2022) and ggplot2 (Wickham Reference Wickham2016).
After the species and sequence data for each marker were compiled, the issue of taxonomic changes needed to be addressed. In practice, it was easy to see the discrepancies where species had been sequenced and categorized under an old name/synonym. However, this does not make a straightforward process to update, considering that taxonomic inflation (‘splitting’) and conservatism (‘lumping’) have occurred so frequently. To address this, a function was written to address four possible scenarios: 1) a single historical name changes to a single new name, which would mean a replacement of the older name; 2) a historical name found in the database has split and become two or more new names, meaning it is unreliable to assign to one of these new names, and will be removed from the records; 3) a historical name has split off resulting in the retention of the historical name but also a new name, as well as the species that was once classified under the historical name; in this case, the species will retain the historical name in the split since it would be difficult to trace all of the dates of sequencing to the splits; 4) multiple species lump into a new currently/historically accepted name.
Data analysis
To assign current taxonomy at higher levels (Family, Order) to the list of species names for British Isles LAT, each species name was queried using the taxize package (Chamberlain & Szöcs Reference Chamberlain and Szöcs2013). Using an iterative approach, NCBI, Integrated Taxonomic Information System (ITIS; https://www.itis.gov/), GBIF (https://www.gbif.org/) and Catalogue of Life (COL; https://www.catalogueoflife.org/) were searched in that order. If there was no NCBI data, the search would move on to ITIS, etc. Afterwards, manual curation was necessary to fill in blanks by retrieving taxonomy from the Consortium of Lichen Herbaria Taxonomy Explorer (https://lichenportal.org/portal/index.php). Taxa from the BLS Taxon Dictionary were assigned to one of six major groups according to their growth forms or life history: fruticose, foliose, squamulose, or crustose lichens, lichenicolous fungi (which have lichenized fungi as hosts) or associated non-lichenized fungi. Species of conservation concern were identified and assigned a value based on the Conservation Evaluation of British Lichens (Woods & Coppins Reference Woods and Coppins2012), using the standard threat categories and criteria as follows: critically endangered (CR), endangered (EN), vulnerable (VU); near threatened (NT) and least concern (LC) for those not meeting threat categories; or data deficient (DD) for species that may be anywhere from threatened to least concern but for which insufficient data exist about distribution and/or threats. A suggested list of lichens that should be sequenced as a priority in the future was compiled including all species that fit any one of the following criteria. First, species were prioritized if they had a conservation classification of CR, EN or DD and lacked data from an ITS sequence. We included DD taxa since previous investigations have found that these taxa are often at very high risk (Roberts et al. Reference Roberts, Taylor and Joppa2016; Borgelt et al. Reference Borgelt, Dorber, Høiberg and Verones2022). Second, we drew together the occurrence record data from the BLS database (Janet Simkin, personal communication) and gave each species a total count of how many times it had been recorded. This record count was then used to determine the single most abundant taxon from each family with no sequenced species, a prioritization which would increase the potential to fill taxonomic gaps. Third, a remaining 77 taxa were chosen based on abundance to provide potentially ‘easy’ gaps that have probably been overlooked or are part of a ‘split’, meaning the historical name and existing sequence(s) no longer exist and the resulting taxa from the split necessitate new sequencing (scenario 2 described above in Methods).
Results
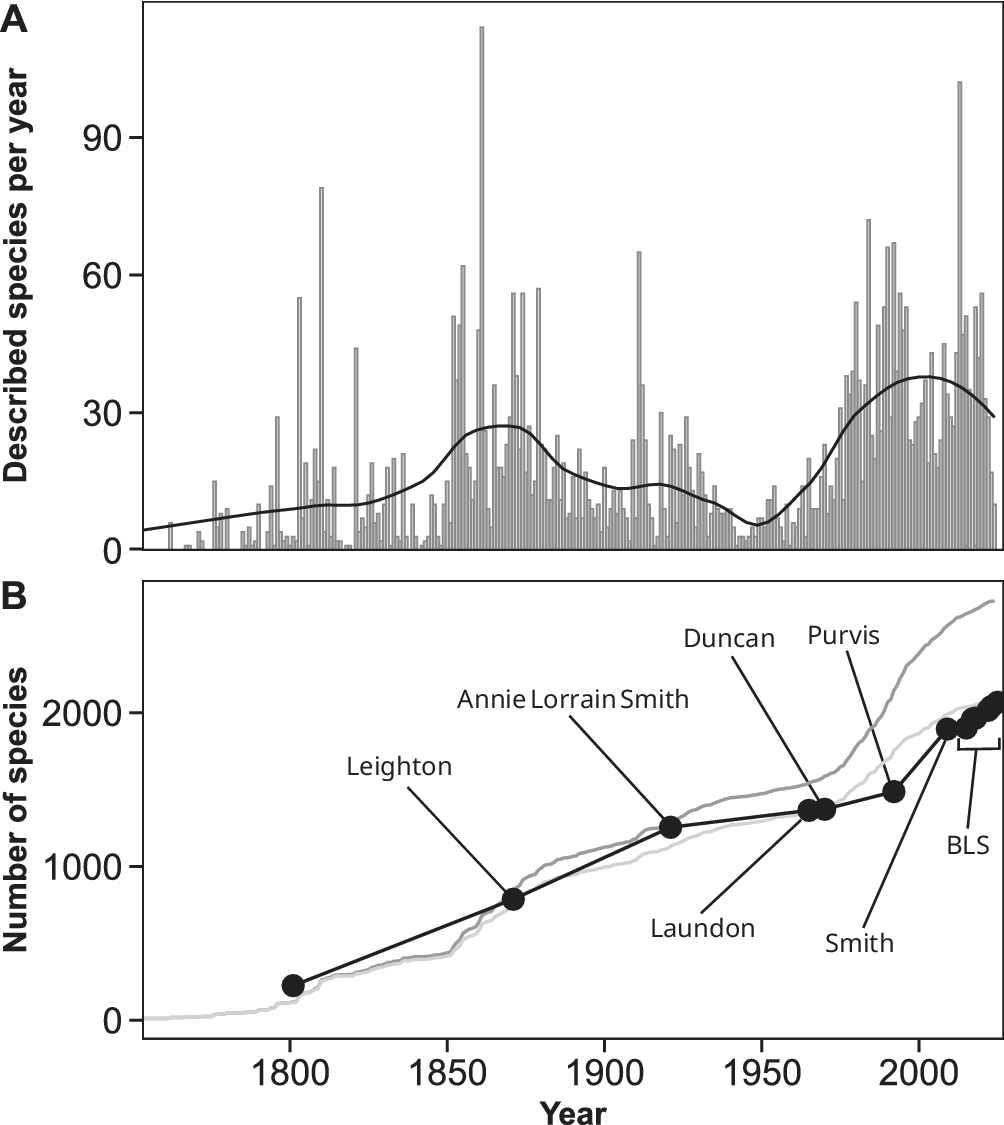
The BLS Taxon Dictionary contained a total of 9137 names including historical, synonymized and current scientific names. Also identified were 420 historical names linked to more than one current name, indicating new species segregated from older, broader concepts. In addition, 1811 current species have two or more historical names linked to a single current name. At the time of access (2024), 2709 recognized LAT species were present, meaning there is approximately a 3 to 1 ratio of names to accepted taxa. These 2709 species include 2059 lichenized fungi, 560 lichenicolous fungi, 84 non-lichenized fungi, and four named chemical races. Based on a temporal breakdown for the origin of currently accepted names, the number of British Isles LAT described per year hit various peaks in the mid-1800s. It increased again, probably based on sequencing efforts, in the 2010s (Fig. 1A). Considering the total number of species described (Fig. 1B), a naming explosion occurred c. 1975, potentially linked to productive phases in the overlapping careers of prominent UK lichenologists, such as Peter James and Brian Coppins.
A, number of species appearing on the current UK checklist described over time, per year. Note that some species may have been described outside of the UK and discovered within the UK later. B, total number of UK checklist species described over time. Each point represents a different authoritative British Isles lichen account, each of which is labelled. Three lines show the cumulative number of described species over time for lichenized fungi only (L; represented by light grey), lichenized and associated taxa (LAT; represented by dark grey), and the number of species included in authoritative works (black line with dots).

Figure 1. Long description
Panel A is a bar graph with a superimposed trend line. The X axis represents years from 1750 to 2020. The Y axis represents Described species per year with increments of 30. Vertical grey bars show annual fluctuations, with major peaks around 1870 and 2010 exceeding 90 species. A smooth black trend line shows a multi-modal distribution with peaks around 1875 and 2005.
Panel B is a cumulative line graph. The X axis represents years from 1750 to 2020. The Y axis represents Number of species with increments of 1000. Three lines are shown. A light grey line representing L rises steadily to nearly 2000. A dark grey line representing L A T rises above the light grey line to approximately 2700. A black line with large dots represents species in authoritative works. This black line connects specific points labeled from left to right. Leighton around 1870. Annie Lorrain Smith around 1920. Laundon and Duncan around 1965. Purvis around 1990. Smith around 2010. A bracket at the far right end of the black line is labeled B L S.
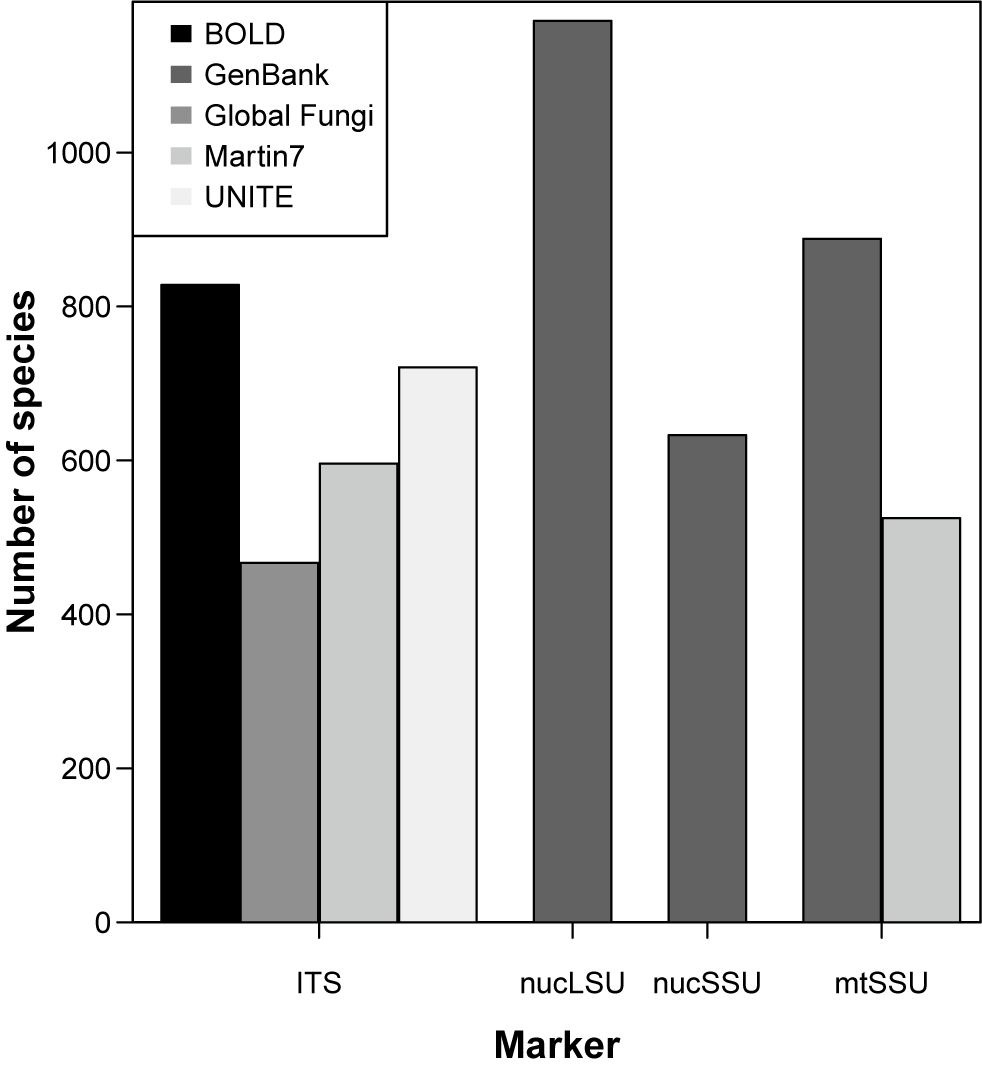
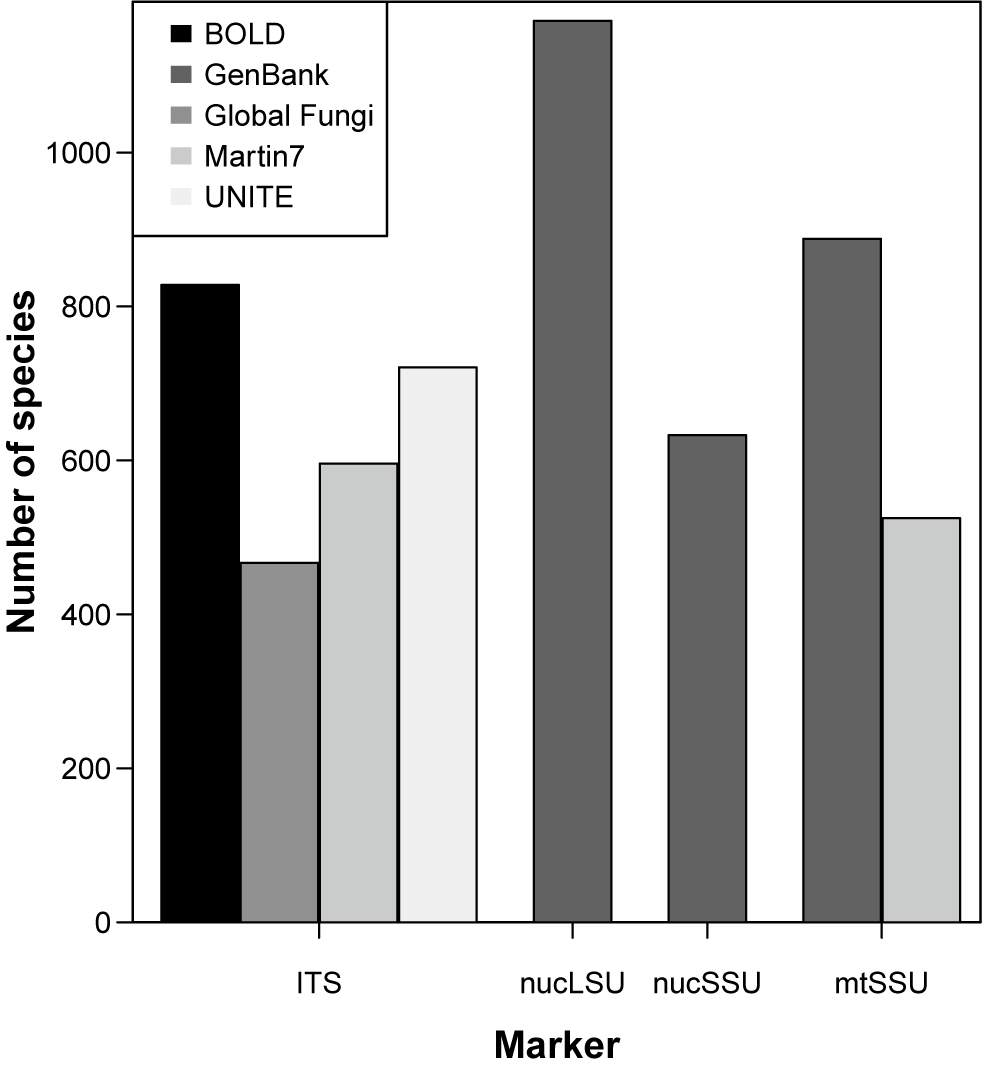
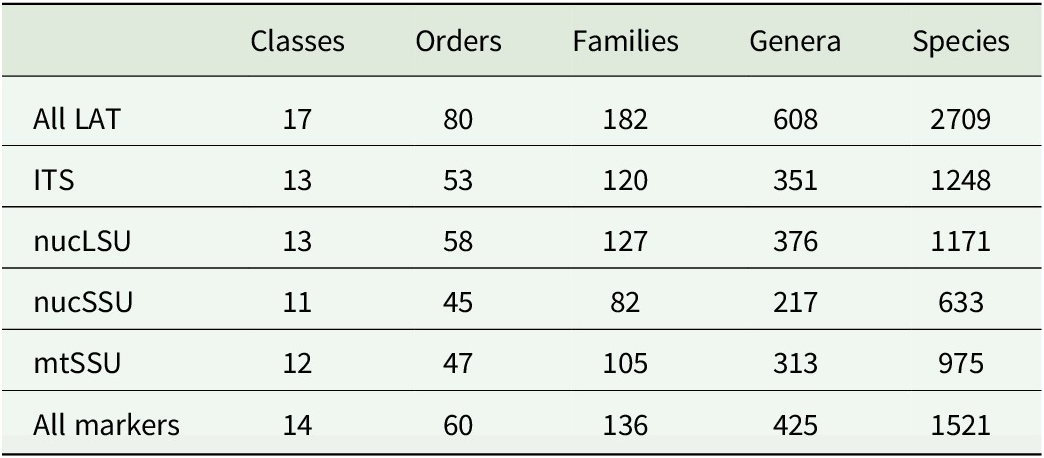
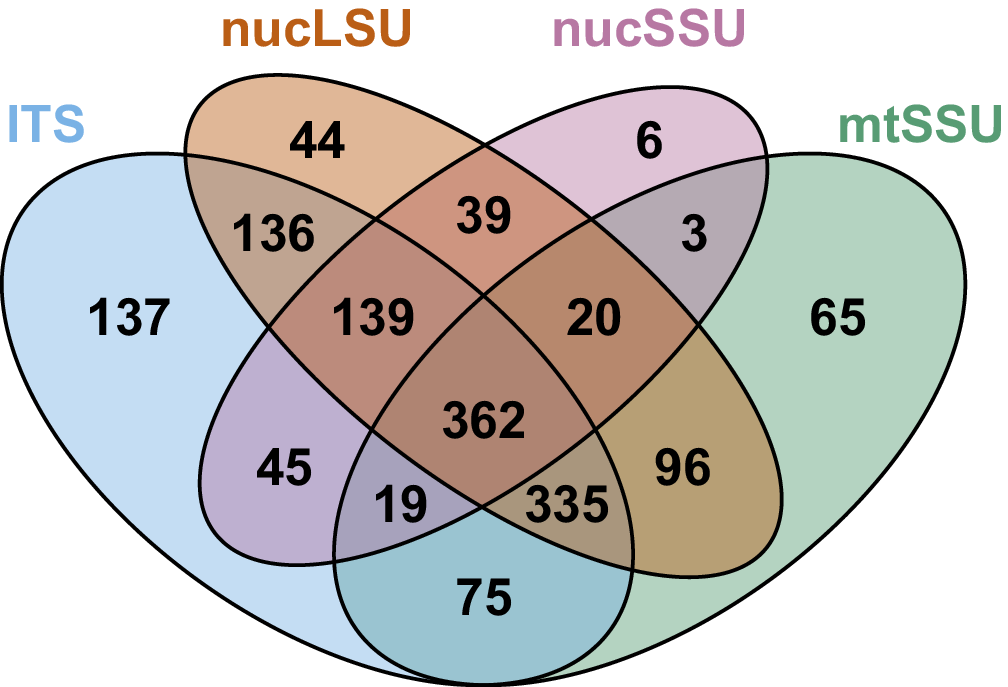
Across different markers, the whole ITS region (comprising ITS1, 5.8S and ITS2) had the best representation of LAT diversity (Table 1). This result came from the multiple curated databases that have been created and combined, although nucLSU had more overall species drawn from a single database (Fig. 2). Not only were most species represented by an ITS sequence, but overall, the average number of sequences per species was also greater. Still, across LAT diversity represented by current sequences, we saw considerable gaps among all markers, even at higher taxonomic ranks. Even for the best represented marker, ITS, no sequences of European origin exist for species from four classes and 27 orders of British Isles LAT (Table 2). There is considerable overlap among markers for sequenced species but, using a Venn diagram, we see no apparent ‘best’ marker that contains considerably more species than others (Fig. 3). With this in mind, it would seem reasonable to use a multiple marker approach in sequence read species assignment, to increase the chances of robustly classifying taxa and verifying species lists within an understudied group such as LAT. Overall, 1521 species (56%) have been sequenced using at least one marker across Europe, although for specimens sourced within the UK there are only 467 species (17%). Most sequences of LAT within current databases originate from lichens found mainly in Sweden, Finland and Norway, which share considerable overlap with UK lichen diversity. The UK contributed sequences from a wide diversity of species, ranking 4th out of 40 behind Norway, Sweden and the Czech Republic. However, there are fewer total sequences for the UK, given the low repetition within species, with the UK ranking 9th out of 40 European countries for total contributed sequences.
Representative species and sequence information for lichenized and associated taxa (LAT) at each genetic marker. Values represent the number of sequences available across combined databases. Note ‘Full’ represents ITS1, 5.8S and ITS2. European species represent those from any country within Europe and the UK, whereas UK species are those that have a sequence from a UK specimen.
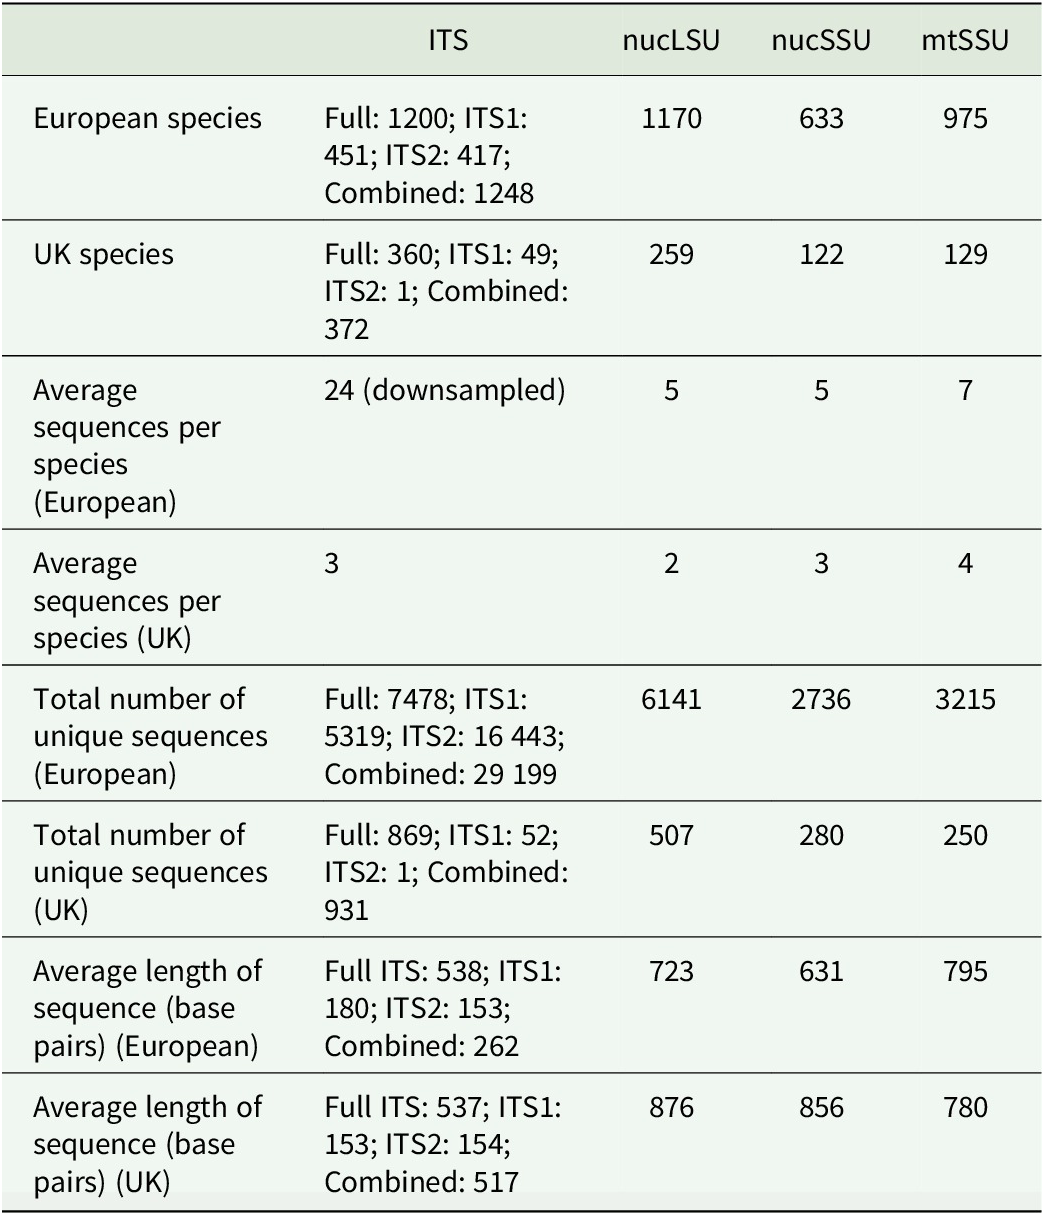
Table 1. Long description
The table consists of five columns. The first column lists the metrics, while the subsequent columns represent genetic markers: I T S, nuc L S U, nuc S S U, and mt S S U.
* Row 1: European species. I T S (Full: 1200; I T S 1: 451; I T S 2: 417; Combined: 1248), nuc L S U (1170), nuc S S U (633), mt S S U (975).
* Row 2: U K species. I T S (Full: 360; I T S 1: 49; I T S 2: 1; Combined: 372), nuc L S U (259), nuc S S U (122), mt S S U (129).
* Row 3: Average sequences per species (European). I T S (24 downsampled), nuc L S U (5), nuc S S U (5), mt S S U (7).
* Row 4: Average sequences per species (U K). I T S (3), nuc L S U (2), nuc S S U (3), mt S S U (4).
* Row 5: Total number of unique sequences (European). I T S (Full: 7478; I T S 1: 5319; I T S 2: 16 443; Combined: 29 199), nuc L S U (6141), nuc S S U (2736), mt S S U (3215).
* Row 6: Total number of unique sequences (U K). I T S (Full: 869; I T S 1: 52; I T S 2: 1; Combined: 931), nuc L S U (507), nuc S S U (280), mt S S U (250).
* Row 7: Average length of sequence in base pairs (European). I T S (Full I T S: 538; I T S 1: 180; I T S 2: 153; Combined: 262), nuc L S U (723), nuc S S U (631), mt S S U (795).
* Row 8: Average length of sequence in base pairs (U K). I T S (Full I T S: 537; I T S 1: 153; I T S 2: 154; Combined: 517), nuc L S U (876), nuc S S U (856), mt S S U (780).
The number of unique lichenized and associated taxa (LAT), after name correction, with at least one sequence in a given database.
Taxonomic representation of lichenized and associated taxa (LAT) across genetic markers. ‘All LAT’ represents the taxonomy of the currently described LAT, and the taxonomy that is represented by the species that have an existing marker is given in each row.
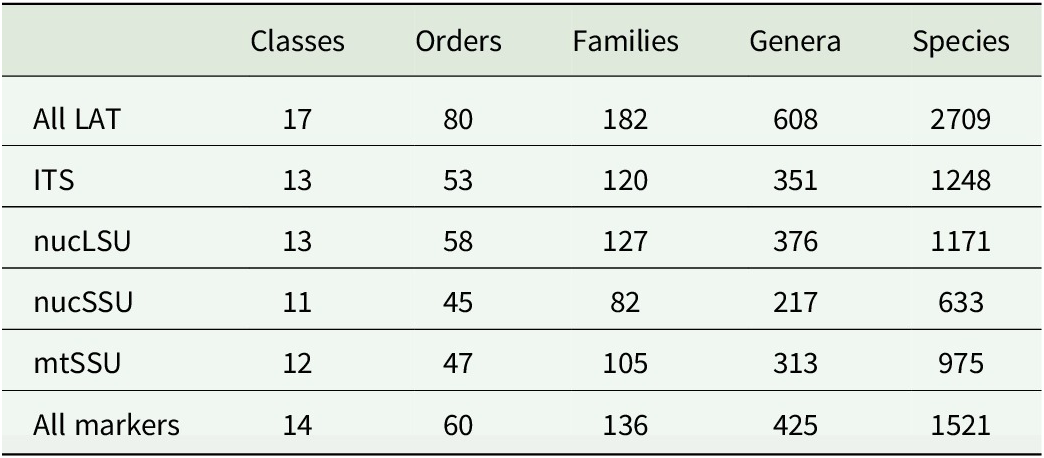
Table 2. Long description
The table consists of six columns and six rows of data. The columns are labeled Classes, Orders, Families, Genera, and Species.
* The first row, All L A T, contains 17 Classes, 80 Orders, 182 Families, 608 Genera, and 2709 Species.
* The second row, I T S, contains 13 Classes, 53 Orders, 120 Families, 351 Genera, and 1248 Species.
* The third row, nuc L S U, contains 13 Classes, 58 Orders, 127 Families, 376 Genera, and 1171 Species.
* The fourth row, nuc S S U, contains 11 Classes, 45 Orders, 82 Families, 217 Genera, and 633 Species.
* The fifth row, mt S S U, contains 12 Classes, 47 Orders, 105 Families, 313 Genera, and 975 Species.
* The final row, All markers, contains 14 Classes, 60 Orders, 136 Families, 425 Genera, and 1521 Species.
The overlap of species of lichenized and associated taxa (LAT) for four commonly sequenced genetic markers. When summarized across all four markers, 1521 unique species were represented by at least one single marker.
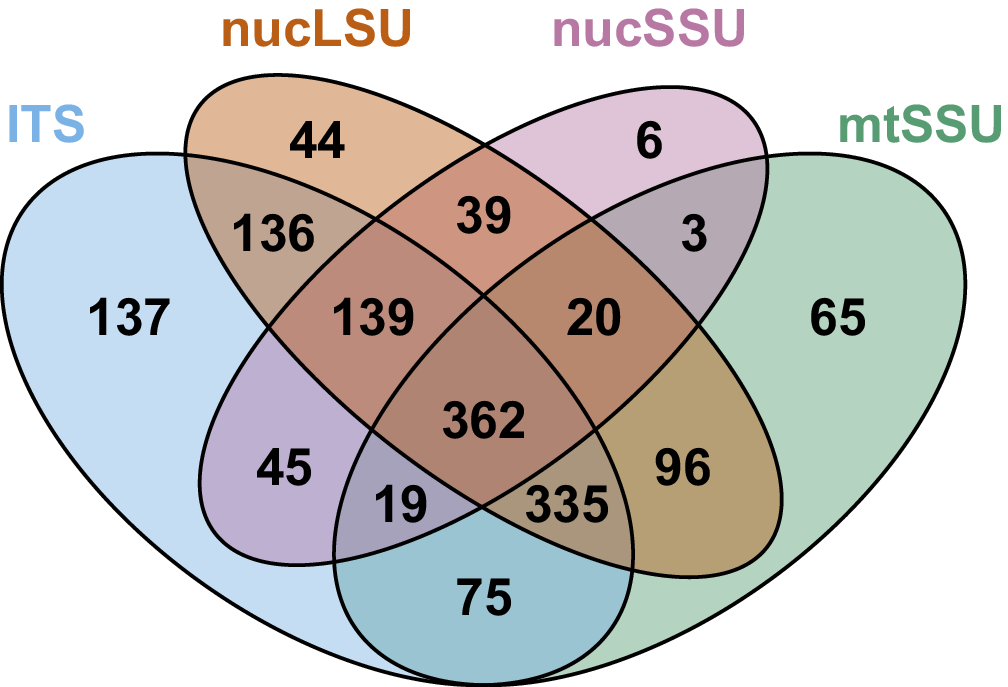
Figure 3. Long description
The diagram consists of four overlapping ellipses representing different genetic markers.
* At the center is the intersection of all four markers, containing 362 species.
* Surrounding the center are intersections of three markers. These include 139 species between I T S, nuc L S U, and nuc S S U; 20 species between nuc L S U, nuc S S U, and mt S S U; 335 species between I T S, mt S S U, and nuc L S U; and 19 species between I T S, nuc S S U, and mt S S U.
* Further outward are intersections of two markers. These include 136 species between I T S and nuc L S U; 39 species between nuc L S U and nuc S S U; 3 species between nuc S S U and mt S S U; 96 species between mt S S U and nuc L S U; 45 species between I T S and nuc S S U; and 75 species between I T S and mt S S U.
* The outermost regions represent species unique to a single marker. These are 137 species for I T S (light blue), 44 species for nuc L S U (orange), 6 species for nuc S S U (purple), and 65 species for mt S S U (green).
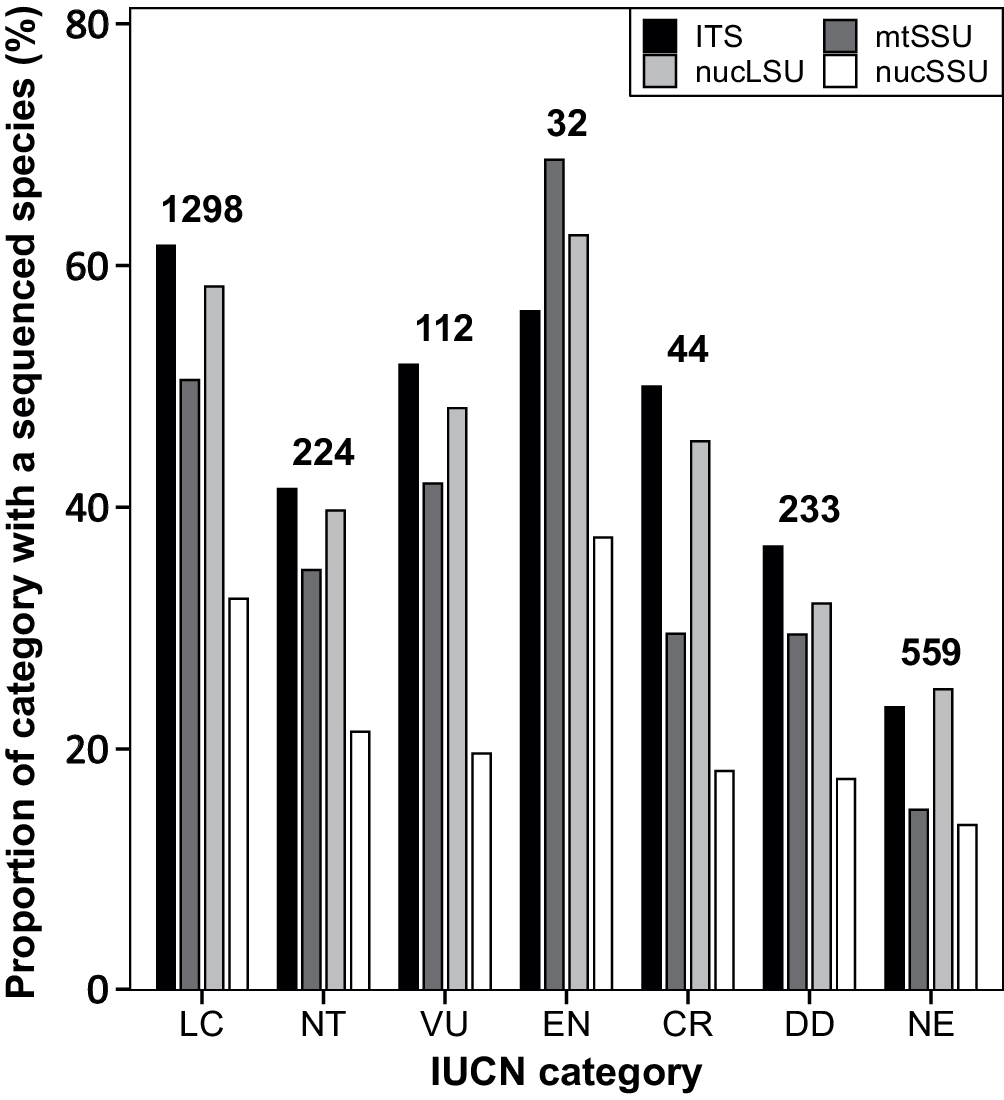
The sequencing status of LAT by conservation status showed considerable gaps for most categories of threat, with only LC, CR, EN and VU species reaching above 50% of species with at least a single ITS sequence (Fig. 4). NT and DD species had the largest sequencing gaps in both percentage and size, with each group containing over 200 species. Comparing these values with the IUCN Red List (https://www.iucnredlist.org/) shows that very few British Isles LAT have been added to the globally assessed species within the IUCN database, with most assessments at a national level only. Only one critically endangered, one near threatened, and five LAT of least concern in the UK have been globally assessed according to IUCN guidelines (IUCN 2024).
Proportion of total lichenized and associated taxa (LAT) species with at least one sequence for each marker, grouped by conservation evaluation status (Woods & Coppins Reference Woods and Coppins2012). The value above each set of bars represents the total number of species within the category. Standard threat categories and criteria as follows: critically endangered (CR), endangered (EN), vulnerable (VU); near threatened (NT) and least concern (LC) for those not meeting threat categories; or data deficient (DD).
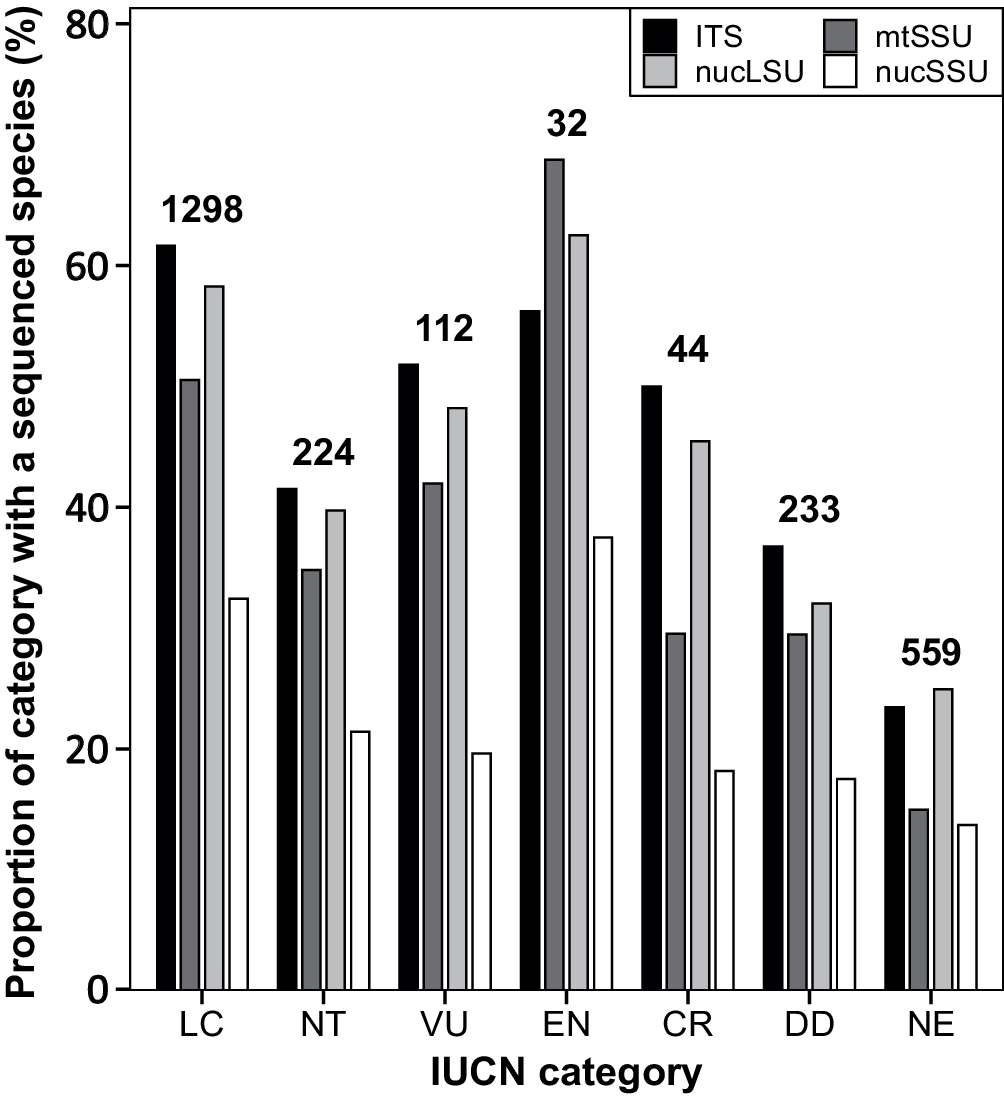
Figure 4. Long description
The y-axis represents the Proportion of category with a sequenced species in percent, ranging from 0 to 80. The x-axis lists I U C N categories. A legend in the top right identifies four markers: I T S (black), mt S S U (dark gray), nuc L S U (light gray), and nuc S S U (white).
Data clusters from left to right:
* L C (1298 species): I T S is highest at approximately 62 percent, followed by nuc L S U at 58 percent, mt S S U at 50 percent, and nuc S S U at 32 percent.
* N T (224 species): I T S is approximately 42 percent, nuc L S U is 40 percent, mt S S U is 35 percent, and nuc S S U is 22 percent.
* V U (112 species): I T S is 52 percent, nuc L S U is 48 percent, mt S S U is 42 percent, and nuc S S U is 20 percent.
* E N (32 species): This category has the highest sequencing proportions. mt S S U is highest at 70 percent, followed by nuc L S U at 63 percent, I T S at 56 percent, and nuc S S U at 38 percent.
* C R (44 species): I T S is 50 percent, nuc L S U is 46 percent, mt S S U is 30 percent, and nuc S S U is 18 percent.
* D D (233 species): I T S is 37 percent, nuc L S U is 32 percent, mt S S U is 30 percent, and nuc S S U is 18 percent.
* N E (559 species): I T S is 24 percent, nuc L S U is 25 percent, mt S S U is 15 percent, and nuc S S U is 14 percent.
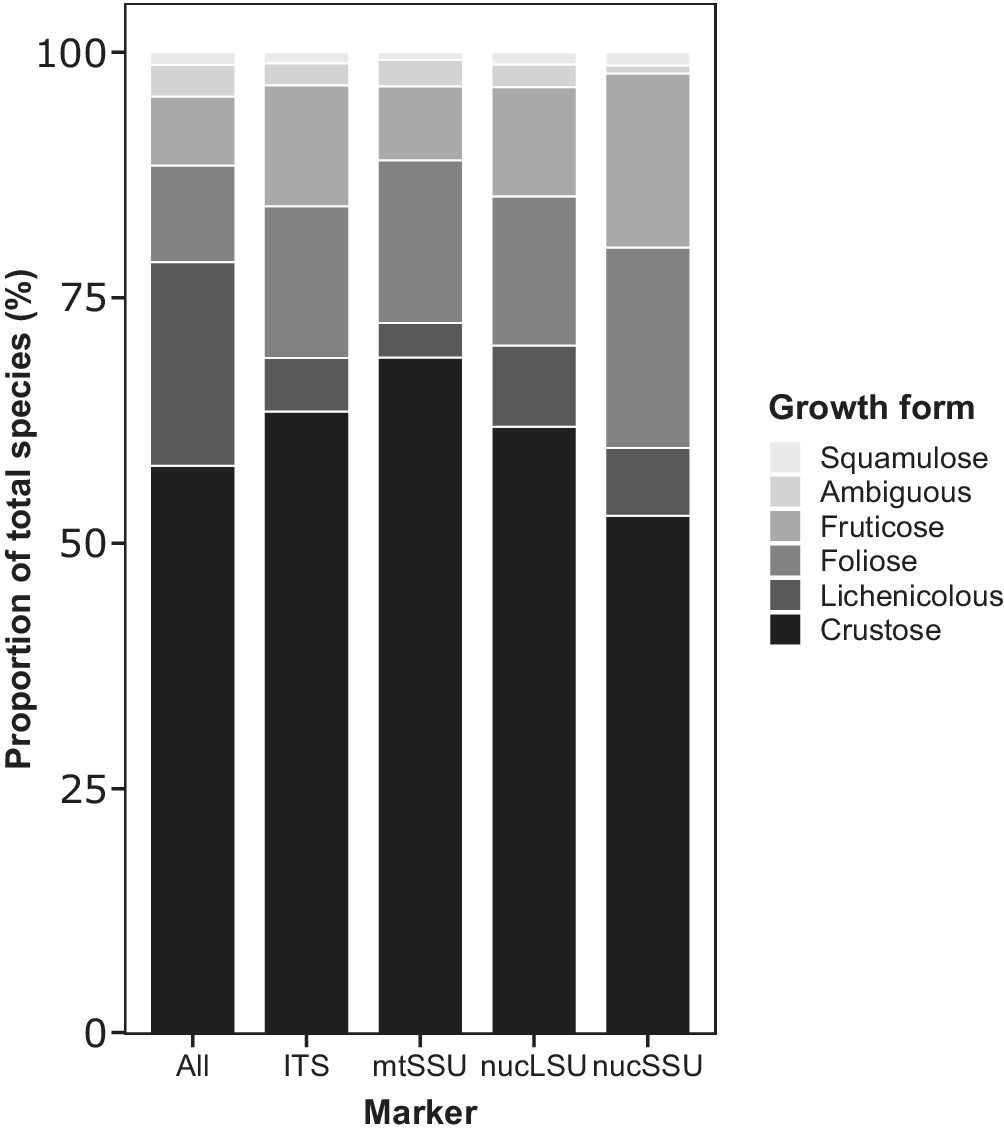
Lichenicolous fungi were the most under-represented group within the sequence data, while foliose and fruticose growth forms tended to be the best represented among sequenced taxa (Fig. 5). Less expected is that the proportion of crustose taxa sequenced matched relatively well to their overall proportion within all LAT. The proposed list of priority LAT for sequencing consists of 153 species that are EN, CR or DD, 70 species from families that have yet to be sequenced, and 77 highly abundant taxa that have not yet been captured. The final prioritized lists contain the first 300 taxa we recommend as a starting point for future sequencing efforts. These lists are open-source and available for download (https://github.com/dylanstephen-s/British-Lichenized-and-Associated-Taxa-Barcodes).
Proportion of growth forms that have been sequenced. The ‘All’ category represents counts of known species in each growth form found across lichenized and associated taxa (LAT) that are not of chemical races.
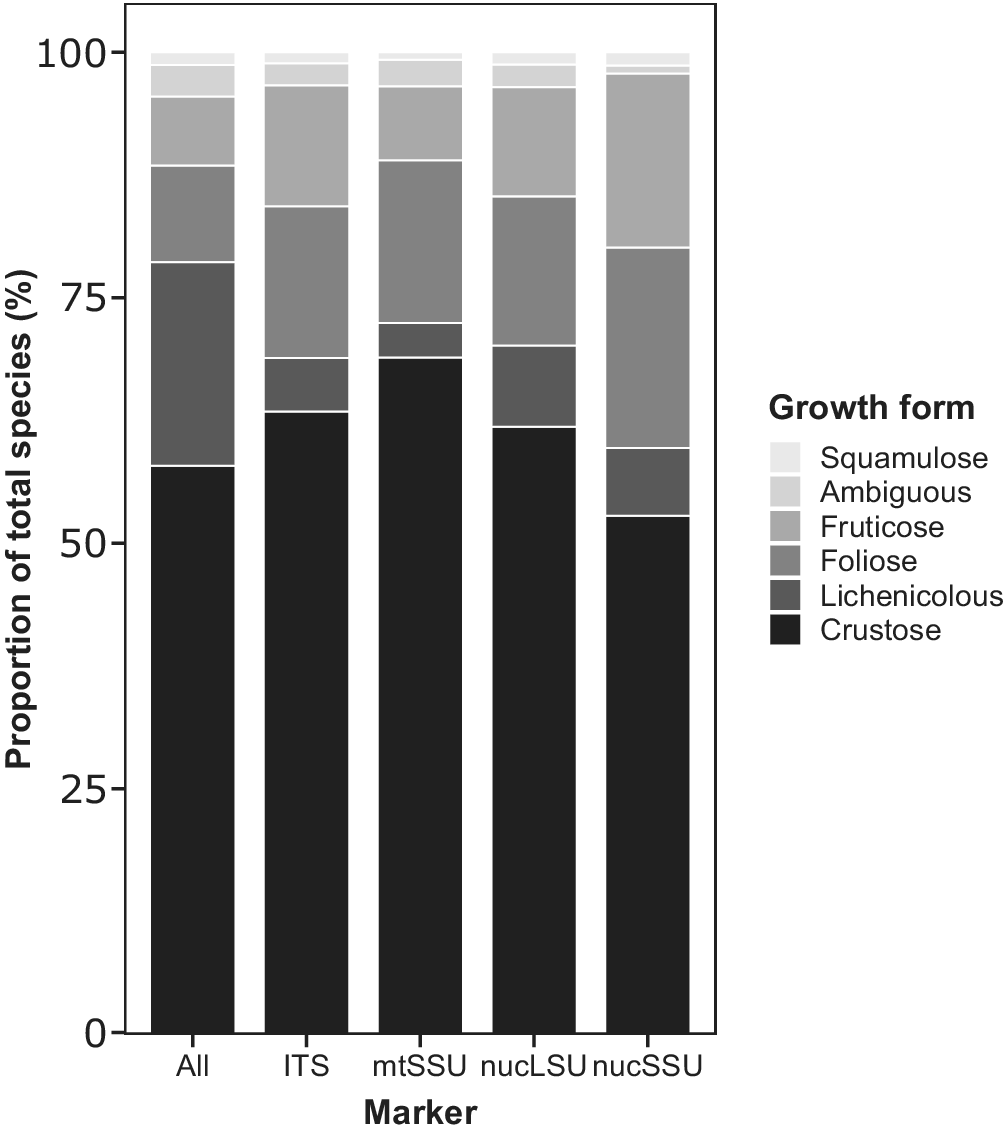
Figure 5. Long description
The y-axis is labeled Proportion of total species percent and ranges from 0 to 100. The x-axis is labeled Marker and includes five categories: All, I T S, mt S S U, nuc L S U, and nuc S S U. A legend to the right identifies six growth forms from top to bottom: Squamulose (lightest gray), Ambiguous, Fruticose, Foliose, Lichenicolous, and Crustose (black).
* All: Crustose makes up approximately 58 percent, followed by Lichenicolous at 20 percent, Foliose at 10 percent, Fruticose at 7 percent, and small amounts of Ambiguous and Squamulose.
* I T S: Crustose increases to about 63 percent, Lichenicolous decreases to 5 percent, Foliose is 15 percent, and Fruticose is 12 percent.
* mt S S U: Crustose is highest here at nearly 70 percent, followed by very thin bands of Lichenicolous and Foliose, with Fruticose at 15 percent.
* nuc L S U: Crustose is at 62 percent, Lichenicolous at 8 percent, Foliose at 15 percent, and Fruticose at 12 percent.
* nuc S S U: Crustose is lowest at 53 percent, Lichenicolous at 7 percent, Foliose at 20 percent, and Fruticose at 18 percent.
Discussion
eDNA has the potential to revolutionize biodiversity monitoring, especially for taxonomic groups for which survey data has previously been limited, including fungi. Focusing on a UK case study, we explored the publicly available genetic information on British Isles LAT, exploring sequencing gaps and highlighting where there might be priority areas for species capture and DNA barcoding. Our assessment outlines the complications that arise for a group such as lichenized fungi that have undergone massive taxonomic revision and will probably continue to undergo future taxonomic changes with the increased production and availability of genetic data. Furthermore, even where data for a given species apparently exist to populate databases, it is still critical to assess the quality of those data. Our analysis, in some ways, performs only the earliest stages of data cleaning, in assuring that the taxonomy is correct and that geographical origins are relevant. Additional outstanding issues include ensuring accurate identification using only trusted data and confirming the availability of voucher material for examination. Nevertheless, we can make a series of instructive observations that could advance the utility of eDNA based on our findings, outlined below.
The value of voucher specimens
Ensuring that each sequence is linked to a verifiable specimen is essential for checking specimen identification. Linking well-identified fungal material to sequence data has been accelerated by the large-scale sequencing of preserved specimens (Dentinger et al. Reference Dentinger, Gaya, O’Brien, Suz, Lachlan, Díaz-Valderrama, Koch and Aime2016; Gueidan et al. Reference Gueidan, Elix, McCarthy, Roux, Mallen-Cooper and Kantvilas2019; Gueidan & Li Reference Gueidan and Li2022), but this has sometimes proved difficult due to DNA degradation. Therefore, preserved specimens may not be sufficient alone, but when combined with collecting and sequencing fresh voucher specimens, collection-based sequencing projects remain critical in bolstering databases. Although databases such as RefSeq (https://www.ncbi.nlm.nih.gov/refseq/) represent this type of necessary multifunctional database, seamlessly linking accessioned specimens, metadata and sequences, currently there are very few LAT represented (c. 20).
The value of metadata
Ensuring that each sequence is linked to a verifiable specimen that is associated with quality metadata is essential to parse geographical and other associated data. The database that currently best records quality metadata is the Barcode of Life Database (BOLD). It links sequences to associated specimens and contains high quality information on collection date, region, coordinates, collector, etc. In addition, BOLD has facilitated access, made available by an easy-to-use R package, and its format may come to define how future databases should be curated. One of the difficulties experienced with UNITE, where only a FASTA file is provided, is its inclusion of the entire database with reference IDs but no metadata. Hence, tracking down a subset of relevant information necessitates the time-consuming process of locating accessions in GenBank or elsewhere and retrieving then combining data from multiple sources. Which database best meets these requirements may change as more unified options become available, such as GBIF, which now allows a link to DNA sequences to be uploaded, making it a promising future option for a single place to access specimen ID, in situ photographs, taxonomy, DNA and geographical location (Abarenkov et al. Reference Abarenkov, Andersson, Bissett, Finstad, Fossøy, Grosjean, Hope, Jeppesen, Kõljalg and Lundin2023).
Harmonizing names
The ability to interrogate voucher specimens to check identifications is essential to track and manage taxonomic changes over time, allowing researchers to revisit and revise older sequenced specimens and re-attribute a correct taxonomic assignment. We caution that when building or comparing against reference databases, one must query for every possible historical name or synonym to ensure that relevant data are not missed. Global naming conventions are often not addressed in eDNA or traditional field surveys, and species names have changed considerably since the advent of DNA barcoding. Therefore, standardizing names when inputting genetic data into database structures is critically important, and using and maintaining the most up-to-date name would seem an obvious step. However, many sequences in specific databases remained listed under older names or appeared incorrectly labelled on submission, presumably due to conflicting or obsolete taxonomic concepts, or to misidentifications. Recently, an annotation feature has been added to UNITE, allowing individuals to update names and carry out batch annotation by direct contact with the creators. Through this process, we annotated 242 records of LAT species names on UNITE, which reflect accepted taxonomic changes, although we recognize that reconciling global taxonomies will remain a challenge for some time. As more historical names are discovered and annotated, representation should improve and become more trustworthy. Overall, we recommend moving towards collaboration between experts in specific taxonomic groups and those working on metabarcoding to inform and process data and inform annotation. This collaboration could lead to better annotations. For example, bioinformaticians might contribute large-scale analyses of members of a given taxonomic group by flagging potential annotation problems. A taxonomist, or someone with field survey expertise, could then attribute the problem to a specific biological explanation, such as issues related to amplification, sequencing a lichenicolous fungus by mistake, or a known species concept challenge. Obsolete classification systems and synonyms are recognized issues within GenBank, for example, causing downstream problems in barcoding (Bidartondo Reference Bidartondo2008). The methods in this paper provide scientists from any field with the tools to address their naming convention problems, even when conducting list-based or ecological surveys.
eDNA current challenges
Environmental DNA studies have already begun surveying and monitoring fungi across many broad but poorly characterized taxonomic groups, despite lacking complete reference data. Considering that we are missing many LAT within current databases, and that currently applied methodologies for species assignments usually involve only a single database, eDNA studies will (based on current state of the art) vastly under-sample lichen occurrence and under-represent lichen diversity. The absence of a considerable number of British Isles LAT from current reference databases leads to the inability to detect high proportions of potentially important species, such as species of conservation concern. There are two potential solutions to this problem: wider sampling of lichen diversity in the long term, and in the short term the use of bespoke reference databases with multiple markers.
Having considered the distribution of available sequences from multiple markers, it is clear that multi-marker studies will improve species detection. As shown in a recent paper by Vondrák et al. (Reference Vondrák, Košnar, Svoboda, Palice, Šoun, Kubásek, Říha, Malíček, Rydlo and Hofmeister2025), the use of ITS1, ITS2 and mtSSU markers improved overall detection since some species were found only by one of these markers, with the combination of reference databases increasing both the representation of species and the representation of markers per species. As demonstrated by variability in the proportion of sequenced markers for LAT species in the CR category, whether these species can be detected within an area (even if present) depends on which marker is used in eDNA studies. Multi-marker studies can also be used to deal with clades where ITS is insufficient for species discrimination (Kauserud Reference Kauserud2023). For example, Vondrák et al. (Reference Vondrák, Košnar, Svoboda, Palice, Šoun, Kubásek, Říha, Malíček, Rydlo and Hofmeister2025) found that the mtSSU marker recovered 42 species (c. 7% of the total) that were not identified with either ITS1 or ITS2. In a study of soil and root microbiomes (Sene et al. Reference Sene, Obieze, Ezeokoli, Boyle, Quoreshi and Khasa2025), the authors compared 18S and ITS and found that there was a complementarity to multi-marker studies, where some groups, such as the Glomeromycetes, were best predicted with the addition of 18S. This phenomenon is likely to apply to lichens in which species groups are poorly differentiated by ITS, such as within the genus Cladonia (Pino-Bodas et al. Reference Pino-Bodas, Martín, Burgaz and Lumbsch2013; Steinová et al. Reference Steinová, Škaloud, Yahr, Bestová and Muggia2019), Micarea (Kelly et al. Reference Kelly, Hollingsworth, Coppins, Ellis, Harrold, Tosh and Yahr2011; Myllys et al. Reference Myllys, Svensson, Kantvilas, Sérusiaux, van den Boom, Aptroot, Cezanne, Eichler, Pino-Bodas and Printzen2026) and Stereocaulon (Rebecca Yahr, personal observation). The multiple marker approach also recognizes the limitations in using ITS, such as the PCR step introducing biases when using different primers (Bellemain et al. Reference Bellemain, Carlsen, Brochmann, Coissac, Taberlet and Kauserud2010). Although we clearly identify the benefits of using multi-markers in eDNA application, we would advocate that future sequencing efforts continue to include ITS since it has been standardized and databases are already established exclusively for ITS. Multi-marker studies can also improve taxonomic resolution of recovered taxa. Studies that have used long-read technology to sequence the SSU, ITS and LSU and then applied species assignments to them using multiple databases have shown better taxonomic resolution than when using only a single marker (Heeger et al. Reference Heeger, Bourne, Baschien, Yurkov, Bunk, Spröer, Overmann, Mazzoni and Monaghan2018; Jamy et al. Reference Jamy, Foster, Barbera, Czech, Kozlov, Stamatakis, Bending, Hilton, Bass and Burki2020; Furneaux et al. Reference Furneaux, Bahram, Rosling, Yorou and Ryberg2021), and less introduced taxonomic bias compared to ITS2 alone (Lu et al. Reference Lu, Zhang, Zhang, Wang, Zhao, Liu, Liu, Zhuang, Chen and Cai2023). Long-read data are valuable in phylogenetic analysis for taxa that do not have any high confidence matches (Tedersoo et al. Reference Tedersoo, Tooming-Klunderud and Anslan2018), when placing ‘unidentified’ taxa into clades that previously only had ITS sequences (Tedersoo et al. Reference Tedersoo, Anslan, Bahram, Kõljalg and Abarenkov2020), or groups such as Glomeromycota which have high intraspecific variability within the ITS (Kolaříková et al. Reference Kolaříková, Slavíková, Belz, Krüger and Kohout2021). There will be other considerations and further research required once the full-length ribosomal rRNA is tested thoroughly, including whether additional markers are needed, since specific genera have been shown to show little species-level differentiation with ITS alone or, alternatively, include potentially misleading intragenomic variation leading to multiple different copies of the rDNA cistron (Lücking et al. Reference Lücking, Aime, Robbertse, Miller, Ariyawansa, Aoki, Cardinali, Crous, Druzhinina and Geiser2020). However, there is insufficient data on the complete ribosomal subunit to thoroughly characterize this problem here, but there are exciting new potential opportunities for more phylogenetically aware and accurate species assignments. Future studies should attempt to quantify the ability of long-read sequencing.
As a corollary, the current benefits of a multi-marker approach raise the longer-term questions of whether a single marker may ever be sufficient or whether devising higher cutoffs and cross-marker validation is required to give trusted results. With the increased availability of long-read technology and its lowering costs, it seems likely that the full rRNA operon will be used for reference databases, allowing for taxonomic resolution at higher ranks and more base pairs for overall comparison. The building of the EUKARYOME database (Tedersoo et al. Reference Tedersoo, Hosseyni Moghaddam, Mikryukov, Hakimzadeh, Bahram, Nilsson, Yatsiuk, Geisen, Schwelm and Piwosz2024) from assembled genomes has already displayed another way of extracting the rRNA operon for use in metabarcoding species assignment. Previous data on individual markers will also aid in classifying long-read data, which can be used as a supplement to reference databases.
Considering the longer term, we found that LAT diversity is still not represented even at higher taxonomic levels (for example, several classes have no sequence data), and many gaps exist in the genetic data. This study broadened its focus to European data to maximize chances of capturing at least a single sequence for a relevant British Isles LAT species. This introduces geographical bias since species assignment based on current databases will tend to overestimate those species shared between Nordic countries and British Isles LAT. The available database shrinks considerably if the approach is limited to specimens sampled from within the UK. In the future, sequencing regional-origin material will be an important part of building reference databases that are geographically limited to the area within question, thereby limiting the potential confounding effect of genetic variability introduced over geographical space.
We also found sequencing biases among the growth forms and with respect to the ecological traits of sequenced species, with lichenicolous fungi being the most likely to be missed from eDNA studies. Establishing countrywide and eventually regional databases that better represent the diversity and ecology of LAT will become vitally important for generating higher quality data that is less noisy. This means ramping up sequencing efforts at national and regional scales.
eDNA future pathways
Sometimes, a jump from scientific research to application can lead to downstream problems if done too hastily; in early eDNA studies, an entire reference database would be created in parallel with an experiment to ensure that all the potential reference species originated from a similar geographical area. Now, eDNA work is becoming more generally applied, as well as privatized and sold as a product, where methods and pipelines are made proprietary and hidden from peer review. This apparent advance of eDNA into wider commercial application means that biases which inevitably exist (as we have demonstrated) often remain hidden, and do not inform the appropriate interpretation of results. For example, we cannot verify whether under-represented or dark taxa are accounted for in the best possible way, how a chosen pipeline may influence the reported diversity and species composition, or how contamination from widely dispersed diaspores may be influencing results (Pauvert et al. Reference Pauvert, Buée, Laval, Edel-Hermann, Fauchery, Gautier, Lesur, Vallance and Vacher2019; Tedersoo et al. Reference Tedersoo, Bahram, Zinger, Nilsson, Kennedy, Yang, Anslan and Mikryukov2022; Rzehak et al. Reference Rzehak, Praeg, Galla, Seeber, Hauffe and Illmer2024; Vondrák et al. Reference Vondrák, Svoboda, Malíček, Šoun, Košnar, Svensson, Timdal, Machač and Palice2024).
The immediate future will still require building reference databases, testing various species assignment methods, and openly noting the limitations of the current state of this technology in capturing species diversity using eDNA. The testing of bioinformatic pipelines has been previously focused on mock community data (Bakker Reference Bakker2018). However, little research has yet been carried out in a field-scale setting to test recapture of traditional survey data using eDNA approaches (Banchi et al. Reference Banchi, Ametrano, Stanković, Verardo, Moretti, Gabrielli, Lazzarin, Borney, Tassan and Tretiach2018; Vondrák et al. Reference Vondrák, Svoboda, Malíček, Šoun, Košnar, Svensson, Timdal, Machač and Palice2024). Lichens provide a unique and suitable model in this case, since they are perennial and not dependent on ephemeral fruiting bodies to be present when surveying, although there is still important research to be done on the phenology of LAT and to understand if resampling is necessary to capture different species that disperse their spores differentially with season or weather conditions. These types of studies will reveal the capability of eDNA to complement, supplement or even replace traditional survey and monitoring methods, and to reveal the biases introduced from field sampling and wet-lab protocols through to the different reference database and pipeline choices (Supplementary Material Fig. S1). Through this case study, we have aimed to outline some of the existing gaps in the downstream parts of this process as a precautionary measure to the over-interpretation of eDNA for LAT, based on the current state of the art. Massive sequencing efforts remain necessary to avoid potentially erroneous results, which could be particularly serious where inferences are made for lichen conservation.
Although not addressed in this study, future work may want to identify potentially mislabelled records. This suggested safeguard would include tree building with other targeted taxa and outgroups to quality control and verify species assignment. Filling gaps and nearing a more complete reference database will also aid in this, since sequences will be easily comparable between species, and those that match can be readdressed afterwards. To this end, we have made all the raw data available. However, before this application to eDNA studies, one might consider applying filtering steps such as using only the full ITS, ITS1 or ITS2, adding outgroups, and potentially using SATIVA, a phylogenetically aware approach to correcting mislabelled sequences (Kozlov et al. Reference Kozlov, Zhang, Yilmaz, Glöckner and Stamatakis2016), or IDTAXA that uses machine learning for species assignments of sequences based on a reference taxonomy (Murali et al. Reference Murali, Bhargava and Wright2018).
Curating ITS and, eventually, other markers and even whole genomes will unveil much about lichen diversity that is unknown today. Previous studies have estimated that when expanding to look at the whole genome, there may be even more diversity than anticipated, which has hitherto been hidden by the narrow approach of amplicon-based sequencing (Keepers et al. Reference Keepers, Pogoda, White, Anderson Stewart, Hoffman, Ruiz, McCain, Lendemer, Kane and Tripp2019). In addition, much discussion has focused on SH-based species assignment and allowing DNA sequences to serve as types, especially for ‘dark taxa’ (Zamora et al. Reference Zamora, Svensson, Kirschner, Olariaga, Ryman, Parra, Geml, Rosling, Adamčík and Ahti2018; Nilsson et al. Reference Nilsson, Ryberg, Wurzbacher, Tedersoo, Anslan, Põlme, Spirin, Mikryukov, Svantesson and Hartmann2023; Tedersoo et al. Reference Tedersoo, Moghadam, Panksep, Prins, Anslan, Mikryukov, Bahram, Abarenkov, Kõljalg and Esmaeilzadeh-Salestani2025); this will help with stabilizing the recognition of such sequence types (ASVs, OTUs, or SHs) but will not necessarily be able to link to specimen-based taxonomy, which will, for some time, still be the foundation of conservation activities. Such a sequence-based taxonomy, for now, cannot meet the needs of all current research and underscores the need to curate high-quality reference databases for specific applications, especially those linking survey-based conservation to sequence diversity. Our current recommendation is to continue to sequence the missing species across the full ITS region (ITS1, 5.8S and ITS2), since eDNA work is ongoing and reference data are abundant.
Completing an ITS reference database for the British Isles will inform estimates of the scale of hidden taxonomic diversity and of poorly differentiated groups. In building a reference database, we point to the benefit of collaboration in creating a shared working practice through which barcoding can take place. In conjunction with the British Lichen Society, which has an active member base of expert field biologists, collections could be made by members and submitted for sequencing to simultaneously aid morphological identification and help populate a reference database, as has been proposed for several ongoing European initiatives including UNITE, Lost and Found Fungi (https://fungi.myspecies.info/content/lost-and-found-fungi-project) and FunDive (https://fun-dive.eu/en/home-2/), to name a few. Sequences and associated data would then be uploaded to BOLD, which we found to have the best metadata and image curation, and is already set up for future tracking of name changes linked to a physical specimen. Populating this database could begin with our proposed lists of priority lichens to sequence (300), which include species that have 1) threatened status, 2) taxonomic importance (i.e. from families that have never had a LAT taxon sequenced before), and 3) those that are abundant but have not been captured thus far. As a note to the curators of databases, they should consider compiling and making available complete versions of their data for users to access, with quality metadata. As scientists move towards more computational-based approaches and more extensive assessments with a broader focus on biodiversity, this will significantly aid research and save time (Van Nuland et al. Reference Van Nuland, Averill, Stewart, Prylutskyi, Corrales, van Galen, Manley, Qin, Lauber and Mikryukov2025). This study serves as a benchmark for future reference when investigating the diversity and taxonomy of lichens, the span of taxonomy representing foundational knowledge that scientists must refer to when generating and benefiting from growth in availability and scope of genetic information.
Our observations and recommendations
-
• eDNA has the potential to massively scale up the representation, accuracy and reproducibility of biodiversity monitoring, especially for understudied groups such as fungi; this is an exciting prospect.
-
• As demand grows for verifiable biodiversity data, a variety of approaches including proprietary methods of eDNA analysis are increasing; however, based on our case study of UK lichen-fungi we caution that:
-
○ there remains a huge gap between the list of species that have been sequenced and the listed species on the British Isles taxonomic checklist – eDNA studies cannot yet represent lichen diversity and if overinterpreted would be grossly misleading;
-
○ this leads to bias in the interpretation of eDNA data because of skewness with respect to the geography, growth form, ecology, and conservation status of species that have been sequenced;
-
○ to address potential bias, eDNA methods must be fully transparent about i) which gene regions were being used (multi-marker approaches being preferred), ii) which geographical regions the sequenced species represent (e.g. the UK, Europe or global), and iii) which databases provided reference sequences.
-
-
• We have suggested methods to overcome some of these gaps, including the creation and use of bespoke reference databases (according to FAIR principles; https://www.go-fair.org/fair-principles/) that are applicable to a given question/problem, and taxonomic-based phylogenetic placement of ambiguous sequences. As these reference databases are supplemented with new sequencing efforts, other considerations include the following guidelines for each additional entry:
-
○ specimen has been identified by credible experts;
-
○ specimen is stored in a herbarium that allows access for annotation or revision;
-
○ multiple records obtained for each known species concept to outline potential intraspecific variability.
-
-
• However, we note that sequencing for eDNA reference databases and taxonomy are closely linked, both in terms of the methods employed, and given the dependency of eDNA assignment and identification on accurate and updated taxonomy. At a time when the discovery of lichen diversity is rapidly developing; availability of sequences will almost always precede complete taxonomies for most groups.
-
• Future sequencing efforts should use these gap analysis methods in determining which species to sequence. Ideally they should include long-read sequencing of the full ribosomal subunit for poorly represented lineages. Long-read based metabarcoding will become the norm and offers a range of slow and fast-evolving markers for phylogenetic comparison.
Supplementary Material
The Supplementary Material for this article can be found at http://doi.org/10.1017/10.1017/S0024282926101480.
Author ORCID
Dylan Stephens, 0009-0007-5085-5436.
Data Availability
Data and scripts are available at the following https://github.com/dylanstephen-s/British-Lichenized-and-Associated-Taxa-Barcodes



 Open access

