





Introduction
Tropical forests profoundly influence biodiversity, weather patterns, freshwater, natural disasters, food and human health on a scale greater than any other terrestrial biome (Brandon Reference Brandon2014). Tropical forests are specifically very high in species richness, with one study, for example, finding more tree species in less than one kilometre of Malaysia than in the United States and Canada combined (Myers Reference Myers1996; Brandon Reference Brandon2014). Climate change, through alteration of the structure and function of ecosystems, is one of the most severe threats to biodiversity (Weiskopf et al. Reference Weiskopf, Rubenstein, Crozier, Gaichas, Griffis, Halofsky, Hyde, Morelli, Morisette and Muñoz2020). Current rates of biodiversity loss fit within the range of a sixth major mass extinction (Barnosky et al. Reference Barnosky, Matzke, Tomiya, Wogan, Swartz, Quental, Marshall, McGuire, Lindsey and Maguire2011; Rull Reference Rull2022). Climate change-driven alterations to the structure of tropical forests have major implications for its native species, particularly for smaller, sessile organisms such as vascular and non-vascular plants as well as lichens (Nadkarni & Solano Reference Nadkarni and Solano2002). As such, understanding how organisms interact with their microclimates is increasingly important in interpreting the impacts of a changing climate and helping to guide conservation efforts (Chen et al. Reference Chen, Paw U, North and Franklin2024).
Lichens are photosynthetic, obligate symbiotic organisms composed of a fungal partner (the mycobiont) and at least one photosynthetic partner (the photobiont), which is usually a green alga but also may be a cyanobacterium (Nash Reference Nash1996). Lichens exhibit intriguing variation in morphology, physiology and ecology, which can be estimated via unique functional traits, thereby allowing this symbiosis to adapt to a wide range of natural environments, including extreme conditions (Armstrong Reference Armstrong, Shukla, Kumar and Kumar2017). Lichens are fundamental to processes of nutrient cycling, microclimate regulation and biodiversity maintenance in most terrestrial ecosystems (Freiberg Reference Freiberg1997; Seaward Reference Seaward and Nash2008; Stanton et al. Reference Stanton, Huallpa Chávez, Villegas, Villasante, Armesto, Hedin and Horn2014). Yet despite their ecological importance, lichens are understudied organisms, particularly in the tropics where a large portion of the biota has yet to be formally named and described (Aptroot Reference Aptroot1997; Sipman Reference Sipman1999; Lumbsch et al. Reference Lumbsch, Ahti, Altermann, Amo de Paz, Aptroot, Arup, Bárcenas Peña, Bawingan, Benatti and Betancourt2011). Understanding mechanisms that facilitate the existence of species spatially is imperative if we are to preserve the important ecological services that lichens provide.
Wet tropical forests present a unique set of challenges for epiphytic, foliose lichens, including competition for light from the canopy and other epiphytes, and maintaining high metabolic rates under water saturation (Lange et al. Reference Lange, Büdel, Meyer, Zellner and Zotz2004; Lakatos et al. Reference Lakatos, Rascher and Büdel2006; Malhi Reference Malhi2012; Armstrong Reference Armstrong, Shukla, Kumar and Kumar2017). The mechanisms employed by epiphytic foliose lichens in adapting to these forest understorey conditions are poorly understood. In contrast to vascular plants, which have developed the capacity to maintain the water status of their leaves at constant levels (and are therefore homiohydric), the water status of lichens varies passively with the surrounding environmental conditions (a condition termed poikilohydric) (Proctor & Tuba Reference Proctor and Tuba2002). While the initiation and maintenance of metabolic activity in the photobiont and mycobiont require that water be taken up and stored in the lichen thallus, the swelling of fungal hyphae by extracellular water, consequent on hydration, impedes the diffusion of CO2 to the photobiont and decreases the metabolic rate of both partners (Lange & Tenhunen Reference Lange and Tenhunen1981; but see Snelgar et al. Reference Snelgar, Green and Beltz1981). This establishes a trade-off experienced by lichens wherein the maximum net photosynthetic rate is achieved at some intermediate relative water content (RWC) (Lange & Tenhunen Reference Lange and Tenhunen1981; Stanton et al. Reference Stanton, Ormond, Koch and Colesie2023). At too low RWC, the efficiency of photosynthesis is reduced, and at too high RWC, photosynthesis is limited by the slow rate of CO2 diffusion through the saturated hyphal tissue of the cortices and, to some degree, the medulla (Lange & Tenhunen Reference Lange and Tenhunen1981). Managing this trade-off is particularly important for lichens in wet tropical forests where metabolic rates are high and light levels low (Malhi Reference Malhi2012).
In acclimating to myriad environments with diverse water regimes, lichens have employed different mechanisms that influence their water relations, salient among these being 1) the rate at which water is taken up and 2) lost and 3) the amount of water that is stored at saturation (water holding capacity (WHC)) (Green & Lange Reference Green and Lange1991). Morphological-functional traits of lichens influence each of these metrics. For example, specific thallus mass (STM) is positively correlated with WHC, which together impact drying and rewetting cycles and ensure that the hydrophobic medulla remains air-filled during saturating conditions to facilitate gas exchange (Wan & Ellis Reference Wan and Ellis2020; Di Nuzzo et al. Reference Di Nuzzo, Canali, Giordani, Nascimbene, Benesperi, Papini, Bianchi and Porada2022). Thus, lichens with higher STM may not only store more water for longer periods but may also allow prolonged periods of favourable internal carbon dioxide concentrations to their algal colonies, at the expense of lateral growth and rapid rehydration via water vapour (Gauslaa et al. Reference Gauslaa, Solhaug and Longinotti2017; Phinney et al. Reference Phinney, Solhaug and Gauslaa2018). Ecophysiological theory predicts that lichens with certain combinations of traits are more suited for specific environmental conditions than others (Stanton et al. Reference Stanton, Ormond, Koch and Colesie2023). One hypothesized adaptive trait of lichens in wet, highly productive environments is the pored cortex, which may facilitate gas exchange and dissipate excess water (Hale Reference Hale1981), in a similar way to stomata in vascular plants (Haworth et al. Reference Haworth, Elliott-Kingston and McElwain2013).
Pseudocyphellae are the most common form of pored cortices (Hale Reference Hale1981). Pseudocyphellae are pores in the upper or lower cortex of some lichens, and they first appear as a microscopic disintegration of the cortex, developing close to the growing tip and reaching their maximum size in 2–3 years (Hale Reference Hale1981). They are thought to lower gas diffusion resistance of the cortex and may act as pathways for gas diffusion into the thalli, as the structures are hydrophobic (Snelgar Reference Snelgar1981; Snelgar et al. Reference Snelgar, Green and Beltz1981). Pseudocyphellae do not yield a monophyletic group and have independently evolved several times across the lichen tree of life (Divakar et al. Reference Divakar, Kauff, Crespo, Leavitt and Lumbsch2013). Hale (Reference Hale1981) hypothesized that the cortex begins to break down and form pseudocyphellae at particular sites where gas exchange is poor, suggesting that moisture conditions dictate pseudocyphellae traits. Pintado et al. (Reference Pintado, Valladares and Sancho1997) investigated the acclimative responses of pseudocyphellae to microclimate conditions and found a higher density of these structures in wetter microclimates. Numerous other studies have also investigated the ecophysiological role of pseudocyphellae in temperate rainforests (Snelgar Reference Snelgar1981; Snelgar et al. Reference Snelgar, Green and Beltz1981; Green et al. Reference Green, Snelgar, Wilkins and Brown1985). Although pseudocyphellae have been studied in Mediterranean and temperate rainforest climates, their putative ecological functions have not been studied in tropical rainforests, representing a large gap in lichen research. Specifically, it is not yet known whether and how pseudocyphellae are influenced by environmental factors in tropical habitats; however, one study has quantified the effect of tropical microhabitats on a similar structure, cyphellae, which occur in the genus Sticta Schreb., reporting that cyphellae density displayed a positive relationship with elevation in six of eight species studied (Pérez-Quintero & Watteijne Cerón Reference Pérez-Quintero and Watteijne Cerón2009). A commonly utilized method to estimate the relationships between organisms and their microclimates is the assessment of functional traits (Ellis et al. Reference Ellis, Asplund, Benesperi, Branquinho, Di Nuzzo, Hurtado, Martínez, Matos, Nascimbene and Pinho2021) Thus, understanding how environmental variation drives pseudocyphellae size and density in lichens may provide a tool for microclimate monitoring in a rapidly changing climate.
To characterize relationships between pseudocyphellae, thallus traits, and varying water availabilities in a tropical forest, we examined variation in drying rate in the pseudocyphellate green algal lichen Crocodia aurata (Ach.) Link from three sites with distinct precipitation levels situated along an elevational gradient. We addressed two questions. We first asked, is drying rate (as estimated by k) in Crocodia aurata modulated by the environment? Second, which functional traits, if any, best predict drying rate? We hypothesized that, consistent with ecophysiological theory, the drying rate of Crocodia aurata would be modulated by water regimes along this natural wetness gradient such that populations collected from wetter environments would lose water faster to maintain favourable internal water statuses. We also hypothesized that pseudocyphellae size and density, along with traditionally measured thallus traits, would drive differences in k between wet and dry habitats. Therefore, we predicted that: 1) C. aurata collected from three sites with distinct precipitation regimes along an elevational gradient would exhibit a positive correlation between moisture availability and drying rate (i.e. lichens from wetter sites will dry faster); 2) individuals with larger pseudocyphellae and greater pseudocyphellae density will exhibit faster drying rates; 3) traditionally measured thallus traits will have negative correlations with drying rate, consistent with previous studies (Snelgar et al. Reference Snelgar, Green and Beltz1981; Kershaw Reference Kershaw1985; Gauslaa & Solhaug Reference Gauslaa and Solhaug1998; Hartard et al. Reference Hartard, Cuntz, Máguas and Lakatos2009; Gauslaa et al. Reference Gauslaa, Solhaug and Longinotti2017; Ås Hovind et al. Reference Ås Hovind, Phinney and Gauslaa2020).
Materials and Methods
Study site and collections
We investigated Crocodia aurata, a widespread, charismatic, foliose, green algal lichen that bears bright yellow marginal soralia and conspicuous yellow, dorsiventral pseudocyphellae (Fig. 1). Its striking characteristics mean that C. aurata is easily identifiable in the field.
A, living Crocodia aurata (Peltigeraceae) lichen growing in Monteverde, Costa Rica. B, pressed specimen of C. aurata (Peltigeraceae) from Monteverde, Costa Rica. The lower cortex with pseudocyphellae exposing the bright yellow medulla. Scales: A = 5 mm; B = 2 mm. In colour online.

This study was conducted in the Pacific slope of Monteverde, Puntarenas, Costa Rica, where climate is driven by the Intertropical Convergence Zone, orographic effects, cold fronts, and tropical storms (Hernández-Abrams et al. Reference Hernández-Abrams, Connelly, Freeman, Gutiérrez-Fonseca and Wenger2023). A marked dry season occurs between February and April annually, the wet season occurs between May and October, and a transitional season between November and January (Clark et al. Reference Clark, Lawton, Butler, Wheelwright and Nadkarni2000).
We collected Crocodia aurata specimens at three study sites along an elevational gradient. The low-elevation site (~1100 m; 10°17′02″N, 84°48′00″W) is located at Los Altos de San Luis and receives c. 2000–2500 mm of annual precipitation, with a dry season lasting 5–6 months (Haber et al. Reference Haber, Zuchowski and Bello2000). The mid-elevation site (~1450 m; 10°18′51″N, 84°48′31″W) is located in Monteverde; although precipitation data are not available for this exact location, annual precipitation of 2500–3500 mm and a dry season of 5 months have been reported for similar elevations on the Pacific slope of Monteverde (Timm & LaVal Reference Timm, LaVal, Nadkarni and Wheelwright2014). The high-elevation site (~1650 m; 10°19′03″N, 84°48′13″W), also located in Monteverde, receives c. 3000–5000 mm of annual rainfall and has a dry season of 3 months (Haber et al. Reference Haber, Zuchowski and Bello2000; Timm & LaVal Reference Timm, LaVal, Nadkarni and Wheelwright2014).
On the Pacific slope of Monteverde, precipitation increases predictably with elevation. Our three collection sites are located on this slope and span the entire elevational range over which C. aurata has been observed at this locality.
Data collection took place between 11 March–21 April 2024. From each site, 20 specimens of Crocodia aurata (Fig. 1) were collected, totalling 60 lichen voucher specimens. Lichens were identified in the field using lower cortex and soralia characteristics following Smith et al. (Reference Smith, Aptroot, Coppins, Fletcher, Gilbert, James and Wolseley2009). All lichen specimens were collected from trees or freshly fallen wood, taking care not to damage the thallus or gather extraneous substratum which would influence trait estimation. Samples from the low site were collected along trails on the CIEE-Monteverde campus and those from the middle and high sites were collected along the trail leading up to the Monteverde Biological Station. Very old, very young, or unhealthy thalli were not collected. Individual lichen collections were stored in paper bags and transported to the laboratory at CIEE-Monteverde for further analysis. A voucher specimen of C. aurata, representative of the population, was deposited at the Herbario Nacional de Costa Rica (CR; Thiers Reference Thiers2026).
Functional traits
Drying rates and related functional traits
In order to calculate lichen drying rates, we conducted drying curves in a climate-controlled laboratory setting (20 °C and ~40% relative humidity) to standardize the evaporative environment across all samples. While these conditions do not replicate the microclimate at each site, they provide a consistent drying environment that allows differences in drying rate to be isolated independent of short-term environmental variability. To ensure proper desiccation prior to calculating drying curves, lichens were left to dry in this climate-controlled laboratory for 72 h. To ensure accurate thallus weight measurements, all substratum (i.e. bark, moss, soil) was carefully removed from the lower surface of each collection, using a Zeiss Stemi 305 stereomicroscope (Oberkochen, Germany). Following substratum removal, thickness of the dry thallus (thallus thickness; TT), from an estimated central point, was measured with a caliper to 100th of a millimetre. The dry weight of each thallus was estimated to the 1000th of a gram using an H-I-L-M series Optika scale (Bergamo, Italy). The specific thallus mass (STM) (Eq. 1), expressed in g cm−2, was derived using the dry thallus area and dry weight of each lichen according to the standard equation in Gauslaa et al. (Reference Gauslaa, Solhaug and Longinotti2017). To saturate the thallus, specimens were submerged in a beaker of water for 2 min (Nash Reference Nash1996; Wan & Ellis Reference Wan and Ellis2020). Each specimen was then pat-dried to remove surface water, placed on a drying rack with the lower cortex facing down, and then periodically weighed to conduct thallus drying curves (Ås Hovind et al. Reference Ås Hovind, Phinney and Gauslaa2020). The water holding capacity (WHC) (Eq. 2) was derived from the weight of the fully saturated thalli, measured immediately following the removal of excess water, and the dry thallus weight, according to the standard equation given in Volkova et al. (Reference Volkova, Volkov, Morozova, Nikitkin, Vishnyakova and Mironycheva-Tokareva2023). Following saturation, each thallus was weighed every 10 min until the weight reached an asymptote. The asymptote of each sample was determined by three consecutive non-changing weight values. The relative water content (RWC) (Eq. 3) of each thallus was calculated from the water weight at time t = 0 minus the water weight at time t/water weight at time t = 0, following the standard equation given in González & González-Vilar (Reference González, González-Vilar and Reigosa Roger2001). Page’s model (Eq. 4) was employed to fit the drying curve for each individual and the k value, which is a decay rate constant expressed in (RWC min–1), extracted as a proxy for drying rate. Specimens that did not fit this model (fast-drying individuals; n = 10) were instead evaluated using a linear model to estimate drying rate. Page’s model was chosen because it is widely used as a decay model in drying curves of plants; however, its application to lichen drying rates represents a novel approach (Page Reference Page1949). This equation overcomes shortcomings of exponential models by introducing the exponent ‘n’, which allows the model to better explain the drying patterns of plants that often do not dry according to a basic exponential decay model (Simal et al. Reference Simal, Femenia, Garau and Rosselló2005). The equation was altered to better explain the drying rates of lichens by setting Me to 0, when lichens are completely dry.


where M0 is the initial moisture content, Me is the equilibrium moisture content, M(t) is the moisture content at time (t), t is the time in minutes, n is the Page experimental constant, and k is the drying rate constant where time is expressed in min−1.
Pseudocyphellae and thallus area
Following the drying curves, lichens were saturated with water again and then pressed using a plant press to flatten the thallus to later ensure that all the pseudocyphellae could be accurately measured. First, to document the total area of each thallus, images of each lichen thallus were taken next to a mm ruler. ImageJ was used to measure the total area of each thallus. Second, a random 0.25 cm2 area was chosen on each thallus and images of these regions were taken utilizing a Zeiss Stemi 305 stereomicroscope (Oberkochen, Germany). The number of pseudocyphellae within this area was counted and scaled to 1 cm2 to estimate the average number of pseudocyphellae per cm2. To assess pseudocyphella size, we randomly selected 10 pseudocyphellae per thallus and calculated the area of each by tracing their perimeters in ImageJ (https://imagej.net/ij/).
Statistical analysis
Part 1. Is drying rate in Crocodia aurata modulated by the environment?
The effects of the environment on drying rates were evaluated using the k values extracted from the drying curve. The k values for the individuals were grouped by site (n = 20) and an Analysis of Variance (ANOVA) was run in order to test if k varied by site. Following the ANOVA, a Tukey test was performed to determine which sites differed significantly from one another.
Part 2. Which functional traits best predict drying rate?
Following the analysis of drying rates, six observed functional traits were evaluated for their strength of correlation with drying rates: STM, WHC, thallus area, thallus thickness, pseudocyphellae density, and pseudocyphella size.
A linear mixed-effects model including all functional traits (fixed effects) and site (random effect) was fitted to predict k (response variable) using the ‘lme()’ function from the nlme package in R (Pinheiro et al. Reference Pinheiro and Bates2025). To specifically evaluate the contribution of pseudocyphellae traits, a second linear mixed-effects model was fitted with pseudocyphella size and density as fixed effects and site as a random effect. The significance of the mixed effects was assessed, and P-values and t-values were extracted. The R 2 values for the mixed-effect models were then found using the performance package in R (Lüdecke et al. Reference Lüdecke, Ben-Shachar, Patil, Waggoner and Makowski2021).
Individual mixed-effects models were performed between k and each trait that was significant in the overall model, with site included as a random effect. The ‘regsubsets()’ function of the leaps package in R was then used to find the best combination of thallus variables that predicted lichen drying rates (k) (Lumley Reference Lumley2024). The performance package in R was used to measure collinearity between the thallus variables (Lüdecke et al. Reference Lüdecke, Ben-Shachar, Patil, Waggoner and Makowski2021). The thallus trait with the highest
${R}^2$
 value was determined, and an ANOVA test was performed to compare this trait across the three sites. All analyses were performed in R v. 4.3.1 (R Core Team 2023).
Results
Functional trait variation in thalli of Crocodia aurata across a precipitation gradient
Part 1. Is drying rate in Crocodia aurata modulated by the environment?
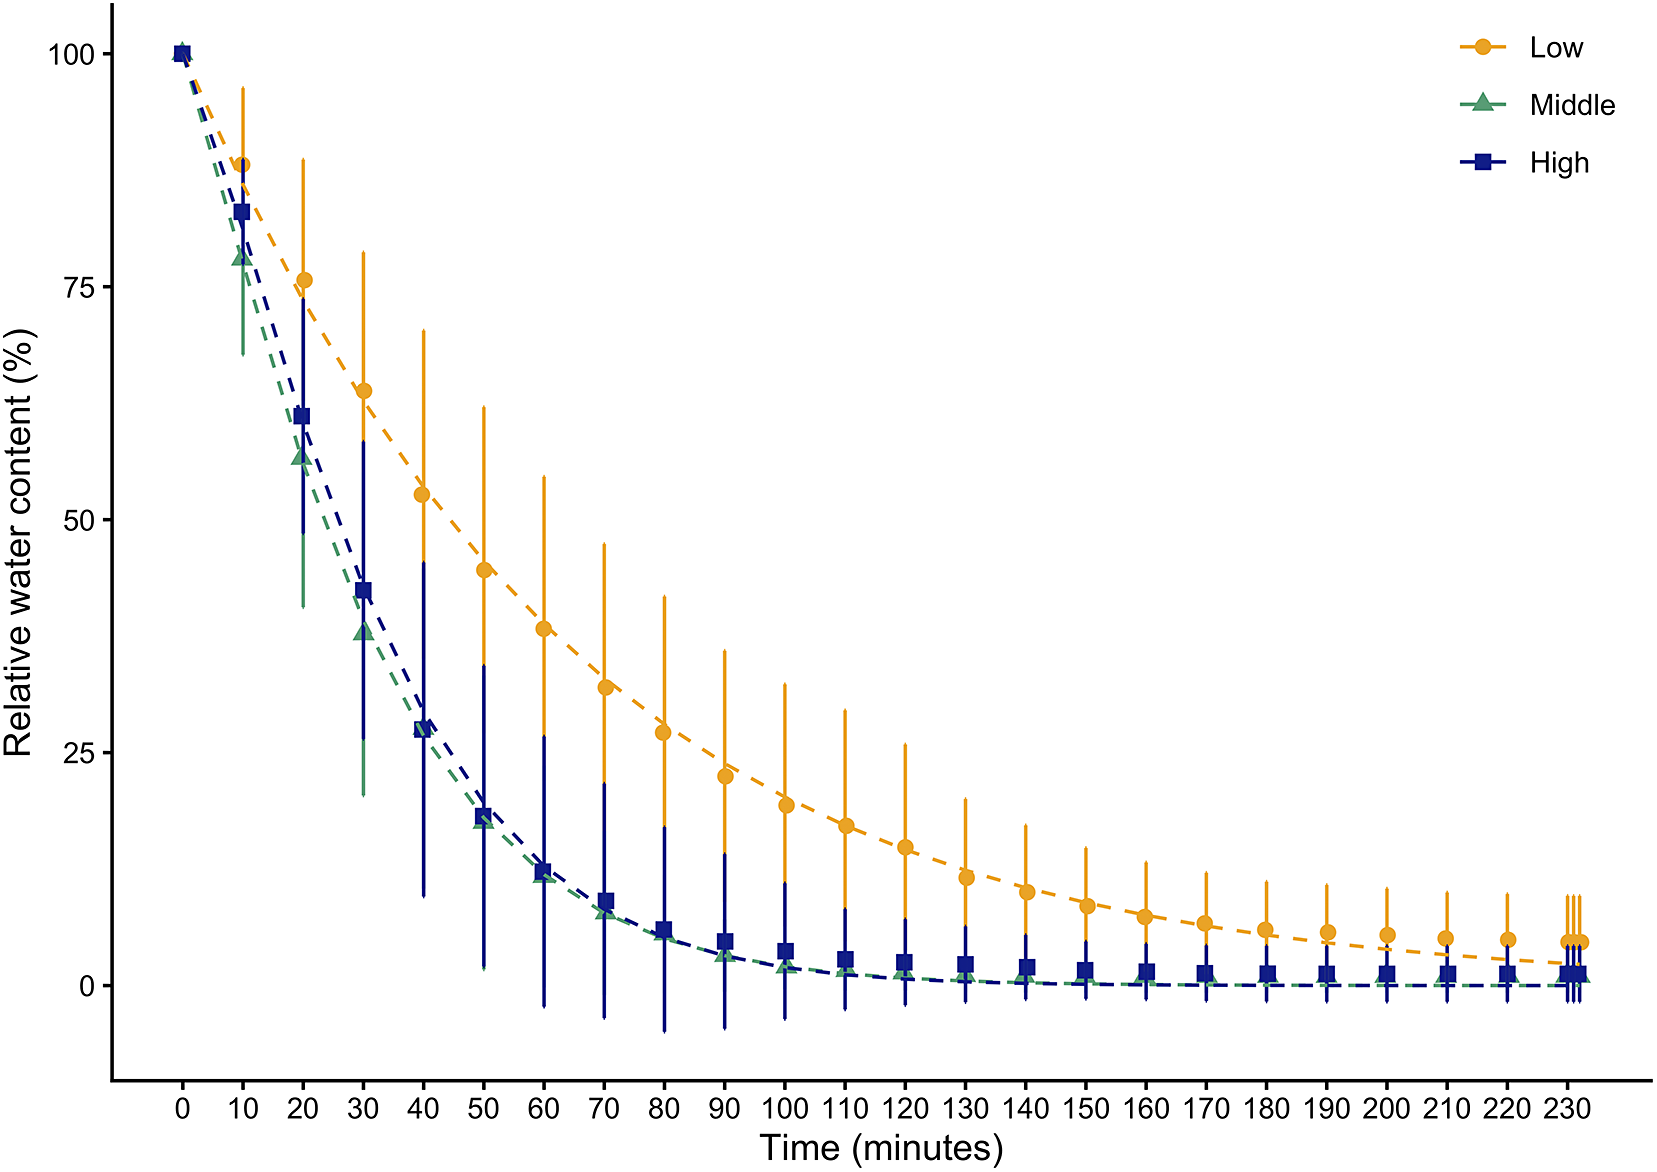
The drying rates (k) of the Crocodia aurata specimens along the three sites ranged from 0.00912 to 0.0583, and the average was 0.0282. The mean drying rates (k) of the low, middle and high elevation sites were 0.0180, 0.0352 and 0.0313, respectively. An ANOVA revealed that the drying rate of specimens differed significantly amongst sites (F = 13.5, df = 2; P < 0.001) (Fig. 2). The two higher elevations (middle and high) dried at faster rates than samples from the lowest (low). Specimens from the middle and high elevation sites did not differ significantly in their drying rates (P = 0.515).
Drying curves of Crocodia aurata (Peltigeraceae) (n = 20) across three sites at different elevations in Monteverde, Costa Rica: low (orange), middle (green) and high (blue). Error bars show ± 1 SD among thalli within each site. Dashed lines show fitted Page’s drying models. In colour online.

Figure 2. Long description
A line graph with the Y-axis labeled Relative water content percentage from 0 to 100 and the X-axis labeled Time minutes from 0 to 230 in increments of 10.
Three data series are plotted with dashed lines representing fitted models and markers with vertical error bars representing S D.
* Low elevation orange circles: Shows the slowest decay. Water content drops from 100 percent at 0 minutes to approximately 50 percent at 45 minutes, reaching a near-asymptotic floor of roughly 5 percent by 230 minutes.
* Middle elevation green triangles: Shows rapid initial decay. Water content drops to 50 percent within approximately 25 minutes and reaches near 0 percent by 120 minutes.
* High elevation blue squares: Follows a nearly identical rapid decay path to the middle elevation, dropping to 50 percent by 25 minutes and stabilizing near 0 percent after 120 minutes.
Vertical error bars are largest for all groups between 10 and 80 minutes, indicating higher variance in drying rates during the initial phase of water loss.
Part 2. Which functional traits best predict drying rate?
Of the six functional traits measured in this study, four were found to be correlated with drying rates of Crocodia aurata: thallus thickness, STM, WHC and thallus area. Across all sites, the average thallus area was 6.10 cm (± 4.17). Pseudocyphellae related traits (size and density) were not significant predictors of drying rate in the full mixed-effect model, nor did they vary between sites (P = 0.594, P = 0.183, respectively). Similarly, in the pseudocyphellae-specific model, neither size nor density was significantly correlated with drying rates (P = 0.073, P = 0.1840, respectively). Across all specimens, the average pseudocyphella size was 0.001 cm2 (± 0.0005 SD). The average pseudocyphellae density was 209 pseudocyphellae per cm2 (± 66.8 SD).
Trait-specific linear mixed-effects models showed significant correlations between k and thallus thickness, STM, WHC and thallus area. According to the mixed effects model, the variable most strongly correlated with drying rate (k) was thallus thickness (t = –5.00, df = 56; P < 0.001), followed by STM (t = –4.98, df = 56; P < 0.001), WHC (t = –3.12, df = 56; P = 0.00280) and thallus area (t = –3.20, df = 56; P = 0.00230) (Fig. 3). The R 2 of the mixed effects for thallus thickness, STM, WHC and thallus area were 0.483, 0.551, 0.403 and 0.417, respectively.
Mixed effect linear models of the significant thallus variables (water holding capacity (WHC), thallus thickness, thallus area, specific thallus mass (STM)) and the drying rate constant (k) of the lichen Crocodia aurata (Peltigeraceae) in Monteverde, Costa Rica. Data from specimens of C. aurata (n = 60) across three sites at different elevations are shown: low, middle and high.

Figure 3. Long description
A four-panel scatter plot arrangement labeled A through D. All panels share a common y-axis representing k (Drying rate constant) with a scale from 0.01 to 0.06.
* Panel A: The x-axis is Water holding capacity (%) ranging from 150 to 400. Data points show a negative linear trend with an adj. R super 2 of 0.188.
* Panel B: The x-axis is Thallus thickness (m m) ranging from 0.2 to 0.6. Data points show a negative linear trend with an adj. R super 2 of 0.358.
* Panel C: The x-axis is Thallus area (c m super 2) ranging from 5 to 20. Data points show a negative linear trend with an adj. R super 2 of 0.179.
* Panel D: The x-axis is Specific thallus mass (g c m super -2) ranging from 0.010 to 0.030. Data points show a negative linear trend with an adj. R super 2 of 0.229.
In all panels, the regression line slopes downward from left to right, indicating that as thallus physical dimensions or capacity increase, the drying rate constant decreases. Most data points are clustered at the lower end of the x-axis scales.
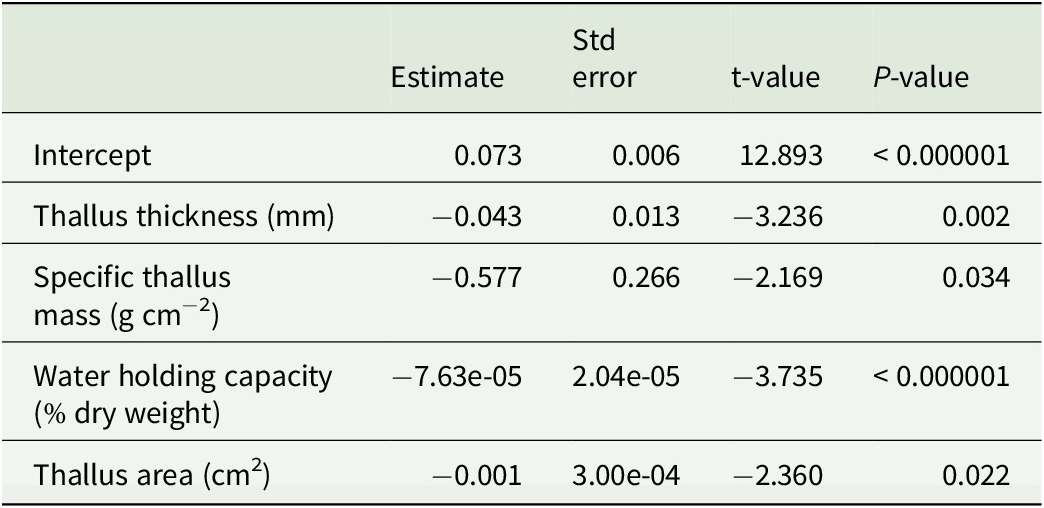
Best subsets model selection was implemented to obtain the best linear model to explain k from functional traits. The best linear model included four variables: thallus thickness, STM, WHC and thallus area (F = 18.27, df = 2; adj. R 2 = 0.539; P = < 0.001) (Table 1). Low collinearity was found between these traits, with an average Pearson correlation coefficient of 0.253 and the highest value being 0.500 (thallus thickness and STM).
Coefficients and statistics of the best linear model of hydration-related traits to predict drying rate (k) of the lichen Crocodia aurata (Peltigeraceae) in Monteverde, Costa Rica.

Table 1. Long description
The table consists of five columns: Variable, Estimate, Std error, t-value, and P-value.
* Intercept: Estimate 0.073, Std error 0.006, t-value 12.893, P-value less than 0.000001.
* Thallus thickness (mm): Estimate minus 0.043, Std error 0.013, t-value minus 3.236, P-value 0.002.
* Specific thallus mass (g cm super minus 2): Estimate minus 0.577, Std error 0.266, t-value minus 2.169, P-value 0.034.
* Water holding capacity (percent dry weight): Estimate 0.000, Std error 0.000, t-value minus 3.735, P-value less than 0.000001.
* Thallus area (cm super 2): Estimate minus 0.001, Std error 0.000, t-value minus 2.360, P-value 0.022.
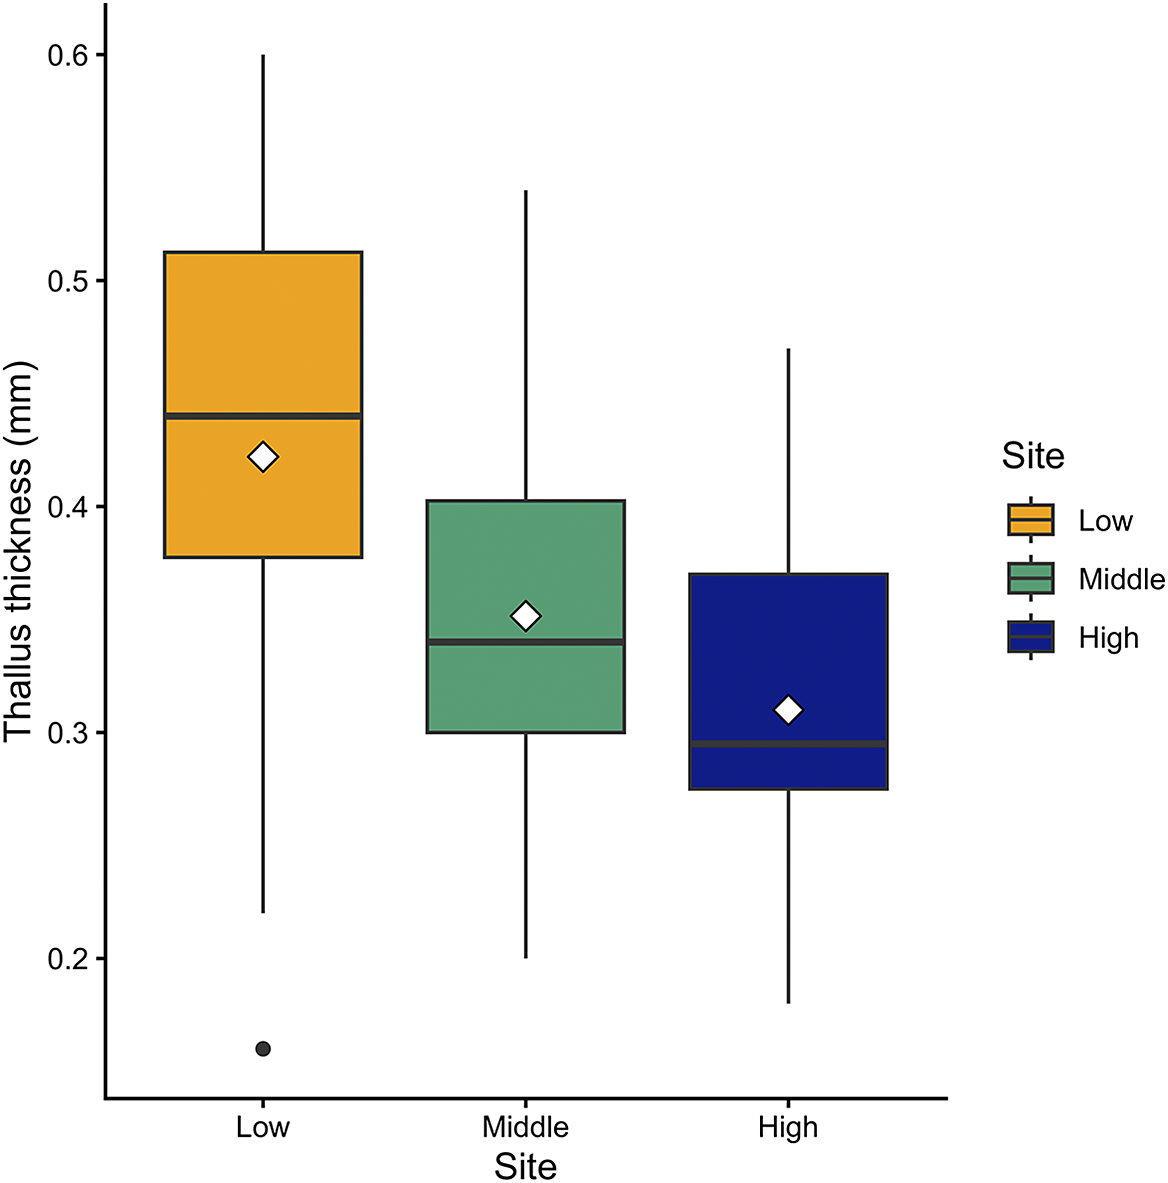
Thallus thickness, the most significant predictor variable of drying rate, decreased with increasing elevation of study sites. An ANOVA showed significant differences in thallus thickness across sites (F = 6.92, df = 2; P = 0.0020). A post-hoc Tukey HSD test showed marginally significant differences in thallus thickness between middle and low sites (P = 0.0620), significant differences between high and low sites (P = 0.00150), and no significant difference in thallus thickness between middle and high (P = 0.3670) (Fig. 4).
Thallus thickness (mm) of the lichen Crocodia aurata (Peltigeraceae) across three sites at different elevations in Monteverde, Costa Rica. Low elevation (orange), middle elevation (green) and high elevation (blue). White diamonds indicate means. In colour online.

Figure 4. Long description
A box plot with the y-axis labeled Thallus thickness in m m, ranging from 0.2 to 0.6. The x-axis is labeled Site with three categories.
1. Low elevation site. An orange box with a median line at approximately 0.44 m m and a white diamond mean marker slightly below the median. The whiskers extend from 0.22 to 0.60 mm. A single outlier dot is located at approximately 0.16 mm.
2. Middle elevation site. A green box with a median line at approximately 0.34 mm and a white diamond mean marker slightly above the median. The whiskers extend from 0.20 to 0.54 mm.
3. High elevation site. A dark blue box with a median line at approximately 0.30 mm and a white diamond mean marker slightly above the median. The whiskers extend from 0.18 to 0.47 mm.
A legend to the right titled Plot identifies the colors. Orange represents Low, green represents Middle, and dark blue represents High. The overall trend shows that both median and mean thallus thickness decrease as elevation increases.
Discussion
Results of this study showed that specimens of Crocodia aurata, a pseudocyphellate chlorolichen that is abundant in the Neotropics (Fig. 1), from wetter sites dried significantly faster compared to specimens from drier sites (Fig. 2). This is consistent with ecophysiological theory wherein faster-drying lichens maintain intermediate levels of thallus hydration in wetter habitats, optimal to maximize net photosynthesis (Stanton et al. Reference Stanton, Ormond, Koch and Colesie2023). Of the functional traits measured here, thallus thickness and STM were the two strongest predictors of drying rate (Fig. 3). Pseudocyphellae traits (size and density) were not significantly correlated with drying rates. Together, these results demonstrate that populations of C. aurata acclimate locally (site-scale) to differences in water regimes through the alteration of thallus thickness (Fig. 4) rather than modulation of pseudocyphella size and density. The present study represents a novel quantification of pseudocyphellae because it pertains to environmental parameters in tropical lichens, an area that has been little explored in prior studies.
Contrary to our hypothesis, pseudocyphellae characteristics (size, density) did not significantly influence drying rates. This suggests that pseudocyphellae may be influenced by evolutionary history or other environmental factors not assessed in this study. This contrasts with a previous study on pseudocyphellae which found that wetter microclimates harboured a higher density of pseudocyphellae, in the lichen Ramalina capitata (Ach.) Nyl., in a Mediterranean region (Pintado et al. Reference Pintado, Valladares and Sancho1997). This indicates that the acclimative role of pseudocyphellae may differ between lichen species and/or climate type. Studies on cyphellae, a functionally analogous structure, have reported mixed patterns in their response to environmental conditions. For example, Pérez-Quintero & Watteijne Cerón (Reference Pérez-Quintero and Watteijne Cerón2009) found, in a similar habitat to the current study, that cyphellae density in six of eight species of Sticta remained the same across 490 m of elevation, although positive relationships were observed in S. andensis (Nyl.) Trevis. and S. gyalocarpa (Nyl.) Trevis. In that study, the authors also did not recover any significant relationship between elevation and cyphella size in all eight species, consistent with our findings. This study suggests that, based on the limited studies conducted, cyphellae may more commonly acclimate to changes in water availability whereas pseudocyphellae may be less responsive to these changes. One possible explanation is that pseudocyphellae may represent an evolutionarily variable trait, the original function of which has been lost or diminished in some lineages. Pseudocyphellae have been independently evolved and lost several times in lichens, suggesting that they may not always have an active role in modulating gas exchange (Divakar et al. Reference Divakar, Kauff, Crespo, Leavitt and Lumbsch2013). Therefore, in this context, pseudocyphellae in Crocodia aurata may exist as a historical trait rather than a primary modulator of water content.
In addition to pseudocyphellae, we also investigated the role of traditionally measured thallus traits in driving drying rates in Crocodia aurata. Similar to the findings of others, we found that thallus thickness and STM were strongly correlated with drying rates. Thinner thalli were found to dry quicker (Fig. 3), consistent with the findings of Gauslaa & Solhaug (Reference Gauslaa and Solhaug1998), who found thicker thalli have a higher WHC in the cyanolichen Degelia plumbea (Lightf.) P.M. Jørg. & P. James. Hartard et al. (Reference Hartard, Cuntz, Máguas and Lakatos2009) also found that thinner thalli often lose water more quickly. This further suggests that some lichens may develop thinner thalli to prevent prolonged wetness, which could lead to metabolic impairment (Snelgar et al. Reference Snelgar, Green and Beltz1981). This could be an adaptive strategy to increase metabolic efficiency in wetter environments by ensuring efficient CO2 diffusion to the photobiont and reducing time spent respiring. STM historically has been used as a proxy for thallus thickness, which often shapes a lichen’s ability to store water (Gauslaa & Coxson Reference Gauslaa and Coxson2011; Esseen et al. Reference Esseen, Olsson, Coxson and Gauslaa2015; Eriksson et al. Reference Eriksson, Gauslaa, Palmqvist, Ekström and Esseen2018; Ås Hovind et al. Reference Ås Hovind, Phinney and Gauslaa2020). Several studies have reported that both thick thalli and high STM are correlated with slower drying rates, allowing for extended hydration (Gauslaa et al. Reference Gauslaa, Solhaug and Longinotti2017; Ås Hovind et al. Reference Ås Hovind, Phinney and Gauslaa2020). This is consistent with our findings, since the individuals with thicker thalli and higher STM dried slower. Other functional thallus characteristics are lesser known, such as the hydrophobicity of the medulla (due to the production of hydrophobins), secondary metabolite concentrations in the cortex and medulla, hydrophilic b-glucan secretion in the cortex, and cytoplasmic gas bubbles, which may be important in maintaining gas balances in lichens (Brown et al. Reference Brown, Rapsch, Beckett and Ascaso1987; Scheidegger Reference Scheidegger1994; Honegger Reference Honegger1995, Reference Honegger, Carroll and Tudzynski1997; Scheidegger et al. Reference Scheidegger, Schroeter and Frey1995; Honegger et al. Reference Honegger, Peter and Scherrer1996; Armaleo et al. Reference Armaleo, Zhang and Cheung2008). This still incomplete list of traits demonstrates the immensely complex adaptive traits that lichens have deployed to balance water retention necessary for photosynthetic activity with the need to avoid oversaturation, which is essential to the success of the symbiosis (Lange & Tenhunen Reference Lange and Tenhunen1981).
Since the lichen thallus is a single metabolically integrated body, in which carbon, water and nutrients are exchanged among tissues, other common structures may also contribute to water and carbon balance in lichens. For example, isidia (corticate asexual lichenized propagules found in many lichen species) may serve two functions. The most obvious is in asexual reproduction (Honegger Reference Honegger1998), but limited available evidence also suggests an alternative function, which is to facilitate increased assimilation, WHC and CO2 diffusion. Isidia assimilate CO2 at higher rates than the surrounding thallus tissue (Honegger Reference Honegger1998; Tretiach et al. Reference Tretiach, Crisafulli, Pittao, Rinino, Roccotiello and Modenesi2005). The formation of a thick layer of isidia increases the WHC of the thallus by storing water in the capillary spaces between isidia, while the isidia remain free of liquid water and can assimilate CO2 without resistance caused by the presence of liquid water (Tretiach et al. Reference Tretiach, Crisafulli, Pittao, Rinino, Roccotiello and Modenesi2005). Soredia, maculae and rhizines are other common structures not usually considered from an ecophysiological perspective; therefore, their study might provide useful insights into the physiology of C. aurata.
The lack of evidence for the importance of pseudocyphellae in drying rates in this study may be an artifact of the small scale of the study (mesoscale). Very little is known about how the size and density of these structures vary along large climatic gradients or about their role in diversification. The elevational scale of this study may have impacted the variation in pseudocyphellae-related traits, since specimens were found only within a relatively small elevation gradient. Species of Sticta (that have large cyphellae and often cyanobacterial photobionts) replace Crocodia at higher elevations in this study area, and at lower and drier elevations Crocodia was replaced by water-conserving, non-pseudocyphellate parmelioid lichens (E. Z. Clark, personal observation). This observation is consistent with other studies on patterns of community assembly across elevational gradients in tropical montane systems (Pérez-Quintero & Watteijne Cerón Reference Pérez-Quintero and Watteijne Cerón2009; Soto-Medina et al. Reference Soto-Medina, Lücking, Silverstone-Sopkin and Torres2019). While this study investigated changes in thallus traits and drying rates on a maximized observable scale (i.e. the total elevational range within which Crocodia was present), multiple sites at different elevations might, in the future, provide a more nuanced exploration, since scale has been cited as an important variable in previous literature (see Ellis et al. (Reference Ellis, Asplund, Benesperi, Branquinho, Di Nuzzo, Hurtado, Martínez, Matos, Nascimbene and Pinho2021) for a review). The lack of evidence to support the acclimative role of pseudocyphellae may also be an artifact of the measured ecological variables. For instance, Pintado et al. (Reference Pintado, Valladares and Sancho1997) found differences in pseudocyphellae density in populations with different levels of rain exposure. Therefore, relative humidity, in addition to precipitation may play a large role in shaping pseudocyphellae characteristics. Future studies should focus on an in-depth, much-expanded investigation of pseudocyphellae-related traits and microclimate data across a larger gradient, as C. aurata is widespread and pseudocyphellae-related versus more traditionally measured hydration-related traits may respond differently at varying scales. Studying how tropical lichens respond to microclimate conditions is fundamental to understanding their acclimation to changing climatic conditions in the Neotropics.
Furthermore, while we separated our analyses into two parts to establish 1) a correlation between environmental conditions and a physiological parameter (drying rate), and 2) a correlation between the investigated physiological parameter and functional traits, these data and our analytical approach are limited in their ability to describe the hierarchical and cascading structure of causal links between environmental conditions and the lichenized phenotype. Future research should incorporate more data across a broader range of environmental conditions and species into an integrative causal framework (e.g. path analysis) to disentangle the relative contributions of particular drivers to variation in specific traits. At this broader scale, it would also be fruitful to incorporate genetic data to understand if populations in different environments are genetically distinct (perhaps implying adaptation), or if a relatively homogenous genotype is acclimating to a broad range of conditions.
Conclusion
In this study, we found that pseudocyphellae did not significantly correlate to drying rates in Crocodia aurata, contrary to our hypothesis as well as literature on cyphellae in Sticta (Pérez-Quintero & Watteijne Cerón Reference Pérez-Quintero and Watteijne Cerón2009). However, other hydration-related thallus traits showed a significant relationship with drying rate, consistent with previous literature. Investigating the acclimative traits that lichens develop to maintain the balance between CO2 and water diffusion provides an insight into the physiology of the symbiosis. Understanding this physiological relationship is essential for preserving the diversity of lichens inhabiting tropical ecosystems and evaluating microclimatic and/or pollution-related changes in the irreplaceable biodiversity hotspots of tropical habitats. Overall, lichenology has been shown to be increasingly more informative to broader research on acclimation and ecosystem health, ultimately having the potential to contribute to crucial developments in these fields.
Acknowledgements
We thank the staff at CIEE-Monteverde for their support during the Tropical Ecology and Conservation (TEC) Spring 2024 programme, and Marvin Hidalgo for providing access to the Monteverde Biological Station. We also thank Karen L. Masters, Luisa Moreno from the Monteverde Institute (MVI), as well as Yoryineth Méndez and Wilson Salas from the Monteverde Cloud Forest Reserve (CCT), for their assistance in obtaining climate data. We are grateful to friends and family members for their continued enthusiasm for and support of this study. We also thank the faculty and staff of the COLO Herbarium, particularly Amber Horning and Ryan Allen, for supporting this and other research through endless contributions to specimen care, curation and digitization. This research project was conducted under the M-P-SINAC-PNI-ACAT-0015-2023 and M-P-SINAC-PNI-ACAT-0016-2024 research permits.
Author ORCIDs
Edie Z. Clark, 0009-0003-8508-8338; José Miguel Chaves-Fallas, 0000-0001-9049-9383; Erin A. Manzitto-Tripp, 0000-0001-9340-8723.
Competing Interests
The authors declare none.
Data Availability
All data for this study are available on Figshare at 10.6084/m9.figshare.30066877. All code for this study is available on GitHub at https://github.com/jlwatts98/Crocodia_aurata_pseudocyphellae_traits



 Open access

