

1. Introduction
The question of the gains and losses from monetary integration has been of practical importance for decades in Europe.Footnote 1 One aspect of monetary unification that has attracted particular attention is how countries can handle idiosyncratic disturbances and asymmetric business cycles under a common monetary policy.Footnote 2 This point is of particular concern to Eurozone members as they have surrendered independent interest-rate policies and are left with a limited capacity to implement countercyclical fiscal policies.Footnote 3
Since the European Economic and Monetary Union (EMU) currently lacks a formal system of interstate insurance (the so-called fiscal or transfer union) and full internal labour mobility—two crucial elements for the viability of a currency area according to economic theory—its adjustment to macroeconomic shocks is heterogeneous across countries. The varied responses to the financial crisis of 2007–08 are a case in point. Some Eurozone members suffered a sharper and longer lasting recession than others: data from the Federal Reserve Bank of St. Louis show that at the depth of the recession in the first quarter of 2009 real gross domestic product (GDP) fell by 7.4% in Italy, 13.5% in Spain, 5.7% in France, and 6% in Germany. Ten years after the onset of the crisis, output in Portugal, Italy, and Greece was still below its pre-crisis level, while this was no longer the case for the rest of the EMU. Unequal developments in economic activity are associated with heterogeneous price dynamics: according to Eurostat data, as of December 2021, the 12-month inflation rate was 3.4% in France but 6.6% in Spain, for instance. These differences are problematic for the central bank because they imply cross-country differentials in real interest rates in the face of a uniform nominal interest rate.
In this paper, I contribute to the currency union (CU) debate by constructing and estimating a dynamic stochastic general equilibrium (DSGE) model that quantifies the cost of missing an independent monetary policy. I use this framework to evaluate what reduction in transaction frictions a CU should guarantee in order to offset this loss. The distinctive feature of my work is that it jointly considers different dimensions along which an economy with a single currency differs from one with many and explores the resulting trade-off. In particular, it includes three competing effects of monetary unification: (i) the loss of monetary policy independence caused by the establishment of a unique central bank; (ii) the elimination of the temporary price misalignments due to nominal rigidities in local currencies; (iii) the expansion of trade enabled by the use of a single currency in international transactions. The first and the third are indispensable to characterize the tension between transaction gains and policy independence losses that lies at the heart of the optimum currency area (OCA) theory set forth by Mundell (Reference Mundell1961); the second element enriches the currency trade-off under scrutiny by compounding the problem of monetary stabilization in open economies and by adding an important way in which a single currency supports the creation of a single market. To quantify the trade-off, I estimate my CU model with data from the 11 economies that adopted the euro in 1999 (henceforth the EA11), I evaluate welfare using the utility of households as a criterion, and I run counterfactual scenarios to assess what welfare would be if one of the largest countries had its own national currency and monetary authority. I then seek the critical amount of transaction frictions that would make that economy indifferent between sharing a currency with the others or not and I find it to be moderate, thanks to the limited misalignment of business cycles observed in the EA11. Despite slightly asymmetric gains from CU membership due to unequal economic sizes and different degrees of openness to trade, under conservative assumptions about the transaction costs of multiple currencies all economies appear likely to enjoy higher welfare in a union.
To gain a deeper understanding of the mechanisms that generate these results, let us examine how the three effects above affect welfare. On one hand, giving up the ability to set monetary policy at a national level is costly if business cycles are asynchronous across countries. The cost depends both on the volatility of macroeconomic shocks and on their cross-country correlation: it vanishes if business cycles are perfectly symmetric but it can be sizeable otherwise. On the other hand, the adoption of a single currency has two advantages. If producers set the prices of their goods in the currency of the buyers and repricing is infrequent, nominal exchange rate (NER) fluctuations can cause short-run price misalignments across markets. A common currency removes this problem by creating a single market where firms can sell their products at the desired relative price.Footnote 4 Moreover, the use of a single currency can improve consumption permanently by eliminating some transaction costs.
To weigh up these effects, I model them in a utility-based setup. Unlike existing microfounded studies that analyze different aspects of monetary unification separately,Footnote 5 I bring them together in a unified framework that allows me to size up costs and benefits quantitatively. Because these channels have competing welfare implications, a unified assessment is essential to compare them correctly and explore how the net balance responds to changes in structural parameters: as the channels interact, the combined effect is different from the mere sum of the parts. What we learn from this approach is that while the introduction of a single currency may appear to have unambiguous welfare implications in more stylised economies characterized by a single friction, an interesting trade-off does emerge when multiple imperfections (all well documented empirically) are considered jointly. How this trade-off resolves is a quantitative matter. For this reason, while earlier works such as Kollman (Reference Kollman2004) explore the welfare effects of CU membership in calibrated economies, I use an estimated model to fit my analysis to the actual business cycles of European economies.
I cast my analysis in a setup with incomplete markets, local currency pricing (LCP), and monetary barriers to trade (MBT). The backbone of the model is a New Keynesian framework with nominal rigidities and monopolistic competition à la Clarida et al. (Reference Clarida, Galí and Gertler2002), featuring two economies that experience idiosyncratic shocks. The mechanisms at work have antecedents in the two-region representations of CUs by Benigno (Reference Benigno2004), Beetsma and Jensen (Reference Beetsma and Jensen2005) and Ferrero (Reference Ferrero2009),Footnote 6 but are studied here in an environment with incomplete risk sharing. This difference is important both in theory and in practice. On the theoretical front, the degree of risk sharing has significant implications for the cost of business cycles. On the practical front, risk sharing between EMU countries is limited for several reasons, including the absence of a common budget and the incomplete financial integration of the euro area.Footnote 7
The asset structure of the economy follows Benigno (Reference Benigno2009): markets are complete at the level of individual countries, but international trade in assets is limited to nominally risk-free bonds. This guarantees that the model has a representative agent formulation but allows for departures from full international risk sharing. Unlike Benigno (Reference Benigno2009), I compare and rank distinct international monetary arrangements. I do so in a cashless economy.
Price-setting behavior is based on local currency pricing à la Engel (Reference Engel2011) or Corsetti et al. (Reference Corsetti, Dedola, Leduc, Friedman and Woodford2011): firms set prices in the buyers’ currency following a Calvo-Yun scheme. With national currencies, domestic and foreign buyers are charged distinct prices for identical goods; these satisfy the law of one price (LOOP) in the long run, but violate it over the business cycle. In a CU, the price is unique and the LOOP always holds.Footnote 8
The real structure of the economy features full specialization in production and frictional trade. The friction is purely monetary: it only exists in the regime with two currencies and takes the form of a Lama and Rabanal (Reference Lama and Rabanal2014) type iceberg cost on imports.Footnote 9 This is a reduced-form stand-in for the various transaction costs that affect trade with multiple currencies, as documented empirically by Rose (Reference Rose2000) and Rose and van Wincoop (Reference Rose and van Wincoop2001). It drives a long-run trade and consumption wedge between the two monetary regimes.
To quantify the importance of these frictions, I evaluate the welfare differential between alternative currency systems and I explicitly disentangle the contribution of different frictions to it. My examination of welfare starts from a calibrated economy with producer currency pricing (PCP) and frictionless trade. I use this simplified economy to show that inflation and output are more volatile in a CU than they are under separate national currencies. I argue that this difference has welfare implications and I illustrate how these depend on the correlation of shocks across borders. I then introduce price discrimination and show that the inertia of local-currency prices determines inefficient price misalignments when the exchange rate moves. This friction per se does not alter the welfare ordering of the two regimes, because it only bites in the short run. Finally, I add trade frictions and explain that they depress import demand and output in the long run. This opens up the possibility that households experience higher welfare with a single currency. The net balance between competing forces then becomes an empirical question.
Using Bayesian techniques, I estimate the model with data from the EA11. I run four separate rounds of estimations. Each time, I single out a country of interest, aggregate the others into a rest-of-the-union block, and construct suitable time series to estimate a two-region CU model. For each round, I compute welfare in the estimated CU regime and compare it with a simulated counterfactual scenario where the country of interest keeps its own currency and pursues individual monetary policy objectives.
I first calibrate the trade friction in line with Lama and Rabanal (Reference Lama and Rabanal2014) and find that the welfare gain from monetary integration is positive for all countries. It is largest for France (0.41%) because that economy experiences the most correlated shocks with the rest of the block; it is smallest for Spain and Italy (0.26%) for analogous reasons and because they are less open.
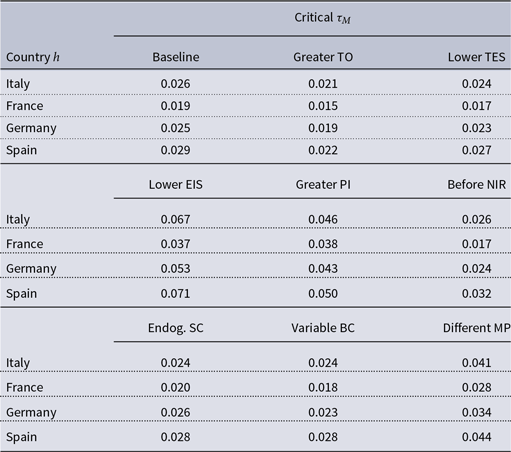
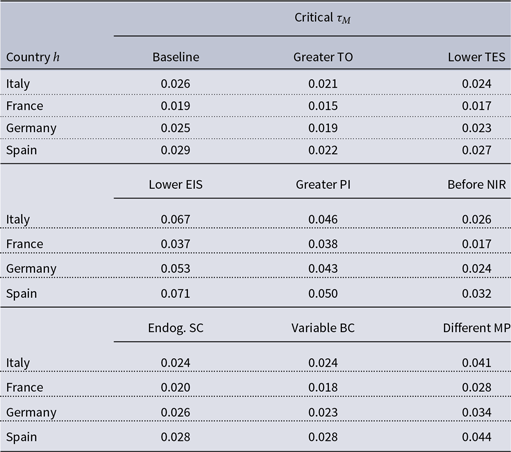
I then vary the monetary frictions and seek the critical level that equates welfare across currency regimes. I find it to be modest (between 0.019 and 0.029) and I argue that separate national currencies would only be desirable if the trade gains from introducing a common currency were very small.
Finally, I explore different model specifications. I raise the openness of the economies to trade and demonstrate that it boosts the gains from adopting a common currency. I then amend the substitutability between domestic and foreign goods and show that the results survive the introduction of some complementarity in line with existing studies. Next, I change the elasticity of intertemporal substitution and indicate that values well below what is common in the literature are needed to invert the ranking between monetary regimes. After that, I raise the inertia of prices, and find that this increases the cost of missing multiple monetary policy instruments a little. Subsequently I re-estimate my model with a shorter sample to avoid negative interest rates (NIRs), and find that the results are robust. Finally, I show that the results survive the introduction of three additional mechanisms that characterize the formation of a CU: endogenous changes in business-cycle correlations, changes in borrowing costs (BC), and changes in the stance of monetary policy.
I ascribe my findings to the limited cost of business cycle asymmetries for the economies under scrutiny and I argue that they weaken the case for national currencies on mere monetary policy flexibility grounds. The key lesson is that the potential benefits from increased monetary independence (MI) cannot be assessed in isolation, because they come with costs. I conclude with the perspective that arguments for MI in Europe should rest on economic mechanisms beyond those considered here and appeal to additional dimensions of interregional heterogeneity.
The rest of this paper is organized as follows. Section 2 outlines the setup. Section 3 illustrates its key dynamic properties, defines a welfare measure to compare monetary arrangements, and explores the dependence of the welfare ranking upon the shocks and frictions in the economy. Section 4 presents the Bayesian estimation and discusses the results. Section 5 concludes.
2. A two-country model of monetary independence and union
I base my analysis on a DSGE model with two countries,
 $h$
and
 $f$
, populated by a continuum of measure one of households: those on the segment
 $[0,n]$
reside in country
 $h$
while those on the segment
 $(n,1]$
reside in country
 $f$
. Within each region, households have identical preferences and can perfectly pool risks via state-contingent securities.Footnote
10
International trade in assets is limited to noncontingent bonds. This structure is invariant to the currency arrangement and is a key determinant of the cost of business cycles.Footnote
11
I consider two monetary regimes: a CU where a unique central bank pursues union-wide monetary policy objectives and a MI regime where separate monetary authorities respond to local macroeconomic developments. The economy is cashless: central banks control nominal interest rates by choosing bond prices.
Each country specializes in the supply of one good, whose production takes place in two steps. First, monopolistically competitive firms produce a continuum of differentiated goods and price them in the currency of the destination market, subject to Calvo-Yun nominal rigidities. Second, perfectly competitive firms aggregate locally produced intermediates into final consumption goods, which are traded internationally under transaction costs. Within each country, firms are entirely owned by domestic households.
2.1 The model
2.1.1 Households
Intertemporal optimization
The representative household of country
 $h$
makes consumption, saving and labour supply decisions:
 \begin{align*} &\underset {\{c_{t},A_{t+1},B_{t+1},\ell _{t}\}}{\max }\mathbb {E}_{0}\sum _{t=0}^{\infty }\beta ^{t}\xi _{t}\left (\frac {c_{t}^{1-\sigma }}{1-\sigma }-\frac {\ell _{t}^{1+\varphi }}{1+\varphi }\right )\\[3pt] &\quad \textrm {s.t.}\;c_{t}+q_{t}^{A}\frac {A_{t+1}}{p_{t}}+e_{t}q_{t}^{B}\frac {B_{t+1}}{p_{t}}+\chi q_{t}^{B}\left (\frac {e_{t}B_{t+1}}{p_{t}}\right )^{2}=\frac {A_{t}}{p_{t}}+e_{t}\frac {B_{t}}{p_{t}}+\frac {w_{t}}{p_{t}}\ell _{t}+\frac {p_{h,t}}{p_{t}}\Pi _{h,t}+\frac {T_{t}}{p_{t}}.\end{align*}
 $c_{t}$
and
 $\ell _{t}$
denote per-capita consumption and hours worked.
 $\xi _{t}$
are intertemporal preference shocks.
 $A_{t}$
and
 $B_{t}$
are per-capita holdings of assets denominated in the currencies of country
 $h$
and country
 $f$
.
 $e_{t}$
is the NER.
 $\Pi _{h,t}$
represents the profits of domestic firms.
Holdings of foreign bonds are subject to quadratic costs à la Benigno (Reference Benigno2009) that make asset positions stationary in the long run. These are rebated lump-sum to foreigners. Households receive per-capita transfers in the amount of
 \begin{equation*} \frac {T_{t}}{p_{t}}=\frac {1-n}{n}\mathcal {Q}_{t}\chi q_{t}^{A}\left (\frac {A_{t+1}^{*}}{e_{t}p_{t}^{*}}\right )^{2}, \end{equation*}
where
 $A_{t+1}^{*}$
denotes the foreign holdings of home currency-denominated bonds,
 $\mathcal{Q}_{t}\equiv e_{t}p_{t}^{*}/p_{t}$
is the real exchange rate (RER), while
 $p_{t}$
and
 $p_{t}^{*}$
are price indices defined below. Foreign households solve an analogous problem. The optimal consumption, saving, and labour supply conditions are in Appendix.
Intratemporal optimization
Households get utility from consuming a basket of domestic and foreign goods, with an import share parameter
 $\zeta$
and a constant trade elasticity of substitution (TES)
 $\eta$
. The optimization problem is
 \begin{align*} \underset {c_{h,t},c_{f,t}}{\max }c_{t} &\equiv \left [\left (1-\zeta \right )^{\frac {1}{\eta }}\left (c_{h,t}\right )^{\frac {\eta -1}{\eta }}+\left (\zeta \right )^{\frac {1}{\eta }}\left (\left (1-\tau _{M}\right )c_{f,t}\right )^{\frac {\eta -1}{\eta }}\right ]^{\frac {\eta }{\eta -1}}\\[3pt]\textrm {s.t.}\:p_{t}c_{t}&=p_{h,t}c_{h,t}+p_{f,t}c_{f,t}, \end{align*}
where
 $p_{h,t}$
and
 $p_{f,t}$
are the prices of
 $h$
and
 $f$
goods in the currency of country
 $h$
, while
 $\tau _{M}$
is a transaction cost on imports. The effective consumer price index (CPI) is
 \begin{equation*} p_{t}\equiv \left [\left (1-\zeta \right )\left (p_{h,t}\right )^{1-\eta }+\zeta \left (\frac {p_{f,t}}{1-\tau _{M}}\right )^{1-\eta }\right ]^{\frac {1}{1-\eta }}, \end{equation*}
and the per-capita consumption demands that maximize utility are
 \begin{equation*} c_{h,t}=\left (1-\zeta \right )\left (\frac {p_{h,t}}{p_{t}}\right )^{-\eta }c_{t},\qquad c_{f,t}=\zeta \left (1-\tau _{M}\right )^{\eta -1}\left (\frac {p_{f,t}}{p_{t}}\right )^{-\eta }c_{t}. \end{equation*}
Foreign households have analogous preferences and demand schedules.
International trade
International trade in goods is affected by iceberg-type monetary frictions that are tied to the currency regime.Footnote
12
A fraction
 $\tau _{M}$
of the imports are lost in the MI regime because of frictions associated with the use of different currencies. These frictions are null in the CU. This is a reduced-form stand-in for the MBT documented empirically by Rose (Reference Rose2000) and Rose and van Wincoop (Reference Rose and van Wincoop2001). It captures in a compact way the permanent trade gains from monetary unification.Footnote
13
2.1.2 Firms
Final goods producers
Perfectly competitive producers adopt a constant elasticity of substitution (CES) technology that aggregates locally produced intermediates into homogeneous final products for domestic sale and export.
The problem faced by the producers that serve the domestic market is
 \begin{equation*} \underset {y_{h,t}\left (i\right )}{\max }\;p_{h,t}y_{h,t}-\int _{0}^{n}p_{h,t}\left (i\right )y_{h,t}\left (i\right )di\qquad \textrm {s.t.}\:y_{h,t}=\left [\left (\frac {1}{n}\right )^{\frac {1}{\varepsilon }}\int _{0}^{n}y_{h,t}\left (i\right )^{\frac {\varepsilon -1}{\varepsilon }}di\right ]^{\frac {\varepsilon }{\varepsilon -1}}. \end{equation*}
The demand for input
 $i$
and the associated producer price index (PPI) are
 \begin{equation} y_{h,t}\left (i\right )=\frac{1}{n}\left (\frac{p_{h,t}\left (i\right )}{p_{h,t}}\right )^{-\varepsilon }y_{h,t},\qquad p_{h,t}=\left (\frac{1}{n}\int _{0}^{n}p_{h,t}\left (i\right )^{1-\varepsilon }di\right )^{\frac{1}{1-\varepsilon }}. \end{equation}
Exporters have similar input demand schedules and an analogous PPI.
Intermediate goods producers
Monopolistically competitive firms hire local labour to produce intermediate goods
 $i$
with technology
 $y_{t}\left (i\right )=z_{t}\ell _{t}\left (i\right )$
, where
 $z_{t}$
denotes productivity and
 $\ell _{t}\left (i\right )$
denotes firm-specific employment. Production must satisfy both domestic and foreign demand:
 $y_{t}\left (i\right )=y_{h,t}\left (i\right )+y_{h,t}^{*}\left (i\right )$
. Firms face an exogenous probability
 $1-\theta _{p}$
of resetting their prices each period. They do so to maximize discounted profits, subject to final goods producers’ demand. Given the prices, output is demand-determined.
Firms price their goods in the currency of the destination market. With two currencies, firms set two prices
 $\bar{p}_{h,t}\left (i\right )$
and
 $\bar{p}_{h,t}^{*}\left (i\right )$
to maximize
 \begin{equation*} \mathbb {E}_{t}\sum _{\tau =0}^{\infty }\theta _{p}^{\tau }\Lambda _{t,t+\tau }\left \{ \frac {\bar {p}_{h,t}\left (i\right )}{p_{h,t+\tau }}y_{h,t+\tau }\left (i\right )+e_{t+\tau }\frac {\bar {p}_{h,t}^{*}\left (i\right )}{p_{h,t+\tau }}y_{h,t+\tau }^{*}\left (i\right )-\Psi \left (y_{t+\tau }\left (i\right )\right )\right \}, \end{equation*}
subject to the condition that
 $y_{h,t+\tau }\left (i\right )$
and
 $y_{h,t+\tau }^{*}\left (i\right )$
satisfy demand schedules like (1). The
 $\Psi \left (\cdot \right )$
function is the total real cost of production.
 $\Lambda _{t,t+\tau }$
represents the stochastic discount factor for
 $\tau$
periods-ahead real payoffs.Footnote
14
The optimal pricing conditions for the goods that are sold domestically read
 \begin{equation*} g_{h,t}^{2}=\mathcal {M}_{p}g_{h,t}^{1}, \end{equation*}
 \begin{equation*} g_{h,t}^{2}\equiv \mathbb {E}_{t}\sum _{\tau =0}^{\infty }\theta _{p}^{\tau }\Lambda _{t,t+\tau }\left \{ y_{h,t+\tau }\left (\frac {\bar {p}_{h,t}}{p_{h,t}}\right )^{-\varepsilon }\left (\frac {1}{\prod _{s=1}^{\tau }\pi _{h,t+s}}\right )^{1-\varepsilon }\right \}, \end{equation*}
 \begin{equation*} g_{h,t}^{1}\equiv \mathbb {E}_{t}\sum _{\tau =0}^{\infty }\theta _{p}^{\tau }\Lambda _{t,t+\tau }\left \{ y_{h,t+\tau }\frac {mc_{h,t+\tau }}{d_{h,t+\tau }}\left (\frac {\bar {p}_{h,t}}{p_{h,t}}\right )^{-1-\varepsilon }\left (\frac {1}{\prod _{s=1}^{\tau }\pi _{h,t+s}}\right )^{-\varepsilon }\right \}, \end{equation*}
where
 $mc_{h,t}$
is the real marginal cost of production,
 $\pi _{h,t}$
is the gross PPI inflation rate,
 $\mathcal{M}_{p}\equiv \varepsilon/\left (\varepsilon -1\right )$
is the desired frictionless markup and
 $d_{h,t}$
is the producer price dispersion index
 \begin{equation} d_{h,t}\equiv \frac{1}{n}\int _{0}^{n}\left (\frac{p_{h,t}\left (i\right )}{p_{h,t}}\right )^{-\varepsilon }di. \end{equation}
Analogous conditions hold for exports. The LOOP holds in the long run because firms face identical preferences on both markets, but fails in the short run due to NER movements because repricing is infrequent. A single currency avoids these transitory price misalignments: firms choose a unique price for both markets and the LOOP holds continuously.Footnote 15
2.1.3 Monetary policy
Monetary independence
The two central banks control the prices of the bonds denominated in the respective currencies in order to set nominal interest rates according to the following kind of rule:
 \begin{equation} \frac{R_{t}}{R}=\left (\frac{R_{t-1}}{R}\right )^{\gamma _{R}}\left [\left (\frac{\pi _{t}}{\pi }\right )^{\gamma _{\pi }}\left (\frac{y_{t}}{y_{t-1}}\right )^{\gamma _{y}}\left (\frac{e_{t}}{e_{t-1}}\right )^{\gamma _{e}}\right ]^{1-\gamma _{R}}m_{t}. \end{equation}
 $m_{t}$
represents exogenous interest rate shocks. Since firms engage in LCP, monetary authorities target the CPI inflation rates
 $\pi _{t}\equiv p_{t}/p_{t-1}$
and
 $\pi _{t}^{*}\equiv p_{t}^{*}/p_{t-1}^{*}$
. As output gaps are not observable, the Taylor rules are specified in terms of real output growth. The exchange-rate feedback term dampens price misalignmentsFootnote
16
and departures from full international risk sharing.Footnote
17
Currency union
The central bank adopts a Taylor rule that takes union-wide measures as policy targets. Union-wide output is the sum of the two countries’ GDP,
 $y_{t}^{u}=ny_{t}+\left (1-n\right )y_{t}^{*}$
. Inflation is the geometric average of local inflation rates weighted by population sizes:
 $\pi _{t}^{u}=\left (\pi _{t}\right )^{n}\left (\pi _{t}^{*}\right )^{1-n}$
. A small interest rate spread
 $\Omega _{t}\equiv R_{t}^{*}/R_{t}=\left (\pi _{f,t}/\pi _{h,t}\right )^{\omega }$
with
 $\omega \simeq 0$
rules out unstable solutions by preventing self-fulfilling differentials between the GDP inflation rates
 $\pi _{h,t}\equiv p_{h,t}/p_{h,t-1}$
and
 $\pi _{f,t}\equiv p_{f,t}/p_{f,t-1}$
.
2.1.4 Exogenous processes
Shocks to intertemporal preferences, productivity and interest rates are common to all households and firms within each country. They follow first-order autoregressive processes as specified in Appendix A. The innovations follow i.i.d. normal processes that can be correlated across countries. In a CU, there is a single monetary shock
 $m_{t}^{u}$
with analogous properties.
2.1.5 Market clearing, price dispersion, and output
The per-capita GDP of each country is the sum of the goods produced for the domestic market and those intended for exports:
 \begin{equation*} y_{t}=c_{h,t}+\left (\frac {1-n}{n}\right )c_{h,t}^{*}. \end{equation*}
The per-capita aggregate production function combines labour market clearing with the demand schedules and the production technologies of intermediates:
 \begin{equation} y_{t}=\frac{z_{t}\ell _{t}}{d_{t}}. \end{equation}
The state variable
 $d_{t}\equiv x_{h,t}d_{h,t}+x_{h,t}^{*}d_{h,t}^{*}$
measures GDP-level price dispersion; it combines PPI-level price dispersion indices (2) with the output shares of domestically consumed and exported goods
 $x_{h,t}\equiv y_{h,t}/y_{t}$
and
 $x_{h,t}^{*}\equiv y_{h,t}^{*}/y_{t}$
. The bond market-clearing conditions and the laws of motion of the price dispersion indices, the aggregate price levels, and the NER are in Appendix A.
3. Macroeconomic dynamics and welfare: A theoretical example
In this section, I use a simplified model to highlight the key differences between CU and MI in terms of response to shocks and to illustrate the welfare implications of the main frictions in the economy. The focus is on supply shocks, but the same mechanisms apply to demand shocks.
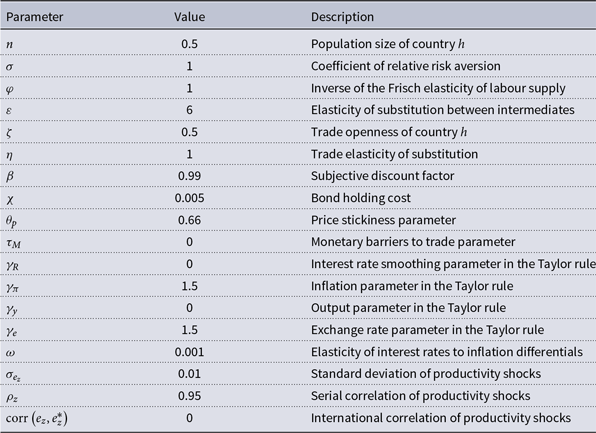
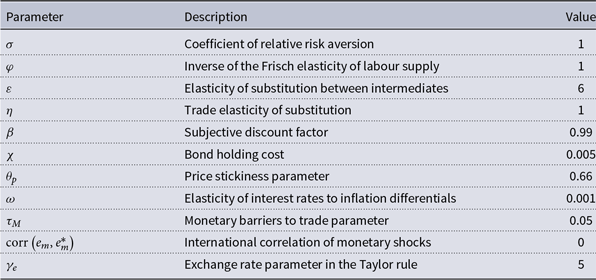
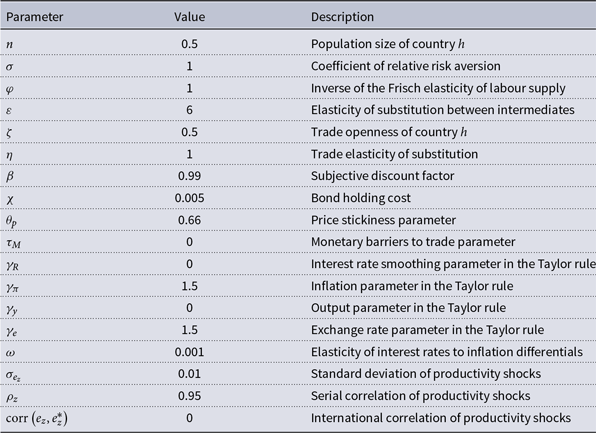
I consider an environment where trade is frictionless and firms engage in PCP, so that the LOOP always holds. Table B.1 displays the calibration. The time interval of the model is a quarter. I specify identical preferences with unit intertemporal and intratemporal elasticities of substitution à la Corsetti and Pesenti (Reference Corsetti and Pesenti2001), so that
 $c_{h}$
and
 $c_{f}$
are neither complements nor substitutes. I calibrate the monetary policy rules with identical coefficients across the two monetary regimes to ease the comparison.Footnote
18
Since firms engage in PCP, here I specify the CU’s inflation target in terms of PPI inflation rates following Benigno (Reference Benigno2004) and Ferrero (Reference Ferrero2009):
 $\pi _{t}^{u}=\left (\pi _{h,t}\right )^{n}\left (\pi _{f,t}\right )^{1-n}$
.
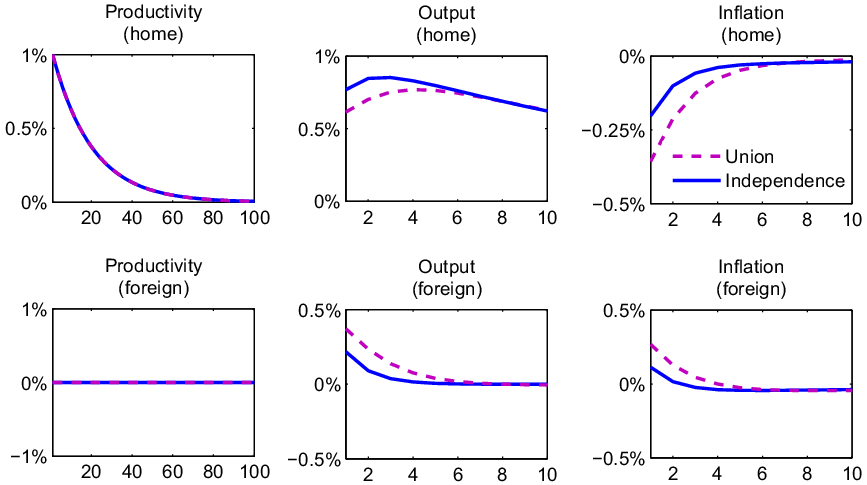
Figure 1 shows the effects of a positive productivity shock to country
 $h$
that is uncorrelated with
 $f$
’s productivity. Because asymmetric disturbances are addressed more effectively by a selective adjustment of interest rates, both inflation and output are less volatile in the MI regime than under CU.Footnote
19
Impulse responses to a technology shock: MI vs CU.

The gap between the impulse response functions (IRFs) under the two regimes depends on the relationship between the shocks. The IRFs would coincide if
 $z_{t}$
and
 $z_{t}^{*}$
were perfectly positively correlated. When the correlation is weaker, the economy is more stable under MI. This has welfare implications.
3.1 Welfare measure and computational method
I define welfare in monetary regime
 $r$
as the expectation of lifetime utility as of time zero, conditional on the contingent plans for consumption and hours:
 \begin{equation*} V_{0}^{r}\equiv \mathbb {E}_{0}\sum _{t=0}^{\infty }\beta ^{t}u\left (c_{t}^{r},\ell _{t}^{r}\right ), \end{equation*}
The welfare cost of abandoning MI to join a CU is measured in foregone consumption terms à la Lucas (Reference Lucas1987), that is, as the negative subsidy
 $\lambda$
such that
 \begin{equation*} V_{0}^{CU}=\mathbb {E}_{0}\sum _{t=0}^{\infty }\beta ^{t}u\left (\left (1-\lambda \right )c_{t}^{MI},\ell _{t}^{MI}\right ). \end{equation*}
With logarithmic utility, the welfare cost amounts to
 \begin{equation} \lambda =1-e^{\left (1-\beta \right )\left (V_{0}^{CU}-V_{0}^{MI}\right )}. \end{equation}
As frictions make the steady state of the model inefficient, I adopt second-order approximation methods to measure welfare accurately.Footnote 20 My numerical strategy is based on perturbation via Dynare by Adjemian et al. (Reference Adjemian, Bastani, Juillard, Karamé, Mihoubi, Perendia, Pfeifer, Ratto and Villemot2011) with a pruning method due to Kim et al. (Reference Kim, Kim, Schaumburg and Sims2008).
3.2 Shocks, frictions, and welfare
To examine the main determinants of the welfare gap between alternative monetary arrangements, I start from the frictionless economy above and then introduce one distortion at a time to highlight the welfare implications.
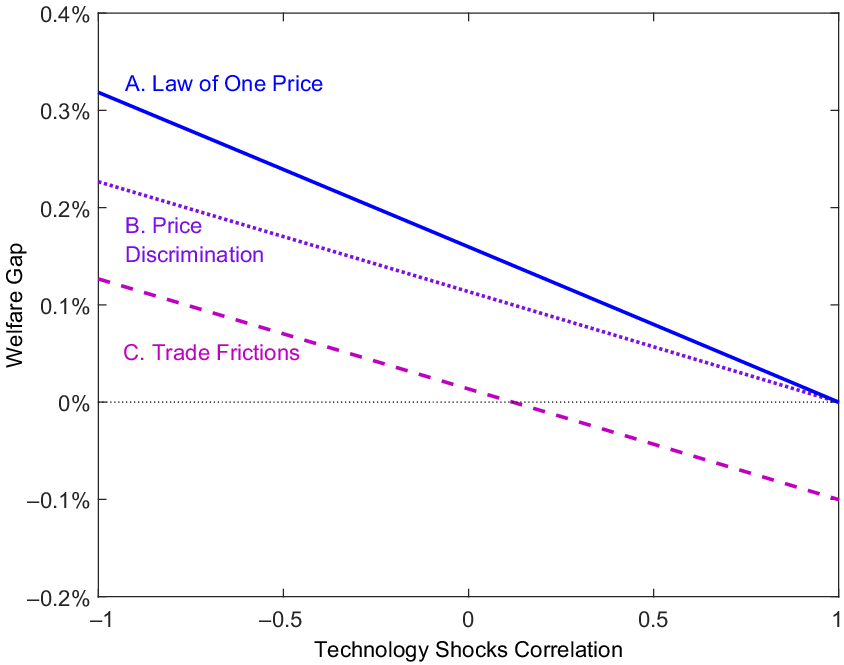
Figure 2 plots the welfare gap (
 $\lambda$
) against the correlation of technology shocks. Line A represents an economy where the LOOP holds and trade is frictionless. The relationship is negative because a stronger macroeconomic comovement across countries reduces the need for region-specific stabilization policies and the gains from a multicurrency system. If
 $\textrm{corr}\left (e_{z},e_{z}^{*}\right )=1$
, having a second policy instrument is unnecessary and the welfare gap is zero.
Shocks correlation, frictions, and the MI-CU welfare gap.

The slope of the line depends on the properties of the exogenous processes. More volatile and persistent shocks widen the difference between the stabilization capacity of a single instrument and that of multiple ones. This effect has an impact on the slope because it is proportional to the cross-country correlation of shocks; it vanishes when disturbances are perfectly positively correlated. The slope also depends on the other structural determinants of the welfare cost of business cycles, such as price inertia, risk aversion, and the elasticity of substitution between
 $h$
and
 $f$
goods.
The intercept of the line depends on the set of active shocks and their properties. With no shocks to intertemporal preferences and interest rates, giving up MI is costless when technology shocks are perfectly correlated: this is reflected by a zero right intercept in Figure 2. If the other shocks are active, the right intercept will be positive.
Line B shows what happens when we introduce pricing-to-market. The pass-through of NER movements into import prices is imperfect when prices are sticky in the currency of the destination market. In the short run, identical products are sold at different prices in different places, once converted into a common unit of account; this inefficiency reduces welfare. If nominal rigidities are strong, these frictions add an important cost to the MI regime and reduce the welfare gap with the CU. Since price misalignments are conditional on business cycles, the associated welfare loss is proportional to the correlation of shocks; this is why the slope of the welfare gap schedule is affected.
Line C illustrates the welfare effect of MBT. By reducing the demand for imports, they lower the long-run output level of the MI economy relative to that of the CU. Since this distortion affects the steady state of the economy, it shifts down the entire welfare gap schedule. This creates regions of the parameters space where the CU Pareto dominates the MI system.
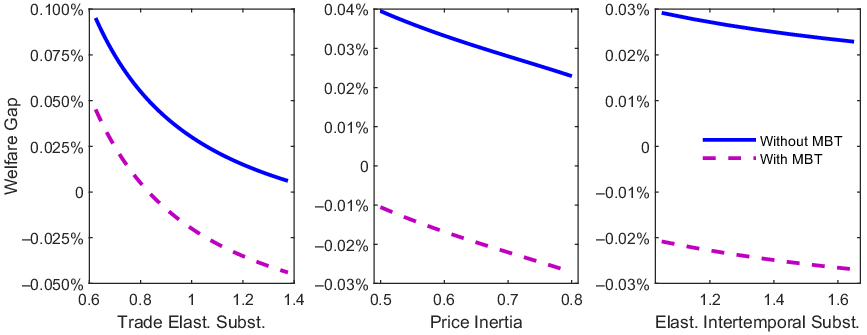
Figure 3 illustrates the role of three important structural parameters. First, a higher TES (
 $\eta$
) reduces consumption risk by facilitating demand switching in the face of country-specific shocks. This brings down the welfare gains from adopting multiple stabilization instruments, leading to a decline in
 $\lambda$
everything else being equal. Second, a larger Calvo parameter (
 $\theta _{p}$
) determines more price inertia (PI). This exacerbates the cross-border price misalignments that arise under LCP and further reduces the gains from MI. Third, a higher elasticity of intertemporal substitution (EIS,
 $1/\sigma$
) reduces the cost of business cycles and the welfare differential between MI and CU, both because it corresponds to lower risk aversion and because it facilitates intertemporal trade via borrowing and lending after shocks occur. This effect is stronger the more open the economy is, as we will see in the Quantitative Analysis section.
Elasticities, nominal rigidities, and the MI-CU welfare gap.

Notice that the welfare implications of these parameters are smaller than those of MBT: the dashed lines characterize an economy with a mere
 $\tau _{M}=0.001$
, but the gap with the solid lines is relatively large. I let the data discipline the strength of these mechanisms in the next section.
4. Quantitative analysis
In this section, the model meets quarterly data from the 11 economies that adopted the euro in 1999 to be estimated with Bayesian tools.Footnote 21
For each of the four largest EA11 economies, I estimate the model in its CU configuration and then I simulate a MI counterfactual where the economy of interest has its own currency, holding the estimated parameters fixed.Footnote 22 I equip the two regions with Taylor rules based on local economic conditions and I compute the welfare gap between CU and MI for a range of values of the MBT. Finally, I seek the critical amounts of frictions that close the gap.
4.1 Data
The sample begins at the launch of the euro in 1999 Q1 and ends with 2017 Q4. I use as observables seasonally adjusted FRED data by the Federal Reserve Bank of St. Louis on real GDP, real consumption and CPI inflation in each country, plus the nominal interest rate of the union.Footnote 23
Real output and consumption series are computed from nominal data using 2010 base year GDP deflators and turned into per capita terms using Eurostat population data.Footnote 24 Finally, they are detrended with a one-sided Hodrick and Prescott filter by Meyer-Gohde (Reference Meyer-Gohde2010) with smoothing parameter 1600.
The inflation rates of individual economies are calculated as the quarter-on-quarter changes in their CPI level. Inflation in the rest of the EA11 is then computed as a geometric average across the remaining countries weighted by their population sizes, following Benigno (Reference Benigno2004), among others. All series are demeaned for consistency with the model’s zero long-run inflation.
I take the Krippner (Reference Krippner2015) shadow interest rateFootnote 25 as a measure of the Eurozone interbank rate in order to circumvent the absence of a lower bound on nominal interest rates in the model. The model is re-estimated with data before NIRs as a robustness check in Section 4.5.5.
Following Schmitt-Grohé and Uribe (Reference Schmitt-Grohé and Uribe2012), I allow for serially uncorrelated errors in the measurement of output to avoid stochastic singularity issues.
4.2 Calibrated parameters and priors
I calibrate the parameters that have been consistently recognized in the literature (e.g., the Calvo pricing parameterFootnote 26 ), those that are not identified from my data (e.g., the monetary barrier parameter), and those that represent conventional assumptions (e.g., the elasticities of substitution). See Table B.2.
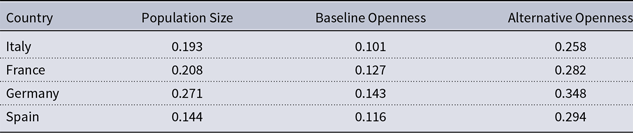
I let households value domestic goods more than imports. I calibrate the trade openness (TO) of each economy of interest (
 $\zeta$
) on the basis of its average imports-to-GDP ratio from 1999 to 2017, following Erceg et al. (Reference Erceg, Gust and López-Salido2009) among others. To focus on trade within the EA11 group, I adjust this parameter for the share of imports coming from the Eurozone netting out the post-1999 accession countries. The parameters I adopt for the main estimations in Section 4.4 are listed in the third column of Table B.3; in the alternative estimates with larger openness, I use those in the fourth column. The rest of the union’s TO (
 $\zeta ^{*}$
) is pinned down by balanced trade in steady state.Footnote
27
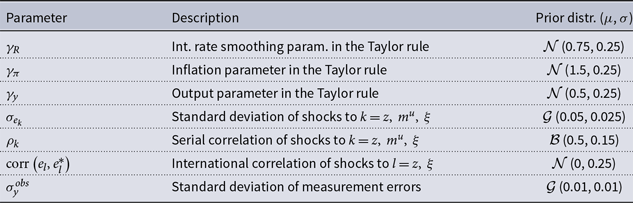
I estimate the Taylor rule coefficients and the parameters that control the exogenous processes. The priors are collected in Table B.4. The NER coefficient in the Taylor rules, the MBT parameter, and the international correlation of monetary shocks are specific to the MI regime, so they do not affect the likelihood of the estimated CU model. I fix
 $\gamma _{e}$
at the lowest value that guarantees a unique rational expectations equilibrium. I set
 $\tau _{M}=0.05$
initiallyFootnote
28
and then I vary it to find the critical value that equates welfare across regimes. Finally, I specify that monetary shocks are internationally uncorrelated. I subsequently verify that my results are robust to changes in these parameters.
4.3 Estimation technique
I construct a first-order approximation of the model and its decision rules so that the likelihood can be generated by Kalman filter projections. I adopt a standard Metropolis-Hastings (MH) Markov Chain Monte Carlo algorithm to evaluate the posterior distribution and produce Bayesian estimates of the parameters. For each round of estimation, I run four parallel chains of the MH algorithm with 500,000 replications and a 50% burn-in period.
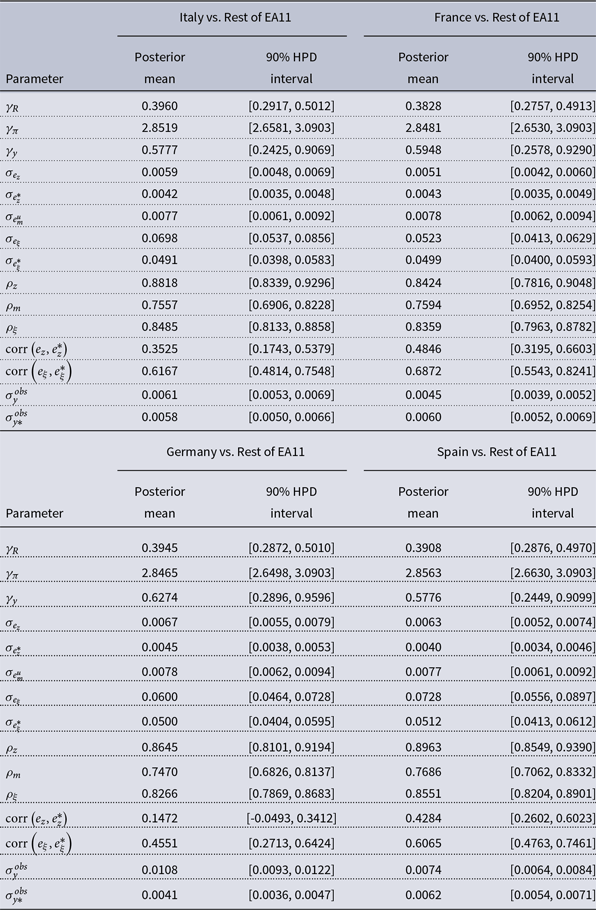
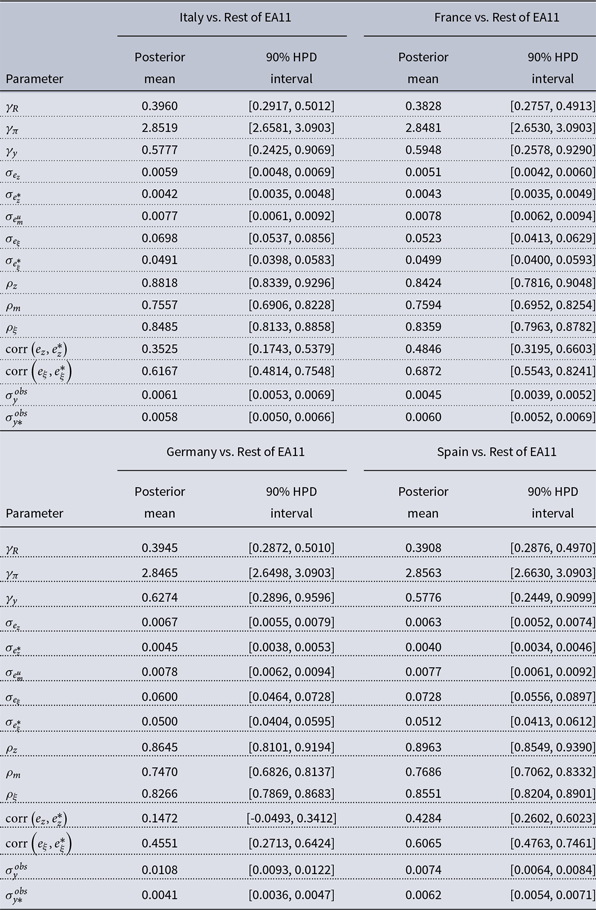
The baseline estimation results are in Table B.5. Parameter estimates from the robustness checks are available on request. The model extensions with endogenous shock correlations (SC), variable BCs, and different monetary policies (MP) do not involve additional estimations.
4.4 Welfare results
I take Monte Carlo draws from the joint posterior distribution of the estimated parameters to evaluate the distribution of
 $\lambda$
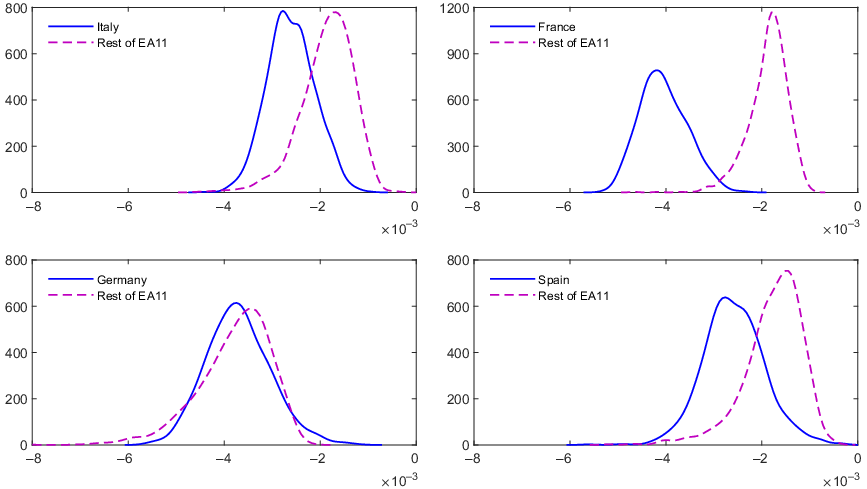
. For each draw, I simulate the model in both monetary configurations and calculate the welfare gap according to equation (5). I trace the probability densities in Figure B.1.
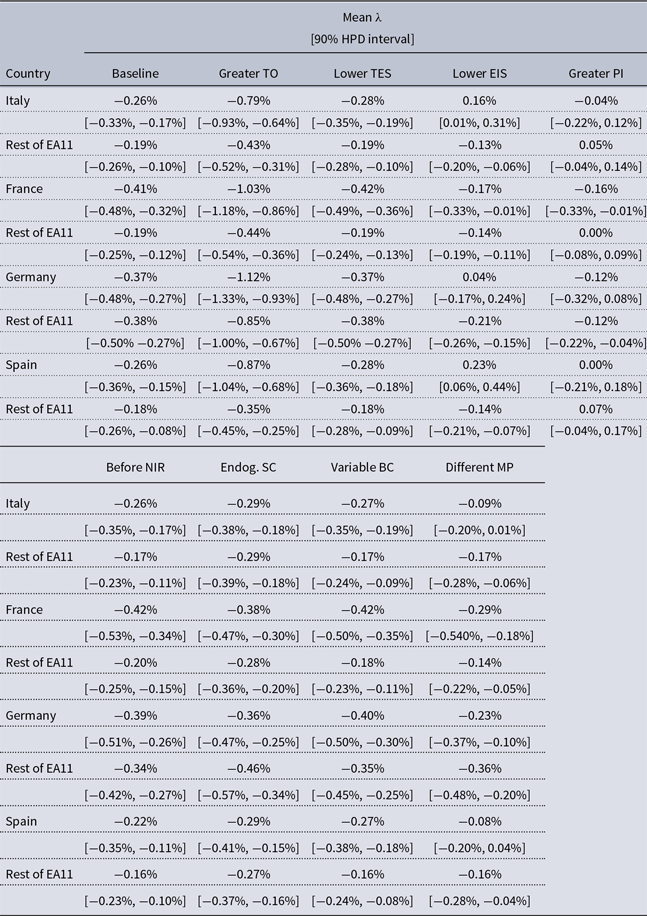
Table B.6 reports the results. In the baseline experiments, all countries under scrutiny would suffer welfare losses if they had separate currencies. The economy that keeps out of the union tends to lose more than the rest, because its relatively smaller size implies heavier dependence on international trade—so larger exposure to the transaction frictions associated with MI.
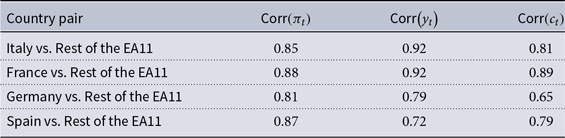
The countries that appear to lose the most from being out of the Eurozone are France and Germany. The latter is the most open to trade so it benefits highly from cutting down transaction frictions, whereas the former is the second most open and also enjoys the strongest business-cycle affiliation with the rest of the EA11, as shown in Table 1. Italy and Spain would likely experience somewhat smaller trade losses from using separate currencies as they are slightly less open, but they comove quite strongly with the rest of the EA11.
Correlations of observable inflation and output processes, 1999Q1–2017Q4

The results depend on the calibrated parameters. Among these, changes to the exchange rate stabilization coefficient (
 $\gamma _{e}$
) and the cross-region correlation of interest rate shocks under MI leave
 $\lambda$
unchanged up to three decimal digits. The monetary barrier to trade (
 $\tau _{M}$
) has significant welfare implications instead.
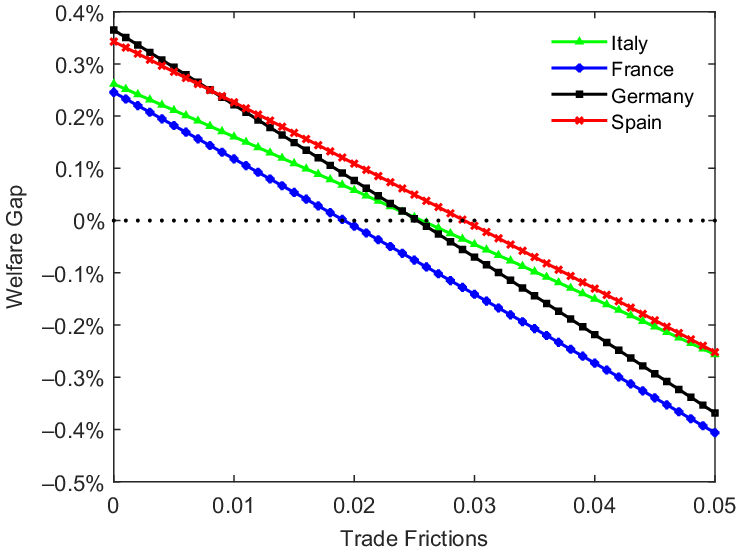
Figure 4 plots
 $\lambda$
against
 $\tau _{M}$
. The relationship is negative: stronger transaction costs make a break-up of the CU less desirable for all countries. The vertical intercepts reflect the net gains from MI without trade frictions. The values at
 $\tau _{M}=0.05$
coincide with the posterior means in Table B.6. As the slope of the lines depends on trade openness, Germany and France are the countries whose welfare falls most steeply with MBT.
Trade frictions and the MI-CU welfare gap.

As business cycles are quite synchronized across these economies, moderate trade gains suffice to equate the benefits and the costs of a CU. Table 2 reports the critical amounts of MBT that close the welfare gap with MI; they correspond to the horizontal intercepts of the welfare gap lines in Figure 4. Small MBT appear sufficient for France to share a currency with the rest of the EA11, since its inflation, output, and consumption processes are highly correlated with the other countries. Slightly larger MBT are needed to keep the other three in the CU, as they exhibit somewhat weaker correlations.
Trade frictions that equate welfare across regimes
4.5 Robustness checks and model extensions
4.5.1 Greater openness to trade
The implications of monetary frictions are tied to TO. Table B.6 displays the outcome of new welfare calculations with import shares based on unadjusted imports-to-GDP ratios. These reflect the hypothesis that being in a CU may facilitate all trade with the rest of the world, thanks to the stability provided by a common exchange rate with the other members.
The results are qualitatively analogous to those with baseline home bias: all countries experience lower welfare with separate currencies. Quantitatively, the welfare differentials are larger than before and vary more across countries.
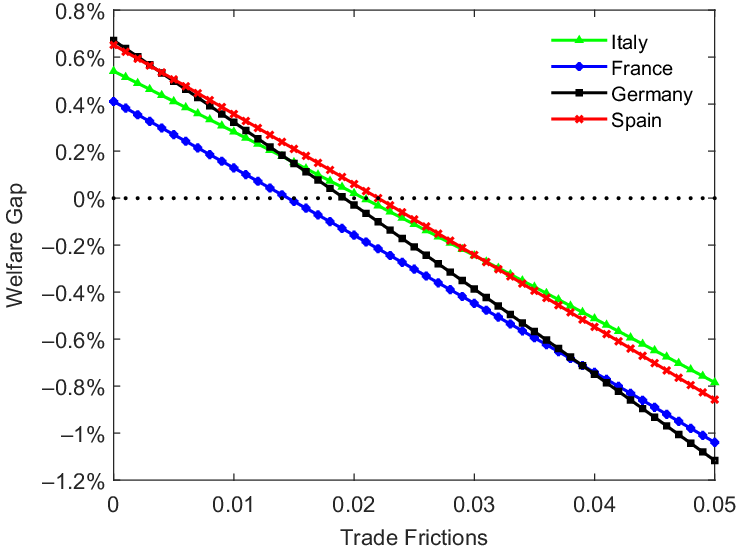
Figure 5 sheds further light on how trade openness affects the relationship between welfare and MBT. The lines are steeper than before because stronger commercial ties exacerbate the welfare implications of MBT; this raises the gains from joining a CU. Their vertical intercepts have also shifted, because deeper trade integration improves risk sharing by enabling a broader exchange of assets; this reduces the cost of business cycles. Because the risk-sharing gains depend on the cross-border correlation of shocks, which displays some variation across countries, the
 $\lambda$
lines appear more spaced out too.
As shown in Table 2, the critical transaction frictions implied by the lines in Figure 5 are slightly smaller than those in Figure 4: eliminating MBT offers larger trade gains the more open the economy is. Indeed, the frictions that equate welfare across regimes are smallest for France and Germany.
Trade frictions and the MI-CU welfare gap with greater trade openness.

These results resonate with those of Kollman (Reference Kollman2004), who also shows that the welfare gains from a CU depend positively on trade openness, but the mechanism is different. While in that framework a CU suppresses exogenous exchange rate shocks that cause short-run fluctuations in imports of intermediates, here it eliminates transaction costs that affect trade in final goods in the long run. This difference allows my estimated welfare gains to exceed his.
4.5.2 Lower trade elasticity
As we have seen, the substitutability between
 $h$
and
 $f$
goods has welfare implications. I re-estimate the model and repeat the simulations with
 $\eta =0.85$
following Corsetti et al. (Reference Corsetti, Dedola and Leduc2008). This implies that goods are complementary. The results closely resemble those obtained with unit TES. The posterior means and the credibility intervals of
 $\lambda$
in Table B.6 move only marginally. The direction of the shift is consistent with theory, as exchange rate movements have less power to switch expenditure between domestic and foreign goods when these are complementary; this lessens the cost of adopting a single currency. Table 2 confirms that the critical transaction frictions that equate welfare across monetary regimes are little changed: the relationship between MBT and welfare remains qualitatively the same.
4.5.3 Lower elasticity of intertemporal substitution
As we have seen, the welfare cost of business cycles is sensitive to the EIS. To see how it affects the currency trade-off for these economies, I estimate the model anew under the assumption that the EIS is 0.3, which lies at the low end of the range in the literature. To compute welfare, I generalize formula (5) to the case of non-unitary coefficients of relative risk aversion:
 \begin{equation} \lambda =1-\left [1+\frac{V_{0}^{CU}-V_{0}^{MI}}{\mathscr{V}_{0}^{MI}}\right ]^{\frac{1}{1-\sigma }}, \end{equation}
where
 $\mathscr{V}_{0}^{MI}\equiv \mathbb{E}_{0}\sum _{t=0}^{\infty }\beta ^{t}\frac{c_{t}^{MI}}{1-\sigma }$
is the consumption part of lifetime utility in MI.
As higher risk aversion aggravates the cost of business cycles, with
 $\tau _{M}=0.05$
three economies experience higher welfare under MI, as shown in Table B.6. Table 2 confirms that trade gains beyond those implied by
 $\tau _{M}=0.05$
are needed to keep these economies in a CU. Therefore, it is possible to draw alternative conclusions without changing the MBT specification if one is willing to accept a parameterization of the EIS that, despite being above the Hall (Reference Hall1988) estimate of 0.1, lies below the values commonly adopted in comparable models and well below the 2/3 estimate by Smets and Wouters (Reference Smets and Wouters2007).
4.5.4 Greater price inertia
The baseline calibration of the Calvo parameter in Table B.2 targets an average price duration of three quarters, in line with evidence on aggregate European inflation dynamics by Galí, Gertler, and López-Salido (Reference Galí, Gertler and López-Salido2001). As a robustness check, I re-estimate the model with
 $\theta _{p}=0.78$
following alternative estimates by Galí et al. (Reference Galí, Gertler and López-Salido2003).Footnote
29
Larger exogenous shocks are necessary to explain the observed volatility of inflation with stronger nominal rigidities; therefore, the estimated shock variances are higher now. Combined with more price inertia, these have two effects. First, they reduce labour productivity by raising the average dispersion of prices over the business cycle as per equation (4); this pushes up the gains from stabilizing inflation with multiple policy instruments. Second, they determine larger short-run price misalignments across borders under MI; this raises the gains from adopting one currency. The simulations show that the former effect prevails: as displayed in Table B.6, the distribution of
 $\lambda$
shifts to the right. Accordingly, larger trade gains are needed to equate welfare across regimes, as can be seen from Table 2. Nevertheless, at
 $\tau _{M}=0.05$
the welfare of all four economies remains as high or higher in a CU than under MI.
4.5.5 Subsample without periods of NIRs
Consistent with the fact that the EONIA interbank rate has been negative since the European Central Bank cut the deposit rate below zero in June 2014, the model does not feature a zero lower bound on nominal interest rates. The use of a shadow rate series obviates to the possible existence of an unknown lower bound in negative territory, which is not modeled.Footnote 30 To see if the results above are still affected by the observations from the NIR years, I re-estimate the model with a subsample that ends in 2014 Q1. The resulting parameter estimates are so similar to their full-sample counterparts that the posterior welfare distributions in Table B.6 and the critical frictions in Table 2 align very closely with those in the baseline computations.
4.5.6 Endogenous business cycle correlations
To obtain a prudent assessment of the welfare gains from CU membership, I have assumed that business cycle correlations do not improve with economic integration.Footnote
31
However, Frankel and Rose (Reference Frankel and Rose1998) argued that these are endogenous and do respond positively to trade integration empirically. Following evidence of business-cycle convergence in Europe by Artis and Zhang (Reference Artis and Zhang1999), among others, I repeat my simulations with baseline parameter estimates under the assumption that the cross-country correlations of all shocks are proportional to trade integration.Footnote
32
The
 $\lambda$
distributions of Italy and Spain shift to the left and the critical MBT shrink, indicating that the convergence of correlations ameliorates the monetary policy problem of these economies in a CU. By contrast, the
 $\lambda$
distributions of France and Germany shift marginally to the right and the critical MBT rise a bit, because risk sharing improves as SCs get weaker under MI. Since these economies are relatively more open, these marginal gains prevail over the marginal benefits from the greater conformity of cyclical fluctuations under CU. However, with
 $\tau _{M}=0.05$
all four economies remain highly likely to experience higher welfare in a CU.
4.5.7 Variable financial integration and changing cost of borrowing
Often the expectation of more favorable BCs thanks to deeper financial integration and the elimination of currency risk represents an additional reason for joining a CU. To explore its implications, I repeat my simulations under the assumption that the cost of exchanging bonds is higher when a country is not in the CU. In particular, I raise the bond-holding cost coefficient
 $\chi$
to 0.01 under MI, in line with the work on imperfect financial integration by Benigno (Reference Benigno2009). This raises the gains from CU membership, everything else being equal, as evidenced in Table B.6. As such, it reduces the trade gains needed to offset the loss of policy independence: see Table 2.
4.5.8 Different monetary policy stance
Another advantage of MI is that the central bank could have its own degree of tolerance for price and output movements.Footnote
33
To explore the additional welfare gains from this, I let the economy be more hawkish on inflation and more tolerant for output movements (
 $\gamma _{\pi }=5$
and
 $\gamma _{y}=0$
) when it keeps out of the CU. This improves its performance, everything else being equal, and raises the critical MBT that make CU membership worthwile—especially for Italy and Spain as they are slightly less open to trade gains, as shown in Table 2. As evidenced in Table B.6, however, with
 $\tau _{M}=0.05$
all economies remain likely to enjoy higher welfare in the CU.
5. Concluding remarks
I have revisited the welfare implications of adopting a single currency from the perspective of an open economy DSGE model with imperfect international risk sharing. Following the OCA theory, I have contrasted the cost of losing monetary policy independence under asynchronous shocks with the transactions and efficiency benefits of eliminating national currencies. My work contributes to the existing debate both conceptually and empirically.
From a conceptual viewpoint, I have shown that the introduction of a single currency would reduce welfare in an economy with frictionless trade, because it would suppress a stabilization instrument in return for a small gain—that of removing some cross-border price misalignments. Monetary unification can improve welfare in an economy with MBT, instead, because it eliminates a friction permanently. The lesson is that the gains from MI cannot be abstracted from the associated costs.
From an empirical viewpoint, estimates from Italy, France, Germany, Spain, and the other members that adopted the euro in 1999 suggest that the welfare gains from sharing a common currency are highly likely to exceed the costs for these economies. This conclusion is robust to a number of structural changes in my model. The key to these findings is the modest welfare cost of business-cycle asynchrony between these countries, which means that small gains from trade creation are sufficient to offset the loss of monetary policy flexibility.
As my analysis abstracts from some welfare-relevant aspects of the CU problem, it does not constitute a comprehensive argument for a single currency in Europe; it merely weakens the case for country-specific currencies on monetary policy flexibility grounds. A broader assessment of the trade-off between alternative monetary arrangements in Europe should include additional sources of ex-ante heterogeneity across countries, such as different labour market structures, divergent trend growth rates, and unequal spaces for active fiscal policy. Productivity, competitiveness, and RER adjustment issues are also prominent in debates about the Eurozone and represent promising extensions of the CU debate.Footnote 34
Appendix A. Notation and equilibrium conditions
A.1. Notation
It is computationally convenient to write the households’ per-capita bond positions in real terms and express them in the currency of their country:
 \begin{equation*} a_{t+1}\equiv \frac {A_{t+1}}{p_{t}},\qquad b_{t+1}\equiv e_{t}\frac {B_{t+1}}{p_{t}},\qquad a_{t+1}^{*}\equiv \frac {A_{t+1}^{*}}{e_{t}p_{t}^{*}},\qquad b_{t+1}^{*}\equiv \frac {B_{t+1}^{*}}{p_{t}^{*}}. \end{equation*}
Let us define three sets of relative prices. First, the PPI-to-CPI ratios:
 \begin{equation*} \mathscr {P}_{h,t}\equiv \frac {p_{h,t}}{p_{t}},\qquad \mathscr {P}_{f,t}\equiv \frac {p_{f,t}}{p_{t}},\qquad \mathscr {P}_{h,t}^{*}\equiv \frac {p_{h,t}^{*}}{p_{t}^{*}},\qquad \mathscr {P}_{f,t}^{*}\equiv \frac {p_{f,t}^{*}}{p_{t}^{*}}. \end{equation*}
Second, the optimal relative prices of each good in each currency:
 \begin{equation*} \tilde {p}_{h,t}\equiv \frac {\bar {p}_{h,t}}{p_{h,t}},\qquad \tilde {p}_{h,t}^{*}\equiv \frac {\bar {p}_{h,t}^{*}}{p_{h,t}^{*}},\qquad \tilde {p}_{f,t}\equiv \frac {\bar {p}_{f,t}}{p_{f,t}},\qquad \tilde {p}_{f,t}^{*}\equiv \frac {\bar {p}_{f,t}^{*}}{p_{f,t}^{*}}. \end{equation*}
Third, the relative prices of foreign to domestic goods in each currency:
 \begin{equation*} s_{t}\equiv \frac {p_{f,t}}{p_{h,t}},\qquad s_{t}^{*}\equiv \frac {p_{f,t}^{*}}{p_{h,t}^{*}}. \end{equation*}
Real wages, per-capita transfers and NER movements are
 \begin{equation*} \textrm {w}_{t}\equiv \frac {w_{t}}{p_{t}},\qquad t_{t}\equiv \frac {T_{t}}{p_{t}},\qquad \Delta e_{t}\equiv \frac {e_{t}}{e_{t-1}}. \end{equation*}
A.2. Equilibrium conditions
Relative prices:
 \begin{equation*} \mathscr {P}_{h,t}=\left [\left (1-\zeta \right )+\zeta \left (\frac {s_{t}}{1-\tau _{M}}\right )^{1-\eta }\right ]^{\frac {1}{\eta -1}},\mathscr {P}_{f,t}=\left [\left (1-\zeta \right )\left (\frac {1}{s_{t}}\right )^{1-\eta }+\zeta \left (\frac {1}{1-\tau _{M}}\right )^{1-\eta }\right ]^{\frac {1}{\eta -1}}. \end{equation*}
Per-capita consumption demands:
 \begin{equation*} c_{h,t}=\left (1-\zeta \right )\left (\mathscr {P}_{h,t}\right )^{-\eta }c_{t},\qquad c_{f,t}=\zeta \left (1-\tau _{M}\right )^{\eta -1}\left (\mathscr {P}_{f,t}\right )^{-\eta }c_{t}. \end{equation*}
Market-clearing conditions for goods:
 \begin{equation*} y_{h,t}=c_{h,t},\qquad y_{h,t}^{*}=\left (\frac {1-n}{n}\right )c_{h,t}^{*},\qquad y_{t}=y_{h,t}+y_{h,t}^{*}. \end{equation*}
Intertemporal and intratemporal optimisation:
 \begin{equation*} q_{t}^{A}=\beta \mathbb {E}_{t}\left (\frac {\lambda _{t+1}}{\lambda _{t}}\frac {1}{\pi _{t+1}}\right ),\qquad q_{t}^{B}\left (1+2\chi b_{t+1}\right )=\beta \mathbb {E}_{t}\left (\frac {\lambda _{t+1}}{\lambda _{t}}\frac {\Delta e_{t+1}}{\pi _{t+1}}\right ), \end{equation*}
 \begin{equation*} \lambda _{t}=\xi _{t}c_{t}^{-\sigma },\qquad \lambda _{t}=\xi _{t}\ell _{t}^{\varphi }/\textrm {w}_{t},\qquad t_{t}=\frac {1-n}{n}\mathcal {Q}_{t}\chi q_{t}^{A}\left (a_{t+1}^{*}\right )^{2}, \end{equation*}
 \begin{equation*} c_{t}+q_{t}^{A}a_{t+1}+q_{t}^{B}b_{t+1}+\chi q_{t}^{B}\left (b_{t+1}\right )^{2}=\frac {a_{t}}{\pi _{t}}+\frac {b_{t}}{\Delta e_{t}\pi _{t}}+\textrm {w}_{t}\ell _{t}+\mathscr {P}_{h,t}\Pi _{h,t}+t_{t}. \end{equation*}
RER, relative prices and cross-border price misalignments:
 \begin{equation*} \mathcal {Q}_{t}=m_{h,t}\left [\frac {\left (1-\zeta ^{*}\right )\left (s_{t}^{*}\right )^{1-\eta }+\zeta ^{*}\left (\frac {1}{1-\tau _{M}}\right )^{1-\eta }}{\left (1-\zeta \right )+\zeta \left (\frac {s_{t}}{1-\tau _{M}}\right )^{1-\eta }}\right ]^{\frac {1}{1-\eta }},\quad \frac {m_{f,t}}{m_{h,t}}=\frac {s_{t}^{*}}{s_{t}},\quad \frac {m_{h,t}}{m_{h,t-1}}=\Delta e_{t}\frac {\pi _{h,t}^{*}}{\pi _{h,t}}. \end{equation*}
Market-clearing conditions for bonds:
 \begin{equation*} na_{t+1}=-\left (1-n\right )a_{t+1}^{*}\mathcal {Q}_{t},\qquad nb_{t+1}=-\left (1-n\right )b_{t+1}^{*}\mathcal {Q}_{t}. \end{equation*}
Output, marginal costs, price dispersion, and aggregate profits per capita:
 \begin{equation*} y_{t}=\frac {z_{t}\ell _{t}}{d_{t}},\quad mc_{h,t}=\frac {\textrm {w}_{t}}{\mathscr {P}_{h,t}}\frac {d_{h,t}}{z_{t}},\quad d_{h,t}=\theta _{p}\left (\pi _{h,t}\right )^{\varepsilon }d_{h,t-1}+\left (1-\theta _{p}\right )\left (\tilde {p}_{h,t}\right )^{-\varepsilon }, \end{equation*}
 \begin{equation*} d_{t}=x_{h,t}d_{h,t}+x_{h,t}^{*}d_{h,t}^{*},\qquad x_{h,t}=\frac {y_{h,t}}{y_{t}},\qquad x_{h,t}^{*}=\frac {y_{h,t}^{*}}{y_{t}}, \end{equation*}
 \begin{align*}\\[-50pt] \Pi _{h,t}=y_{h,t}+m_{h,t}y_{h,t}^{*}-\frac {\textrm {w}_{t}}{\mathscr {P}_{h,t}}\frac {y_{t}}{z_{t}}d_{t}. \end{align*}
Price dynamics, PPI inflation, and optimal price setting for
 $h$
goods:
 \begin{equation*} \tilde {p}_{h,t}=\left [\frac {1-\theta _{p}\left (\pi _{h,t}\right )^{\varepsilon -1}}{1-\theta _{p}}\right ]^{\frac {1}{1-\varepsilon }},\quad \pi _{h,t}=\frac {\mathscr {P}_{h,t}}{\mathscr {P}_{h,t-1}}\pi _{t},\quad g_{h,t}^{2}=\mathcal {M}_{p}g_{h,t}^{1},\quad \mathcal {M}_{p}=\frac {\varepsilon }{\varepsilon -1}, \end{equation*}
 \begin{equation*} g_{h,t}^{1}=y_{h,t}\frac {mc_{h,t}}{d_{h,t}}\left (\tilde {p}_{h,t}\right )^{-1-\varepsilon }+\theta _{p}\beta \mathbb {E}_{t}\left (\frac {\lambda _{t+1}}{\lambda _{t}}\frac {\mathscr {P}_{h,t+1}}{\mathscr {P}_{h,t}}\right )\left (\frac {\tilde {p}_{h,t}}{\tilde {p}_{h,t+1}}\right )^{-1-\varepsilon }\left (\pi _{h,t+1}\right )^{\varepsilon }g_{h,t+1}^{1}, \end{equation*}
 \begin{equation*} g_{h,t}^{2}=y_{h,t}\left (\tilde {p}_{h,t}\right )^{-\varepsilon }+\theta _{p}\beta \mathbb {E}_{t}\left (\frac {\lambda _{t+1}}{\lambda _{t}}\frac {\mathscr {P}_{h,t+1}}{\mathscr {P}_{h,t}}\right )\left (\frac {\tilde {p}_{h,t}}{\tilde {p}_{h,t+1}}\right )^{-\varepsilon }\left (\pi _{h,t+1}\right )^{\varepsilon -1}g_{h,t+1}^{2}. \end{equation*}
Interest rates and monetary policy with national currencies:
 \begin{equation*} \frac {R_{t}}{\pi/\beta }=\left (\frac {R_{t-1}}{\pi/\beta }\right )^{\gamma _{R}}\left [\left (\frac {\pi _{t}}{\pi }\right )^{\gamma _{\pi }}\left (\frac {y_{t}}{y_{t-1}}\right )^{\gamma _{y}}\left (\Delta e_{t}\right )^{\gamma _{e}}\right ]^{1-\gamma _{R}}m_{t},\qquad R_{t}=1/q_{t}^{A}, \end{equation*}
 \begin{equation*} \frac {R_{t}^{*}}{\pi ^{*}/\beta }=\left (\frac {R_{t-1}^{*}}{\pi ^{*}/\beta }\right )^{\gamma _{R}}\left [\left (\frac {\pi _{t}^{*}}{\pi ^{*}}\right )^{\gamma _{\pi }}\left (\frac {y_{t}^{*}}{y_{t-1}^{*}}\right )^{\gamma _{y}}\left (\frac {1}{\Delta e_{t}}\right )^{\gamma _{e}}\right ]^{1-\gamma _{R}}m_{t}^{*},\qquad R_{t}^{*}=1/q_{t}^{B}. \end{equation*}
Interest rates and monetary policy with a single currency:
 \begin{equation*} \frac {R_{t}^{u}}{\pi ^{u}/\beta }=\left (\frac {R_{t-1}^{u}}{\pi ^{u}/\beta }\right )^{\gamma _{R}}\left [\left (\frac {\pi _{t}^{u}}{\pi ^{u}}\right )^{\gamma _{\pi }}\left (\frac {y_{t}^{u}}{y_{t-1}^{u}}\right )^{\gamma _{y}}\right ]^{1-\gamma _{R}}m_{t}^{u},\quad R_{t}=R_{t}^{u}\left (\frac {\pi _{h,t}}{\pi _{t}^{u}}\right )^{\omega },\quad R_{t}^{*}=R_{t}^{u}\left (\frac {\pi _{f,t}}{\pi _{t}^{u}}\right )^{\omega }, \end{equation*}
 \begin{equation*} \pi _{t}^{u}=\left (\pi _{t}\right )^{n}\left (\pi _{t}^{*}\right )^{1-n},\qquad y_{t}^{u}=ny_{t}+\left (1-n\right )y_{t}^{*}. \end{equation*}
Exogenous processes:
 $\log k_{t}=\rho _{k}\log k_{t-1}+e_{k,t}$
with
 $k=\xi,\:z,\:m$
.
Appendix B. Calibration and estimations
B.1. Calibration in Section 3.2
Calibration
Calibrated parameters in baseline estimations

Calibrated population size (
 $n$
) and openness parameters (
 $\zeta$
)

Prior distributions (
 $\mathcal{N}$
= normal,
 $\mathcal{G}$
= gamma,
 $\mathcal{B}$
= beta)

Baseline parameter estimates
Estimates of the MI-CU welfare gap

Probability density functions of
 $\lambda$
with baseline estimates and calibration.