Introduction
Reproducible growth of high-quality (AlGaIn)N heterostructures requires, because of the rather narrow growth parameter window, fast and efficient characterization of, e.g., layer thickness and composition. Spectroscopic ellipsometry (SE) is a nondestructive optical characterization technique which has been used successfully for the characterization of conventional III-V heterostructures [Reference Pickering, Carline, Emeney, Garawal and Howard1-Reference Wagner, Schmitz, Herres, Tränkle and Koidl4]. For a quantitative analysis of SE data on group III-arsenide and -antimonide heterostructures, detailed modeling of the pseudodi-electric function spectra has been performed employing a multilayer approach, incorporating parametric dielectric function models for the individual layers [Reference Herzinger, Yao, Snyder, Celli, Kao, Johs and Woollam2-Reference Wagner, Schmitz, Herres, Tränkle and Koidl4]. With respect to the group III-nitrides, SE data and model fits to the dielectric function spectra have been reported so far mostly for bulk-like GaN and AlGaN [Reference Logothetidis, Petalas, Cardona and Moustakas5-Reference Djurisic, Rakic, Kwok, Li, Majewski and Elazar10]. We have reported recently on the SE characterization of InxGa1−xN (x≤0.1) layers on GaN, but no modeling of the pseudodielectric function spectra has been performed to extract the dielectric function spectra of the individual layers [Reference Wagner, Ramakrishnan, Behr, Obloh, Kunzer and Bachem11].
The aim of the present investigation was to characterize hexagonal (AlGaIn)N heterostructures by variable angle SE and to analyze the resulting pseudodielectric function spectra within the framework of a multilayer model based on parametric dielectric functions. Parameterized dielectric function spectra have been derived for GaN, In0.13Ga0.87N, and AlxGa1−xN (x≤0.16), allowing a direct determination of the composition dependence of the AlxGa1−xN band gap energy EG(x). There is an ongoing controversy regarding the deviation of EG(x) from a linear dependence on x. Recent values for the bowing parameter b, which describes the magnitude of parabolic nonlinearity, range from 0, as derived from photoreflectance measurements for x≤0.2 [Reference Ochalski, Gil, Lefebvre, Grandjean, Leroux, Massies, Naka mura and Morkoc12], to 1.33 eV, as obtained from an absorption study covering the full composition range 0≤x≤1 [Reference Shan, Ager, Yu, Walukiewicz, Haller, Martin, McKinney and Yang13]. Another recent paper suggests, based on photoluminescence (PL) data and an extensive survey of previous works, a band gap bowing parameter for AlxGa1−xN of b=0.62 eV [Reference Lee, Wright, Crawford, Petersen, Han and Biefeld14].
Experiment
The AlGaN/GaN and InGaN/GaN heterostructures as well as a complete GaN/InGaN/AlGaN LED structure used for the present study were grown by low-pressure MOCVD on c-plane 2″ sapphire substrates using a low-temperature GaN nucleation layer. Details on sample growth can be found in Ref. [Reference Obloh, Behr, Herres, Hoffmann, Kunzer, Maier, Müller, Pletschen, Santic, Schlotter, Seelmann-E., Bachem and Kaufmann15]. The AlGaN and InGaN composition was determined by SIMS using appropriate standards calibrated by energy dispersive X-ray analysis (EDX).
Rotating analyzer variable angle SE was used to derive the room-temperature pseudodielectric function spectrum <ε> of the (AlGaIn)N heterostructures, covering the range of photon energies from 2 to 5 eV. Incident angles of 65°and 75° were used while the polarizer azimuth was kept constant at 30°. Both incident angles gave identical <ε> spectra, which confirms that the ellipsometry data correspond to an electric field vector perpendicular to the c-axis. For clarity of presentation only <ε> spectra recorded for an incident angle of 65° will be shown in the following. Samples were further analyzed by PL spectroscopy.
Results and Discussion
The real <ε1> and imaginary part <ε2> of the pseudodielectric function spectrum of a 2.5 μm thick GaN film on sapphire is shown in figure 1 together with a parametric model fit to the experimental data. All features present in the experimental spectra are reproduced by the model fit. To match the amplitude of the layer thickness oscillations in the transparency region of the GaN film, a layer thickness uniformity of 0.7% was assumed, which accounts for inhomogeneities of film thickness across the area probed by the ellipsometer as well as for imperfections of the GaN/sapphire interface, which also attenuate the interference oscillations. Further, a surface roughness of the GaN film of 0.9 nm was taken into account, which is compatible with atomic force micrographs which yield a RMS roughness of 2 to 3 nm at the most for the present samples.
Real <ε1> and imaginary part <ε2> of the pseudo-dielectric function spectrum of a 2.5 μm thick GaN layer on sapphire. Experimental data and model fits are indicated by dashed and full lines, respectively.
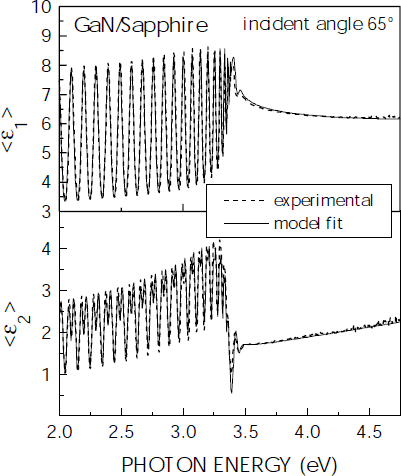
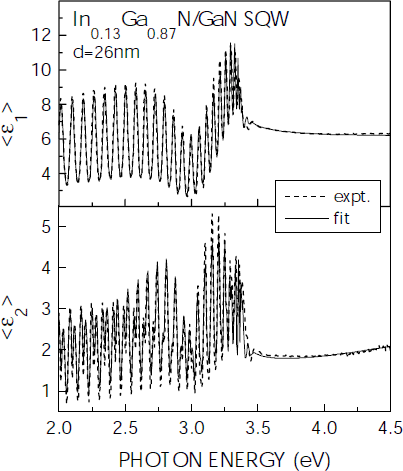
Figure 2 shows the <ε1> and <ε2> spectra of an InGaN/GaN heterostructure, consisting of a 26 nm thick In0.13Ga0.87N layer embedded between a lower, 2.7 µm thick, and an upper, 130 nm thick, GaN barrier layers. From a comparison with the <ε> spectrum of GaN on sapphire (see figure 1) the presence of the InGaN layer is readily detected via the occurrence of minima in both the <ε1> and the <ε2> spectrum at around 3 eV, which is the band gap energy of the InGaN. For the parametric model fit, also shown in figure 2, the GaN dielectric function was taken from the fit in figure 1 while the dielectric function spectrum of the InGaN layer was fitted. The InGaN layer thickness measured by SIMS was taken as an input parameter.
Real <ε1> and imaginary part <ε2> of the pseudo-dielectric function spectrum of a 26 nm thick In0.13Ga0.87N layer embedded between GaN barrier layers. Experimental data and model fits are indicated by dashed and full lines, respectively.

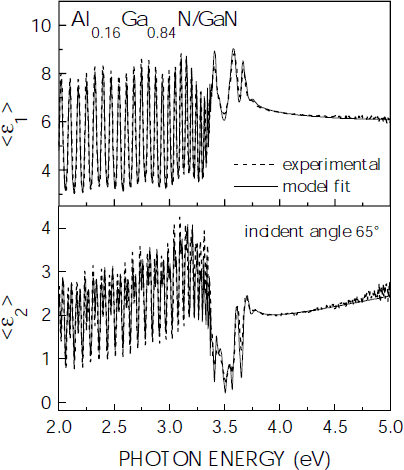
Pseudodielectric function spectra <ε1> and <ε2> of an AlGaN/GaN heterostructure are shown in figure 3 along with a parametric model fit. The sample is composed of a 600 nm thick Al0.16Ga0.84N layer grown on top of a 2.77 µm thick GaN layer. The AlGaN layer was covered by 6 nm thick GaN capping layer. Again, the GaN dielectric function was taken from the fit to the GaN-on-sapphire sample and the AlGaN dielectric function was fitted. The parametric model fit reproduces all features present in the experimental spectra. The AlGaN layer thickness deduced from the fit to the SE data of 609 nm is in excellent agreement with that of 594 nm determined by SIMS depth profiling.
Real <ε1> and imaginary part <ε2> of the pseudo-dielectric function spectrum of a 600 nm thick Al0.16Ga0.84N layer on GaN. Experimental data and model fits are indicated by dashed and full lines, respectively.
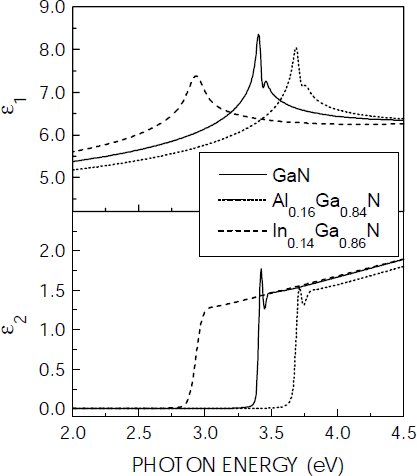
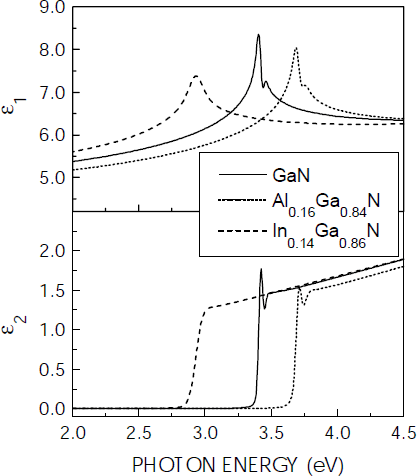
The parametric dielectric function spectra ε1 and ε2 for GaN, In0.14Ga0.86N, and Al0.16Ga0.84N, deduced from the above shown fits, are plotted in figure 4. For both the GaN and the AlGaN dielectric function spectra an excitonic resonance is resolved superimposed on the spectrum arising from band-to-band continuum transitions. For the model fit, the excitonic resonance was represented by a Gaussian oscillator. For InGaN, in contrast, this resonance is broadened, most likely due to compositional inhomogeneity [Reference Chichibu, Azuhata, Sota and Nakamura16], and just a single peak is present in the ε1 spectrum. The band gap energy of the pseudomorphic In0.14Ga0.86N layer deduced from the fit to the SE data is 2.95 eV. This value lies within the range of recently published band gap data deduced from photoreflection measurements, which yield for InGaN with an In content of x=0.14, grown pseudomorphic on GaN, band gap energies of 2.91 eV [Reference Wetzel, Takeuchi, Yamaguchi, Katoh, Amano and Akasaki17] and 2.99 eV [Reference Wagner, Ramakrishnan, Behr, Maier, Herres, Kunzer, Obloh and Bachem18].
Real ε1 and imaginary part ε2 of the parametric dielectric function spectra of GaN, Al0.16Ga0.84N, and In0.14Ga0.87N as deduced from multilayer parametric model fits to SE data.
For a series of AlxGa1−xN/GaN heterostructures with 0≤x≤0.16, the AlxGa1−xN dielectric function was determined by fitting the SE data. From this analysis, the composition dependent AlxGa1−xN band gap energy EG(x) was obtained, as depicted in figure 5. Further, PL peak positions recorded on the same series of samples are shown. The PL measurements were carried out at low temperatures (10 K) in order to resolve the AlGaN near band edge PL against the background from corresponding GaN related emission, which was difficult for room-temperature PL spectra in particular for low Al mole fractions. The resulting low-temperature PL peak energy was then down-shifted rigidly by 64 meV to account for the temperature induced band gap shift when going from 10 K to 300 K [Reference Steude, Meyer, Göldner, Hoffmann, Bertram, Christen, Amano and Akasaki19]. The data shown in figure 5 indicate a certain Stokes shift between EG(x) derived from the SE data and the PL peak position, which increases slightly with increasing Al mole fraction and thus increasing compositional disorder.
Room-temperature AlxGa1−xN band gap energy EG(x), as derived from fits to SE data, and PL peak position versus Al content x. Calculated EG(x) curves, computed for different bowing parameters b given in the figure, are also shown.
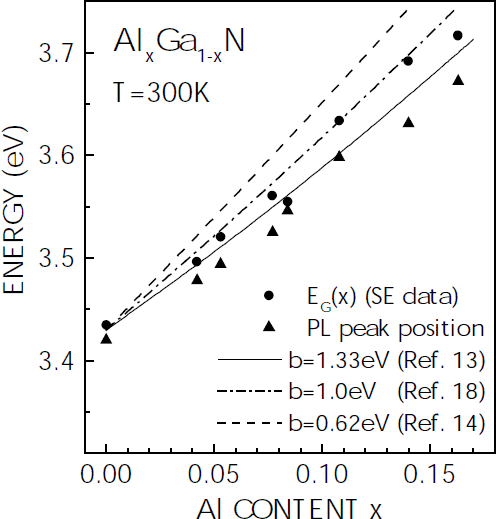
For comparison, also calculated EG(x) curves are shown, computed for representative bowing parameters of b=0.62 eV [Reference Lee, Wright, Crawford, Petersen, Han and Biefeld14], b=1.0 eV [Reference Koide, Itoh, Khan, Hiramatu, Sawaki and Askasaki20], and b=1.33 eV [Reference Shan, Ager, Yu, Walukiewicz, Haller, Martin, McKinney and Yang13]. For the room-temperature band gap energies of GaN and AlN values of 3.43 and 6.2 eV, respectively, were taken [Reference Shan, Ager, Yu, Walukiewicz, Haller, Martin, McKinney and Yang13]. The composition dependence of the PL peak energy can be reproduced with a bowing parameter of b=1.3 eV, when allowing for a small rigid low-energy shift of the PL peak energy relative to the calculated EG(x). The EG(x) data obtained from the analysis of the SE data, in contrast, indicate a somewhat smaller bowing parameter closer to b=1.0 eV than b=1.33 eV. No fit for b to the present EG(x) data was attempted because of the limited composition range covered by the present set of samples.
Conclusion
Spectroscopic ellipsometry in conjunction with a parametric dielectric function based multilayer model has been applied to the analysis of (AlGaIn)N heterostructures. Model dielectric functions for GaN, AlGaN, and InGaN have been derived. Further, the composition dependence of the AlxGa1−xN band gap energy (x≤0.16) has been deduced from the present SE data. Based on the parametric model dielectric functions, the measured pseudodielectric function spectrum of complete (AlGaIn)N QW LED structures and GaN/AlGaN layer sequences suitable for the fabrication of modulation doped field effect transistors could also be modeled, yielding fit values for the individual layer thicknesses in close agreement with those obtained by SIMS depth profiling. Thus the present study demonstrates the potential of spectroscopic ellipsometry for the analysis of layer thickness and composition in group III-nitride based device structures.
Acknowledgements
Thanks are due to M. Maier and Ch. Hoffmann for performing the SIMS and EDX analyses and to U. Kaufmann for stimulating discussions and careful reading of the manuscript. Continuous interest and encouragement by G. Weimann is gratefully acknowledged. Work was supported by the German Ministry for Education and Research.