


Introduction
Thallium (Tl) is a non-essential trace metal known for its high toxicity, both acute and chronic (Nriagu, Reference Nriagu1998). It is listed as a priority pollutant by the USEPA (2014). In the environment, it mainly exists in two oxidation states: Tl+ and Tl3+, with monovalent Tl+ being the dominant and more stable species under typical environmental pH and redox conditions (Nriagu, Reference Nriagu1998; Casiot et al., Reference Casiot, Egal, Bruneel, Verma, Parmentier and Elbaz-Poulichet2011). In nature, Tl is dispersed widely at low concentrations: 0.75 mg/kg in the continental crust, 0.001–0.25 μg/L in groundwater, and 0.012–0.016 μg/L in seawater (Xiao et al., Reference Xiao, Yang, Li, Zheng and Ning2012). Thallium exhibits both chalcophile and lithophile behaviour, allowing it to associate with metal sulfides (e.g. sulfides of Pb, Zn, Cu) as well as silicate minerals (e.g. replacing K, Rb, Cs in the structures of micas and feldspars) (Peter and Viraraghavan, Reference Peter and Viraraghavan2005; Liu et al., Reference Liu, Wang, Chen, Xie, Qi, Lippold, Luo, Wang, Su, He and Wu2016, Reference Garrido, Garcia-Guinea, Lopez-Arce, Voegelin, Göttlicher, Mangold and Almendros2020). The predominant anthropogenic sources of Tl include emissions and solid wastes from coal combustion and from ferrous and non-ferrous mining and smelting (Vaněk et al. Reference Vaněk, Komárek, Vokurková, Mihaljevič, Šebek, Panušková, Chrastný and Drábek2011, Reference Vaněk, Vejvodová, Mihaljevič, Ettler, Trubač, Vanková, Goliáš, Teper, Sutkowska, Vokurková, Penížek, Zádorová and Drábek2021, Reference Vaněk, Vejvodová, Mihaljevič, Ettler, Trubač, Vanková, Teper, Cabala, Sutkowska, Voegelin, Göttlicher, Holubík, Vokurková, Pavlů, Galušková and Zádorová2022 and references therein). Similar to several other metals and metalloids, Tl is produced mainly as a by-product of pyrite-rich ore smelting (e.g. Peter and Viraraghavan, Reference Peter and Viraraghavan2005); for instance up to 3.5 wt.% Tl is hosted in some pyrite from Xiangquan, clearly demonstrating the ability of pyrite to host significant concentrations of this heavy metal, as also recently established for pyrites from the ore deposits of the southern Apuan Alps, Tuscany, Italy, that may contain over 4200 mg/kg of Tl (George et al., Reference George, Biagioni, Lepore, Lacalamita, Agros, Capitani, Bonaccorsi and d’Acapito2019). Furthermore, small, but measurable Tl concentrations have been measured in certain electronic components such as TV and monitor screens (roughly 0.8 mg/kg). LCD/LED displays, printed circuit boards and photovoltaic/solar cells (∼0.4 mg/kg) (Willner et al., Reference Willner, Fornalczyk, Jablonska-Czapla, Grygoyc and Rachwal2021). Additionally, recent studies on lithium-ion batteries reports that leachates from some discarded Li-ion cells can contain Tl at levels above certain regional hazardous-waste limits, including that for batteries and battery-containing electronics (Liu et al., Reference Liu, Yuan, Lin, Wang, Sonne and Rinklebe2023).
Despite its acute toxicity, very little is known about the most effective Tl retention mechanisms, which ultimately hinders the design and development of remediation and assisted attenuation techniques for Tl-polluted areas. In the weathering zones of mine-affected areas, in soil layers without secondary Tl-bearing minerals, Tl+ adsorption on micaceous layer silicates (Martin et al. Reference Martin, Wissocq, Benedetti and Latrille2018; Wick et al., Reference Wick, Baeyens, Marques Fernandes and Voegelin2018; Voegelin et al., Reference Voegelin, Pfenninger, Petrikis, Majzlan, Plötze, Senn, Mangold, Steininger and Gottlicher2015, Reference Voegelin, Wick, Pfenninger, Mangold, Baeyens and Marques Fernandes2022), followed by Tl+ and Tl3+ adsorption on Mn oxides, has been identified as the dominant Tl retention mechanism (Wick et al., Reference Wick, Peña and Voegelin2019, Reference Wick, Baeyens, Marques Fernandes, Göttlicher, Fischer, Pfenninger, Plötze and Voegelin2020). However, in the environments with the very high Tl-concentration, Tl can also be incorporated into the crystal structure of secondary Tl minerals. These are predominantly arsenates and sulfates, and they can act as potential Tl sinks (Đorđević et al., Reference Đorđević, Karasalihović, Stöger-Pollach and Karanović2023). Sulfide minerals in association with low-temperature hydrothermal mineralization represent the main hosts for Tl. Within Tl-(bearing) deposits in hydrothermal settings pyrite is considered as the prevalent Tl-bearing phase. The generation of acid mine drainage (AMD) in the process of weathering-induced pyrite oxidation therefore releases significant amounts of Tl to the environment. However, secondary oxy-salt minerals (mostly sulfates and arsenates) play an important role in the weathering process as they may incorporate Tl and can act as a temporary source or storage for this toxic heavy metal. Dissolution of secondary sulfate minerals and addition of ferric iron can increase the rate of pyrite oxidation and accelerate the release of Tl incorporated into/from the sulfide minerals. Tl mobility is therefore strongly influenced by secondary sulfate minerals. In these secondary sulfate minerals Tl-occurrence is dominated by the substitution of Tl+ for K+ in K-bearing sulfates, but also through formation of Tl-only minerals, such as: dorallcharite TlFe3+3(SO4)2(OH)6, avicennite Tl2O3, thalliumpharmacosiderite Tl+Fe3+4[(AsO4)3(OH)4]·4H2O and lanmuchangite, Tl+Al(SO4)2·12H2O (Herrmann et al., Reference Herrmann, Voegelin, Palatinu, Mangold and Majzlan2018; Aguilar-Carrillo et al., Reference Aguilar-Carrillo, Herrera, Gutiérrez and Reyes-Domínguez2018a, Reference Aguilar-Carrillo, Villalobos, Pi-Puig, Escobar-Quiroz and Romero2018b, Reference Aguilar-Carrillo, Herrera-García, Reyes-Domínguez and E.J2020; Garrido et al., Reference Garrido, Garcia-Guinea, Lopez-Arce, Voegelin, Göttlicher, Mangold and Almendros2020; Đorđević et al., Reference Đorđević, Drahota, Kolitsch, Majzlan, Kiefer, Tepe, Hofmann, Serafimovski, Tasev, Boev and Boev2021a, Reference Đorđević, Drahota, Kolitsch, Majzlan, Perestá, Kiefer, Stöger-Pollach, Tepe, Hofmann, Mikuš, Tasev, Serafimovski, Boev and Boev2021b, Chen et al., Reference Chen, Wang, Zou and Chen2001). The characteristics of these minerals are crucial for their efficiency in Tl retention. While the water solubility of lanmuchangite characterises it as a transient sink and source of Tl, dorallcharite, Tl-jarosite and Tl-voltaite can act as a long-term storage and source of Tl in environments close to the surface (Zhao and Gu, Reference Zhao and Gu2021).
In this paper we present synthesis, crystal chemistry and crystal structures of three Tl-bearing double sulfate compounds: (Tl0.91K0.09)(Fe2.90Al0.10)(SO4)2(OH)6 (I), Tl+Al(SO4)2·12H2O (II) and Tl+Fe3+(SO4)2 (III). I and II, are synthetic analogues of the minerals dorallcharite and lanmuchangite, respectively. In this paper, we have explored the structural relationships with related minerals and inorganic compounds. Here, we present new insights into the chemical and structural properties of dorallcharite and lanmuchangite, thereby improving our understanding of how they form in Nature.
Experimental methods
Preparation of the single crystals
Synthetic analogues of the minerals dorallcharite (Tl0.91K0.09)(Fe2.90Al0.10)(SO4)2(OH)6 (I), lanmuchangite, Tl+Al(SO4)2·12H2O (II) and a synthetic TlFe(SO4)2 (III) have been obtained using a low-temperature hydrothermal method. The following reagents were used in stoichiometric quantities: FeSO4·7H2O (Alfa Aesar, ACS, 99+%), FeSO4 (Riedel-de Haën, exsiccated, puris.), Al2(SO4)3·16H2O (Fluka Chemika 06421, 1 kg, ≥ 98%), As2O5 (Alfa Products 87687, > 99.9%), Tl2SO4 (Fluka > 98%) and sulfuric acid (Merck, 95–97%). The synthetic procedure for I was based on the synthesis procedures outlined by Driscoll and Leinz (Reference Driscoll and Leinz2005) for the synthesis of different end-members of the jarosite-group minerals. Accordingly, we chose to conduct our experiment with a stable fluid volume and controlled pH levels. Two groups of samples with two different ferric components were prepared (FeSO4 and FeSO4·7H2O), yielding eight samples in one synthesis run. For the synthesis of I the mixtures of 98.1 mg of Tl2SO4 and 390.1 mg of FeSO4·7H2O were prepared and for the synthesis of III the mixtures of 55.5 mg of Tl2SO4 and 430.6 mg of FeSO4 were prepared. The mixtures were transferred into polytetrafluoroethylene vessels and filled with 10 ml of distilled water (∼80% of their inner volume). The pH values were adjusted with 95–97% H2SO4 to the values of 1. Subsequently, the mixtures were enclosed into stainless steel autoclaves and heated under autogenous pressure under the following heating and cooling conditions: the mixtures were heated from room temperature to 140°C (4 h), held at that temperature for 48 h, and cooled to room temperature (72 h). The reaction products were filtered and washed several times using distilled water.
For the synthesis of Tl+Al(SO4)2·12H2O (II) the mixtures of 50 mg of Tl2SO4, and 140 mg of Al2(SO4)3·16H2O were prepared. The mixtures were transferred into polytetrafluoroethylene vessels and filled with 2 ml of distilled water (∼80% of their inner volume). The pH values were adjusted with 0.01 ml of 95–97% H2SO4 to the value of 1. Subsequently, the mixture was enclosed into stainless steel autoclaves and heated under autogenous pressure under the following heating and cooling conditions: the mixtures were heated from room temperature to 170°C (4 h), held at that temperature for 60 h, and cooled to room temperature (96 h). The reaction products were filtered and washed several times using distilled water.
Single crystal X-ray diffraction analysis
Suitable single crystals were selected and glued to thin glass fibres. The crystals, which exhibited sharp reflection spots, were chosen for data collection.
For all three compounds (I–III) data collection was performed on a Nonius Kappa CCD single-crystal four-circle diffractometer (Mo tube, graphite monochromator, CCD detector frame size: 621×576 pixels, binned mode), equipped with a 300 μm diameter capillary optics collimator. A complete sphere of reciprocal space (φ and ω scans) was measured at room temperature. The intensity data were processed with the Nonius program suite DENZO-SMN (Nonius 2005–2007), corrected for Lorentz, polarization, and background effects and, by the multi-scan method (Otwinowski et al., Reference Otwinowski, Borek, Majewski and Minor2003), for absorption.
The crystal structures of I and III were solved in the trigonal space groups R  $\overline 3 $m (No. 166) and R
 $\overline 3 $ (No. 148), respectively, by direct methods using SHELXT (Sheldrick, Reference Sheldrick2015a) and refined on F 2 by full-matrix least-squares using SHELXL (Sheldrick, Reference Sheldrick2015b) via WinGX (Farrugia, Reference Farrugia2012). The structure of II was solved in cubic space group Pa
 $\overline 3 $ (No. 205) by direct methods using SIR2014 (Burla et al., Reference Burla, Caliandro, Carrozzini, Cascarano, Cuocci, Giacovazzo, Mallamo, Mazzone and Polidori2014) and refined on F 2 by full-matrix least squares using SHELXL (Sheldrick, Reference Sheldrick2015b) and WinGX (Farrugia, Reference Farrugia2012).
The initial location of the all non-hydrogen atoms in I revealed that they were located in the same positions as those reported earlier for the mineral dorallcharite Tl0.8K0.2Fe3+3(SO4)2(OH)6 (Balić-Žunić et al. Reference Balić-Žunić, Moelo, Lončar and Micheelsen1994): Tl+ is at special position 3a (site symmetry  $\overline 3 $m), S6+ is at 6c (site symmetry 3m) and Fe3+ is at 9d (site symmetry .2/m). Three O atoms and the H1 atom in the hydroxyl group O3H1 also occupy special positions: the O1 atom is at 6c, while two O atoms (O2 and O3) and the H1 atom are at special position 18h (site symmetry .m). Starting from the atom coordinates of natural dorallcharite, the structure refinements were completed with Tl at the A-site with the minor substitution of K+ and Fe3+ at the octahedral M 3+ site with the minor substitution of Al3+. All nonhydrogen atoms were refined anisotropically. A hydrogen atom from the hydroxide group O3H1 was located in the difference-Fourier maps and refined using DFIX distance restraints with O3–H1 = 0.85 Å and U iso(H1) = 1.5U eq(O3).
The crystal structure of II was solved in the cubic space group Pa  $\overline 3 $ (No. 205). H-atoms were found in difference-Fourier maps. After several cycles the refinement (anisotropic refinement of all atoms except for H-atoms, which were refined isotropically) has converged to R 1 = 0.0263 for 652 unique reflections with F o > 4σ(F o) and to R 1 = 0.0525 for all 947 unique reflections.
As already mentioned, the crystal structure of III was solved in the trigonal space group R  $\overline 3 $ (No. 148). During the subsequent refinements of III a short O–O distance (⁓ 1 Å) was observed which suggested a splitting of O2 over two symmetrically equivalent general positions O2A and O2B with partial occupancy. The occupancies of these two sites were fixed initially to 0.5 according to the formula TlFe(SO4)2. Later, two occupancies occ A and occ B were refined, which at the end of the refinement, displays occ A = 0.64 % and occ B = 0.36 % occupancy. In III, O-atoms occupy three sites: the special 6c position was found to be fully occupied by O1 and consequently fixed at 100% occupancy, but the other two, O2A and O2B, fill up 64% and 36% of two general 18f positions, respectively. The atomic displacement parameters of O2A and O2B have been constrained to identical values. Two positional parameters x A and x B of O2A and O2B were refined independently for the two atoms, but because of a negligible difference in the positional parameters y A and y B as well as z A and z B, they were refined as y A = y B and z A = z B. Pseudosymmetry, combined with consistently high residual factors, indicated the presence of twinning. Introduction of general and racemic twinning (twinning matrix
 $\overline 1 $ 0 0/0
 $\overline 1 $ 0/0 0 1) into the refinement improved R-values significantly. The general and racemic twinning were refined simultaneously, and the resulting BASF 0.22751 0.18810 0.22767 means that all four individuals are present in similar amounts.
Crystal data, information on the data collection and results of the final structure refinements for I, II and III structures are summarized in Table 1. The final atomic parameters (fractional atomic coordinates, occupancies and equivalent or isotropic and anisotropic atomic displacement parameters) are given in Table 2. Selected bond distances (Å) and angles (°) are presented in Table 3. Bond-valence sums are given in Table 4. The crystallographic information files have been deposited and are available as Supplementary material (see below). The molecular graphics were done with ATOMS (Dowty, Reference Dowty2000) and VESTA-3.2.1 (Momma and Izumi, Reference Momma and Izumi2011).
Crystal data, data collection and refinement details for synthesized compounds I, II and III

Table 1 Long description
Crystal data plus data collection and refinement parameters are listed for compounds I, II, and III. Chemical formulas are Al0.29H18Fe8.71K0.27O42S6Tl2.73 for I, Al2H48O40S4Tl2 for II, and FeO8S2Tl for III, with formula weights 1945.27, 1279.32, and 452.34. Crystal sizes are 0.03 by 0.03 by 0.04 millimeters for I, 0.01 by 0.03 by 0.05 for II, and 0.03 by 0.06 by 0.06 for III, and absorption correction factors list Tmin and Tmax as 0.165 and 0.190 for I, 0.402 and 0.419 for II, and Tmax 0.086 with Tmin 0.068 for III. Data measurement temperature is 298 with an uncertainty of 1 kelvin for all three, and crystal descriptions are transparent orange brownish trigonal for I, plate like for II, and transparent colourless leaf like for III. Crystal system and space group are trigonal R minus 3 m colon H number 166 for I, cubic Pa minus 3 number 205 for II, and trigonal R minus 3 colon H number 148 for III; unit cell parameters a are 7.3330, 12.2727, and 4.8375 angstroms, and c are 17.7118, 12.2727, and 24.7905 angstroms for I, II, and III. Volumes V are 824.81, 1848.5, and 502.41 cubic angstroms, Z values are 1, 2, and 3, densities Dx are 3.916, 2.298, and 4.485 grams per cubic centimeter, and absorption coefficients mu are 17.55, 9.10, and 26.82 per millimeter for I, II, and III. F zero zero zero values are 906 for I, 1240 for II, and 609 for III; theta ranges are 3.4 to 32.5 degrees for I, 3.7 to 30.5 for II, and 4.9 to 32.5 for III, with Miller index ranges given for h, k, and l in each column. Reflections collected and unique are 3924 and 402 for I, 21119 and 947 for II, and 5942 and 414 for III, each with an Rint value; reflections, restraints, and parameters are 402, 2, and 30 for I, 947, 6, and 55 for II, and 414, 0, and 26 for III, with observed reflections listed as 376, 652, and 400. Extinction coefficients k are 0.00064 with uncertainty 17 for I, 0.00092 with uncertainty 17 for II, and 0.0002 with uncertainty 3 for III; goodness of fit S is 1.08, 1.02, and 1.20, and R indices are provided for I greater than 2 sigma I and for all data for each compound. Delta over sigma max is less than 0.001 for all three, and largest difference peak and hole list delta rho max and delta rho min as 1.62 and minus 1.38 for I, 0.28 and minus 0.51 for II, and 1.78 and minus 1.39 for III.
‡ Fc* = Fck[1+0.001Fc 2λ3/sin(2θ)]–1/4
* w = 1/[σ2(Fo 2) + (0.0206P)2 + 4.8153P]
** w = 1/[σ2(Fo 2)+(0.0277 P)2+0.6147P]
*** w = 1/[σ2(F o2) + (0.0198P)2 + 2.445P] where P = (F o2 + 2F c2)/3.
Fractional atomic coordinates with equivalent, isotropic* and anisotropic** displacement parameters (Å2) for synthesized crystals I, II and III

Table 2 Long description
Rows list atoms for three crystals, with columns for Atom, Site, combined x, y, z, separate x, y, z, Occ. with values shown only when less than 1, Uiso or Ueq, and anisotropic terms U11, U22, U33, U12, U13, and U23. Crystal I, space group R minus 3m number 166, includes Tl1 and K1 at site 3a with x 0, y 0, z 0 and occupancies 0.909(7) and 0.091(7), both with Uiso or Ueq 0.01909(14) and anisotropic entries U11 0.02142(16), U22 listed as U11, U33 0.01442(19), U12 0.01071(8), U13 0, and U23 0. Crystal I also lists Fe1 and Al1 at site 9d with x 0.5, y 0, z 0.5 and occupancies 0.968(12) and 0.032(12), each with Uiso or Ueq 0.0103(2), U11 0.0100(3), U22 0.0081(3), U33 0.0120(4), U12 listed as U22 divided by 2, U13 0.00013(11), and U23 listed as 2U13. Crystal I lists S1 at site 6c with z 0.30467(8), O1 at site 6c with z 0.6127(2), O2 at site 18h with x 0.22319(19), y 0.77681(19), z 0.94228(13), O3 at site 18h with x 0.1285(2), y 0.8715(2), z 0.13727(14), and H1 at site 18h with x 0.187(2), y 0.813(2), z 0.114(2) and Uiso 0.022 with an asterisk. Crystal II, space group Pa minus 3 number 205, lists Al1 at site 4a with x 0, y 0, z 0 and Uiso or Ueq 0.0226(3), Tl1 at site 4b with x 0.5, y 0.5, z 0.5 and Uiso or Ueq 0.06732(16), and S1 at site 8c with x, y, z all 0.33099(4) and Uiso or Ueq 0.0257(2), with several anisotropic columns using entries such as U11, U12, and repeated U12. Crystal II oxygen rows include O1 at site 24d with x 0.99809(13), y minus 0.00003(12), z 0.15321(14) and full anisotropic values, plus H1A and H1B at site 24d with Uiso values 0.035(8) and 0.051(9) marked with asterisks; O2 at site 24d with x 0.05135(16), y 0.21035(16), z 0.34369(15) and full anisotropic values, plus H2A and H2B with Uiso 0.068(10) and 0.054(9) marked with asterisks; O3 at site 24d with x 0.28267(14), y 0.34003(13), z 0.44010(13) and full anisotropic values; and O4 at site 8c with x, y, z all 0.26204(14) and Uiso or Ueq 0.0485(9). Crystal III, space group R minus 3 number 148, lists Tl1 at site 3a with x 0, y 0, z 0 and Uiso or Ueq 0.02475(17), Fe1 at site 3b with x 0, y 0, z 0.5 and Uiso or Ueq 0.0099(2), S1 at site 6c with z 0.76552(6) and Uiso or Ueq 0.0095(3), and O1 at site 6c with z 0.7071(2) and Uiso or Ueq 0.0210(10), with anisotropic columns often using U11, U11 divided by 2, and zeros for U13 and U23. Crystal III includes two oxygen entries at site 18f sharing y 0.3592(9) and z 0.45241(15), with O2A at x 0.2952(13) and occupancy 0.644(11), and O2B at x 0.068(2) and occupancy 0.356(11), both with the same listed Uiso or Ueq 0.0145(7) and the same anisotropic values.
* Ueq is defined as one third of the trace of the orthogonalized Uij tensor; **The anisotropic displacement factor exponent takes the form: –2π2[h2a*2U11 + … + 2hka*b*U12]. ‘Occ’ = occupancy.
Selected bond lengths (Å) and angles (°) in the compounds I, II and III

Table 3 Long description
Measurements reported are bond lengths in angstroms and bond angles in degrees for three columns labeled I, II, and III, followed by hydrogen bond geometry for I and II. In I, M1 to O3i is 1.9903(10) times 4 and M1 to O2ii is 2.059(2) times 2, with mean M1 to O of 2.013; S1 to O1iii is 1.463(4) and S1 to O2iv is 1.491(2) times 3, with mean S1 to O of 1.484. In II, Al1 to O1i is 1.8804(17) times 6; S1 to O3 is 1.4686(15) times 3 and S1 to O4 is 1.466(3), with mean S1 to O of 1.468. In III, O2A to O2B is 1.101(9); Fe1 to O2A is 1.992(4) times 6 and Fe1 to O2B is 1.988(5) times 6; S1 to O1 is 1.447(5), S1 to O2B is 1.485(5) times 3, S1 to O2A is 1.491(4) times 3, with mean S1 to O values listed as 1.476 and 1.480. Selected angles include in I, O3i to Fe1 to O3v 89.48(15), O3vi to Fe1 to O3v 90.52(15), O3i to Fe1 to O2ii 90.99(8), O3vi to Fe1 to O2ii 89.01(8), O1iii to S1 to O2vii 110.19(10), and O2iv to S1 to O2vii 108.74(10); in II, O1ii to Al1 to O1iii 89.28(7), O1ii to Al1 to O1iv 90.72(7), O4 to S1 to O3 109.68(8), and O3v to S1 to O3 109.26(8); in III, S1i to O2A to Fe1 138.3(4), S1i to O2B to Fe1 139.3(7), O2B to Fe1 to O2Bii 91.63(19), O2B to Fe1 to O2Biii 88.37(19), O2A to Fe1 to O2Aiv 91.49(17), O2A to Fe1 to O2Av 88.51(16), O1 to S1 to O2Bvi 109.74(17), and O1 to S1 to O2Avii 109.65(16). Longer contacts are listed for A1 and Tl1: in I, A1 to O3viii is 2.928(3) times 6 and A1 to O2ix is 3.013(2) times 6, with mean A1 to O of 2.971; in II, Tl1 to O2vi is 3.277(2) times 6 and Tl1 to O3vii is 3.3925(18) times 6, with mean Tl1 to O of 3.335; in III, Tl1 to O1 is 2.9678(18) times 6, Tl1 to O2A is 3.491(5) times 6, Tl1 to O2B is 3.500(7) times 6, with mean Tl1 to O values listed as 3.229 and 3.234. Hydrogen bond geometry is given as donor acceptor, D to H, H to A, D to A, and D to H to A: for I, O3 to H1 to O1i has 0.85(2), 2.14(2), 2.990(3), and 179(5); for II, O1 to H1A to O2i has 0.85(2), 1.76(2), 2.606(2), 170(3), O1 to H1B to O3ii has 0.85(2), 1.81(2), 2.648(2), 170(3), O2 to H2A to O4 has 0.82(2), 2.07(2), 2.845(2), 156(3), and O2 to H2B to O3iii has 0.79(2), 2.00(3), 2.781(3), 171(3).
Notes: Symmetry codes for I: (i) –x+1/3, –y+2/3, –z+2/3; (ii) –x+2/3, –x+y–2/3, –z+4/3; (iii) –x+1, –y, –z+1; (iv) x+2/3, x–y+1/3, z–2/3; (v) –x+y–1/3, y–2/3, z+1/3; (vi) x+2/3, y–2/3, z+1/3; (vii) –x+y+2/3, y–2/3, z–2/3; (viii) x, x–y+1, z; (ix) –x+y–1, y–1, z–1. Symmetry codes for II: (i) –y, –z, –x+1; (ii) –z, –x+1, –y; (iii) x–1, y, z; (iv) –x+1, –y, –z; (v) y, z, x; (vi) –x+1/2, y+1/2, z; (vii) –z+1, –x+1, –y+1. Symmetry codes for III: (i) x+1/3, y+2/3, z–1/3; (ii) y, –x+y, –z+1; (iii) –y, x–y, z; (iv) x–y, x, –z+1; (v) –x+y, –x, z; (vi) –y+2/3, x–y+1/3, z+1/3; (vii) x–1/3, y–2/3, z+1/3
Hydrogen bonding symmetry codes for I: (i) –x+1/3, –y+2/3, –z+2/3; (ii) x–y+1, –y+1, –z; (iii) x, y–1, z–1. Hydrogen bonding symmetry codes for II: (i) z+1/2, x, –y+1/2; (ii) –y+3/2, z–1/2, x; (iii) z–1/2, x, –y+1/2.
Bond-valence sums (vu) for I, II and III*

Table 4 Long description
Bond valence values are listed for three sets labeled I, II, and III, with oxygen columns and a cation-sum column for each set. In set I, cation sums are 1.226 for Tl1, 3.004 for Fe1, and 5.840 for S1, while K1 and Al1 have blank entries in the cation-sum column. Set I includes a row labeled Sigma with oxygen totals of 1.541 for O1, 1.963 for O2, and 1.176 for O3, and a row labeled Sigma anions with 2.105 for O1, 2.145 for O2, and 1.919 for O3. Set I also lists H1 with a cation sum of 0.931 and oxygen entries under O1, O2, O3, and O4. In set II, cation sums are 0.456 for Tl1, 2.970 for Al1, and 6.100 for S1, and the Sigma anions row gives 1.979 for O1, 1.883 for O2, 2.039 for O3, and 2.142 for O4. Set II lists four hydrogen rows, H1A, H1B, H2A, and H2B, with cation sums of 1.024, 1.009, 0.969, and 1.009. In set III, oxygen columns are O1, O2A, and O2B, and cation sums are 0.762 with a parenthetical 0.756 for Tl1, 3.198 with a parenthetical 3.234 for Fe1, and 5.913 with a parenthetical 5.982 for S1. Set III ends with Sigma anions totals of 1.920 for O1, 1.991 for O2A, and 2.019 for O2B.
* Parameters [Ro; B] for calculation of the bond valences were taken at http://www.iucr.org/resources/data/datasets/bond-valence-parameters from BVPARM2020.CIF: Al–O2– [1.620; 0.37]; Fe(III)–O2– [1.759; 0.37]; S(VI)–O2– [1.624; 0.37]; Tl(I)–O2– [2.124; 0.37]; H–O2– [0.569; 0.94]
Scanning electron microscopy
Qualitative chemical analyses and micromorphology of synthetic Tl-sulfates were studied with a JEOL JSM-6610 LV scanning electron microscope (SEM) with tungsten filament (15 kV), equipped with an energy-dispersive X-ray (EDX) detector (Bruker e-FlashHR+, resolution 127 eV) and Bruker Esprit 2.0 software. Spectra were recorded for 60 s and with dead times <5%. The investigated crystals were fixed with conducting carbon onto Al-sample holders and were consequently coated with a thin layer of carbon for chemical analysis.
Vibrational spectroscopy
To investigate the hydrous species in more detail Fourier-transform infrared (FTIR) absorption spectra of I and II were recorded on a Bruker Tensor 27 FTIR spectrophotometer with a mid-IR glowbar light source and KBr beam splitter, attached to a Hyperion 2000 FTIR microscope with liquid nitrogen-300-cooled mid-IR broad band MCT detector in the range between 4000–550 cm–1. A total of 128 scans were accumulated between 4000 and 550 cm–1 with a 100 mm diameter circular sample aperture and ATR 15× objective.
In order to study the sulfate groups in more detail single-crystal Raman spectra of I–III were measured with a Horiba LabRam-HR system equipped with Olympus BX41 optical microscope in the spectral range between 100 and 1800 cm–1 and between 3200 and 3600 cm–1 The 532 nm excitation line of a He–Ne laser was focussed with a 50× objective (N.A. = 0.90) on the randomly orientated single crystals. The system was calibrated before each experimental session using the 520.6 cm–1 Raman band of silicon. Nominal exposure time of the acquired spectra was between 10 and 30 s (confocal mode, Olympus 1800 lines/mm, ∼0.8 cm–1 peak resolution, 1.5 μm lateral resolutions, and ∼3 μm depth resolution). The laser power was controlled by means of a series of density filters for possible sample changes due to intense laser-light absorption and resulting temperature increase.
Transmission electron microscopy
For TEM analysis, lamellae of I were prepared by employing focused ion beam (FIB) using a ThermoFisher Scios II dual beam FIB. The lamellae were then transferred directly into a FEI TECNAI F20, which is equipped with a GATAN GIF Tridiem energy filter and an EDAX APOLLO XII EDX detector. Quantitative chemical analysis using EDX has 10% relative error due to the spectral noise. Tl was identified via the Tl L series (TlLα, TlLβ) and via the Tl M-series (TlMα, TlMβ, TlMγ, and TlMz peaks). Both are present in the recorded EDX data. The SKα peak does overlap with the TlMα peak but quantification was performed by using the TlLα peak. There is no overlap with any constituents of the respective material, neither for the OK peak, nor for the TlLα peak. Energy electron loss spectroscopy (EELS)-data were used for determining the oxidation state of Fe within the crystals of I. For this purpose, the energy loss near edge structure (ELNES) of the Fe-L 3,2 ionisation edge was measured via EELS. The collection angle used was 4.03 mrad. For the determination of the Fe L 3/L 2 ratio the method introduced in van Aken and Liebscher (Reference van Aken and Liebscher2002) was employed. Selected area diffraction was recorded using the GATAN Orius 600 charge-coupled device (CCD) camera.
Results and discussion
Synthesized compounds
Compound I crystallised as transparent orange rhombohedral crystals up to 80 µm in length (Fig. 1a) and III crystallised as the leaf-like crystals up to 200 µm in length (yield ca. 95%) (Fig. 1b) together with brownish and small (up to 15 µm in length) unidentified Tl-Fe-sulfate (yield ca. 5%).
Scanning electron microscopy (SEM) images of the synthesised single crystals. (a) Compound I, (Tl0.91K0.09)(Fe2.90Al0.10)(SO4)2(OH)6; (b) compound III Tl+Fe3+(SO4)2; and (c) compound II, Tl+Al(SO4)2·12H2O.

Compound II crystallised as transparent plate-like crystals up to 90 µm in length (Fig. 1c) (yield ca. 20 %) together with unidentified needle-like Tl-sulfates (yield ca. 60 %) and tabular-like single-crystals of Tl2SO4 (yield ca. 20%).
The SEM-EDX data proved the presence of each reported element in I, II and III (Table S1 and S3; Figs S1–S3).
Crystal chemistry and structural properties of (Tl0.91K0.09)(Fe2.90Al0.10)(SO4)2(OH)6 (I)
Compound I is the synthetic analogue of mineral dorallcharite, nominally Tl+Fe33+(SO4)2(OH)6. SEM-EDX, TEM-EDX and SCXRD analyses show there is minor substitution of K+ for Tl+ at the A + site and Al3+ for Fe3+ at the octahedral M 3+ site.
In the layered crystal structure of I, the M 3+ (M = Fe3+ and Al3+) cations are in a nearly regular octahedral coordination (Fig. 2a). Two apical O2 and four equatorial O3 oxygen atoms of hydroxyl groups generate slightly elongated octahedra MO2(OH)4, contrary to the shortened octahedra, which were found in the mineral dorallcharite (Balić-Žunić et al., Reference Balić-Žunić, Moelo, Lončar and Micheelsen1994). More precisely, the M 3+ cations are surrounded by four equatorial hydroxide O3H1 ligands at M 3+–O3 = 1.9903(10) Å distances and two axial oxide O2 ligands at Fe–O2 = 2.059(2) Å distances. The average M 3+–O distance of <2.013> Å (Table 3) is near to the calculated from the effective ionic radii (Shannon, Reference Shannon1976) of six-coordinated Fe3+ high spin ions and O2– (0.645 + 1.38 = 2.025 Å) as well as practically identical to the reported average Fe3+–O bond length of 2.015 Å (Gagné and Hawthorne, Reference Gagné and Hawthorne2020). The very small amount of Al3+, and consequently its influence on the bond lengths, is much lower. The calculated length from the effective ionic radii (Shannon, Reference Shannon1976) of six-coordinated Al3+ is 0.535 + 1.38 = 1.915 Å, while the reported average Al–O bond length is <1.903> Å (Gagné and Hawthorne, Reference Gagné and Hawthorne2018a). The calculated (using the parameters given by Brown and Altermatt (Reference Brown and Altermatt1985)) bond valence sum is Σνij = 3.03 vu (valence unit) suggesting that octahedral trivalent cations are well balanced (Table 4).
The stacking of layers in I along the c-axis in two projections: viewed along [1 1  $\overline 2 $ 0]-axis (a) and along [0 0 0 1]-axis (b). The Kagomé layers made of MO2(OH)4-octahedra (brown) are sandwiched between two heteropolyhedral Tl+-sulfate layers. The black lines mark the unit cell. H atoms are shown as small pale pinkish spheres, O atoms as red sphere, A atoms as grey spheres, S-atoms and sulfate tetrahedra are yellow.

Figure 2 Long description
A crystal structure in two projections. In the first projection, labeled (a), the view is along the [1 1 -2 0]-axis. It shows a series of interconnected polyhedra, with each labeled ′O1′. These polyhedra form a repeating pattern, indicating the stacking of layers. The Kagome layers, made of O(OH)-octahedra, are sandwiched between two heteropolyhedral Tl-sulfate layers. The polyhedra are depicted in different colors to distinguish their types. Small spheres represent atoms: pale pinkish for hydrogen, red for oxygen, grey for other atoms and yellow for sulfur atoms and sulfate tetrahedra. The second projection, labeled (b), is viewed along the [0 0 0 1]-axis. This view also displays a network of polyhedra, similarly labeled ′O1′, arranged in a different orientation, showing how the layers connect and interact. The black lines mark the unit cell in both projections.
Sharing four O3 vertices, the adjacent octahedra generate a network of six-membered octahedral rings (Fig. 2b). The hydroxide ligands O3H1 bridge between M 3+ centres, which form ideal Kagomé layers, parallel to (0001) (Fig. 6). These Kagomé layers in an octahedral network can also be visualized in terms of a net. When viewed along the c-axis, the structure can be considered as containing a two-dimensional 3.6.3.6 net with all edges and vertices equivalent (Net 7 defined by O’Keeffe and Hyde, Reference O’Keeffe and Hyde1980). Kagomé layers are mutually connected by the heteropolyhedral A-sulfate layers (Figs 2, 6) via hydrogen bonds O3–H1···O1 and large A + cations.
The S6+ ion is tetrahedrally coordinated by three basal O2 and one apical O1 oxygen atoms. The slightly-distorted SO4 tetrahedra are mutually isolated and have one shorter [S–O1 = 1.464(4) Å] and three slightly longer [S–O2 = 1.491(3) Å] bonds (Fig. 2, Table 3). The shorter S–O1 bond involves apical O1, which further acts as the acceptor of three linear middle strong hydrogen bonds O3–H1···O1 (Table 3). The H1 atom from the O3H1 hydroxide group is hydrogen-bonded to the neighbouring O1 at the distance of 2.14(2) Å. The bond angle O3–H1···O1i [symmetry code: (i) –x+1/3, –y+2/3, –z+2/3] is 179(5)°. Three somewhat longer S–O2 bonds involve three basal O2 atoms, which are further bonded to three M 3+ cations. In that way each SO4 tetrahedra are sharing three vertices (O2 atoms) with three M 3+O2(OH)4 octahedra and the adjacent M 3+O2(OH)4 octahedra are linked together by the corners of SO4 tetrahedra. The average S–O distance of <1.484> Å is in the middle between the sum of the effective ionic radii reported by Shannon (Reference Shannon1976) for the tetrahedrally coordinated S6+ and O2– (0.12 + 1.38 = 1.50 Å) and the average bond length of 1.473 Å reported by Gagné and Hawthorne (Reference Gagné and Hawthorne2018b). The bond valence sum is Σνij = 5.84 vu, which is close to the formal charge of the S6+ cation in tetrahedral coordination (Table 4).
The large cation sites A + are characterized by icosahedral coordination which is formed by six oxygen atoms from hydroxyl groups at distances A +–O3 = 2.929(3) Å [0.114×6 vu] plus an additional six oxygen neighbours at somewhat longer distances of A +–O2 = 3.014(2) Å [0.090×6 vu] forming very regular coordination geometries and having A + at the centre of the coordination sphere. The predominant cation Tl+ contains the 6s 2 lone electron pair, which is often considered a cause of stereochemically distorted coordinations. In this structure, like in the crystal structure of picotpaulite TlFe2S3 (Balić-Žunić et al., Reference Balić-Žunić, Karanović and Poleti2008), Tl exhibits surprisingly regular coordination which means that its lone electron pair behaves as a completely inert pair in the structure. The corresponding average A +–O bond lengths of <2.971> Å is slightly shorter than the calculated value from the effective ionic radii (Shannon, Reference Shannon1976) for 12-coordinated Tl+ ions (1.7 + 1.38 = 3.08 Å) and the <Tl+–O> average distance of <3.195> Å reported by Gagné and Hawthorne (Reference Gagné and Hawthorne2018a). SEM-EDX and TEM-EDX data show the presence of a very small amount of K+ (the ratio of effective ionic radii for CN = 12 is K+:Tl+ = 1.64:1.70). Therefore, the shorter bond lengths can be interpreted in part because of the minor substitution of K+ for Tl+ at the A site. The <K–O> average distance of 3.095 Å is reported by Gagné and Hawthorne (Reference Gagné and Hawthorne2016). The bond-valence sum of 1.226 vu suggests that the A + is somewhat overbonded at its 12-coordinate icosahedral environment.
Considering the contribution of the non-H atoms only, the bond-valence sums for the oxygen atoms are 1.541 for O1, 1.963 for O2 and 1.176 vu for O3 (Table 4). The low bond-valence sum for O1 is because it acts as an acceptor for three linear [D···A = 2.990(3) Å and bond angle is <(DHA) = 179(5)°] middle strong hydrogen bonds (three symmetry equivalents of H1). All acceptor O1 atoms involved in hydrogen bonding are entirely from SO4 tetrahedra, providing the linkage between the SO4-groups and O3H1-groups. Considering that O3 acts as a single hydrogen bond donor of a middle strong hydrogen bond towards O1 the bond valences are well balanced.
Crystal chemistry and structural properties of Tl+Al(SO4)2·12H2O (II)
The studied sample II is cubic and isostructural with the β-alum CsAl(SO4)2·12H2O. Twelve water molecules of TlAl(SO4)2·12H2O are located on two crystallographically different positions surrounding the trivalent Al3+ and the monovalent cation Tl+.
The almost perfect [Al(H2O)6]3+ octahedron is formed by the six O atoms from water molecules (H2O1) around the aluminium Al3+ in II (Fig. 3). The principal orthogonal axes of this octahedron coincide almost exactly with the unit cell axes. The angles between the axes of this octahedron are 90.72(7)° and 89.28(7)°. The Al–O bond distance of 1.8804(17) Å is somewhat shorter than 0.535 + 1.38 = 1.915 Å (Shannon, Reference Shannon1976), the sum of effective ionic radii of six-coordinated Al3+ with O-atoms. It is also slightly shorter than the <Al3+–O> average bond length of 1.903 Å reported by Gagné and Hawthorne (Reference Gagné and Hawthorne2018a). Therefore, the calculated bond-valence sum of 3.225 vu is expectedly slightly greater (Table 4).
A network of hydrogen bonds O–H···O marked by dashed lines in II (a). The oxygen O4, being on a threefold axis, is a triple hydrogen-bond acceptor from three symmetry equivalent H2A atoms of water molecule H2O2. The projection of II along the trigonal axis (b) represents one SO4 tetrahedra, three TlO26 flat hexagons and three AlO6 octahedra linked by hydrogen bonds. Each H2O1 water molecule situated around Al links one O2 from H2O2 around Tl and one O3 of the SO4 tetrahedra, while each H2O2 links, beside H2O1, one O3 and one O4 of the neighbouring SO4 tetrahedra.

Figure 3 Long description
The diagram consists of two panels, labeled a and b , illustrating crystal structures with hydrogen-bond networks. In panel a , a polyhedral representation shows a network of hydrogen bonds marked by dashed lines connecting oxygen atoms, labeled as O followed by a number and mediated by hydrogen atoms, labeled as H followed by a number and a letter. The structure includes tetrahedral and larger polyhedral shapes, with the dashed lines forming an extended network. In panel b, the projection shows a radial arrangement of polyhedra, including one central tetrahedron linked by dashed lines to surrounding polyhedra. The hydrogen bonds connect the oxygen sites, demonstrating a more clustered arrangement compared to panel a.
The tetrahedral sulfate ions SO42– lie on threefold axes in II. The four O atoms (three O3 at general 24d and one O4 at special 8c positions) around the sulfur ion S6+ are arranged in a quite regular tetrahedron. The SO42– tetrahedra are linked by H-bonds to [Al(H2O)6]3+ octahedra (Fig. 3a). The angles in the sulfate group of 109.68(8)° and 109.26(8)° are almost identical to the ideal value of 109.5°. The S–O distances [S–O3 = 1.4687(15) Å and S–O4 = 1.466(3) Å] are close to the calculated sum of the effective ionic radii reported by Shannon (Reference Shannon1976) for S–O distances in the tetrahedral sulfate group (0.12 + 1.38 = 1.50 Å). They are also almost identical to the average bond length of <1.473> Å reported by Gagné and Hawthorne (Reference Gagné and Hawthorne2018b).
The remaining six water molecules (H2O2) form a six-membered planar ring surrounding the monovalent Tl+ (Fig. 3b). The Tl+ cations, which are central atoms of these six-membered planar rings, are located at an inversion centre at ½, ½, ½ and at the middle of the unit cell edges. A first coordination shell of Tl+ is formed by six symmetry equivalent oxygens from a water molecule (O2) at the distance of 3.277(2) Å. The distance is slightly larger than 1.50 + 1.38 = 2.882 Å, the sum of effective ionic radii of six coordinated Tl+ with oxygen atoms (Shannon, Reference Shannon1976). It is equal to the maximum bond length of 3.271 Å for Tl–O reported by Gagné and Hawthorne (Reference Gagné and Hawthorne2018a). Consequently, the corresponding bond-valence sum is rather low, i.e. 0.0443 × 6 = 0.2659 vu (Brown and Altermatt, Reference Brown and Altermatt1985). The next six symmetry equivalent oxygen atoms O3 are at distance Tl1–O3 = 3.3925(18) Å, which is longer than 1.70 + 1.38 = 3.08 Å, the sum of effective ionic radii of 12-coordinated Tl+ with oxygen atoms (Shannon, Reference Shannon1976). Their contribution to the bond-valence sum is 0.0324 × 6 = 0.1945 vu which leads to the total sum of 0.46 vu for Tl+. However, the thallium is still highly undersaturated indicating possible vacancies at the Tl-site. The refinement showed that no such significant vacancies are present at this site [the refined occupancy was 0.972(4)]. Therefore, the refinement was completed with a fixed atom site-occupancy value of 1.
Both water molecules form hydrogen bonds (Fig. 3a, Table 3). The H2O1 water molecule acts as a double hydrogen-bond donor to the oxygen atom O2 from other water molecules and to O3 from SO42– tetrahedra. The second water molecule H2O2 acts also as a double hydrogen-bond donor to the oxygen atoms O3 and O4 (both from SO42– tetrahedra) and as a single H-bond acceptor from the water molecule H2O1. In addition, O3 acts as a double hydrogen-bond acceptor from both water molecules H2O1 and H2O2. Finally, O4 acts as a triple hydrogen-bond acceptor from three symmetry equivalents of the water molecule H2O2. In that way the SO42– tetrahedra are linked by water molecules and [Al(H2O)6]3+ octahedra (Fig. 3a,b).
Crystal chemistry and structural properties of Tl+Fe3+(SO4)2 (III)
The crystal structure of III can be described as a stacking sequence of anionic layers built up of slightly distorted FeO6 octahedra and SO4 tetrahedra, which share disordered oxygen atoms O2A and O2B. The interatomic distances and angles for FeO6 octahedra and SO4 tetrahedra are within the expected ranges (Table 3). The anionic layers are parallel to the (0001) plane and they alternate with planar triangular Tl+-nets (Fig. 4a,b).
The rotation of FeO6-octahedra and SO4-tetrahedra in the anionic layer of III generated by structural distortion. Polyhedral views of III when O2A are vacant (a, b) and when O2B are vacant (c, d). Red ellipsoids are for unoccupied O2A (a) and O2B (b) sites. The connection of FeO6-octahedra (brown) with SO4-tetrahedra (greenish yellow) viewed along the c-axis is shown in (b, d). TlO16-polyhedra (grey) remain unchanged during rotation in (a, c).

Figure 4 Long description
The image consists of four sub-images labeled a, b, c and d. In sub-image a, the structure shows FeO-octahedra in brown and SO-tetrahedra in greenish yellow, with red ellipsoids indicating unoccupied O2A sites. TlO1-polyhedra in grey remain unchanged. Sub-image b displays a similar structure with the connection of FeO-octahedra and SO-tetrahedra viewed along the axis, highlighting the vacant O2A positions. Sub-image c illustrates the arrangement when O2B positions are vacant, with the same color scheme for the polyhedra. Sub-image d shows the connection of FeO-octahedra and SO-tetrahedra along the axis with vacant O2B sites. The diagrams include axes labeled a, b and c for orientation.
One of the important features of this structure is its disorder that is associated with the rotation of basal oxygen atoms O2A and O2B around Fe3+ and S6+ cations. Instead of one O2, two basal oxygen atoms O2A and O2B of the SO4 tetrahedron are situated at partly occupied and distinct but close (O2A–O2B = 1.101(9) Å) crystallographic positions (Fig. 4a,b). The distortion does not involve cations and the apical oxygen atom O1. Neither the separation of their sites nor the transformation of their local symmetry was detected, i.e. Tl+, Fe3+, S6+ and O12– are still located at their 6c (S and O1), 3b (Fe) and 3a (Tl) sites. The Fe3+ ions are situated at the centre of an almost regular octahedra formed by six O2A (64%) or O2B (36%) vertices. All six octahedron vertices are shared by six neighbouring SO4 tetrahedra. The corner-sharing polyhedral angles Fe–O2A–S and Fe–O2B–S are 138.3(4)° and 139.3(7)°, respectively. Six Fe–O2B bond lengths of 1.988(5) Å are slightly shorter than Fe–O2A bonds of 1.992(4) Å, which is near to the distance calculated from the effective ionic radii (Shannon, Reference Shannon1976) of six-coordinated Fe3+ high spin ions and O2– (0.645 + 1.38 = 2.025 Å) as well as close to the reported average Fe3+–O bond length of 2.015 Å (Gagné and Hawthorne, Reference Gagné and Hawthorne2020).
The basal oxygen atoms O2A and O2B are bonded to S atoms to form slightly distorted tetrahedra with slightly different S–O distances [S–O2A = 1.491(4) and S–O2B = 1.485(5) Å], which is close to the calculated sum of the effective ionic radii reported by Shannon (Reference Shannon1976) for S6+ in tetrahedral coordination and O2– (0.12 + 1.38 = 1.50 Å) and the average bond length of 1.473 Å reported by Gagné and Hawthorne (Reference Gagné and Hawthorne2018b). The apical O1 oxygen of the SO4 tetrahedron is at the somewhat shorter distance of 1.447(5) Å.
If only the Tl–O distances below 3.0 Å are considered, TlO16-polyhedron in III can be described as an orthorhombic bipyramid formed by six O1 atoms. The adjacent TlO16-polyhedra share O1–O1 edges (Fig. S5b). A further six oxygen atoms are at longer distances: Tl–O2A = 3.491(5) and Tl–O2B = 3.500(7) Å. They build TlO2A6 and TlO2B6 polyhedra which can be described as a trigonal antiprism of six O2A/O2B atoms (Figs 5a, 5c). The combined TlO6+6 polyhedra still share only O1–O1 edges (Figs 5b, 5d). The corresponding average Tl+–O bond lengths of <3.229> and <3.234> Å are longer than the calculated value from the effective ionic radii (Shannon, Reference Shannon1976) for 12-coordinated Tl+ ions (1.7 + 1.38 = 3.08 Å) and the <Tl+–O> reported average of 3.195 Å (Gagné and Hawthorne, Reference Gagné and Hawthorne2018a). Like in I (Fig. S5a), the lone electron pair of Tl behaves as a completely inert pair in the structure of III.
Trigonal antiprisms TlO2A6 (a) and TlO2B6 (b) with related combined polyhedra TlO6+6 (c, d), which share the O1–O1 edge in III.

Figure 5 Long description
The structural comparison between trigonal antiprisms TlO2A and TlO2B and their relationship with TlO polyhedra. In the first section, labeled as TlO2A, the antiprisms are shown vertically aligned along the c-axis, with O2A atoms forming the vertices. The second section displays TlO2B antiprisms, similarly aligned, with O2B atoms at the vertices. Both sections include axis indicators with red, green and blue arrows representing the a, b and c axes, respectively. The third section shows TlO polyhedra, where O1 atoms form edge-sharing networks, emphasizing their connectivity. The fourth section presents a similar structure with O2A and O2B atoms, highlighting the differences in connectivity.
The sum of bond valences (Brown and Altermatt, Reference Brown and Altermatt1985) of 3.198 vu and 3.216 vu for Fe surrounded by six O2A and six O2B, respectively, suggest a small oversaturation and slightly compressed FeO6 octahedra in III. Opposite, the valence bond sums for sulfur in SO2A3O1 and SO2B3O1 tetrahedra are 5.913 and 5.982 vu, respectively, which means insignificant undersaturation of SO4 tetrahedra. However, for Tl+ the valence bond sum is rather low, indicating possible vacancies at the Tl-site. The refinement showed that no such significant vacancies are present at this site [the refined occupancy was 1.018(6)]. Therefore, the refinement was completed with a fixed atom site-occupancy value of 1. The undersaturation of Tl1 is due to the unusually long Tl–O2A and Tl–O2B distances, which are, very probably, the result of disorder and twinning.
Considering the van der Waals’ radii of Tl as 2.47 Å (Alvarez, Reference Alvarez2013), a Tl–Tl distance less than 4.94 Å can be considered as strong interaction. The Tl–Tl distance in the Tl+-net parallel to the (0001) plane in I and III are 7.3330(2) Å and 4.8375(2) Å, respectively, indicating the absence of significant interaction between the neighbouring Tl atoms in I and show considerable Tl–Tl interactions in III. However, the Fe–Fe distance in a Fe-net is 3.6665(2) Å in I and 4.8375(2) Å in III, which is close to the sum of van der Waals radii (2 × r Fe = 2 × 2.44 = 4.88 Å; Alvarez, Reference Alvarez2013) indicating stronger Fe–Fe interactions, especially in the Kagomé lattice (Fig. 6).
Kagomé lattice of Fe (Fe–Fe = 3.67 Å) in I (a) and triangular net of Fe (Fe–Fe = 4.84 Å) in III (b). Black-and-white graphs of heteropolyhedral layers in I (c) and III (d). Black and white nodes symbolize FeO6-octahedra and SO4-tetraedra, respectively. The layer’s topologies are of the cc2-1:2-1 and cc2-3:2-1 types where cc means ‘cation-centred’, 2 indicates dimensionality (2D), M:T ratio in layers in this case is the Fe:S ratio (3:2 in I and 1:2 in III) and finally, the registration number of the unit (Krivovichev, Reference Krivovichev2009).

Figure 6 Long description
A Kagome lattice of iron with iron-iron distances marked as 3.67 angstroms. The lattice is composed of orange spheres representing iron atoms arranged in a repeating pattern. A green parallelogram outlines a unit cell within the lattice. The image B depicts a triangular net of iron with iron-iron distances of 4.84 angstroms. Similar to the first, orange spheres represent iron atoms and a green parallelogram highlights a unit cell. The image C illustrates a black-and-white graph of heteropolyhedral layers, where black nodes symbolize iron oxide octahedra and white nodes represent sulfate tetrahedra. The arrangement forms a distinct pattern with a green parallelogram indicating a unit cell. The image D presents another black-and-white graph of heteropolyhedral layers, with a similar node representation as in image C. The pattern is more complex and a green parallelogram again marks a unit cell.
The black-and-white graphs represented in Fig. 6. describe the topologies of heteropolyhedral layers observed in the structures of I and III. The topology of I is shown in Figs 6a, 6c. In this structure each Fe3+ cation is coordinated by two O atoms of the sulfate groups and four OH–-groups which are further linked by hydrogen bonds to the sulfate groups as well. Its black-and-white graph cc2-3:2-1 is the topology for many minerals of the alunite–jarosite supergroup. The black vertices form a Kagomé net consisting of regular triangles and hexagons. The white vertices are in the centres of the triangles and are 3-connected. The layer (2D unit) observed in the structure of III and its graph cc2-1:2-1 (Figs 6b, 6d) is the autunite-type [nominally Ca(UO2)2(PO4)2·10–12H2O] octahedral–tetrahedral layer observed in many minerals and synthetic compounds (Krivovichev, Reference Krivovichev2009).
This heteropolyhedral layer consists of a FeO6 octahedron that shares all six O atoms with six adjacent SO4 tetrahedra. Using a graphical representation, the topological structure of this layer (connectivity of its polyhedra) may be described by the black-and-white graph shown in Figs 6c and 6d. The central black node is linked to white nodes by six single lines which mean that the corresponding FeO6 octahedron shares all six of its corners with six adjacent SO4 tetrahedra, one corner for each SO4 tetrahedron.
Vibrational spectra of I–III
The assignment of the infrared bands for I was based on previously published results for the mineral dorallcharite (Makreski et al., Reference Makreski, Stefov, Pejov and Jovanovski2017) and synthetic Tl-bearing jarosites (Aguilar-Carrillo et al., Reference Aguilar-Carrillo, Herrera-García, Reyes-Domínguez and E.J2020) (see Fig. 7a FTIR a). Considering the ATR shift when comparing the ATR-IR spectra of I with the single-crystal IR spectra of dorallcharite (Makreski et al., Reference Makreski, Stefov, Pejov and Jovanovski2017), a very strong, sharp and slightly asymmetric band at 3401 cm–1 corresponds well to the OH-stretching vibrations typically occurring in jarosite-group compounds with a unique OH site in their crystal structures.
FTIR spectra of (a) I, (Tl0.91K0.09)(Fe2.90Al0.10)(SO4)2(OH)6 and (b) II, Tl+Al(SO4)2·12H2O.

Figure 7 Long description
A line graph with the y-axis labeled, Absorbance a u. The x-axis is labeled, Wavenumber cm superscript minus 1, ranging from 4000 at the high end to 500 at the low end. Labeled peaks are 3401, 1183, 1066, 962, 629, 493, 463 and 445. The 3401 peak is the tallest labeled feature in this plot. The image B showing a line graph with the y-axis labeled, Absorbance a u. The x-axis is labeled, Wavenumber cm superscript minus 1, ranging from 4000 at the high end to 500 at the low end. Labeled peaks are 3321, 2857, 2452, 1611, 1442, 1057, 908, 650 and 558. The 1057 peak is the tallest labeled feature in this plot.
In the spectral regions between 1200–600 cm–1 are the bands that arise from the SO4-stretching vibrations: υ3(SO4) (at 1180 cm–1 and 1066 cm–1), υ1(SO4) (at 962 cm–1) and the υ4(SO4) mode (at 627 cm–1) (Fig. 7a). If we consider the ATR-shift in the IR-spectra of I, they correspond well with the bands of the mineral dorallcharite from Allchar, FYR Macedonia (Makreski et al., Reference Makreski, Stefov, Pejov and Jovanovski2017) found at 1085, 1076, 1001 and 629 cm–1, respectively. In the spectral region below 600 cm–1 medium intensity bands arising from the Fe–O stretching modes are positioned at 493 and 463 cm–1. The non-orientated single crystal Raman spectrum of I and Raman spectrum of dorallcharite from the Allchar deposit (Đorđević et al., Reference Đorđević, Drahota, Kolitsch, Majzlan, Kiefer, Tepe, Hofmann, Serafimovski, Tasev, Boev and Boev2021a, Reference Đorđević, Drahota, Kolitsch, Majzlan, Perestá, Kiefer, Stöger-Pollach, Tepe, Hofmann, Mikuš, Tasev, Serafimovski, Boev and Boev2021b) are shown in Fig. 8a. Bands above 3000 cm–1 (middle strong band at 3249 and a shoulder around 3330 cm–1) are obviously due to υ(OH) modes of vibration originating from hydroxyl groups. The bands at 1162 cm–1 correspond well with the measured bands at 1165 cm–1 and 1164 cm–1 of two natural dorallcharites (Makreski et al., Reference Makreski, Stefov, Pejov and Jovanovski2017) and are assigned to υ(OH), The sharp and middle strong bands at 1085 and 1002 cm–1 are assigned to υ3(SO4) and υ1(SO4), respectively and correspond well with the bands at 1089 and 1003/1004 cm–1 measured for the natural dorallcharites. A sharp and strong peak at 620 cm–1 is assigned to υ4(SO4) and corresponds well with the peaks 621/622 cm–1 in natural dorallcharites. A medium to weak band at 563 cm–1 could be assigned to δ(OH), strong and sharp bands at 420 cm–1 to υ2(SO4) and 298 and 217 to υ(FeO) (Makreski et al., Reference Makreski, Stefov, Pejov and Jovanovski2017). The complete assignment of infrared and Raman vibrations spectra of synthetic dorallcharite has confirmed that the spectral view in the region of the υ3(SO4), υ1(SO4) and υ4(SO4) modes is exceptionally difficult for the discrimination of dorallcharite and jarosite. However, differentiation is possible through the registered differences in the infrared spectra of dorallcharite and jarosite, which can be observed in the region of the O–H stretching modes. The size of the large monovalent cation in the jarosite–alunite group increases the interlayer spacing and the c-unit cell parameter value. Thus, the presence of a large Tl⁺ cation in dorallcharite corresponds to the largest interlayer spacing observed in the alunite–jarosite family (Balić-Žunić et al., Reference Balić-Žunić, Moelo, Lončar and Micheelsen1994). This is because the separation of the octahedral layers is larger for dorallcharite than for jarosite. The weaker hydrogen bonding operating between the layers results in a higher position of the OH-stretching band. Makreski et al. (Reference Makreski, Stefov, Pejov and Jovanovski2017) argued that due to the longer Fe–O distances in dorallcharite (2.028 Å) (Balić-Žunić et al., Reference Balić-Žunić, Moelo, Lončar and Micheelsen1994) compared to the shorter average Fe–O distances in the jarosite structure (2.012 Å) (Kato and Miúra, Reference Kato and Miúra1977) this causes the shift of the Fe–O bands towards slightly higher wavenumbers. However, the average Fe–O distance in natural dorallcharite, as determined from the powder X-ray diffraction (PXRD) data in Balić-Žunić et al. (Reference Balić-Žunić, Moelo, Lončar and Micheelsen1994), does not correspond well to the average Fe–O distance of 2.010 Å calculated from the SCXRD data for synthetic dorallcharite, nor to the average Fe–O distance of 2.013 Å for the I. Therefore, we cannot use it as a rigorous criterion for differentiating between jarosite and dorallcharite.
Raman spectra of (a) I, (Tl0.91K0.09)(Fe2.90Al0.10)(SO4)2(OH)6 (lower, dotted line) and dorallcharite (full line) from the Crven Dol locality, Allchar deposit; (b) II, Tl+Al(SO4)2·12H2O (full line) and natural sample of alum-(K) (lower line) from the RRUFF database (Number: R060528-2); and (c) III, Tl+Fe3+(SO4)2.

Figure 8 Long description
A line graph with two overlaid Raman spectra and a small inset spectrum. The x-axis is labeled, Raman shift, with unit centimeter superscript minus 1, with tick labels at 200, 400, 600, 800, 1000, 1200, 1400, 1600 and 1800. The y-axis is labeled, Intensity, with unit a u. A legend distinguishes a dotted spectrum labeled, synthetic Tl jarosite and a solid spectrum labeled, dorallcharite from Allchar. The spectra show multiple sharp peaks, with labeled peak positions at 135, 206, 217, 298, 420, 450, 463, 493, 563, 620, 1002, 1085, 1162 and 1656 for Tl jarosite. The inset shows a single labeled peak at 3249. The image B showing a line graph of Raman spectrum. The x-axis is labeled, Raman shift, with unit centimeter superscript minus 1, with tick labels at 200, 400, 600, 800, 1000 and 1200. The y-axis represents intensity, with units not shown. Labeled peak positions are 312, 466, 611, 991 for II and 314, 460, 604, 991 and 1067 for alum. The image C showing a line graph of Raman spectrum. The x-axis is labeled, Raman shift, with unit centimeter superscript minus 1, with tick labels at 200, 400, 600, 800, 1000, 1200 and 1400. The y-axis represents intensity, with units not shown. Labeled peak positions are 216, 270, 421, 492, 618, 682, 840, 1009, 1016, 1089 and 1193. Assignments are all fully described in the text.
The assignment of the infrared bands for II was based on previously published results for the Tl-bearing alum-(K) (Biagioni et al., Reference Biagioni, Mauro, Pasero, Bonaccorsi, Lepore, Zaccarini and Skogby2020) and synthetic K-alum (Barashkov et al., Reference Barashkov, Komyak and Shashkov2004; Wijayati et al., Reference Wijayati, Romjanah Lestari, Ayuningtyas Wulandari, Widhi Mahatmanti, Kartika Rakainsa, Cahyono and Abdul Wahab2021). Considering the ATR shift when comparing the ATR-IR spectra of II with the IR spectra of Tl-bearing alum-(K) (Biagioni et al., Reference Biagioni, Mauro, Pasero, Bonaccorsi, Lepore, Zaccarini and Skogby2020) and synthetic K-alum (Wijayati et al., Reference Wijayati, Romjanah Lestari, Ayuningtyas Wulandari, Widhi Mahatmanti, Kartika Rakainsa, Cahyono and Abdul Wahab2021) both recorded on the KBr prepared pallet, a triplet (3321, 2857 and 2452 cm–1) of middle-strong and broad bands (Fig. 8b) in the region between 3600 and 2300 cm–1 corresponds well to the OH-stretching vibrations of the H2O molecules and the weak band at 1656 to the bending vibrations of the OH. The band at 1611 cm–1 corresponds well to the H2O bending mode. The bands at 1166 and 1057 correspond well to the stretching vibrations of the SO4-groups and the band at 908 cm–1 is due to the pendulum vibration of water. The bands between 750−400 cm−1 indicate the vibration of the Al–O bonds. Raman spectrum of II alongside with the Raman spectrum of a potassium alum from the RRUFF-database (R060528-2, www.rruff.net) is shown in Fig. 8b. The Raman spectrum of II shows a very strong and sharp band at 991 cm–1 and a weak Raman band at 1087 cm–1. They correspond well to υ1(SO4) and υ3(SO4), respectively. Middle strong to weak, and broad bands centred around 611, 466 and 312 cm–1 could be assigned to υ4(SO4), υ2(SO4) and υg(H2O) and correspond well with the bands present in the Tl-bearing alum (612, 451 and 314 cm–1) found in Apuan Alps, Italy (Biagioni et al., Reference Biagioni, Mauro, Pasero, Bonaccorsi, Lepore, Zaccarini and Skogby2020).
The Raman spectrum of III is shown on Fig. 8c. The peaks at 1089 and 1069 correspond to υ3(SO4), the very strong and sharp band 1016 cm–1 corresponds to υ1(SO4), the middle strong and sharp bands at 618 and 662 cm–1 correspond to υ4(SO4) and the very strong and sharp band at 421 cm–1 corresponds to υ2(SO4). The band assignment in the spectral region from 100–1300 cm–1 is very similar to that of I.
Transmission electron microscopy of I
To confirm the structure of I and the oxidation sate of iron FIB lamellae were analysed in TEM by means of energy electron loss spectroscopy (EELS), EDX and selected area electron diffraction (SAED). They are shown in Fig. 9 and Fig. S4. TEM-micrographs (Fig. 9a) showed that beam damage occurs immediately, thus causing dark areas containing more Tl. The most probable reason is that OH-groups leave the specimen. A slight re-ordering of the residual atoms in the bright areas was observed. For this purpose, SAED-patterns (Fig. 9b) gave the a-parameter of the unit-cell a of 7.3 Å (2×0.365 nm) which corresponds perfectly with a parameter obtain by SCXRD (a = 7.33 Å). The chemical composition obtained using TEM-EDX gave following values (at.%): 75 of O, 12.9 of Fe, 5.7 of S, 3.6 of Tl. 0.5 of K and 0.2 of Al (Table S2).
Transmission electron microscopy (TEM) micrograph of I, showing: (a) dark areas with more Tl due to the beam damage; (b) SEAD pattern; and (c) Fe-ELNES for the determination of the valence state of Fe.

Figure 9 Long description
The transmission electron microscopy micrograph shows a mottled texture indicating beam damage with dark areas containing more thallium. The selected area electron diffraction pattern displays a central bright spot with surrounding spots, suggesting a crystalline structure. The scale is labeled as 1 over nanometer. The Fe-ELNES spectrum is a line plot with energy loss on the x-axis from 705 to 730 electron volt and intensity on the y-axis from 0 to 16000 counts. It features two main peaks: the Fe L3 edge near 710 electron volt and the Fe L2 edge near 725 electron volt, indicating the valence state of iron. The plot includes overlaid curves representing the measured spectrum, fitted components and background.
Transmission electron microscopy-electron energy loss spectroscopy (TEM-EELS) was applied to ensure chemical homogeneity and complement the structural characterisation at the nanoscale and to quantify the oxidation states of Fe in I as a function of the integral ratio of Fe L3/L2 ionization edge (van Aken and Liebscher Reference van Aken and Liebscher2002). The energy loss near edge structure (ELNES) of the Fe-L3,2 ionization edge in EELS reveals the oxidation state (Fig. 9c). For this purpose, the area of a 2 eV energy window below the L3 and L2 white lines is determined after the subtraction of the continuum states fitted by a double arctan-function. Details are described by van Aken and Liebscher (Reference van Aken and Liebscher2002). In the present sample the L3/L2 ratio is 5.48, thus indicating that Fe is in its Fe(III)-state. In general, a similar check of the oxidation state could be done at the Tl-L edge (see for example Wick et al., Reference Wick, Baeyens, Marques Fernandes and Voegelin2018, Reference Wick, Peña and Voegelin2019, Reference Wick, Baeyens, Marques Fernandes, Göttlicher, Fischer, Pfenninger, Plötze and Voegelin2020). However, since the Tl-L edge is at energy losses of more than 12.68 keV, it is only accessible with X-ray absorption spectroscopy, but not with EELS. The only Tl-edge being accessible with EELS is the Tl-M edge at 2389 eV energy loss, which is not sensitive to the valence state. Thus, the valence state of Tl was not determined.
Structural relation of I–III to other compounds
The crystal structure of I, which is isostructural to the mineral dorallcharite Tl0.8K0.2Fe3+3(SO4)2(OH)6 (Balić-Žunić et al., Reference Balić-Žunić, Moelo, Lončar and Micheelsen1994), is comparable to the structures of other members of the alunite–jarosite supergroup. The nominal formulae of dorallcharite is TlFe3+3(SO4)2(OH)6 and end-members alunite and jarosite are KAl3(SO4)2(OH)6 and KFe33+(SO4)2(OH)6, respectively, but extensive element substitution takes place in their crystal structures. This causes variations in unit cell parameters and symmetry (Stoffregen et al., Reference Stoffregen, Alpers and Jambor2000; Dutrizac and Kaiman, Reference Dutrizac and Kaiman1975; Perret and Couchot, Reference Perret and Couchot1972a, Reference Perret and Couchot1972b). Most of them crystallise in the trigonal space group R  $\overline 3 $m (No. 166) and are characterized by the heteropolyhedral layers (Table 5). The basic structural part consists of variably distorted M 3+O2(OH)4 octahedra connected by SO4 tetrahedra and 12-coordinated large predominantly monovalent cations A +, situated in the large interlayer cavities between six O2 and six O3 oxygen atoms. The fundamental building unit in all these structures are the Kagomé layers of octahedral cations. They alternate along the c-axis with heteropolyhedral A+-sulfate layers. The structures are similar in size to the unit cell (Table 5). The dimension of the c-axis for jarosite is slightly lower than that for alunite (17.17 vs 17.32 Å), while the a-axis for jarosite is significantly larger (7.29 vs 6.97 Å) than that for alunite. The c-axis parameter of the unit cell varies mainly according to the ionic radii of cations occupying the A site i.e. the entering of a large cation Tl+ at the A site leads to a longer c-parameter and a larger unit cell.
Crystal data of some minerals in the alunite–jarosite supergroup

Table 5 Long description
Mineral entries list chemical formula, unit cell parameters a and c in angstroms, cell volume V in angstroms cubed, and a literature reference. Synthetic material has a 7.3330(4), c 17.7118(6), and V 824.81(9). Dorallcharite has a 7.3301(3), c 17.6631(7), and V 821.90 with an asterisk. Thallium jarosite appears twice, once with a 7.326 plus or minus 0.002, c 17.416 plus or minus 0.005, and V 809.49 with an asterisk, and once with a 7.3226(7), c 17.610(2), and V 817.74(15). Jarosite appears three times, with a values 7.2913(5), 7.304(2), and 7.310(1), c values 17.1744(17), 16.567(5), and 17.042(3), and V values 790.72(11), 765.41 with an asterisk, and 788.8(2). Hydroniumjarosite appears three times, with a values 7.3408(2), 7.3559(8), and 7.3552(2), c values 17.0451(6), 17.019(3), and 16.9945(4), and V values 795.46(4), 797.5(2), and 796.21(4). Ammoniojarosite lists a 7.3177(3), c 17.534(1), and V 813.15(8); argentojarosite appears twice with a 7.35 and 7.3398(7), c 16.57 and 16.538(3), and V 774.7 and 771.4(2). Beaverite copper and beaverite zinc list a 7.2928(13) and 7.3028(2), c 17.242(6) and 17.0517(4), and V 794.1(3) and 787.56(4), and beaverite lists a 7.203, c 16.94, and V 761.15. Natrojarosite lists a 7.31525(6), c 16.5868(2), and V 768.69(1), while plumbojarosite appears twice with c 33.675(2) and 33.7274(8) and V 1556.46 and 1564.44, both marked with an asterisk. Alunite lists a 6.9749(6), c 17.315(4), and V 729.5(3).
* Cell volume V = a 2c(sin 60°) is calculated from published cell parameter data.
Substitutions in the M site mainly affect the a-parameter, and the a-axis increases as the Fe3+-for-Al3+ substitution increases. In the dorallcharite, the length of the c-parameter increases because of the larger ionic radius of Tl+ vs K+ in alunites and jarosites. In the two samples of dorallcharite both cell parameters are large: the mineral has a = 7.3301(3) and c = 17.6631(7) Å, whereas its synthesized analogue has a = 7.3330(4) and c = 17.7118(6) Å.
Compound II was found to have the alum-type structure. Crystal data for selected compounds with an alum-type structure are given in Table 6. Their structures belong to the alum series A +Al3+(S6+O4)2·12H2O (A = Na, (NH4)+, (H3O)+, K+, Rb+, Tl+, Cs+) which crystallise in the cubic space group Pa  $\overline 3 $ (No. 205) with Z = 4. The Al3+ cations are in special positions and if these are allocated to (0,0,0), the A + cations are at (½,½,½). The tetrahedral sulfate ions lie on threefold axes of symmetry. The cell parameter lengths are in a relatively short range from 12.1350(5) to 12.352
0.003 Å.
Crystal data of cubic compounds with the alum-type structure, general formula A +Al3+(S6+O4)2 where (A = Na+, (NH4)+, (H3O)+, K+, Rb+, Tl+, Cs+) and space group Pa  $\overline 3 $ (No. 205)

Table 6 Long description
Rows list cubic alum compounds grouped as beta alums, alpha alums, and gamma alum, with columns for formula, a cation to oxygen distance, lattice parameter a in angstroms, unit cell volume V in cubic angstroms, and references. Beta alums include CsAl(SO4)2 12H2O with VI Cs plus to Ow1 distance 3.367(5) and to Ow2 distance 3.454(5), a 12.352 plus or minus 0.003, and V 1884.58; and TlAl(SO4)2 2H2O (II) with VI Tl plus to O2 distance 3.277(2) and to O3 distance 3.3925(18), a 12.2727(4), and V 1848.5(6). Alpha alums include TlAl(SO4)2 12H2O with VI Tl plus to O distance 3.065(2) marked with one asterisk, a 12.2305(5), V 1829.50(13), and a second entry with VI Tl plus to O distance 3.036(2) marked with two asterisks, a 12.2070(5), V 1818.98(13). Alpha alums also include KAl(SO4)2 12H2O with VI K plus to O distance 2.954(1) marked with one asterisk, a 12.1640(5), V 1799.82(13), and a second entry with VI K plus to O distance 2.915(9) marked with two asterisks, a 12.1350(5), V 1786.98(13); plus another KAl(SO4)2 12H2O entry with VI K plus to O distance 2.983(9), a 12.157 plus or minus 0.003, V 1796.715. Additional alpha alum entries are RbAl(SO4)2 12H2O with VI Rb plus to O distance 3.067(12), a 12.243 plus or minus 0.003, V 1835.116; (NH4)Al(SO4)2 12H2O with ammonium to O distance 3.051(10), a 12.240 plus or minus 0.003, V 1833.767; and (OH3)Al(SO4)2 12H2O with OH3 plus to O distance 3.0341, a 12.2403(14), V 1833.9(6). Gamma alum lists NaAl(SO4)2 12H2O with VI Na plus to O distance 2.453(2), a 12.213 plus or minus 0.003, and V 1821.79.
†Revised effective ionic radii for monovalent cations with coordination VI and XII (Shannon, Reference Shannon1976): VINa+ = 1.02; VIK+ = 1.38, XIIK+ = 1.64; VITl + = 1.50, XIITl+ = 1.70; VIRb + = 1.52, XIIRb+ = 1.72; VICs + = 1.67 XIICs+ = 1.88 Å.
* 296 K (room temperature); **173 K
According to Cromer et al. (Reference Cromer, Kay and Larson1966) the characteristic that distinguishes the γ-alums from α- and β-alums is the orientation of the sulfate group. In the γ-alums this group is orientated opposite to its orientation in the α- and β-alums (Fig. S6). The γ-alum forms if the monovalent cation is relatively small. The only known representative of this class is NaAl(SO4)2·12H2O (Cromer et al., Reference Cromer, Kay and Larson1966; Reference Cromer, Kay and Larson1967). The β-alum forms if the monovalent cation is large and the α-alum, which is the most common type, occurs if the cation is of intermediate size (Cromer et al., Reference Cromer, Kay and Larson1966). The large cation in β-alums can accommodate 12 oxygen neighbours. To attain this large coordination number the water octahedron is compressed along the threefold axis. The monovalent cations in α-alums and γ-alums have six water molecules. In γ-alum these water molecules form a nearly regular octahedron. In α-alums the octahedron is distorted by compression along the threefold axis. In the structure of the sample studied TlAl(SO4)2·12H2O the octahedron around aluminium is orientated almost exactly along the cell axes and is only very slightly distorted. The sulfate group is an almost perfect tetrahedron. The Tl–O3 distances are a little longer than the Tl–O2 distances in a flat hexagon, 3.3925(18) Å vs 3.277(2) Å. The analogous distances in CsAl(SO4)2·12H2O are 3.454(5) Å vs 3.367(5) Å. It is interesting that thallium can crystallise in two polymorphic modifications, in α- and β-alums (Fig. S6). The structure of the α polymorph is isomorphous to K-alum (Nyburg et al., Reference Nyburg, Steed, Aleksovska and Petruševski2000), while the β polymorphic form is isomorphous to Cs-alum (Cromer et al., Reference Cromer, Kay and Larson1966). According to our knowledge it is the first time that the β polymorph of Tl-alum is identified and characterized.
The crystal structure of synthesized anhydrous thallium alum III is comparable to structures of BaNi2(VO4)2 (Rogado et al., Reference Rogado, Huang, Lynn, Ramirez, Huse and Cava2002), BaNi2(PO4)2 (El Bali et al., Reference El Bali, Bolte, Boukhari, Aride and Taibe1999; Čabrić et al., Reference Čabrić, Žižić and Napijalo1982) BaCo2(PO4)2 (David et al., Reference David, Kabbour, Pautrat and Mentré2013) and BaFe2(PO4)2 (Kabbour et al., Reference Kabbour, David, Pautrat, Koo, Whangbo, André and Mentré2012). They are all trigonal, crystallising in the space group R  $\overline 3 $ (No. 148). The crystal structures of BaNi2(AsO4)2 (Eymond et al., Reference Eymond, Durif and Martin1969a), BaCo2(AsO4)2 and BaMg2(AsO4)2 (Đorđević, Reference Đorđević2008; Eymond et al., Reference Eymond, Martin and Durif1969b) are also solved in space group R
 $\overline 3 $ (No. 148), but the crystal structure of molybdate FeTl(MoO4)2 crystallises in the orthorhombic Pnma space group (Pleskov et al., Reference Pleskov, Morozov, Lazoryak, Zhizhin, Burdakova, Khalbaeva, Tsyrenova and Khaikina2005). A mineral steklite, KAl(SO4)2, a natural member of A +M 3+(T 6+O4)2 compounds, was found at the Tolbachik Volcano, Kamchatka, Russia (Murashko et al., Reference Murashko, Pekov, Krivovichev, Chernyatyeava, Yapaskurt, Zadov and Zelensky2013). It also crystallises in the trigonal but P321 space group, a = 4.7281(3), c = 7.9936(5) Å (Table 7).
Crystal data of trigonal compounds with the A +M 3+(T 6+O4)2-type, A 2+M 2+2(T 5+O4)2-type and A +M 5+(T 5+O4)2-type structure (A = H3O+, K+, Cs+, Tl+, Ba2+, Sr2+; M = Co2+, Mn2+, Ni2+, Fe2+, Fe3+, Al3+, Yb3+; T = P5+, V5+, As5+, S6+, Mo6+)

Table 7 Long description
Columns list formula, cell parameters a, b, and c in angstroms with angles alpha, beta, and gamma in degrees, plus cell volume in cubic angstroms, space group, and references. Under A plus M three plus with T six plus O four twice, KAl(SO4)2 appears twice with a and b near 4.72 angstroms, c near 7.99 angstroms, volumes 154.76 and 154.7 with an asterisk, and space groups P 321 and R minus 3; other entries include CsFe(MoO4)2 with volume 214.02 and P minus 3, and TlFe(SO4)2 (III) with c 24.7905 and volume 502.41 in R minus 3. In the same section, TlFe(MoO4)2 lists a 14.7601, b 5.6812, c 8.7534, volume 734.0 with an asterisk, and space group P nma, while KYb(MoO4)2 lists a 5.0395, b 18.2821, c 7.8634, volume 724.48, and space group P bcn. Under A two plus M two plus two with T five plus O four twice, several Ba based compounds in R minus 3 have a and b around 4.81 to 5.03 angstroms and c around 22.3450 to 23.61 angstroms, with volumes from 467.12 to 510.02, including mixed BaNi2(PO4)1.36(VO4)0.64 with volume 474.58. Also in this section, triclinic P minus 1 entries provide angles on separate lines: BaFe2(PO4)2 with volume 160.22 and angles 106.501, 107.497, and 60.556; BaMn2(AsO4)2 with volume 364.26 and angles 109.75, 100.42, and 98.40; and SrMn2(PO4)2 with volume 680.1 and angles 124.27, 90.23, and 90.26. Additional entries include SrNi2(AsO4)1.38(VO4)0.62 with volume 1215.96 and space group I 41cd, alpha BaCo2(PO4)2 with volume 372.23 and space group P 21/a with beta angle 92.737 on a separate line, and beta BaCo2(PO4)2 with volume 195.1 with an asterisk and space group P minus 3. Under A plus M five plus with T five plus O four twice, KSb(PO4)2 lists a and b 4.7623, c 25.409, volume 499.06, and space group R minus 3.
* Cell volume calculated from published cell parameter data.
In addition, there are strong similarities with the compounds A +M 3+(T 6+O4)2, A 2+M 2+2(T 5+O4)2 and A +M 5+(T 5+O4)2 where A = H3O+, K+, Cs+, Tl+, Ba2+, Sr2+; M = Co2+, Mn2+, Ni2+, Fe2+, Fe3+, Al3+, Yb3+; T = P5+, V5+, As5+, S6+, Mo6+ (Table 7). Usually, they have a layered structure made up of MO6 octahedra and TO4 tetrahedra with an interlayer separation of ≈8 Å (= c/3 or c). The large cations A + are situated between parallel layers keeping the interlayer connectivity through coordinated oxygen anions.
Kagomé lattice in Tl-bearing sulfate minerals
The crystal structure of compound I, a synthetic analogue of dorallcharite, features layers of Fe3+ octahedra arranged in a Kagomé lattice, characteristic of the alunite–jarosite supergroup. This two-dimensional, corner-sharing triangular network is known to impart unique physical properties, including magnetic frustration and unusual electronic behaviour, in other mineral systems (Sandineni et al., Reference Sandineni, Yaghoobnejad Asl and Choudhury2016; Wills and Harrison, Reference Wills and Harrison1996).
Kagomé lattices are not limited to Fe3+; trivalent cations such as V3+ can also form similar arrangements, as observed in NaV3(SO4)2(OD)6 (Grohol et al., Reference Grohol, Huang, Toby, Lynn, Lee and Nocera2003). In some vanadates, higher oxidation states and tetrahedral coordination of metal cations lead to the lattice being formed by divalent ions instead, for example in Ba[Co3(VO4)2(OH)2], where Co2+ ions generate the Kagomé network (Đorđević and Karanović, Reference Đorđević and Karanović2013). This diversity demonstrates the structural flexibility of Kagomé-type layers across different chemistries.
In dorallcharite, the Kagomé layers of Fe3+ octahedra alternate with A +–sulfate layers, with Tl⁺ occupying the interlayer positions in a 12-coordinate environment. The Tl lone electron pair behaves as largely inert, preserving the lattice symmetry while allowing minor substitutions by K⁺ at the A site and Al3+ at the M site. These structural features suggest that Kagomé lattices in Tl-bearing sulfates are robust frameworks that can accommodate cationic variability without disrupting the overall topology.
The presence of Kagomé layers may also influence Tl mobility and environmental behaviour. Layered structures can affect ion-exchange capacity and solubility, making them important for the retention of Tl released during pyrite oxidation in mining-impacted systems. Understanding the Kagomé lattice in these minerals therefore provides not only crystallographic insight but also context for their geochemical and environmental relevance.
Conclusions
The low crystallinity of naturally occurring Tl-bearing sulfate minerals has generally limited detailed structural understanding. To address this, single crystals of compounds I–III were synthesized under controlled low-pH, hydrothermal conditions, enabling precise structural characterization. Compound I, a synthetic analogue of dorallcharite, exhibits a Kagomé lattice of Fe3+ octahedra and 12-coordinated Tl+ with a largely inert lone pair, while minor K+ and Al3+ substitutions were observed. Compound II represents the first identification and characterization of the β-polymorph of Tl-alum, and compound III features disordered SO4–FeO6 layers with interlayer Tl⁺, highlighting the structural diversity of Tl-bearing sulfates.
Sulfate minerals play a crucial role in sequestering Tl released during pyrite oxidation in mining-impacted environments. Our results demonstrate that these secondary phases can accommodate significant Tl concentrations, affecting its environmental mobility and fate. Furthermore, our findings suggest that TlFe(SO4)2 may occur naturally, which has important implications for understanding the role of sulfates in Tl cycling. Overall, elucidating the structures of these synthetic analogues provides key insights into Tl retention, informing strategies for pollution assessment, monitoring, and remediation.
Supplementary material
The supplementary material for this article can
be found at https://doi.org/10.1180/mgm.2026.10225.
Acknowledgements
We are very grateful to Wencke Wegner for the assistance during some of the SEM-EDX measurements and Eugen Libowitzky for assistance during FTIR analysis. Tamara Đorđević acknowledges the financial support of the Austrian Science Fund (FWF) [Grant: P 36828-N]. Two anonymous reviewers are thanked for their careful corrections and comments that helped to improve the manuscript.
Competing interests
The authors declare none.
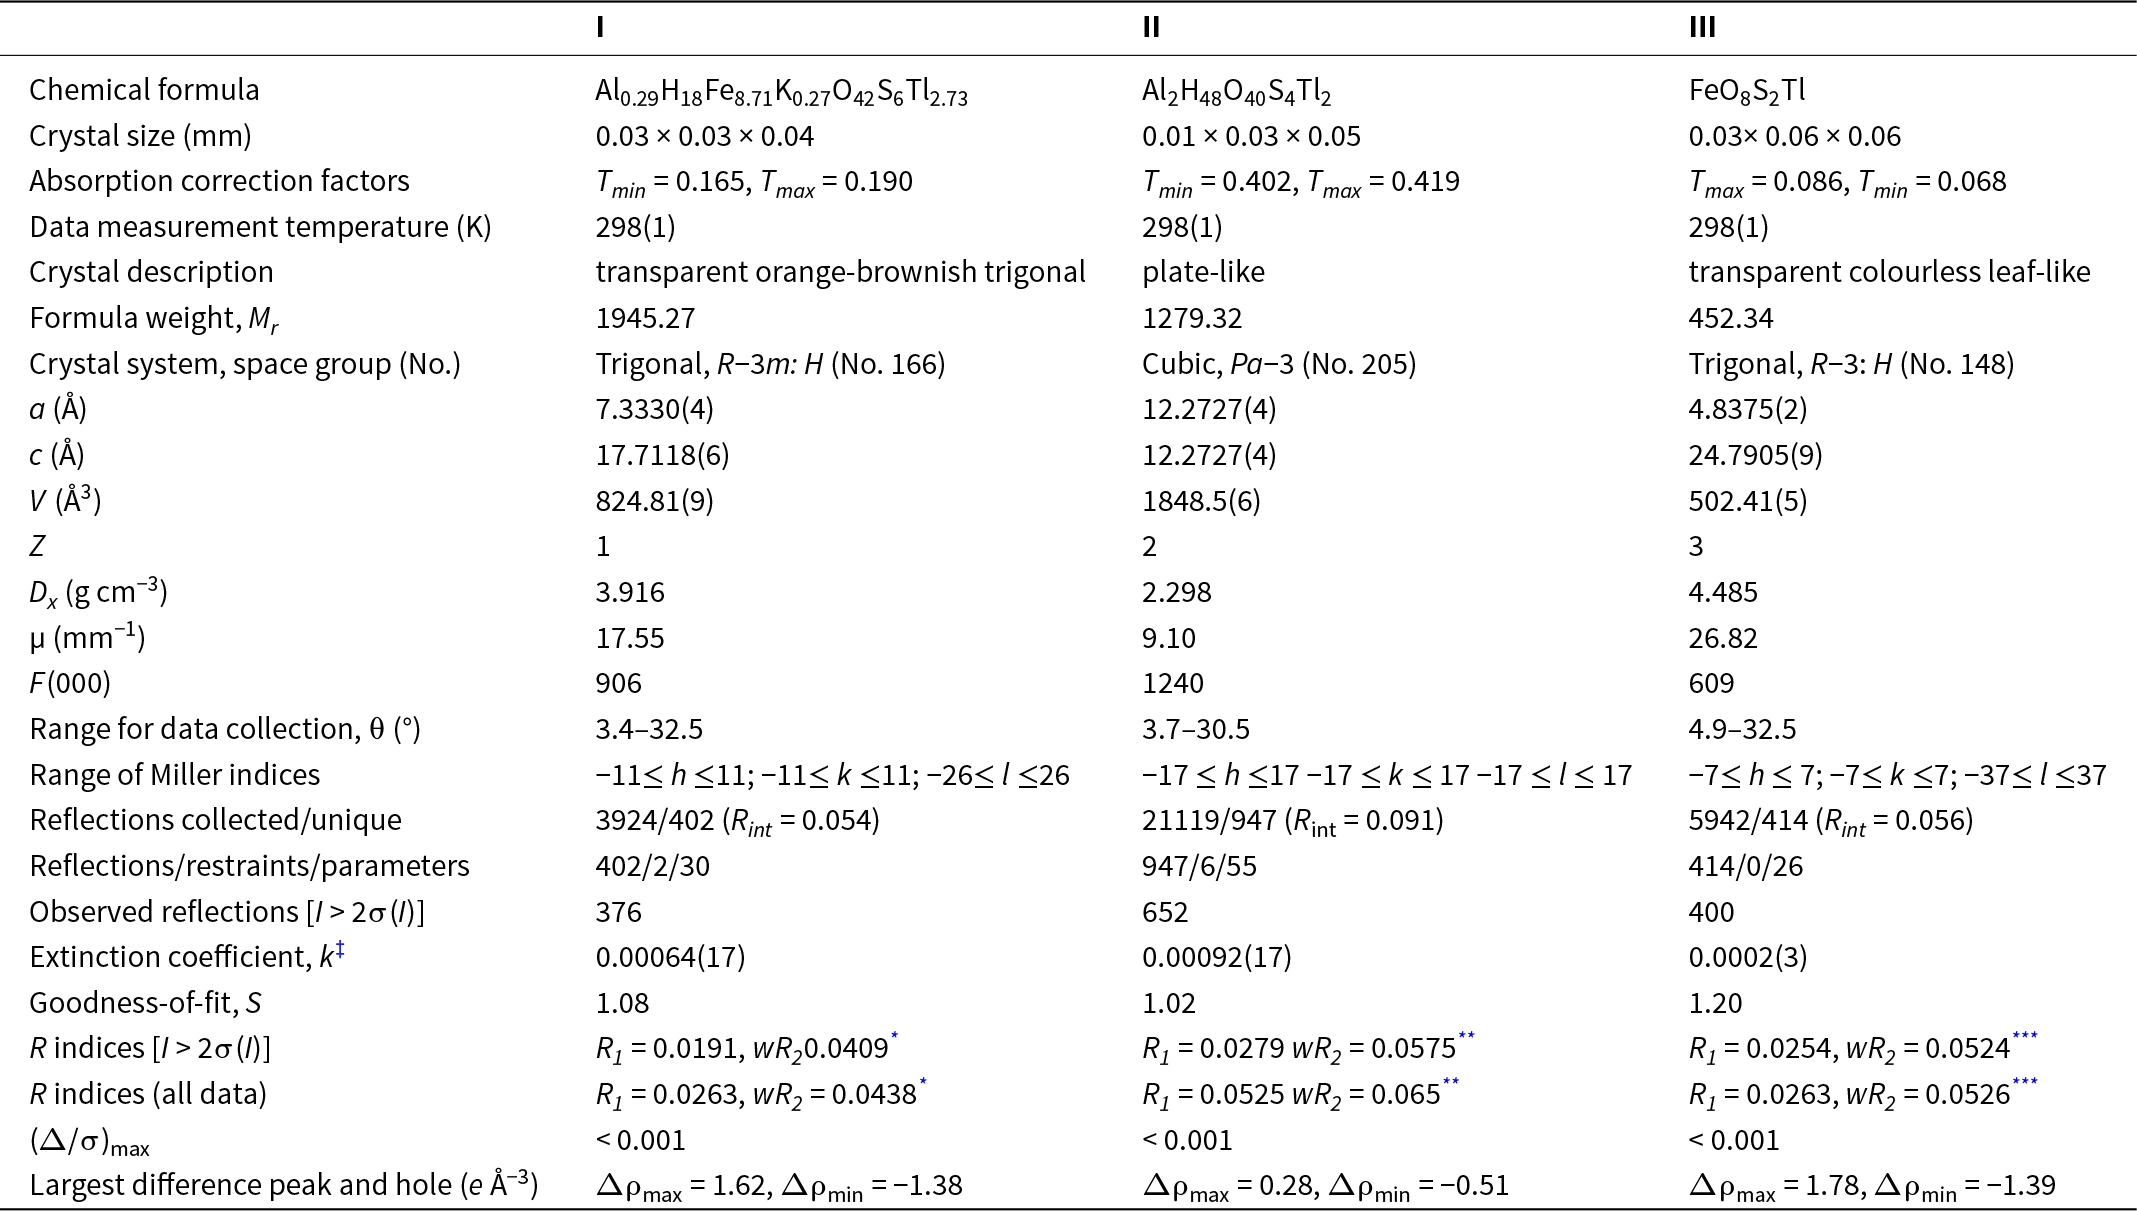
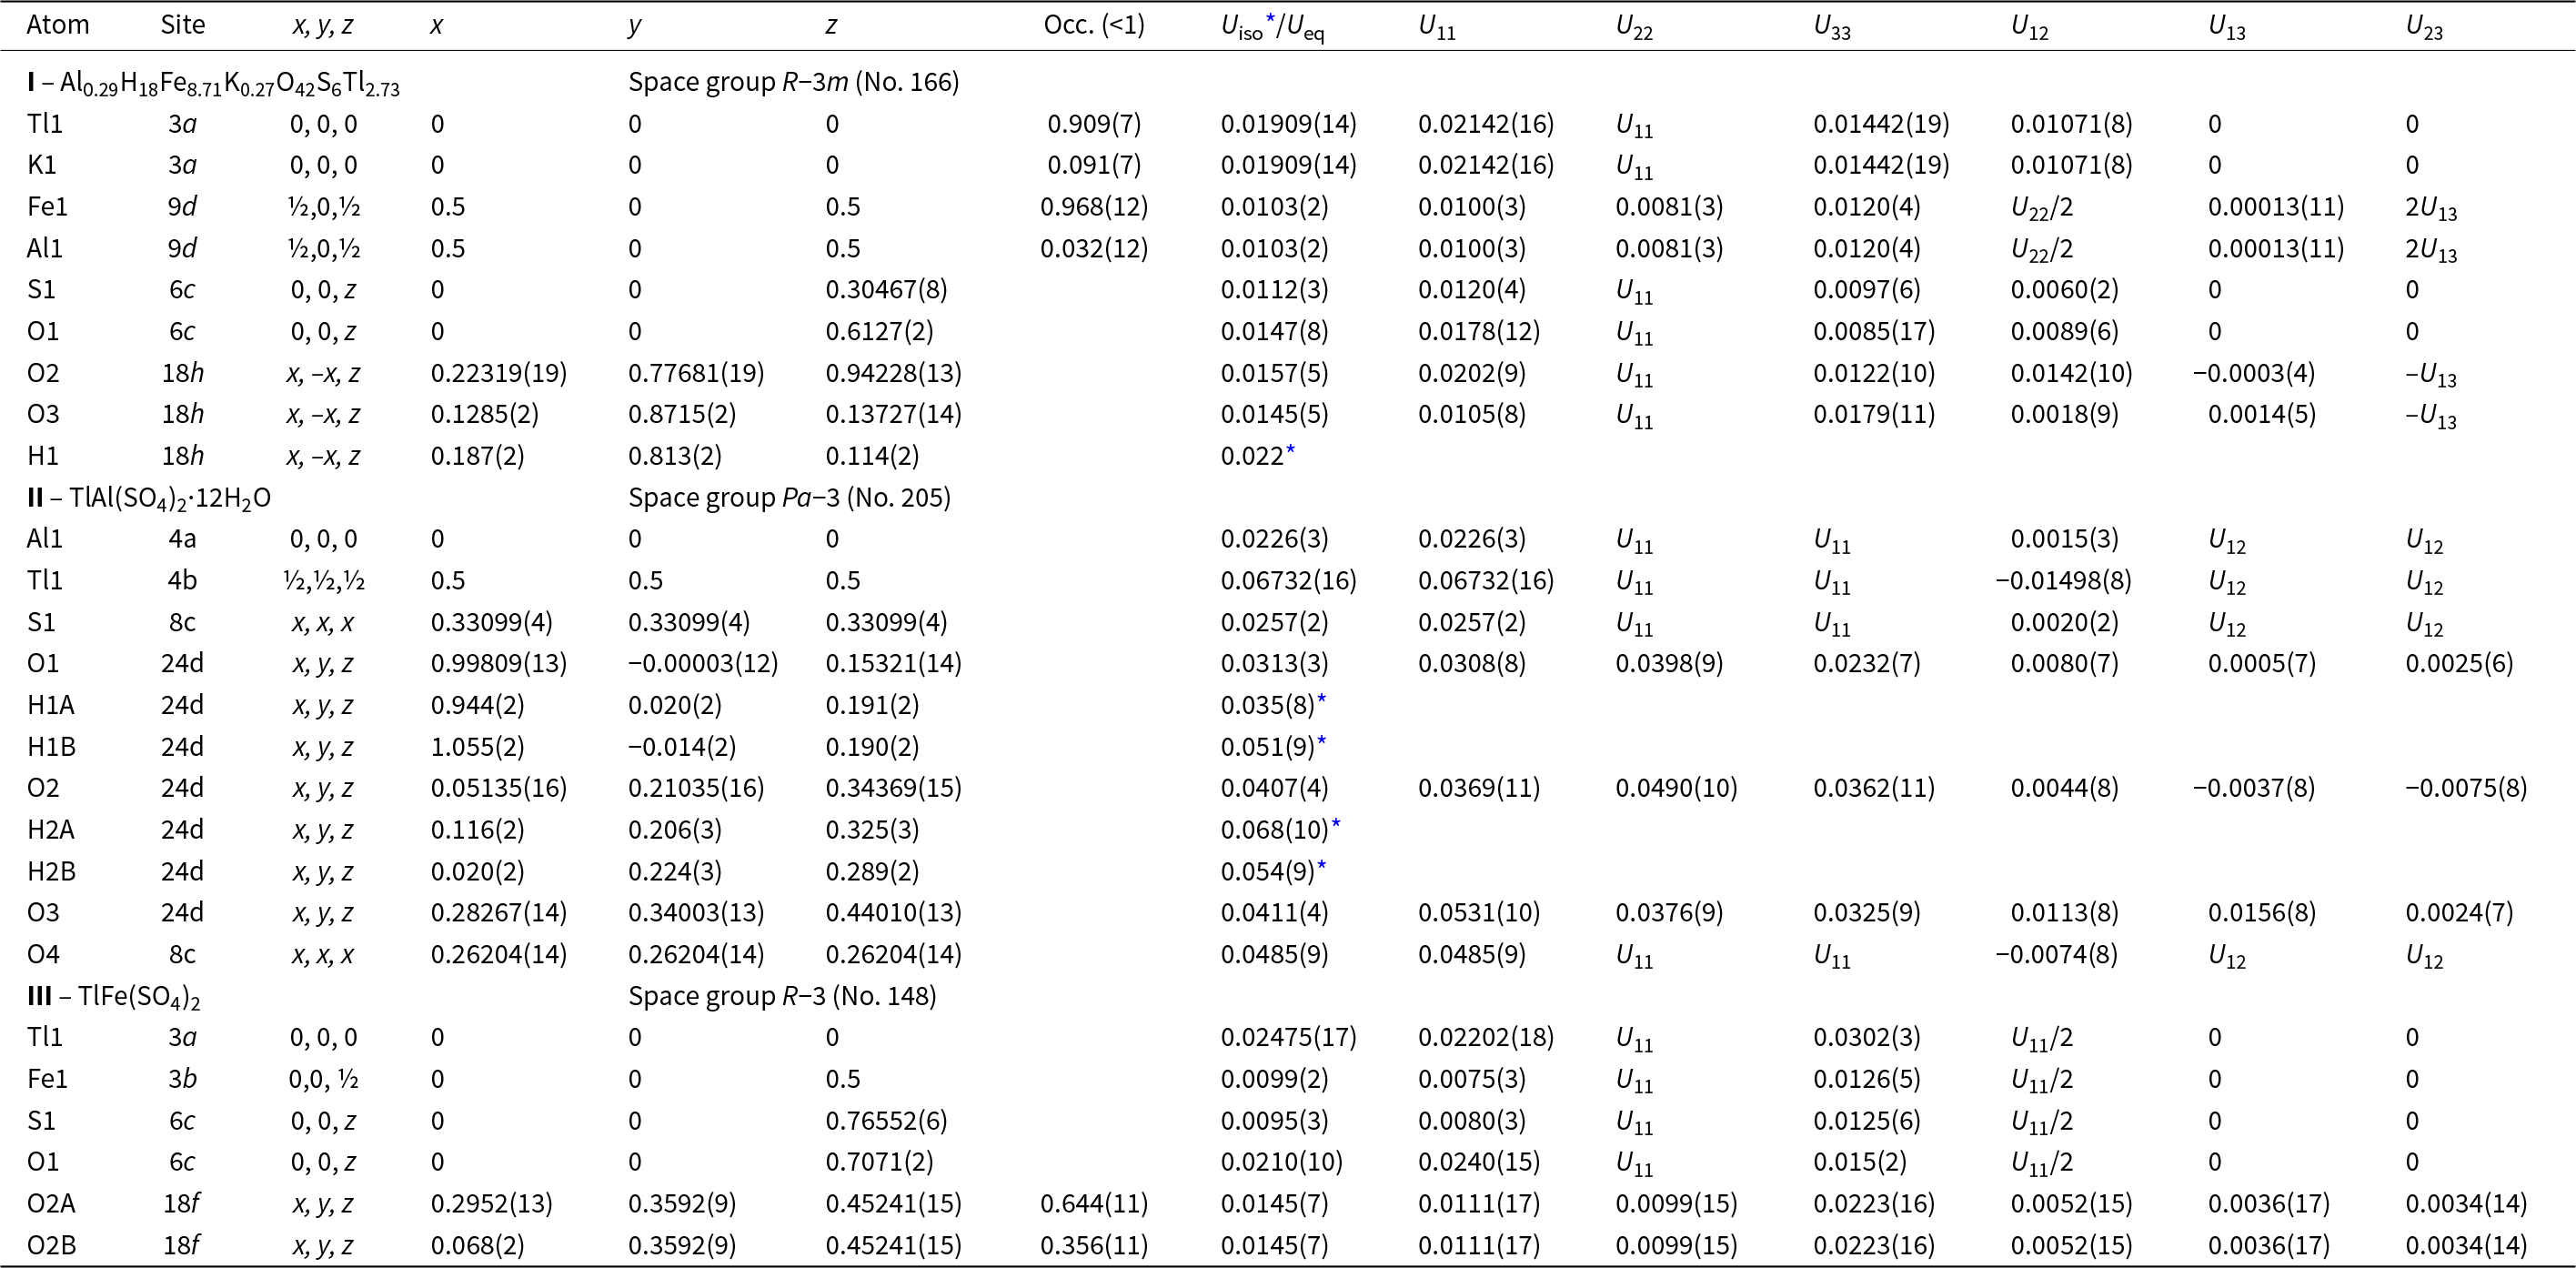
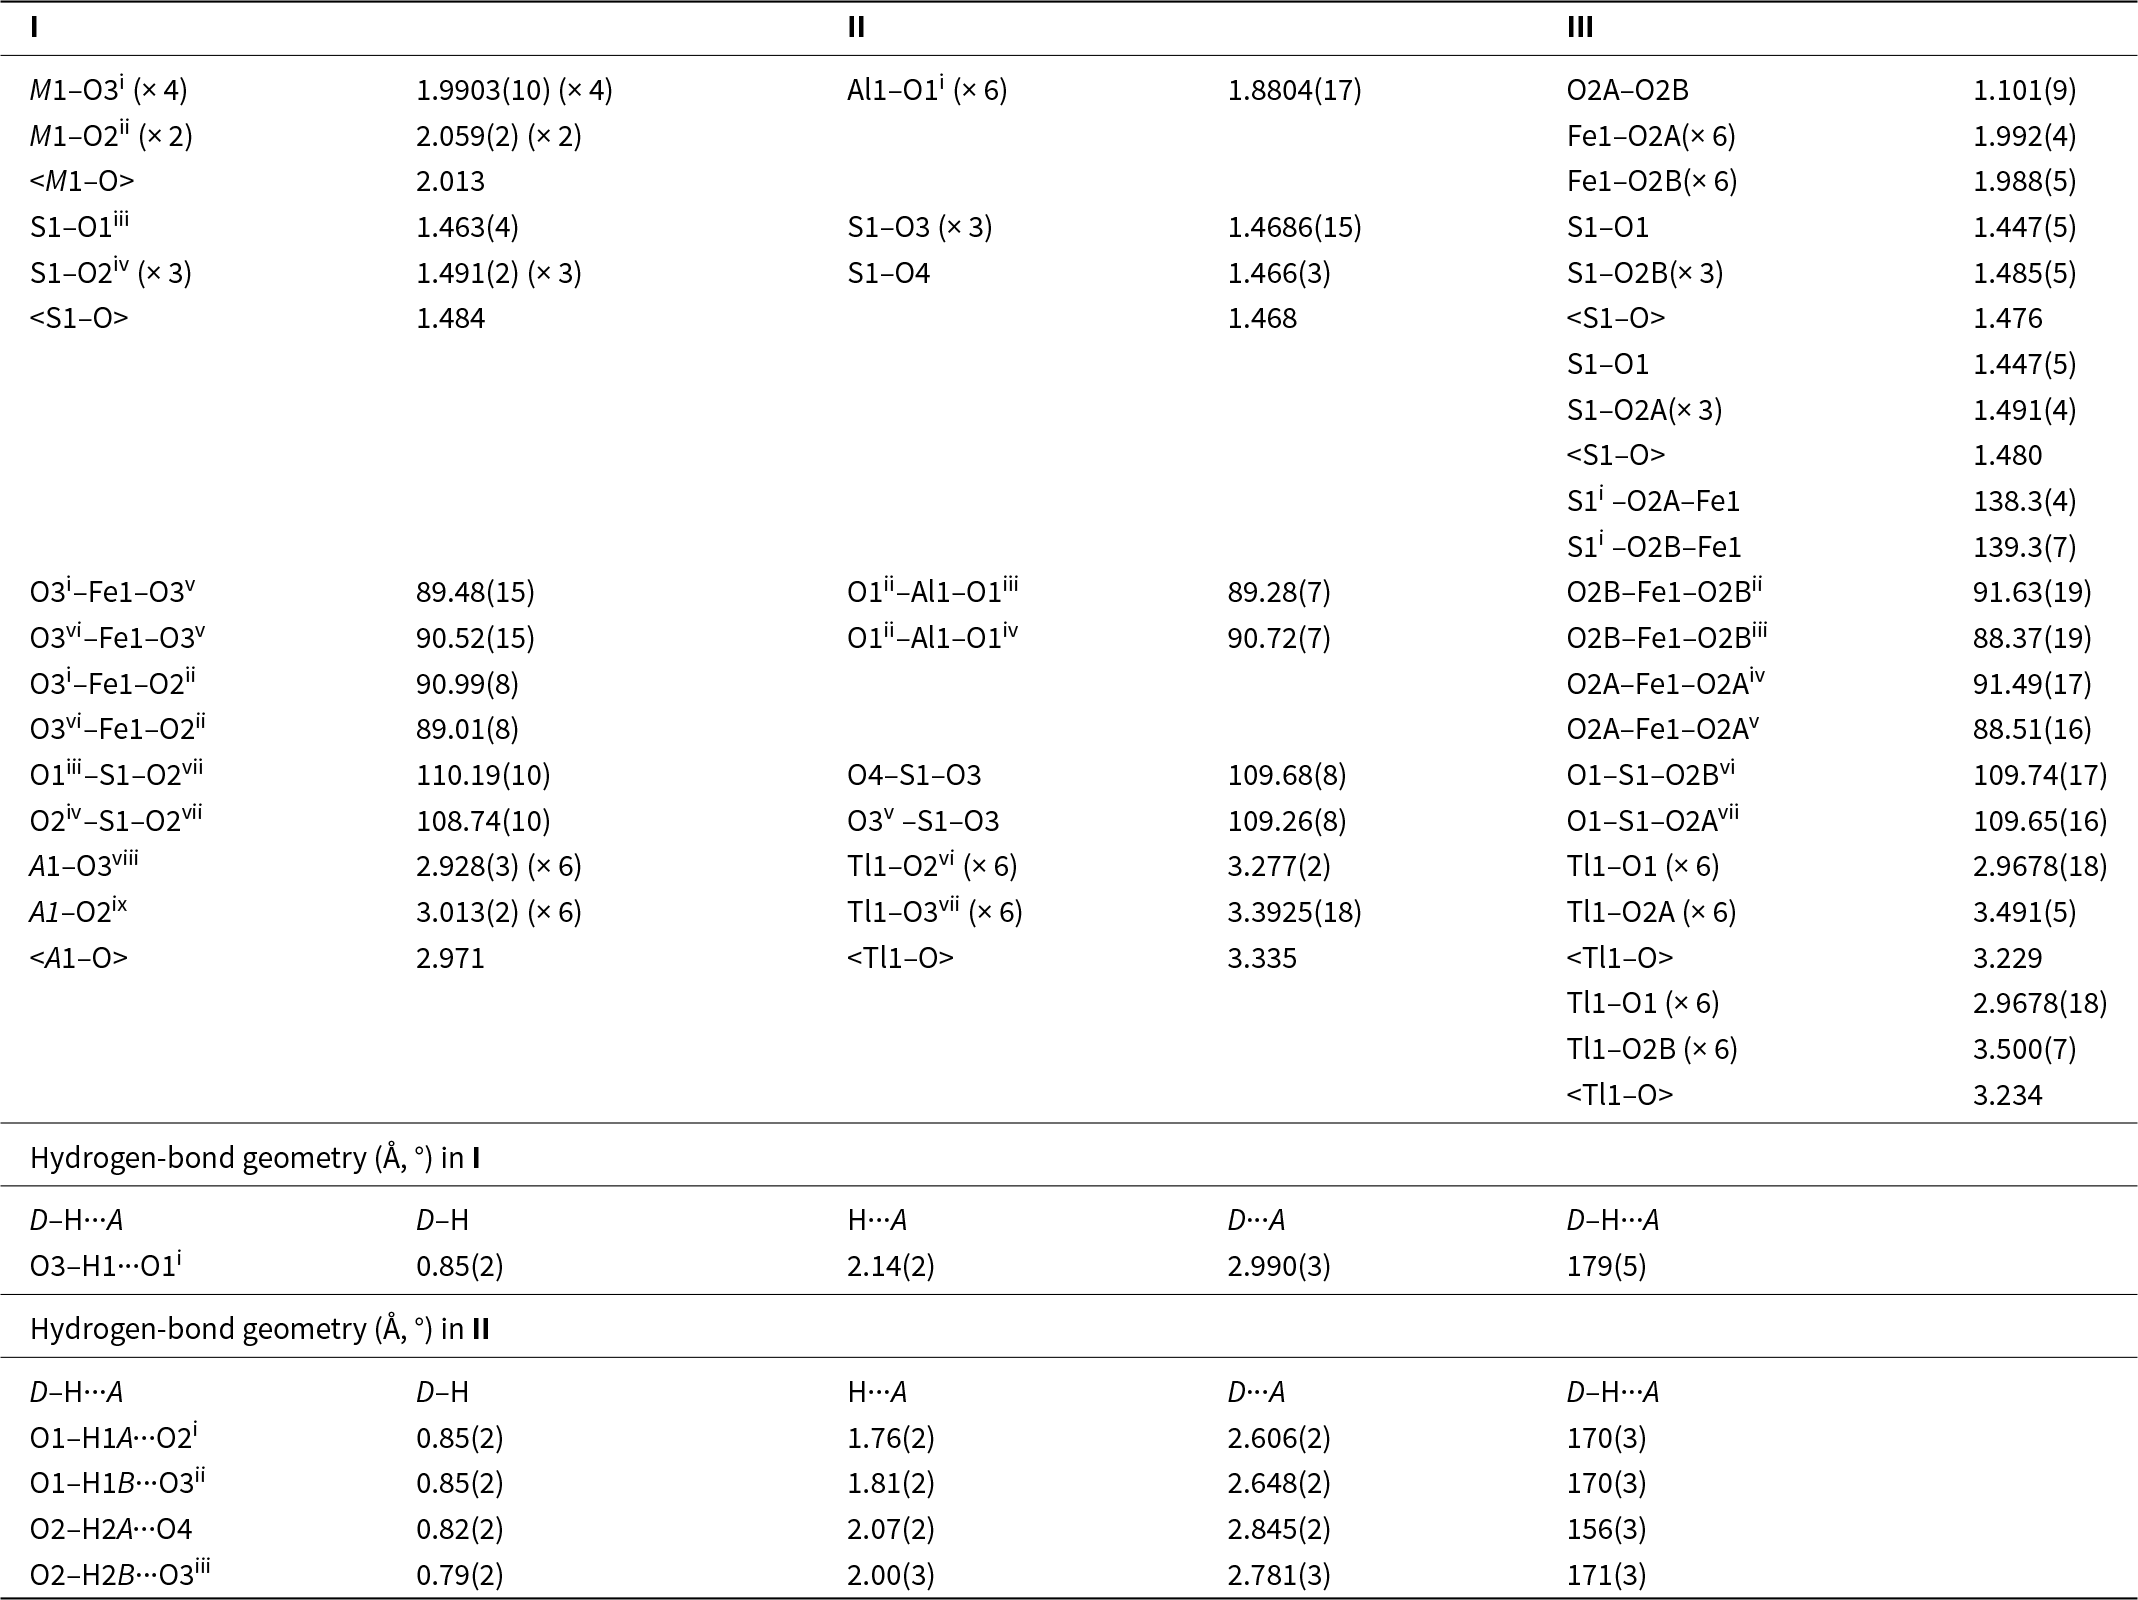
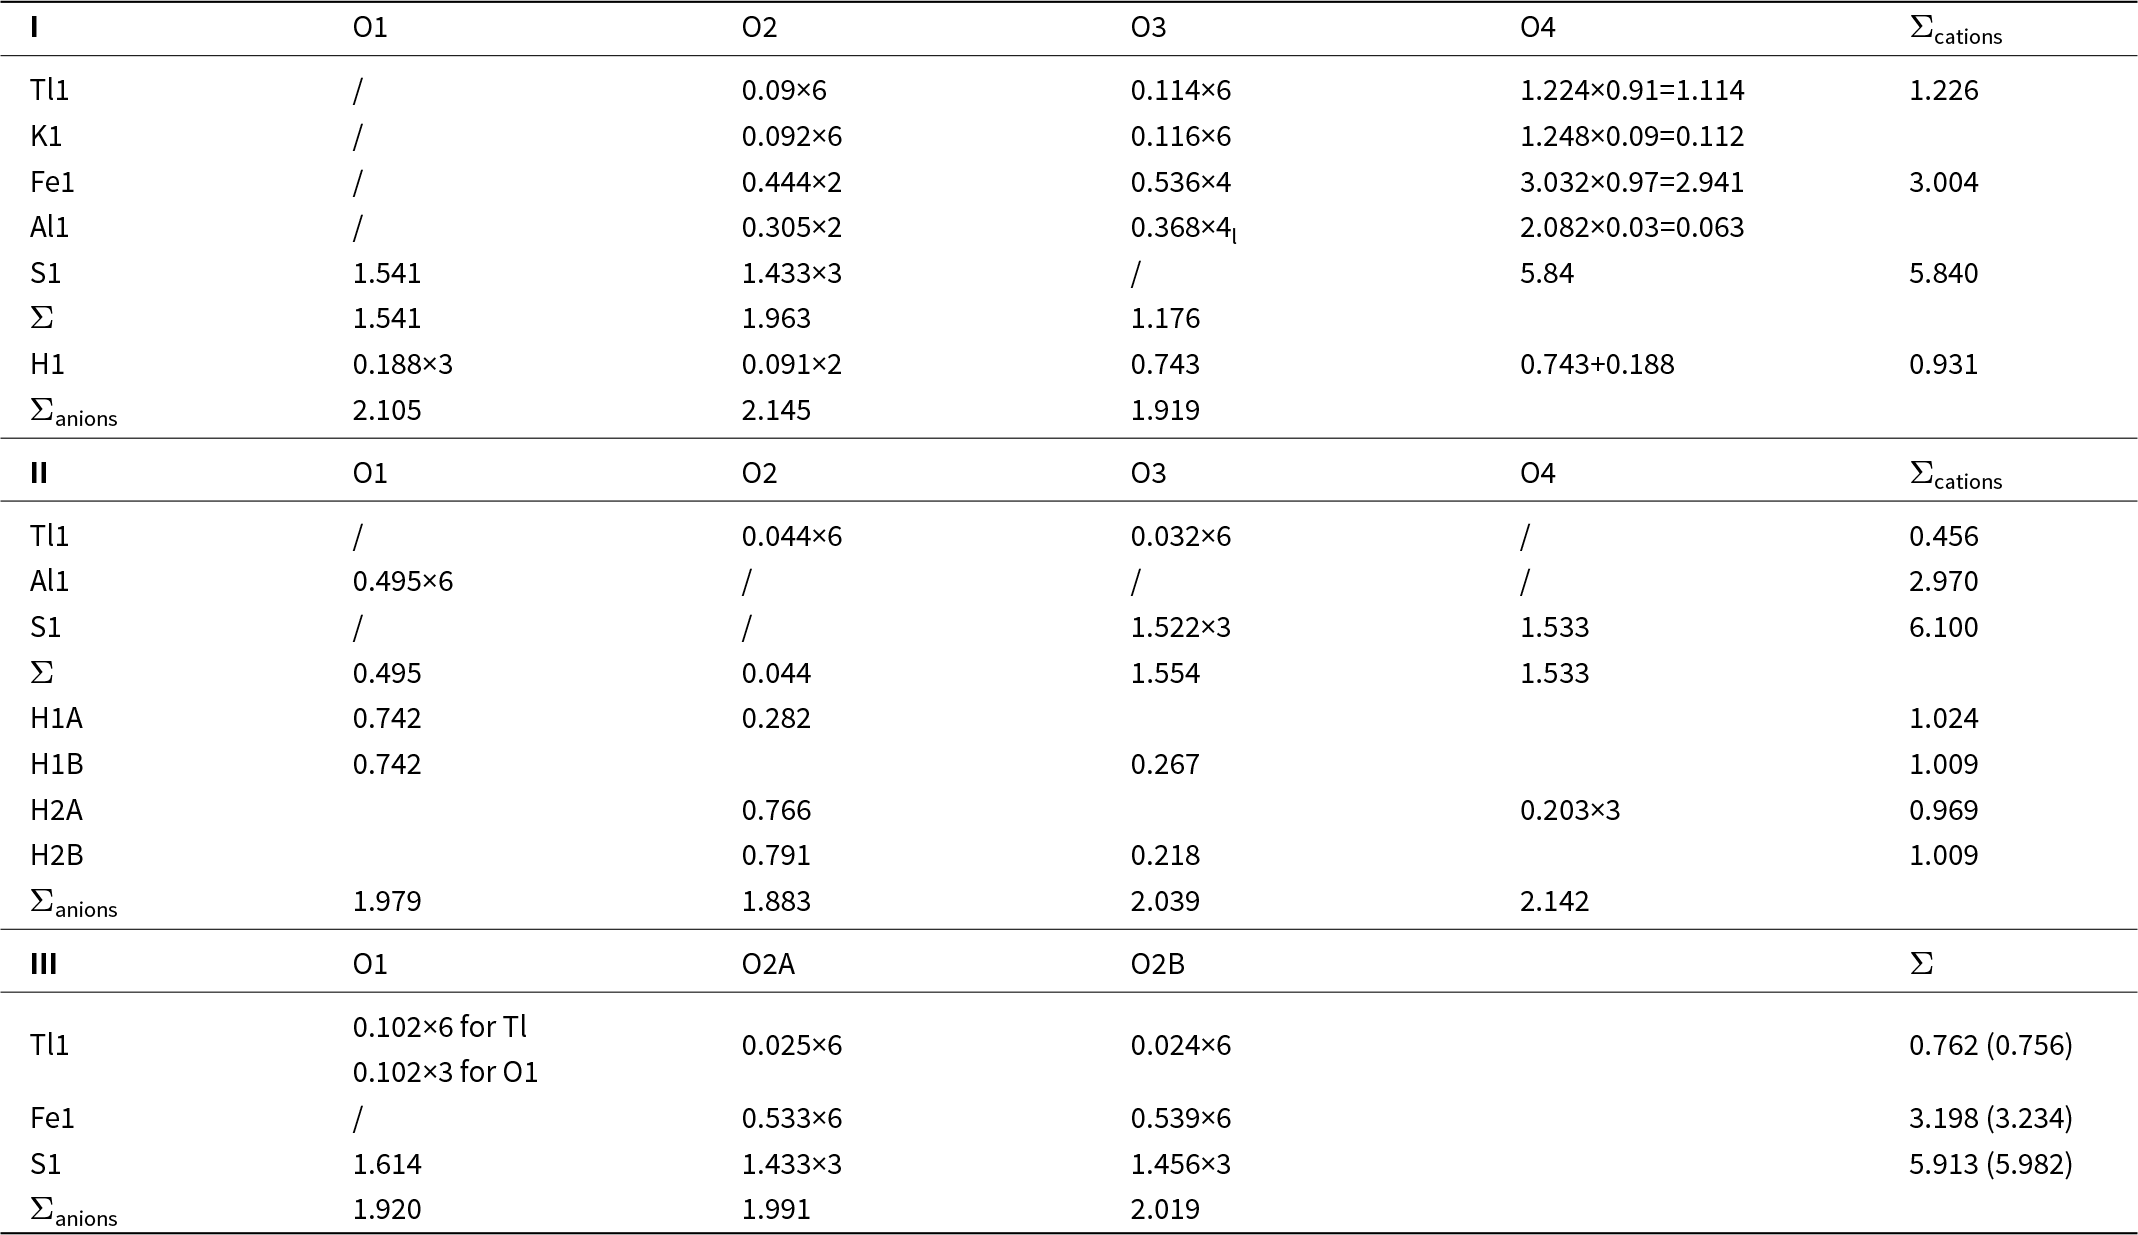
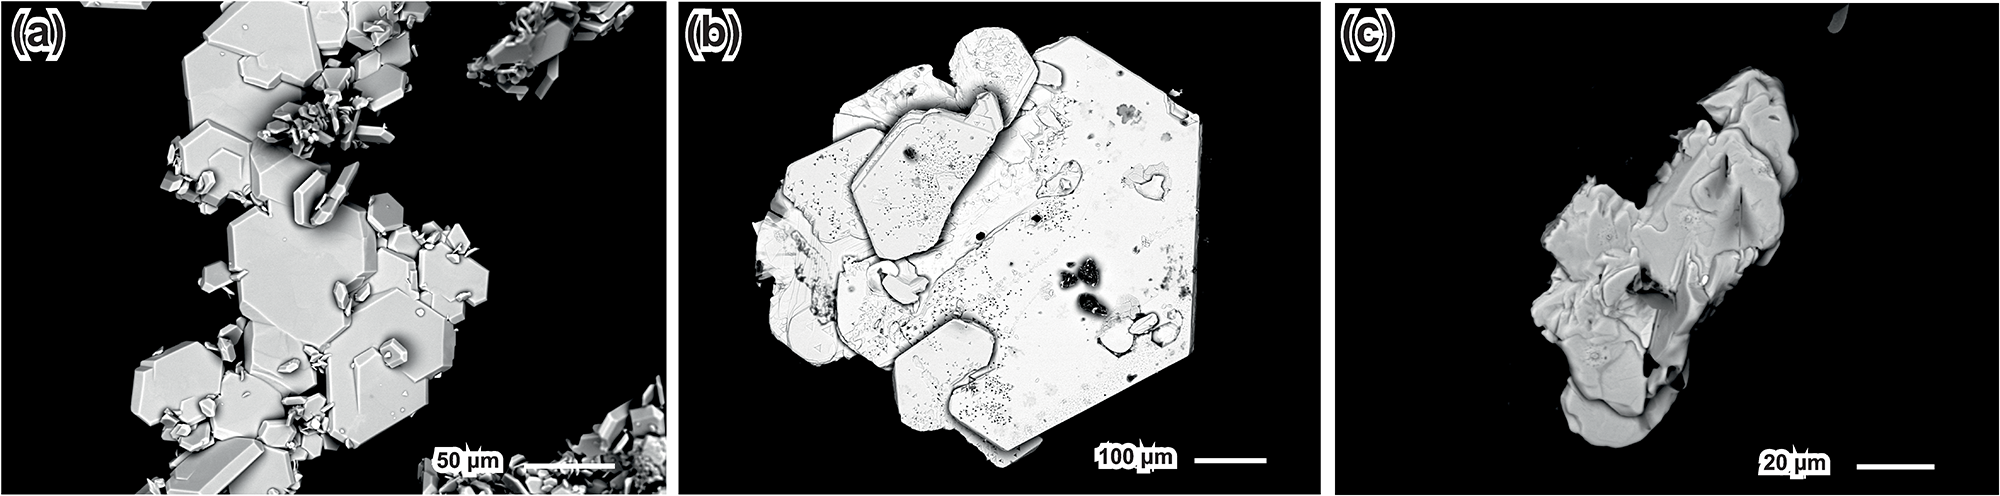
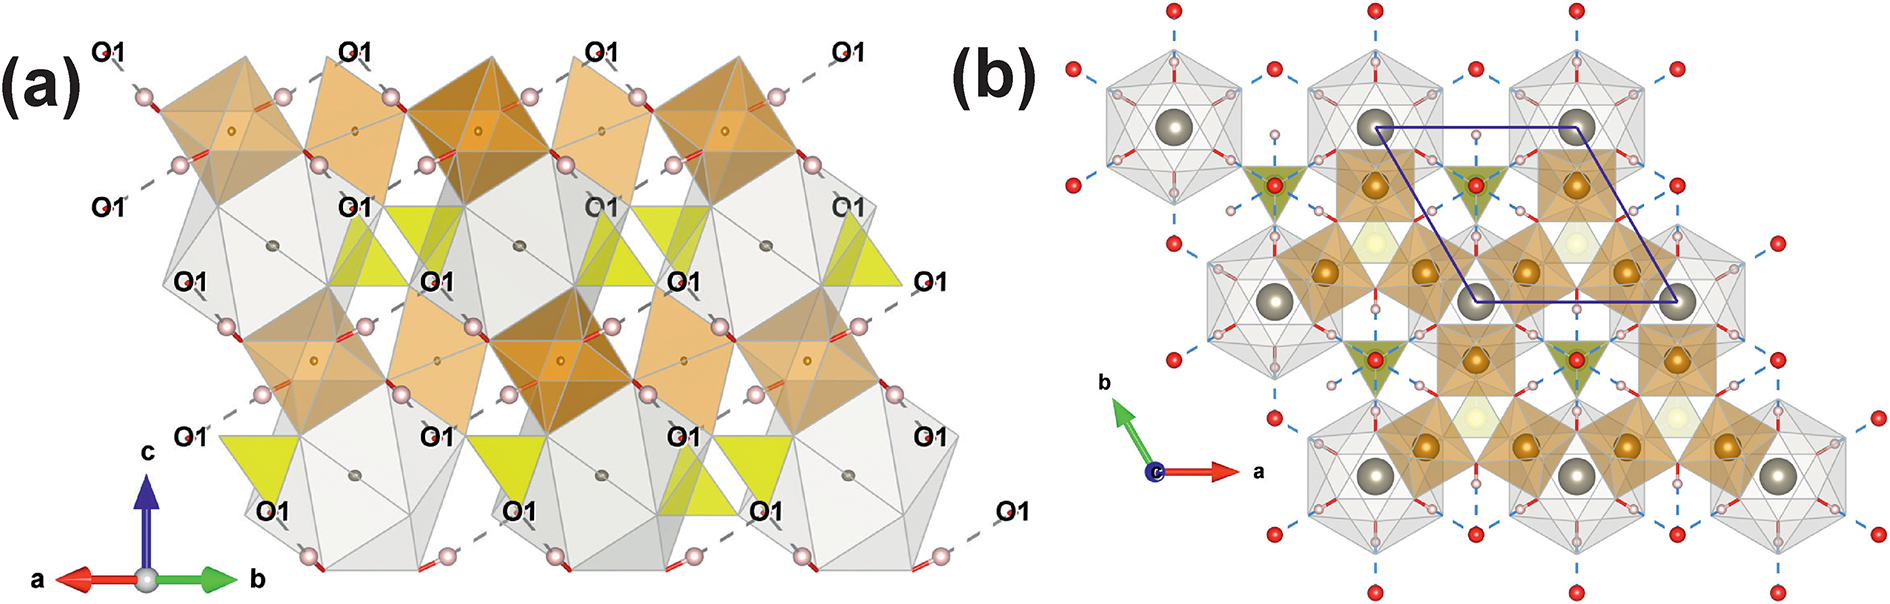

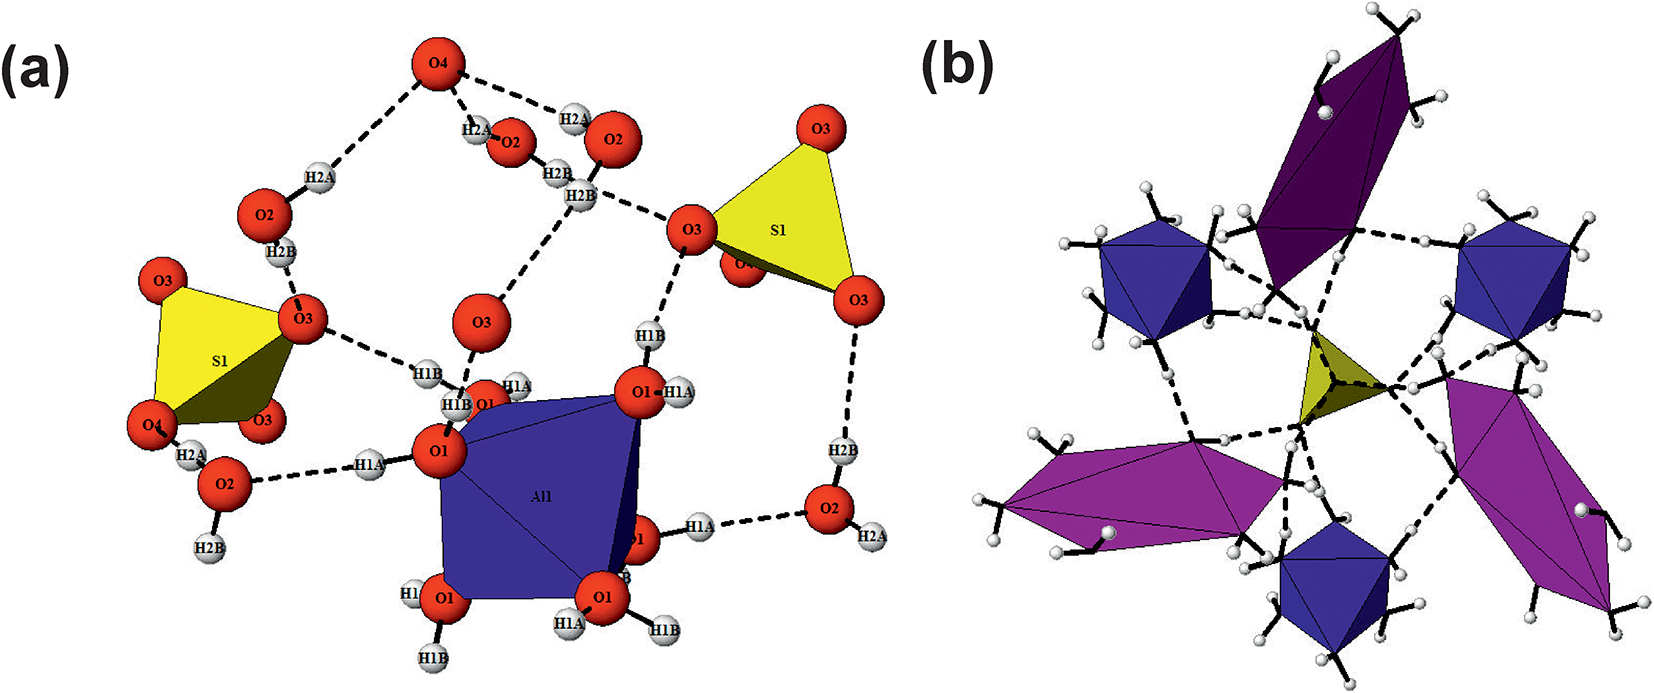
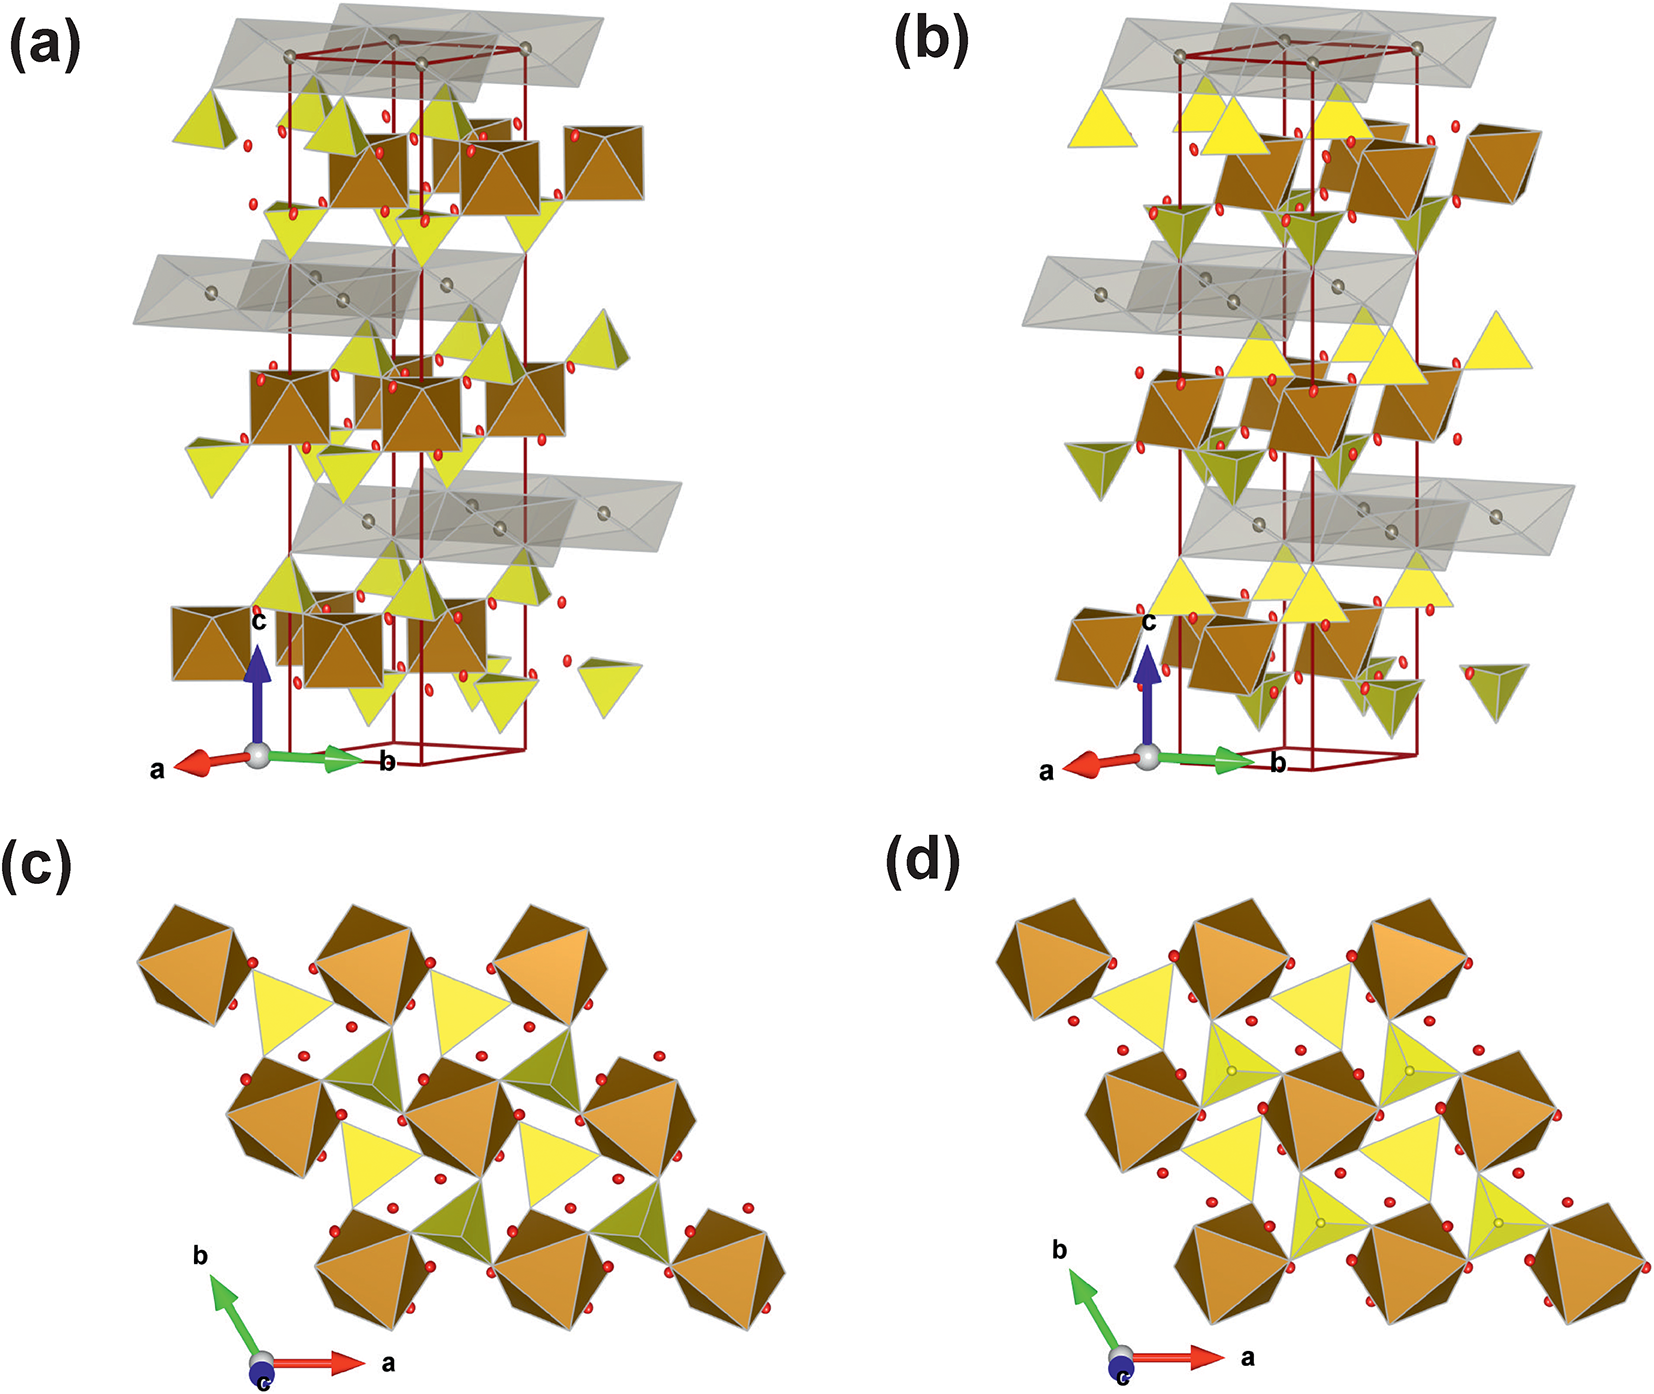
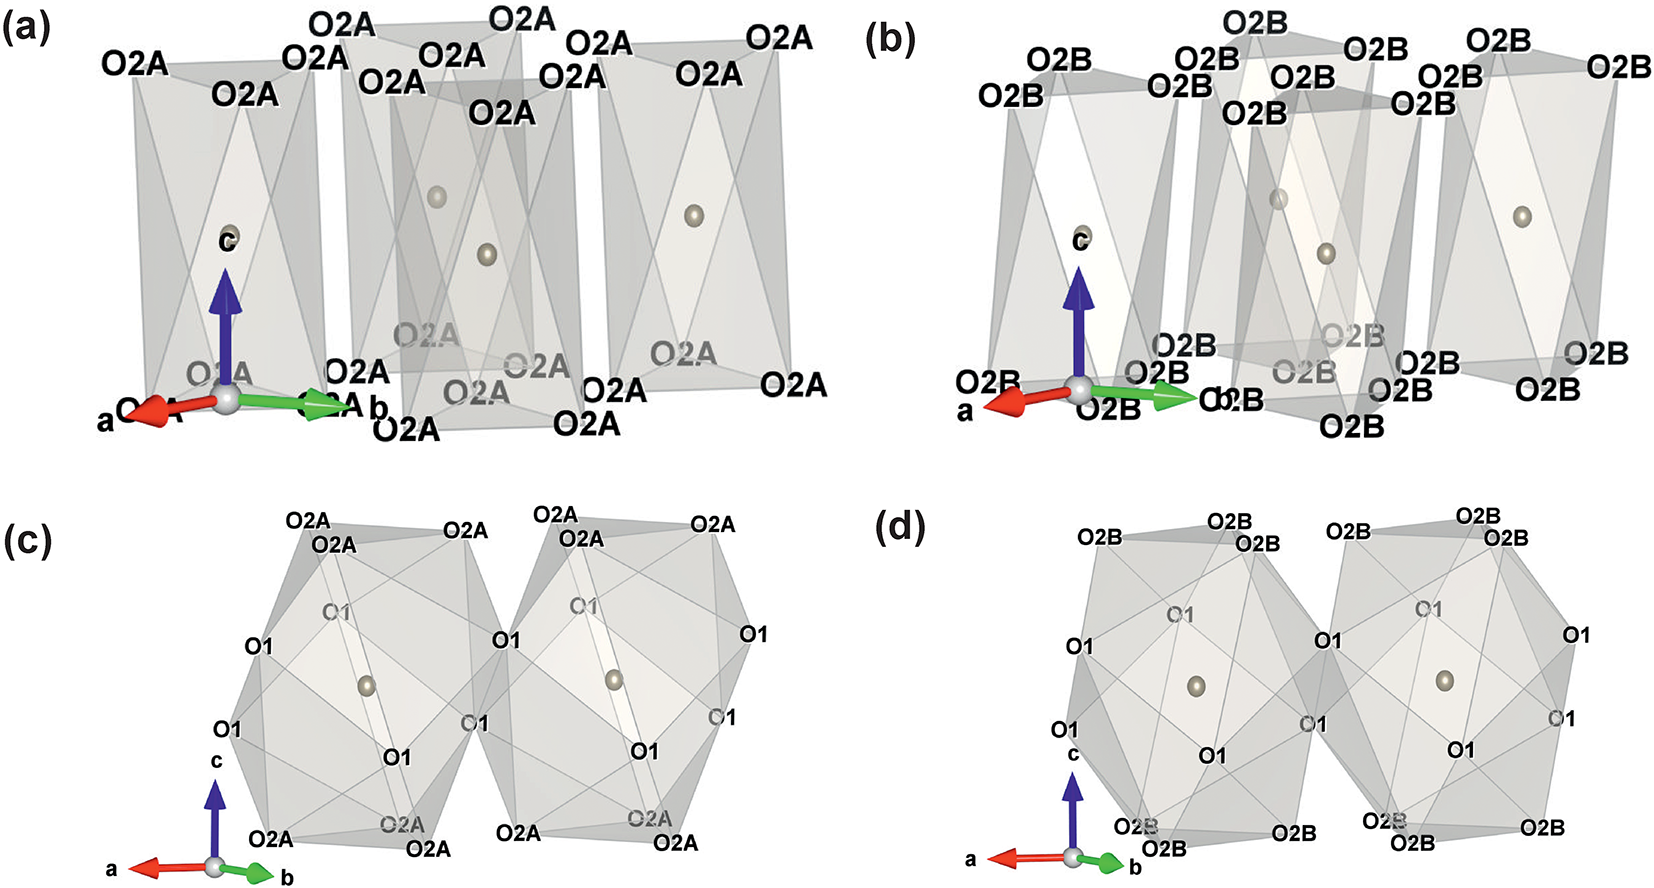
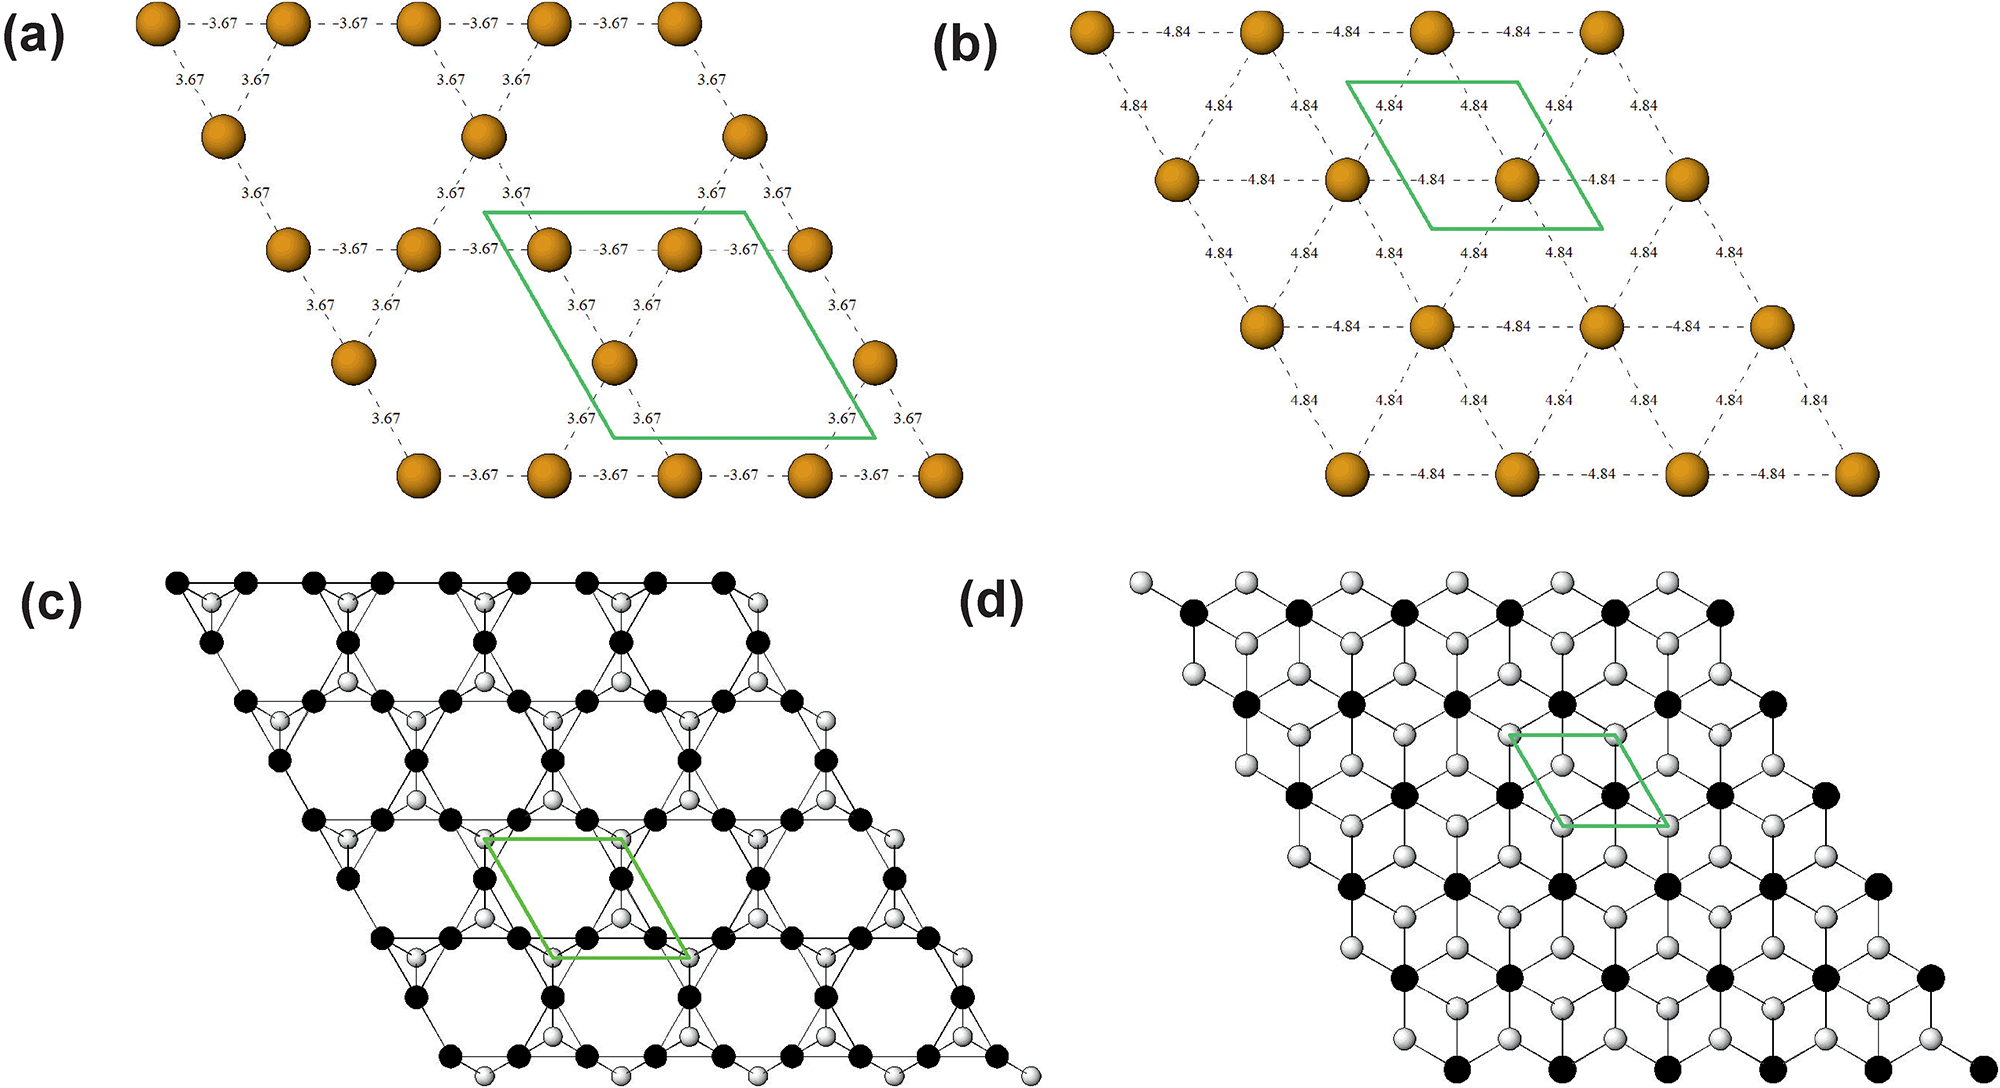
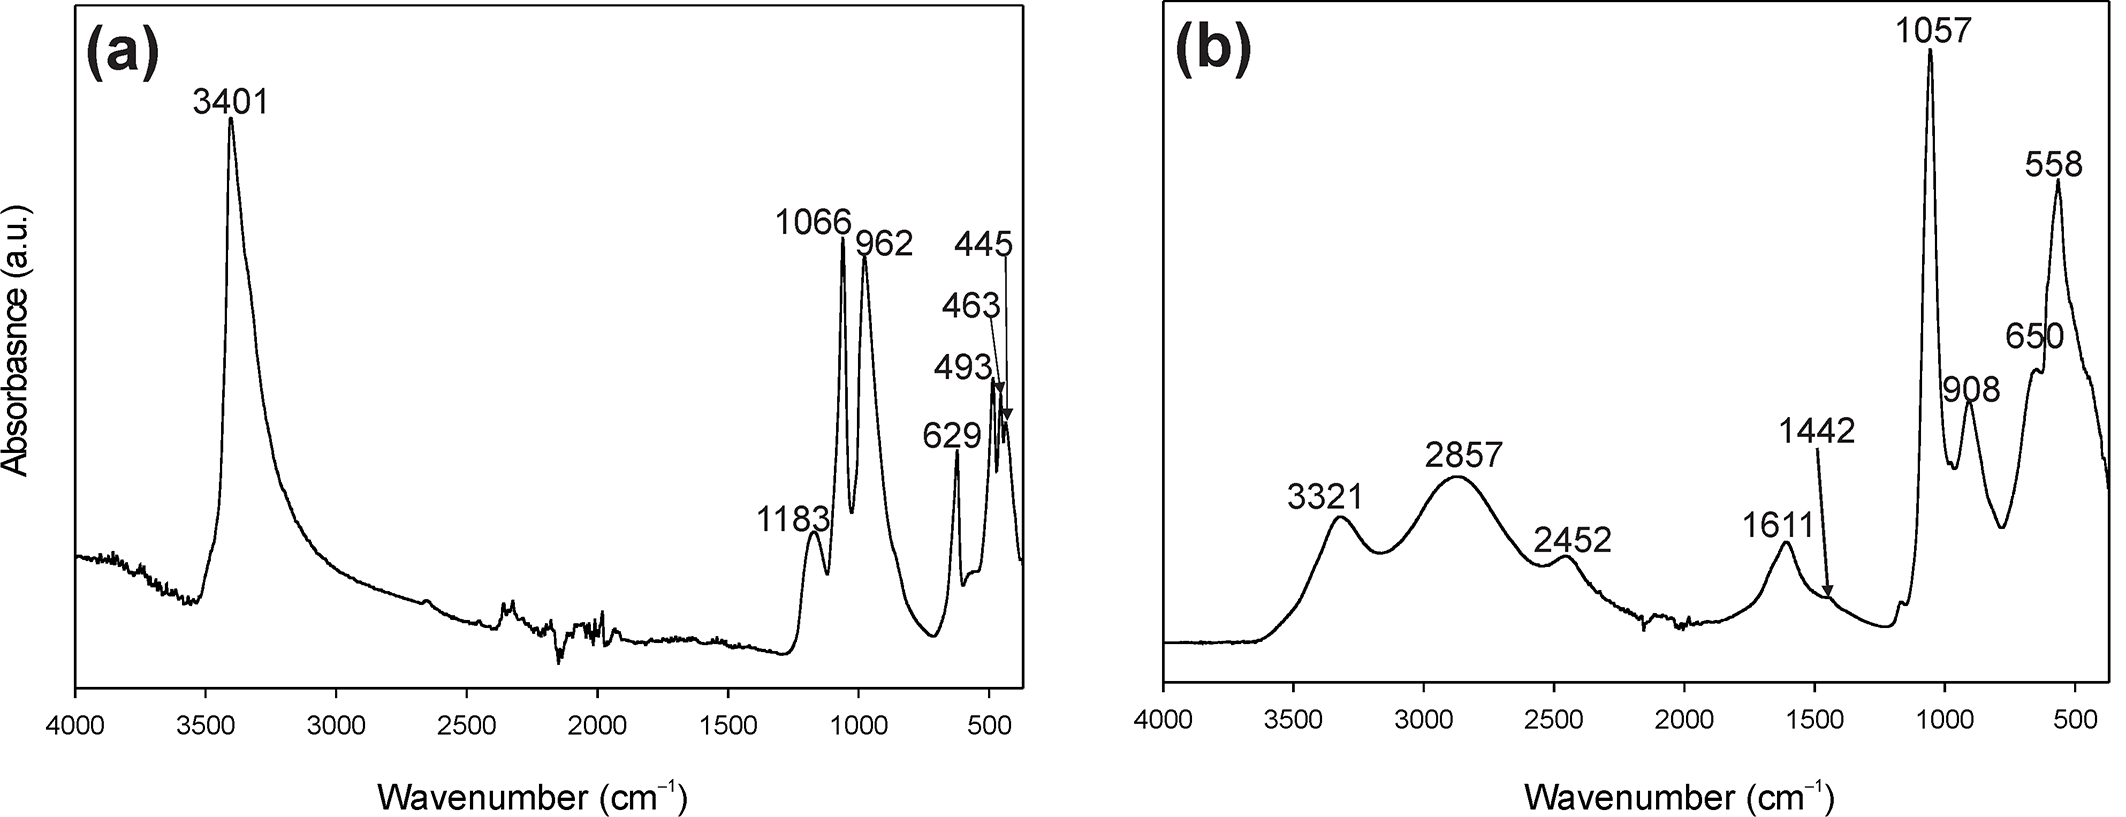
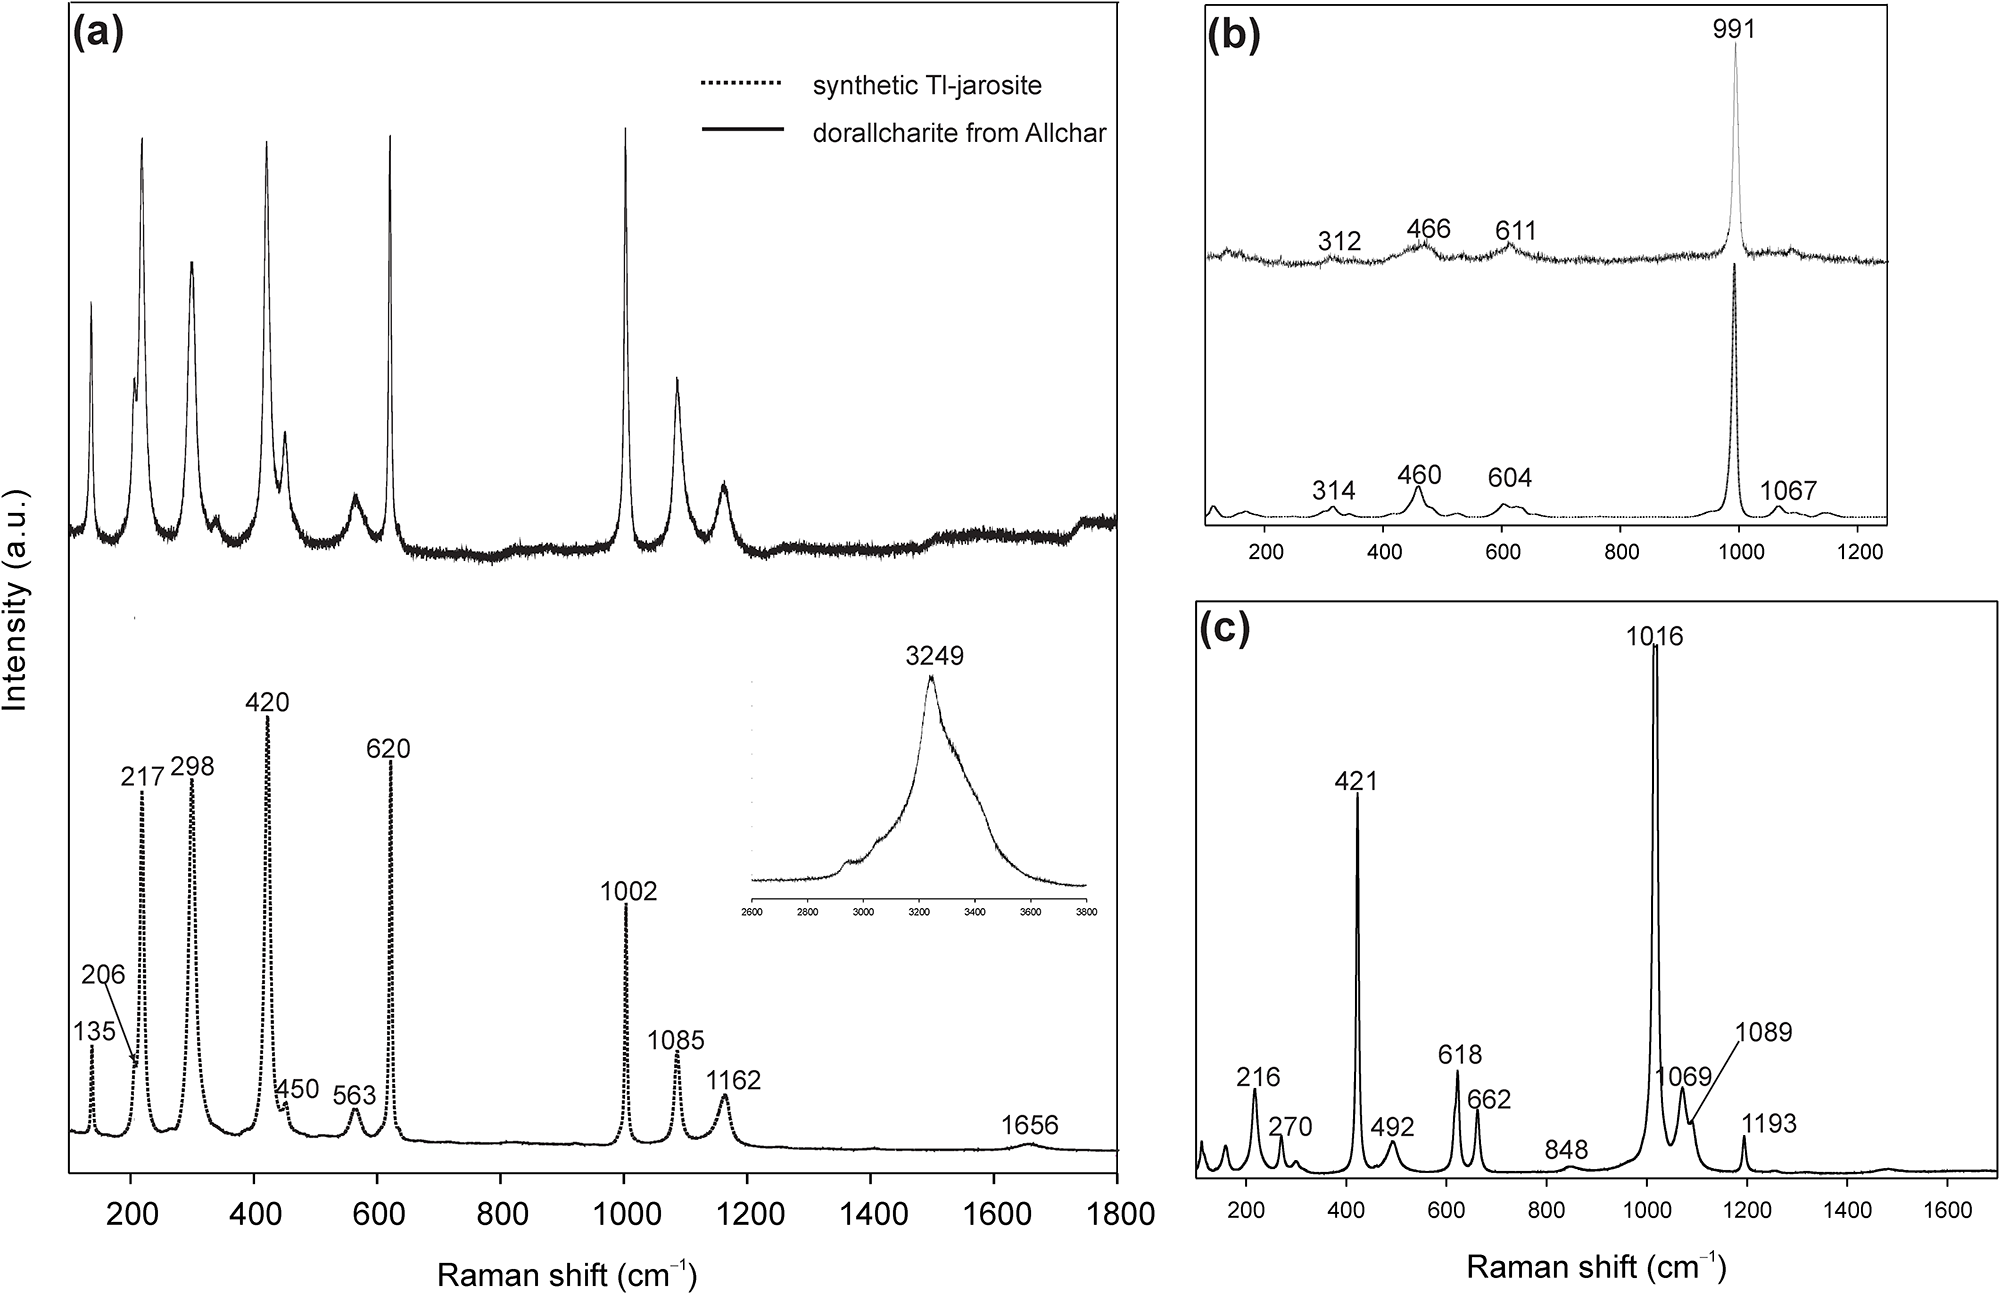
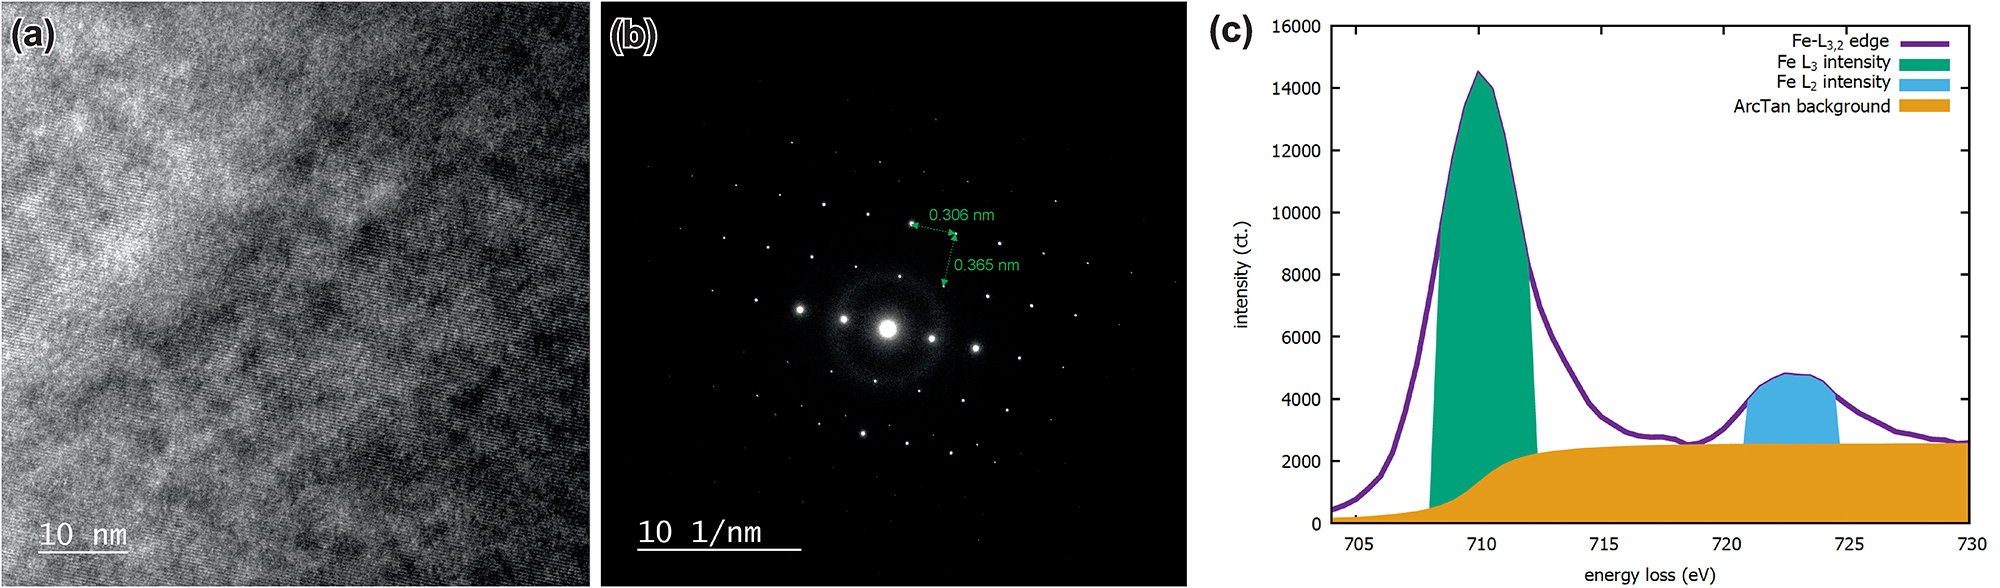
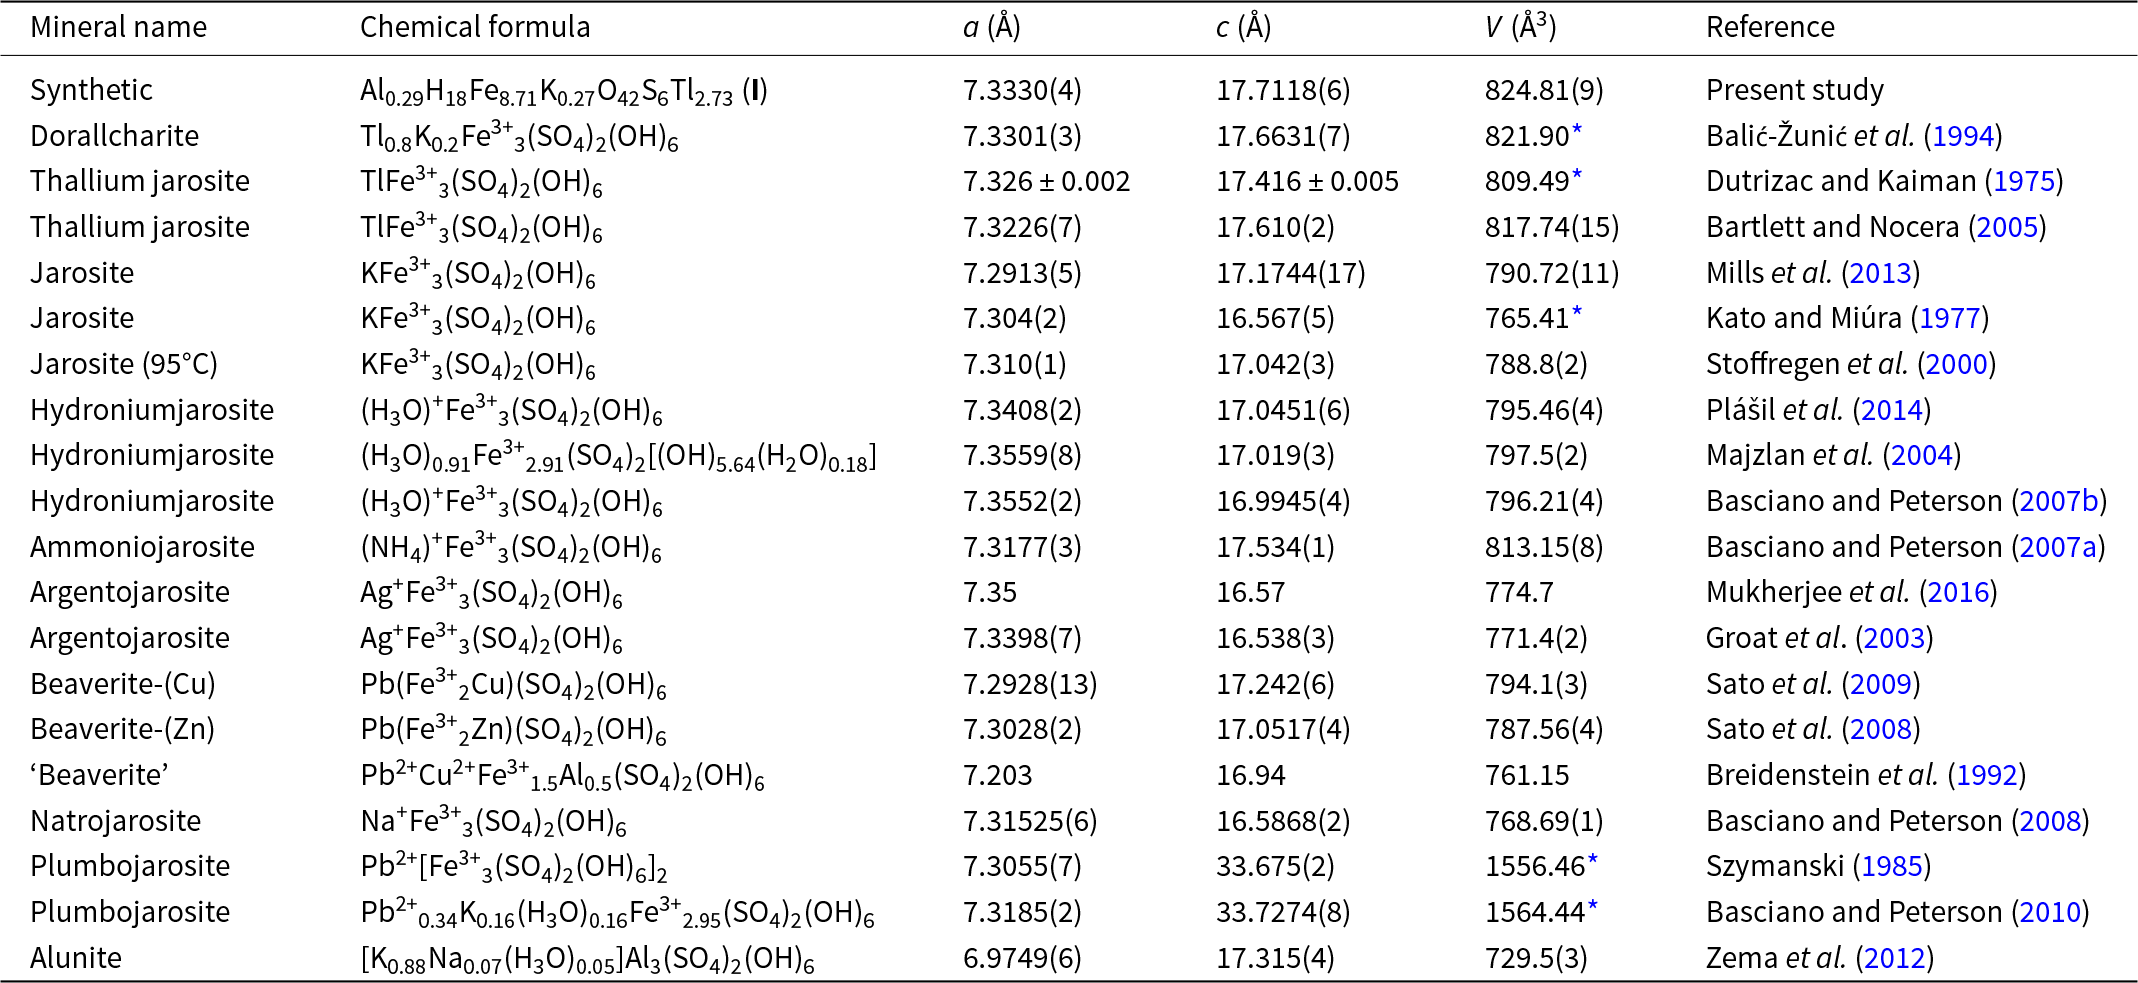
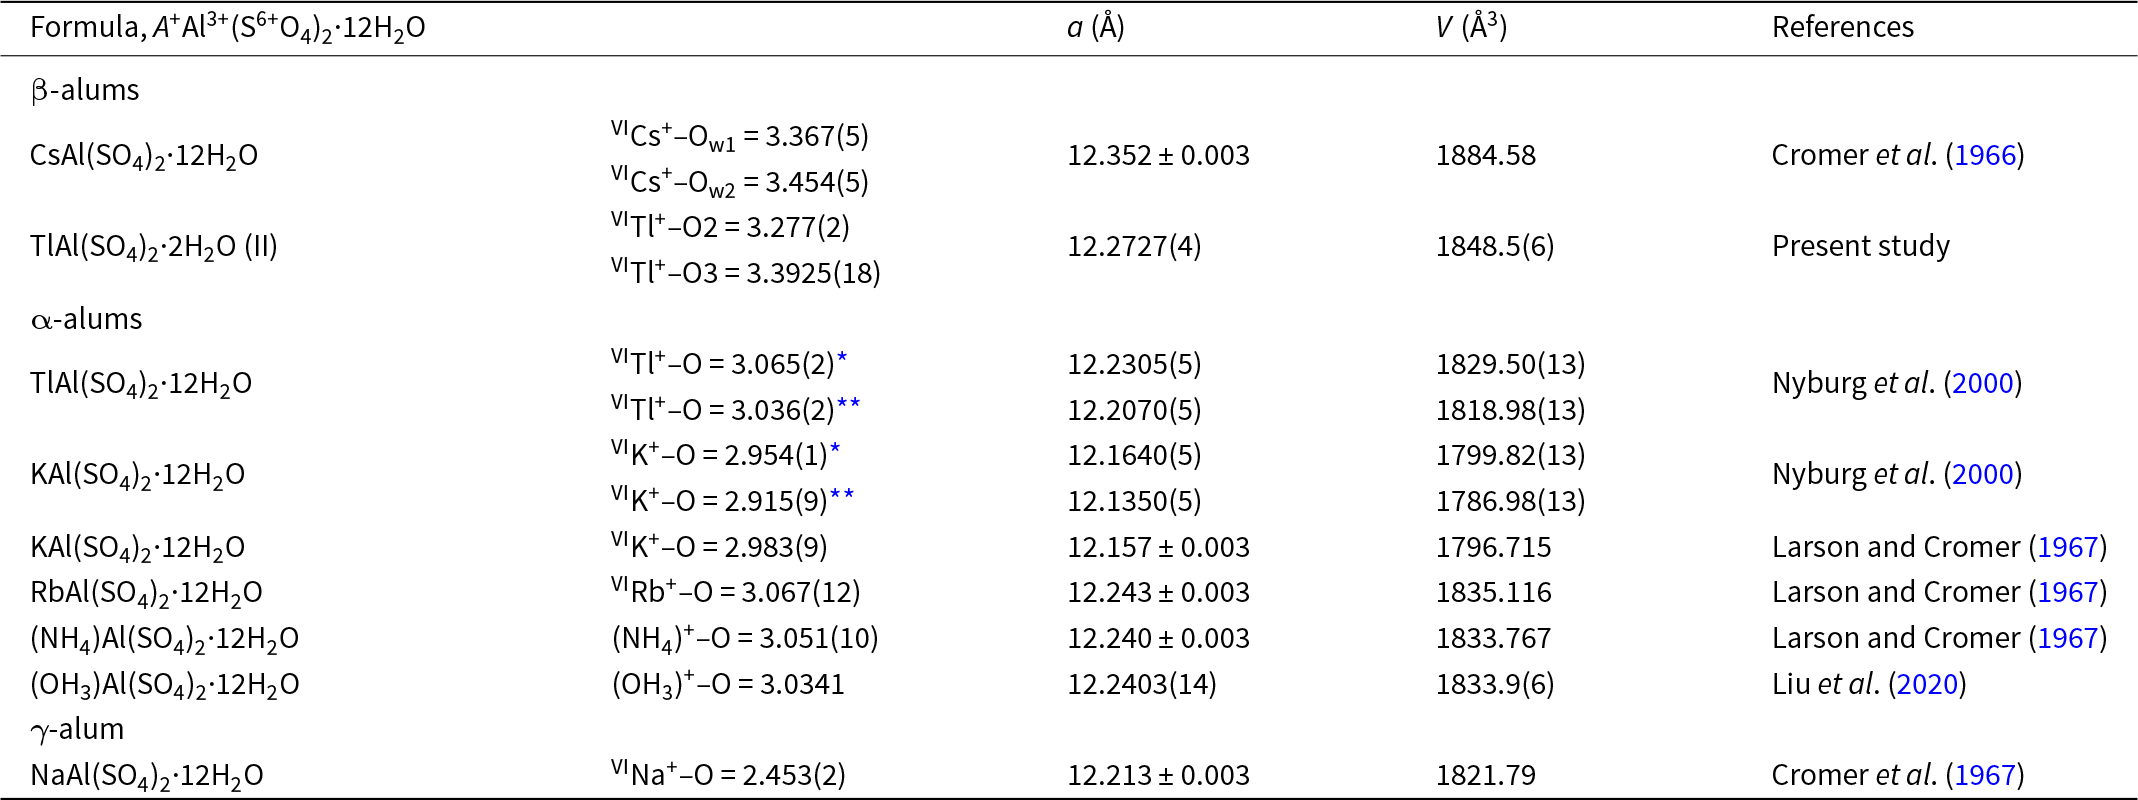

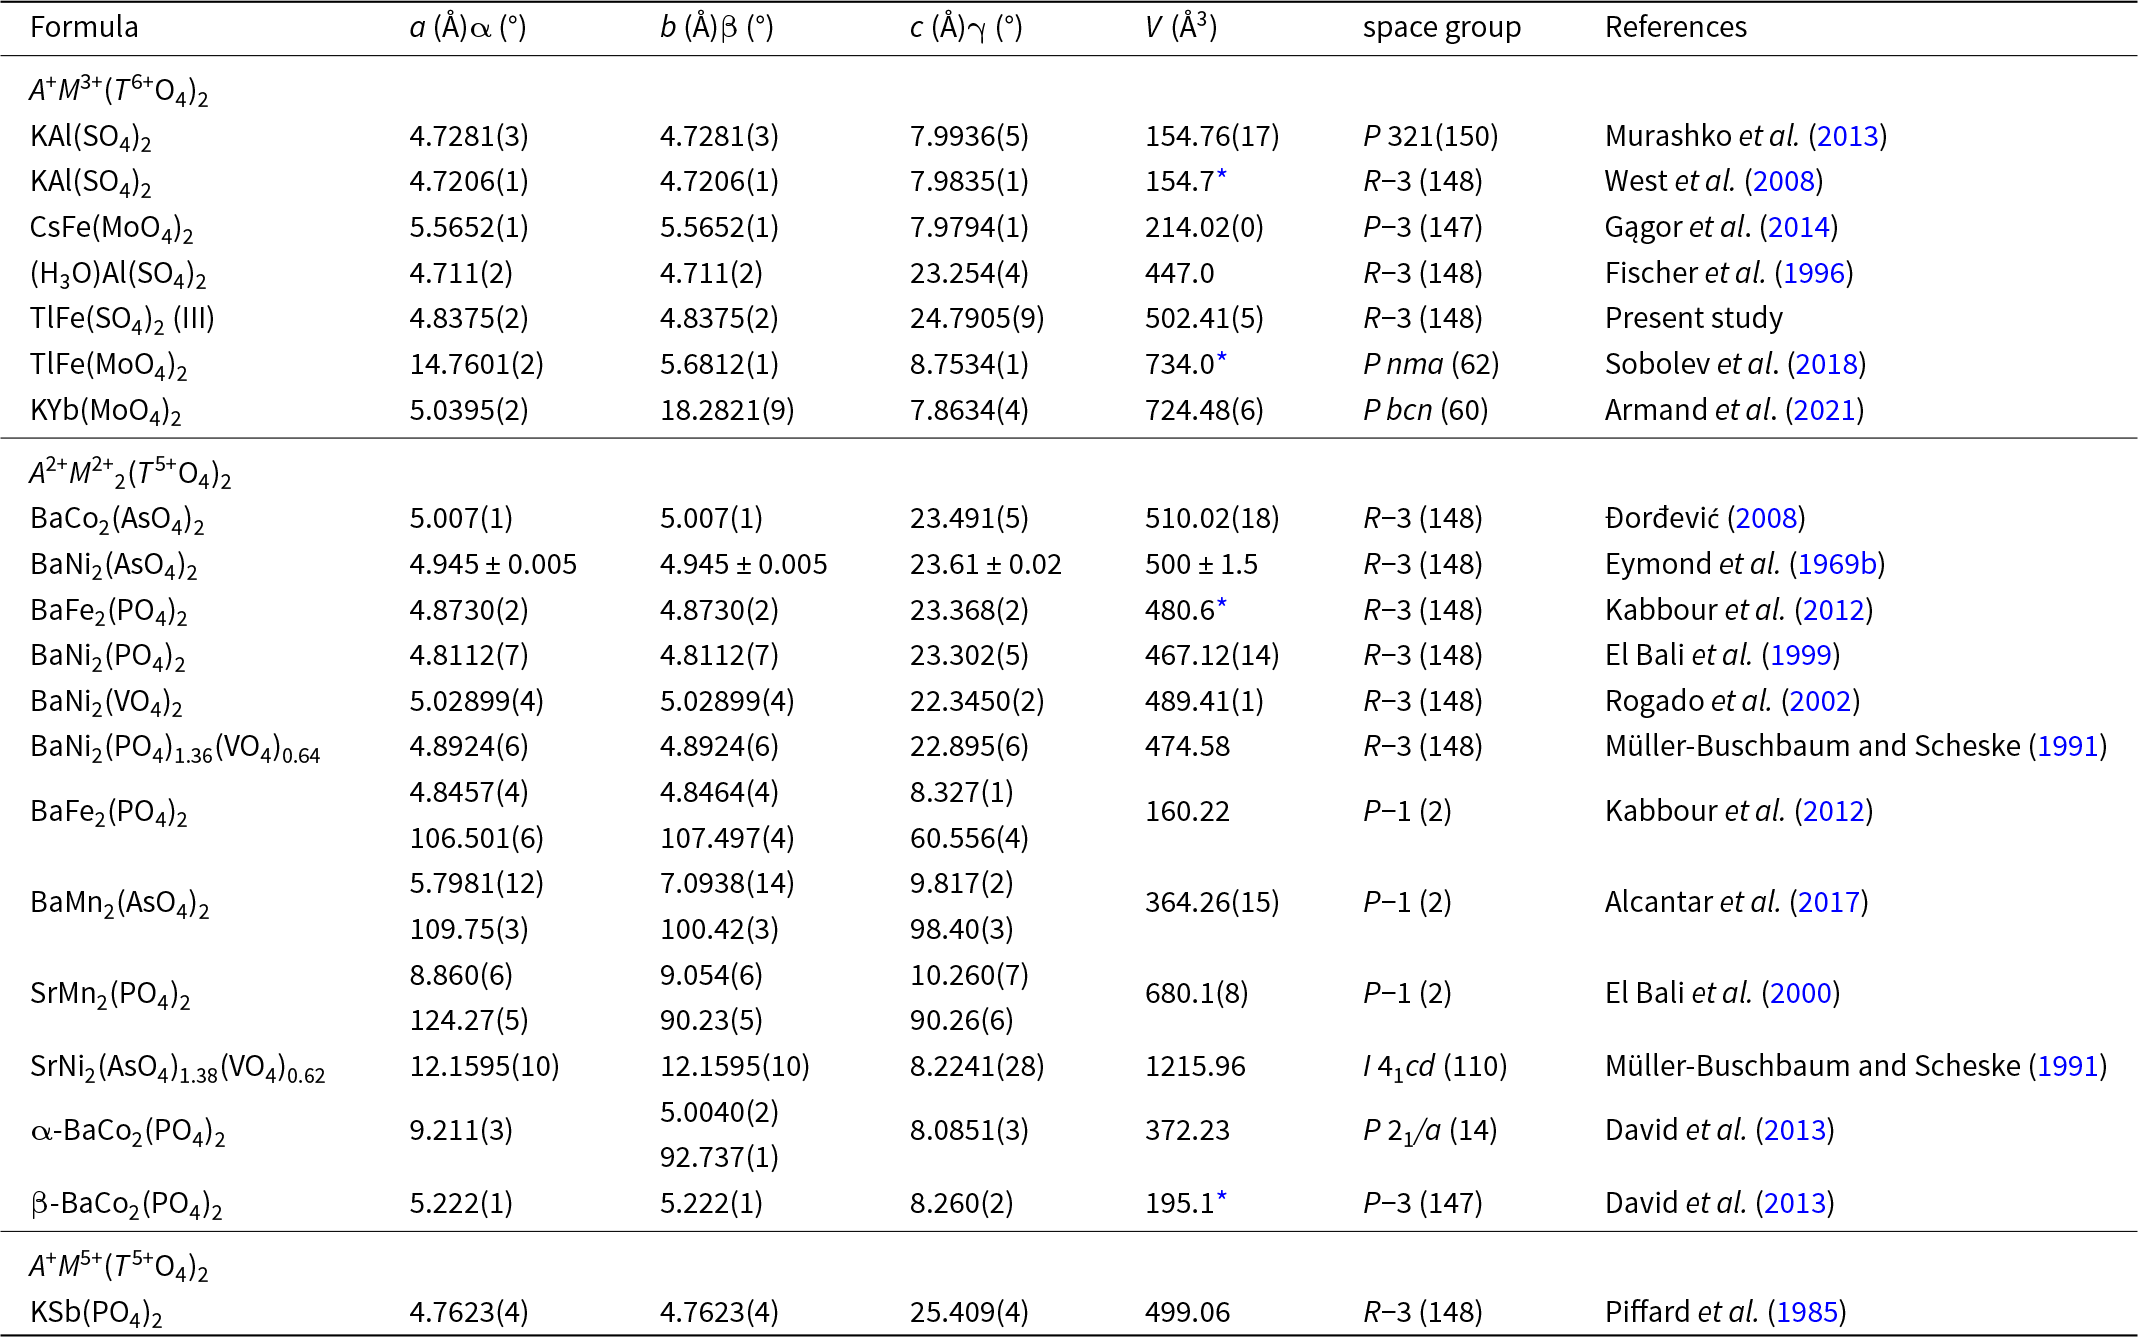


 Open access

